

Authoritarian regimes place the enhancement of national fertility at the heart of their political agenda, employing radical family policies to achieve this goal (Ginsborg Reference Ginsborg2000). Such practices are also characteristic of far-right political manifestos nowadays.Footnote 1 Their focus on increasing fertility stems from a desire to promote certain populations over others, especially those they consider pure or desirable. As a result, these policies encompass a wide range of measures, from incentivizing specific marriages to promoting a particular vision of women’s roles in society, all with a strong emphasis on encouraging higher birth rates. In this paper, we aim to deepen the understanding of these interventions by using Nazi Germany as a case study and its flagship family policy, the Law for the Encouragement of Marriage (LEM). Despite the extreme nature of its implementation, the LEM represents the standard-bearer of an authoritarian approach to family policy in Europe. This approach transcends borders and eras, serving as a cornerstone of Franco’s policies in Spain in the 1940s, but also of Viktor Orbán’s policies in Hungary today.
A central element of authoritarian and fascist pro-natalist family policies is the promotion of new family establishments through loans granted to newly married couples. These loans are pro-natalist in essence, as each birth entitles couples to a reduction in the amount to be repaid. In all the regimes concerned, this core element is complemented by a variety of generous child allowances and tax deductions.Footnote 2 The key point of our paper is to show that the social and political context in which these policies are implemented is crucial to their effectiveness. Specifically, we show that if regimes exert excessive economic and social pressure on young people to marry quickly, the resulting negative selection mechanisms in the marriage market may lower the overall quality of marriages and ultimately depress marital fertility rates. Using a difference-in-difference approach and Nazi Germany as an example to establish causal links, we demonstrate that this indirect effect can outweigh the direct positive impact of the policy and persist over time.
Like other fascist regimes, the Nazis exerted influence on every aspect of German life through indoctrination, propaganda, and a series of destructive policies. Notably, their family policy aimed to promote the “Aryan Volk”Footnote 3 stands out as one of the most distorting measures in the history of family policy. Promulgated in June 1933, the LEM granted an interest-free loan to newly married couples where the bride had worked for at least six months in the previous two years, on the condition that she gave up her job upon marriage. The loan was up to 1,000 Reichsmark (hereafter RM), and its repayment was reduced by a quarter for each birth. This policy, which applied to marriages celebrated after its promulgation, was complemented by substantial tax cuts and child allowances, especially for large families. We describe this policy in detail in the historical context.
Using census data from 1970, we employ difference-in-differences estimations to compare married women who lived in the Third Reich (treatment group) with married women who lived outside the Reich (control group), primarily in Czechoslovakia (including the Sudetenland) and neighboring eastern and southeastern countries such as Poland. This allows us to assess the impact of Nazi policies on German fertility.Footnote 4 Although living outside the Reich, most women in the control group were of German descent. Our treatment variable stems from marriage dates; if a woman married before the Nazi regime, she is considered as untreated, while she is considered as treated if she married under the Nazi administration. To fully capture the impact of Nazism on marital fertility, we measure our outcome variable—women’s fertility—at different points in time. This allows us to distinguish short- and long-run effects, as well as to separate the impact of policies targeting newly married women from those affecting the entire female population.
As a first step, we aim to identify the compounded effect of the Nazi regime’s seizure of power, along with its full set of policies, propaganda, and social pressures, on short-run fertility. To do so, we measure fertility in 1933 for women who married between 1928 and 1932 and in 1938 for those who married between 1933 and 1937. The earlier cohorts (1928–1932) were entirely unaffected by the Nazi regime at the time of measurement (Ti = 0), whereas the later cohorts (1933–1937) had been fully exposed to the regime’s pro-natalist policies by 1938 (Ti = 1).
By controlling for the number of years since marriage, we compare the fertility of women who were not affected by the Nazi regime—particularly its marriage policies (untreated group in 1933)—with those who received the full set of incentives promoting marriage and childbirth (treated group in 1938), while holding exposure to pregnancy risk constant. We find a positive association between overall exposure to Nazism and fertility.
In a second exercise, we focus on policies targeting young single women, as implemented by the LEM. To assess the short-run impact of these policies on fertility, we rely on the same specification with the same definition of our treatment but measure fertility of all women in 1938. It allows us once again to compare the fertility difference between women who married before the Nazi regime (Ti = 0) and during the Nazi regime (Ti = 1). Because fertility is now measured in 1938, we compare women who were fully treated by the Nazi regime (Ti = 1) to women who were only partially treated (Ti = 0). Indeed, in this configuration, both groups were exposed to Nazi ideology and certain welfare policies. However, they experienced different marriage policies, as programs like the LEM were reserved for individuals who were unmarried by 1933 (treated group). More generally, the Ti = 0 group was not subjected to Nazi pressure to marry quickly. Surprisingly, we find a negative effect of the Nazi family policies. This suggests that, rather than increasing birth rates, these policies actually depressed marital fertility.
In a third exercise, we extend our approach to the long run by measuring the impact on completed fertility. We replicate the previous analysis but measure fertility in 1970, the year in which the Census data were collected. Our findings indicate that the negative effect persisted until 1970, by which point all women in our sample had completed their fertility years.Footnote 5 For the remainder of the paper, we focus on this key result and its implications.
To better understand our empirical results, we develop a theoretical model of fertility and marriage, building on Chiappori (Reference Chiappori1988) while incorporating key features of Nazi family policies. The model generates a set of predictions, which we test through three auxiliary regressions.
First, if the LEM and, more broadly, policies targeting young active single women drove the negative effect we document, we should observe a decline in fertility among the affected women. To test this, we extend our main estimation model to a triple-difference approach, accounting for whether women were eligible for the LEM. Our results confirm that the long-run negative effect of Nazism on fertility was driven by women eligible for the loan. While this finding does not necessarily imply a direct negative impact of the LEM on fertility, it aligns with Pine’s (Reference Pine1996) argument that the loan was insufficient to significantly boost birth rates among German women. Moreover, it suggests that within the treated population, Nazi family policies had strong counterproductive effects that ultimately outweighed the incentives to have more children.
Our model suggests that these counterproductive effects stem from negative selection in the marriage market, where women were incentivized to marry quickly, often at the cost of choosing lower-quality spouses. Using descriptive statistics, we show that the probability of marriage increased and shifted toward younger women within the German Empire, whereas no such shifts are observed outside the Empire. Using our triple-difference approach, we show that this redistribution of marriages to younger ages during the Nazi period was primarily driven by women eligible for the loan. This indicates that Nazi family policy effectively increased early marriages, pushing young women out of the labor market and into the family sphere.
In a final regression, we use divorce as an extreme indicator of marital frailty, comparing the probability of divorce between women who married under the Nazi regime and those who married before it. Since the impact of the policy we study operates through changes in the age at marriage, we examine whether women who married young under the Nazi regime were more likely to divorce later, after the regime had ended. Our findings support our theory that Nazi family policies depressed fertility among newlywed German women by promoting negative selection into earlier and more fragile marriages. Importantly, this effect of marrying young during the Nazi era is observed only among women eligible for the LEM and not among their non-eligible counterparts within the German Empire.
We contribute to three strands of literature: the study of authoritarian regimes’ approaches to the family, the effects of family policies on fertility in general, and the consequences of Nazism in particular. Throughout European history, authoritarian regimes and extreme right-wing parties have emphasized marriage for national couples to increase fertility. We are the first to examine the causal impact of such policies on fertility.Footnote 6 Other extreme policies have been implemented with the objective of reducing fertility rather than increasing it. The most famous one is probably the one-child policy implemented in China between 1979 and 2015. In their literature review, Zhang (Reference Zhang2017) notes that while the one-child policy may have accelerated fertility decline in the early 1980s, China’s rapid economic growth and social change were likely the key drivers of the sustained low fertility observed in the long run.
Another important set of extreme policies distorting fertility behavior concerns eugenic sterilization. This type of policy, which targeted individuals deemed unworthy of reproduction, was implemented by the Nazi government itself, in addition to the policies we examine in this paper. As shown by Reilly (Reference Reilly2015), eugenic sterilization was far from being limited to the Nazi regime; it was implemented in China, Scandinavia (1930s), Japan (1948), and the United States. In the case of the United States, eugenic sterilization laws targeted the mentally handicapped. Between 1907 and 1939, some 30 states enacted such laws. During this period, Reilly (Reference Reilly2015) estimates that around 60,000 mentally ill people were sterilized without choice.
The study of family policies covers a wide range of reforms and instruments, including direct cash transfers (e.g., Milligan (Reference Milligan2005) for Quebec; Cohen, Dehejia, and Romanov (Reference Cohen, Dehejia and Romanov2013) for Israel; González (Reference González2013) for Spain; and Riphahn and Wiynck (Reference Riphahn and Wiynck2017) for Germany), child-related tax allowances (e.g., Moffitt (Reference Moffitt1998); Rosenzweig (Reference Rosenzweig1999); Baughman and Dickert-Conlin (Reference Baughman and Dickert-Conlin2003, Reference Baughman and Dickert-Conlin2009); Kearney (Reference Kearney2004); Brewer, Ratcliffe, and Smith (Reference Brewer, Ratcliffe and Smith2012); Reference Egger and RadulescuEgger and Radulescu (2012)), or parental leave benefits (see Olivetti and Petrongolo (Reference Olivetti and Petrongolo2017) for a review). This literature consistently shows positive effects of these policies, ranging from modest to substantial. We show that these positive effects can be partially and even completely reversed by negative selection into marriage, resulting in lower-quality unions.
A growing body of literature examines the origins and consequences of National Socialism. Voigtländer and Voth (Reference Voigtländer and Voth2012) study the roots of the persecution of Jews across Germany in the interwar period. They show that areas where Jews were persecuted during the Black Death in 1348–50 had a much higher prevalence of anti-Semitic acts during both the Weimar Republic and the Nazi period. Cultural and geographical isolation are the driving forces that explain the persistence of anti-Semitic violence. Subsequent papers examine the aftermath and political economy of Nazism. Satyanath, Voigtländer, and Voth (Reference Satyanath, Voigtländer and Voth2017) show that the density of social networks accelerated entry into the Nazi Party, while Voigtländer and Voth (Reference Voigtländer and Voth2015) find evidence that Nazi propaganda, particularly through indoctrination in schools, permanently altered the antisemitic beliefs and attitudes of those treated. Studies such as Becker et al. (Reference Becker, Lindenthal, Mukand and Waldinger2024) and Buggle et al. (Reference Buggle, Mayer, Sakalli and Thoenig2023) have shown how the effect of Nazism was modulated by the migratory responses of populations. To our knowledge, we are the first to examine the quantitative causal relationship between Nazism and fertility, showing that negative selection effects from Nazi family policies durably shaped reproductive behavior in Germany.
The rest of the paper is organized as follows. The next section describes the historical context of Germany before and during the Nazi rule and presents the LEM in detail. Then, we discuss our identification strategy, while the “Results” section presents our main results and robustness checks. In the “Mechanisms” section, we quantitatively test several mechanisms that explain our main findings and eliminate alternative explanations. Then, we discuss our results in the more general framework of authoritarian family policies outside Germany and conclude in the last section.
HISTORICAL CONTEXT
In order to understand the consequences of the Nazi regime on fertility outcomes, we use the Weimar Republic as a point of comparison. More precisely, we restrict our analysis to marriages that were celebrated during or after the Weimar Republic. This temporal restriction does not mean, however, that the bride and groom were not born and socialized in the German Empire. Before WWI, the German Empire was characterized by fairly strict class divisions and limited social mobility (Kaelble Reference Kaelble1978). There was a paternalistic male breadwinner model that left little freedom for women. Emperor Wilhelm II, who ruled the German Empire between 1888 and 1918, is regarded as the father of the Kinder, Küche, Kirche (Children, Kitchen, Church) philosophy, which we describe later in this section (Cecil Reference Cecil2000). Despite this traditional orientation, the Empire never implemented pro-natalist policies such as a unified system of child allowances (Mason Reference Mason1976).
The mass destruction of WWI and the ratification of Article 231 of the Treaty of Versailles left the Weimar Republic in a severely deteriorated economic situation. Productivity was reduced due to the loss of territory, the destruction of industry, and the loss of men killed in the war. Public debt combined with rapid inflation led to systemic malnutrition (Boemeke, Feldman, and Gläser Reference Boemeke, Feldman and Gläser1998). After this first difficult period, the Republic entered the Weimar Golden Age, during which the economy stabilized before the onset of the Great Depression, marked by mass unemployment and systemic impoverishment (Balderston Reference Balderston2002).
On the demographic side, the shortage of men led to a decline in the number of marriages and a persistently high rate of widowhood. Figure 1a illustrates how the number of marriages was initially depressed by WWI, but eventually recovered to pre-war levels. In addition, fertility has been on a downward trend since 1890 due to the ongoing fertility transition (Figure 1c). Despite this situation, the Weimar Republic, as explained by Mason (Reference Mason1976), refrained from implementing pro-natalist policies. However, in 1920, it introduced the first unified tax system, which included a progressive tax deduction based on the number of children. In terms of gender roles, the Weimar Republic is known for laying the foundations for equal civil rights, granting women the right to vote as early as November 1918, when the Republic was proclaimed. During this period, women’s participation in the labor force increased at an unprecedented rate, although it was concentrated in the less advanced sectors of the economy. Despite these notable improvements, institutions remained strongly biased in favor of men, resulting in limited power for women.
MARRIAGES, FERTILITY, AND PREVALENCE OF THE LOAN IN THE GERMAN EMPIRE, WEIMAR REPUBLIC, AND THIRD REICH ALONG TIME
Notes: Panel a) shows the total number of marriages (in thousands, solid black) and the number of marriages involving loans (dashed blue) in the Third Reich between 1890 and 1940. Panel b) presents the number of marriages (in thousands) between 1920 and 1969, based on a 10 percent sample of the West German census. Panel c) illustrates the number of births per 1,000 inhabitants in the Third Reich between 1890 and 1940. Based on the 10 percent West German census sample, Panel d) shows the total fertility rate between 1925 and 1969 and Panel e) presents the share of women who permanently left the labor market upon marriage for marriages between 1920 and 1940. Panel f) shows the share of marriages involving a loan by age at marriage in 1937 in the Third Reich.
Sources: Panels a) and c) Statistisches Reichsamt (1938b, 1940, 1942); Panels b), d), and e) Census 1970; Panel f) Statistisches Reichsamt (1938a).

In January 1933, the National Socialist German Workers’ Party (NSDAP) won the elections and took power. The NSDAP tried to stimulate growth by investing in housing, the Reichsbahn, the postal system, and other infrastructure. It also invested heavily in armaments. The large-scale unemployment they inherited from January 1933 had disappeared by 1937 (Overy Reference Overy1994). This improvement was achieved by a sharp reduction in female labor force participation, a key aspect of the LEM, which we will discuss further. Mass consumption did not increase accordingly and was even discouraged, as the one-pot Sundays show.Footnote 7 The success of this program highlights the ambivalence of the German people in supporting the new regime. This ambiguity can be retrieved in more direct outcomes, such as the number of deportations by locality and political results in parliamentary elections between 1928 and 1933, as done by Adena et al. (Reference Adena, Enikolopov, Petrova, Santarosa and Zhuravskaya2015). Resistance actions and movements are also documented by Adena et al. (Reference Adena, Enikolopov, Petrova and Voth2020) and Peukert (Reference Peukert1987).
In contrast to previous regimes, the Nazis implemented an exceptionally proactive family policy, inspired by the concept of Kinder, Küche, Kirche (3K) fathered by Emperor Wilhelm II. According to the 3Ks, women should participate in the economic life of the country only by ensuring the growth of their family (Pine Reference Pine1996). More specifically, they were expected to devote their time to bringing up children (“Kinder”), feeding the family (“Küche”), and investing in their spiritual lives (“Kirche”). The Nazi regime was convinced that the abandonment of traditional gender roles and family life, which had begun with the Weimar Republic, was a major threat to the German Reich. In his book “We create the Third Reich,” Wilhelm Frick, one of the founders of the Nazi regime and Reich Minister of the Interior, documented a radio speech on the occasion of Mother’s Day in May 1934. He emphasized that:Footnote 8
The salvation of Germany depends not only on the enthusiasm of our male youth for the resurgence of our fatherland, but it depends just as much on the devotion with which our women and girls turn back to the family and to the idea of motherhood! Women and mothers are the guardians of tradition and customs, but also the guardians of culture and morality! (Frick Reference Frick1934)
The main idea of the regime was to bring German women back home to reduce the massive unemployment caused by the economic crisis of the 1930s and to promote the growth of the “Aryan” population within a paternalistic breadwinner model. Apart from the massive propaganda around the 3Ks (Pine Reference Pine1996), the main family policy instrument of the NSDAP was the LEM. It was part of the larger “Law for the Reduction of Unemployment” (LRU) of 1 June 1933.
The LEM developed around three pillars: marriage, fertility, and labor force participation. Each element of the law was designed to change the incentives for women to marry, to have children, and to leave the labor market. The LEM offered newly married couples a loan (“Ehestandsdarlehen”) of up to 1,000 ReichsmarkFootnote 9 with which they could buy furniture. The loan was distributed in the form of coupons.Footnote 10 It was interest-free, and couples had to repay 1 percent of the total amount each month. This policy was designed to increase the number of marriages of a certain type of population deemed valuable to the Volk by imposing further restrictions. We will use the term eligible population here. To be eligible for the loan, the marriage should not involve persons who are (i) Jewish, (ii) without civil rights (“bürgerliche Ehrenrechte”), (iii) suspected of having dubious political attitudes (persons without a guarantee of uncompromising support for the nation-state), (iv) suffering from a physical or mental hereditary disease that would lead to a marriage not in the interest of the ethnic community, or (v) susceptible to not repaying the marriage loan (“asocial”). Finally, the loan was limited to marriages celebrated after the implementation of the policy on 3 June 1933.
In addition to the positive incentives to marry, the Nazis introduced negative incentives to remain unmarried. Officially, the “marriage assistance” (“Ehestandshilfe”) was introduced to refinance the marriage loan. It was mainly a progressive tax system that applied only to single people without children. All unmarried persons under the age of 55 who earned more than 75 RM per month had to pay up to 5 percent of their income, depending on their income level. The tax was levied on both labor and property values.Footnote 11 Widowed and divorced persons were included in the single group unless they were over 55 years of age (no longer of fertile age), spent more than $\frac{1}{6}$
of their monthly income to support their parents or ex-wife, or had children from a previous marriage. In January 1935, marriage assistance was incorporated into the income tax. In addition to this economic penalty, unmarried or childless people suffered a strong social stigma (Pine Reference Pine1996). As reported by Proctor (Reference Proctor1988), in July 1942, Reich Health Führer Leonardo Conti ordered that “every means at the disposal of the doctor should be used to help childless couples to bear children”; to this end, Conti ordered each German district (Gau) in the Reich to establish workshops (attached to local health offices) to help childless couples find ways to bear children.
$\frac{1}{6}$
of their monthly income to support their parents or ex-wife, or had children from a previous marriage. In January 1935, marriage assistance was incorporated into the income tax. In addition to this economic penalty, unmarried or childless people suffered a strong social stigma (Pine Reference Pine1996). As reported by Proctor (Reference Proctor1988), in July 1942, Reich Health Führer Leonardo Conti ordered that “every means at the disposal of the doctor should be used to help childless couples to bear children”; to this end, Conti ordered each German district (Gau) in the Reich to establish workshops (attached to local health offices) to help childless couples find ways to bear children.
To encourage fertility within a marriage, the total amount of the loan to be repaid was reduced by 25 percent for each birth (“Abkindern”). If divorce was made almost impossible under Nazi rule, childlessness or the possibility of conceiving children with a younger childless woman were valid reasons for unilateral divorce.Footnote 12 In fact, it was even encouraged if the couple remained childless after a certain period of time.
Finally, in order to encourage women to leave the labor market and embrace the ideology of the 3K, the receipt of the loan was made conditional on women giving up their participation in the labor market as long as the couple repaid the loan. In reality, only women who had been employed for at least six months in the two years prior to the introduction of the loan (1 June 1931 to 31 May 1933) were entitled to receive it (Clause V §1 (1) a.). This practical detail made the LEM a key element of the LRU. Women whose husbands earned less than 125 RM were not obliged to stop working.
During the period of this study, the legislation was adapted to the economic situation. In January 1935, the rules were tightened up by the “Second Law to Amend the Law for the Encouragement of Marriage.” Now women had to work for at least nine months in the last two years before marriage (§1 (1) a.). In 1937, the German labor market moved toward full employment and local labor shortages. This led, after a series of minor revisions, to a major modification of the LEM to allow some German women to re-enter the labor market. This modification is known as the “Third Law for the Adjustment of the Law for the Encouragement of Marriage,” which was implemented on 3 November 1937. From that date on, newly married women who received the marriage loan had to choose between repaying 1 percent per month without working or 3 percent while working.
The LEM was not the only policy that directly affected reproduction and marriage. Mason (Reference Mason1976) gives a very detailed description of the additional welfare policies implemented by the Nazi administration from 1933 to 1938.Footnote 13 From the doubling of the income tax allowance for each dependent child to the introduction of a one-off child allowance of 100 RM per child for large families in need, the cost of childbearing was gradually and significantly reduced in the early years of the Third Reich. As Mason points out, this unprecedented policy did not achieve the goal of making large families more prosperous than small ones, the ultimate goal of Nazi family policy, but it did potentially have a positive effect on fertility decisions.
Another facet of the Nazi family policies that we do not explore in this paper concerns the eugenic persecution of minorities. On 14 July 1933, the “Law for the Prevention of Hereditarily Diseased Offspring” imposed sterilization on persons suffering from certain hereditary diseases (congenital feeble-mindedness, schizophrenia, severe depression, …). If sterilization was unsuccessful, the woman who became pregnant had to abort the pregnancy. Between 1934 and 1939, 320,000 persons were sterilized, representing 0.5 percent of the German population, mostly single women (Pine Reference Pine1996). The “Law for the Protection of German Blood and Honour” of September 1935 prohibited sexual relations between Germans and members of minorities. Finally, on 18 October 1935, the “Law for the Protection of the Hereditary Health of the German People” excluded the “inferior” and “alien” from the “Volksgemeinschaft” (National Community), with consequences for marriage and fertility. This policy was part of the massive persecution of minorities such as the Jewish and Gypsy populations.
To put the German historical context into a quantitative perspective, we rely on two main types of data sources. The first consists of historical data collected before WWII. Most of the data comes from two censuses conducted in 1933 and 1939, when the Nazis were in power. To the best of our knowledge, the original microdata have not survived over time, but tables with data aggregated to the level of provinces have survived in Statistisches Reichsamt (1937, 1943). One of their key features is their aggregation by year of marriage. We supplement these data with additional contextual variables from Statistical Yearbooks, such as the proportions of couples who married in 1937 and 1938, using the loan by age and by province. Our second main source of data is more recent and consists of individual (non-nominative) census data collected in West Germany in 1970. We describe the latter when turning to our identification strategy, while Online Appendix A presents all our data sources and ways of accessing them. More details, as well as replication packages of all our results, can be found at the paper’s ICPSR repository (Stelter and Baudin 2025).
Figure 1a and b present the historical dynamics of marriage in Germany from the Empire to the Third Reich.Footnote 14 Following the introduction of the marriage loan in 1933, there was a rapid surge in the total number of marriages. After an initial peak in 1934, the number of marriages declined slightly and remained relatively stable. The loan was readjusted in 1937, resulting in a new increase in the number of marriages. Subsequently, with the outbreak of the war, the number of marriages fell significantly. By 1933, the loan had been paid out to about 22 percent of all marriages. This percentage increased to about one-third of all marriages, peaking in 1938 after the reform (see Figure 1a, dashed line).
Figure 1c shows the trend in the number of children per 1,000 inhabitants. Apart from the period of WWI, fertility rates have been falling steadily since the beginning of the twentieth century. However, this downward trend stopped when the Nazis came to power. The number of births per 1,000 inhabitants rose from less than 15 in 1933 to over 20 in 1939, as noted earlier by Kirk (Reference Kirk1942). Using an alternative measure, we find that by the end of the Great Depression, the total fertility rate among married women was comparable to levels observed at the end of the twentieth century, namely below 1.4. By the outbreak of WWII, fertility rates were back above replacement level, suggesting that the Nazis may have succeeded in halting the decline in fertility. However, it is important to note that the increase in the number of births may have been due to a concurrent increase in the number of marriages, which may have obscured a decline in marital fertility. In Figure 11 of Online Appendix B, we show that marital fertility increased only modestly compared to total fertility under the Nazi regime, suggesting that marriages played a significant role in the fertility rebound during the Nazi period.
Figures 1e and 1f highlight two crucial observations. First, a significant proportion of couples (40 percent) benefited from the loan when they married in 1937 at the age of 20, with this share gradually declining to 30 percent by age 26. As illustrated in Figure 1e, the extensive use of the loan led to an unprecedented peak in the proportion of women permanently leaving the labor market upon marriage. In other words, our descriptive statistics suggest that both the loan policy and the regime’s pressure on young women to marry quickly had a substantial impact on the German labor market, aligning with the objectives of the Nazi administration.
Our reading of the literature and of Figure 1 points to a fertility rebound associated with the National Socialist period. In the next sections, we develop an identification strategy that will capture the potential association between Nazism and marital fertility, and the mechanisms behind this.
IDENTIFICATION STRATEGY
We use the 10 percent sample of the 1970 census in the Federal Republic of Germany (FRG).Footnote 15 The sample includes about 1 million women born before 1921 (age 16 or older in 1937) and more than 324,000 marriages between 1928 and 1937.Footnote 16 The relatively long period between the 1933 reform and the 1970 census allows us to examine the impact of Nazism on fertility beyond its temporary effects, and also to explore the mechanisms by which the Nazi regime altered completed fertility.
Our analysis is based on a stepwise difference-in-difference approach, comparing women living in the Third Reich in September 1939 with women living outside the Reich at the same time. The latter forms our control group. Most of them are of German origin, and all women in our sample, regardless of their place of residence in 1939, are German in 1970.Footnote 17 This ensures that the difference we capture between our control and treatment groups is not due to differences in the origins or past culture. The women in our control group were not subjected to Nazi family policies and were likely only minimally exposed to Nazi propaganda until 1938. While they may not have been entirely insulated from it—for instance, due to the presence of the Nazi Party in regions like the Sudetenland—the intensity of this propaganda was far lower than within the Third Reich, where the Party was in power. This suggests that if we find an effect of Nazism on fertility using our difference-in-difference approach, it will be a lower bound estimate of the true effect. Importantly, even if some of the women in our control group were integrated into the Reich between 1939 and 1945, they made their marriage decision before then, as we restrict our analysis to marriages celebrated before 1938. This is a crucial feature, as we will show later that marriage selection was a key driver of the Nazi regime’s impact on German fertility.
We restrict our analyses to marriages celebrated before 1938 for two main reasons. First, the reform of the LEM, passed in late 1937, was important enough to change the nature of our treatment variables. Second, the annexation of Austria and the Sudetenland by the Third Reich in 1938 introduces a confounding factor that complicates the distinction between our treatment and control groups.
Table 1 shows the distribution of women who married between 1928 and 1937 in our control and treatment groups according to their place of residence in 1939. The treatment group consists of 305,289 women, 82.9 percent of whom lived in the FRG, while the remainder migrated from other zones of the former Reich to the 1970 borders. Our control group consists of 19,195 women, mainly from former Czechoslovakia, including the Sudetenland, and neighboring eastern and southeastern countries such as Poland.
OBSERVATIONS ACCORDING TO PLACE OF RESIDENCE IN 1939

Notes: The table reports the number of women residing in West Germany, categorized by their place of residence in 1939, according to the 10 percent sample of the 1970 census. These women are split into two categories: those who married before the Nazis rose to power (1928–32) and those who married during the Nazi regime (1933–37). Figure 7 in Online Appendix A shows the geographic boundaries of the Third Reich as of 1937.
Source: RDC of the Federal Statistical Office and Statistical Offices of the Federal States, doi: 10.21242/12111.1970.00.00.3.1.0, own calculations.
We explore the complex effect of the Nazi regime on the marital fertility of German women both in the short run and in the long run. We do so by relying on a unique specification but on alternative definitions of our dependent variable, corresponding to alternative dates/years at which we measure fertility. These estimations will progressively point to a key result: overall, the Nazi regime is associated with a temporary increase in fertility among German women, but the family policies specifically implemented for newly married couples and the associated social and economic pressure to marry had a detrimental effect on births. All our estimations aim to predict nit, the number of children at time t of a woman i. We rely on an ordinary least squares model as our main specification:
 $${n_{it}} = {\alpha _0} + {\alpha _1}{G_i} + {\alpha _2}{T_i} + {\alpha _3}{G_i}*{T_i} + \beta {X_i} + \gamma {b_{ij}} + {\varepsilon _{it}}.$$
Gi equals 1 if woman i lived in German territory, otherwise it equals 0. Ti is a dummy variable indicating our treatment. It takes value 1 if woman i married during the Nazi regime or 0 if she married before. Xi, the vector of basic controls in all estimations, includes education, religion, learned occupation, and Vertriebenenausweis.Footnote 18 bij is a collection of six variables controlling for area-specific fertility trends; it captures the position of women both in their reproductive cycle and in their residential environment.Footnote 19 These estimations are done with robust standard errors.Footnote 20
IMPACT OF NAZISM IN THE SHORT RUN
In a first exercise (Exercise A), we compare the fertility of women inside the Reich to their statistically equivalent counterparts outside the Reich after one to five years of marriage. Our dependent variable corresponds to the number of children of women who married from 1928 to 1932, as measured in 1933, while it corresponds to the same metric measured in 1938 for women who married between 1933 and 1937. The 1928–1932 marriage cohorts are all unaffected by the Nazi regime (Ti = 0) in 1933, while the 1933–1937 marriage cohorts were fully exposed to the Nazi regime through its propaganda, social punishment of singles and childless, and family-based welfare policies (Ti = 1) by 1938.Footnote 21 A positive sign of our interaction coefficient α 3 would indicate a positive association between full exposure to Nazism and marital fertility.
Our second exercise (Exercise B) relies on the same specification with the same definition of our treatment, but it measures fertility of all women in 1938. It allows us again to compare the fertility difference between women who married before the Nazi regime (Ti = 0) and during the Nazi regime (Ti = 1). Because fertility is now measured in 1938, we compare women who were fully treated by the Nazi regime (Ti = 1) to women who were only partially treated (Ti = 0); indeed, by 1938, these latter were exposed to all the aspects of the Nazi policies related to family except those related to incentives to marry. A positive sign on our interaction term would imply a positive impact of the Nazi family policies reserved for newly married couples, of which the LEM is the core element. Conversely, a negative sign would argue for unexpected adverse effects of the policies related to family formation. Even if we control for area-specific fertility trends, this specification implies comparing women in different years of marriage and thus different exposure to the risk of pregnancy. Any negative sign could then be the combined effect of a lower exposure to the risk of pregnancy for women married after 1933 and a potential negative effect of Nazi policies. The impact of the differential in exposure to the risk of pregnancy is ruled out when we explore the same exercise in the long run by measuring fertility in 1970.
IMPACT OF NAZISM IN THE LONG RUN
We repeat Exercise B, but this time we measure the respondents’ fertility in 1970 so that all women in our regression have completed their fertility cycle. This new exercise (Exercise C) also allows us to check whether the effect we capture is a temporary effect of the Nazi family policy on fertility or a more permanent one. It also permits us to show that the effect we capture in the short run is not simply the result of differentials in the exposure to the risk of pregnancy.
Our identification strategy is subject to some risks. By pooling the marriage cohorts for the comparison between 1928–1932 and 1933–1937, we run the risk that our results are driven by a specific event in a specific year, an event that would not necessarily be associated with Nazi rule. Thus, we refine our analysis by restricting our comparison to the 1932 and 1934 marriage cohorts in the next step. Then, we discuss and test the robustness of our approach to additional important risks such as the endogeneity of the year of marriage, parallel trends, non-random selection of individuals between the control and treatment groups, and confounding imbalances between these groups.
RESULTS
Main Estimations
Moving from an OLS estimation without controls to a specification with a full set of controls and robust standard errors yields a series of consistent results, as can be seen in Figure 2 (left panel), which reports point estimates for our coefficient of interest α 3.
EXERCISES A AND B—VALUES OF α 3 ACROSS MAIN SPECIFICATIONS WITH 95 PERCENT CONFIDENCE INTERVALS
Notes: The left panel shows the stepwise progression of the estimation model. Both exercises compare the fertility of women inside the Reich to their statistically equivalent counterparts outside the Reich. In Exercise A, the dependent variable corresponds to the number of children of women who married from 1928 to 1932 as measured in 1933 while it corresponds to the same metric measured in 1938 for women who married between 1933 and 1937. In Exercise B, our dependent variable is the number of children born to women as measured in 1938. We start with a baseline specification without controls. It then adds control variables and area-specific fertility trends sequentially. The latter is the main specification that serves as the basis for the robustness checks shown in the right panel. In “votes,” the share of votes for the NSDAP in 1933 is added as an explanatory variable. “Partner” restricts the sample to still-married couples in 1970 and includes partner characteristics in the set of controls. “No previous kids” limits the sample to women who had no children prior to marriage. “Migrants only” excludes women residing in the territory of the FRG in 1939. Even more restrictively, “forced migrants” excludes women from both the FRG and the GDR. “No South East” removes eastern and southeastern-neighboring countries from the control group. Finally, the balanced specification applies entropy balancing to the main specification.
Source: RDC of the Federal Statistical Office and Statistical Offices of the Federal States, doi: 10.21242/12111.1970.00.00.3.1.0, own calculations.

IMPACT OF NAZISM IN THE SHORT RUN
Exercise A documents a substantial increase in marital fertility among the treated women in Germany after the Nazis came to power. Comparing the fertility of couples who were married since one to five years in 1933 to couples who were married since one to five years in 1938, we find that marrying inside the Reich after 1932 is associated with an increase in fertility of 0.051 children relative to marrying outside the Reich. This corresponds to 5.7 percent of the standard deviation of fertility measured in 1933.Footnote 22
As explained earlier, in Exercise B, we compare the differential fertility of the same two groups of couples as in Exercise A with their untreated counterparts outside the Reich, but measure fertility in 1938. Our coefficient of interest (α 3) then identifies the fertility differential between partially treated women (Ti = 0) and fully treated women (Ti = 1). Remarkably, this coefficient is negative and highly significant in all our specifications shown in Figure 2. In our preferred specification with area birth trends (Main specification), the results indicate that, whatever their location, women who married during the Nazi era (Ti = 1) had fewer children than their counterparts who married earlier (Ti = 0) as α 1 < 0 (see Table 12 in Online Appendix C.3). This difference is even more pronounced, with a margin of 0.097 children, for women who married under the Nazi rule (α 3 = –0.097). To put this in context, this corresponds to 8.4 percent of the standard deviation of fertility in our 1938 sample.
IMPACT OF NAZISM IN THE LONG RUN
To rule out the possibility that our results in Exercise B only indicate a transitory effect on birth timing, we repeat our exercise but measure the completed fertility of women in 1970 (Exercise C). In 1970, relative to their counterparts who were living outside Germany in 1939, the fertility difference between women who married in Germany under the Nazi regime (fully treated) and women who married in Germany before (partially treated) is –0.093 children. This result is highly significant regardless of the specification chosen and suggests that those women who were treated by the Nazi policy reserved for newly married couples reduced their fertility relative to their untreated counterparts. In other words, the full set of incentives introduced by the Nazis ended up reducing rather than increasing the fertility of newly married couples.
This last result is important because it points to a long-lasting counterproductive effect of the full family policy implemented by the Nazi government. In relative terms, the effect we document corresponds to 5.5 percent of the standard deviation of completed fertility measured in 1970. Although this result may seem modest at first sight, it is far from negligible. In a simple simulation exercise, by eliminating the interaction term in our predictions, we compute the average fertility that a woman who married in Germany would have had if she had not been subject to the special treatment of Nazi family policy. We then find that the fertility differential between women living in the Third Reich in 1939 and women living outside the Third Reich in 1939 would have been reduced to 0.01 children in 1970, compared to 0.063 in reality. In other words, controlling for individual characteristics, the fertility gap between migrant and non-migrant women would have been reduced by 84.8 percent.
Back-of-the-envelope calculations also allow us to better understand the intensity of the effect we are measuring, although these calculations must be treated with caution. Given that 1,696,340 marriages were celebrated in the territory of West Germany between 1933 and 1937, we can estimate that the full exposure to the Nazi regime led to 144,745 missing births. Even more cautiously, given the 3,221,986 marriages celebrated throughout the Reich during the same period, the corresponding number of missing births is 274,925.Footnote 23 This last figure is equivalent to 7.3 percent of the military deaths suffered by the Nazi regime during WWII (Statistisches Bundesamt 1961), or to 67 percent of the deaths caused by strategic Allied bombing in Germany (Overy Reference Overy2014).
Marriages in 1932 and 1934
Pooling marriage cohorts in the previous subsection introduces the possibility of a composition effect. Subsequent historical events—such as husbands’ wartime absences, bombings during WWII, and the timing of (forced) migration—affected treated and untreated couples at different points in their reproductive life cycles. As a result, these events may have influenced their remaining fertility in distinct ways and could potentially confound our results in Exercise C.Footnote 24 To minimize the influence of confounding events related to the timing of marriage, we refine our analysis by comparing only women who married in 1932 with those who married in 1934.Footnote 25
Compared to our benchmark estimate in the left panel of Figure 3, the results in the right panel are even more pronounced in magnitude. This suggests that although composition effects are present, they do not drive our main results and may even attenuate them. While the reduced number of observations leads to some loss of statistical power, our findings remain largely significant.
EXERCISE C—VALUES OF α 3 WITH THE ENTIRE SAMPLE (LEFT) AND LIMITING TO MARRIAGES CELEBRATED IN 1932 AND 1934 (RIGHT) WITH 95 PERCENT CONFIDENCE INTERVALS
Notes: The left panel presents the pooled estimation when measuring fertility in 1970 (Exercise C), with 1928–1932 defined as the pre-treatment period and 1933–1937 as the treatment period. The right panel narrows the comparison to the years 1932 (pre-treatment) and 1934 (treatment). In both panels, we start with a basic specification and then add control variables and area-specific fertility trends to arrive at our main specification. This is followed by a series of robustness checks. In “votes,” the share of votes for the NSDAP in 1933 is added as an explanatory variable. “Partner” restricts the sample to still-married couples in 1970 and includes partner characteristics in the set of controls. “No previous kids” limits the sample to women who had no children prior to marriage. “Migrants only” excludes women residing in the territory of the FRG in 1939. Even more restrictively, “forced migrants” excludes women from both the FRG and the GDR. “No South East” removes eastern and southeastern-neighboring countries from the control group. Finally, the balanced specification applies entropy balancing to the main specification.
Source: RDC of the Federal Statistical Office and Statistical Offices of the Federal States, doi: 10.21242/12111.1970.00.00.3.1.0, own calculations.

The experience of expulsion and forced migration, coupled with the need to reintegrate into a new environment, may have contributed to the observed fertility differential. Although this possibility is partially ruled out since the fertility differential we capture in 1970 was already present in 1938, we further investigate it by restricting our treatment group to Germans who moved from the Eastern territories. In other words, we limit the sample to individuals who lived outside East and West Germany before 1939, ensuring that most of the selected sample likely experienced forced migration. As illustrated in Figure 3 (right panel), our findings remain highly robust, with consistent results in both sign and magnitude. This confirms that forced migration—far more prevalent in the control group than in the treatment group—does not drive the results in our main exercise.
Beyond this important robustness check, the right panel of Figure 3 also shows that limiting our sub-sample to marriages celebrated in either 1932 or 1934 does not prevent us from satisfying all the robustness tests detailed in the next section.
Robustness Checks
Throughout the previous two subsections, we have drawn a series of important conclusions. For Exercise A, α 3 is positive, while it is negative for Exercises B and C. It implies that even if the global effect of Nazism on fertility is positive when we compare women fully treated by Nazism to women not treated at all after one to five years of marriage (Exercise A), the effect of the Nazis’ actions in favor of non-married women had a negative effect on their fertility (Exercises B and C). In this section, and especially in the right panel of Figure 2 and in Figure 3, we highlight some important robustness checks.Footnote 26
First, the year of marriage for respondents is potentially endogenous. However, this concern is partially mitigated by the fact that the Nazi Party’s rise to power in the early 1930s was hardly predictable, and the exact nature of its family policies even more so. It is therefore unlikely that German women adjusted their marital behavior in anticipation of the NSDAP coming to power. Nevertheless, to fully rule out the possibility that our results are confounded by marriage endogeneity, we propose an alternative approach in Online Appendix C.2, where treatment is defined based on women’s age at the Nazi regime’s installation in 1933. Specifically, we compute the median age of marriage before 1933 and classify as treated those women who were at or below that age. Using this birth cohort-based treatment, our results remain largely unchanged.
Second, the fertility patterns of our control and treatment groups may not have followed a parallel trend prior to the possible Nazi treatment. We examine this possibility in two ways. First, we calculate the (uncontrolled) annual fertility of both groups for each marriage cohort to check whether they followed a common dynamic before 1933, which is the case. Therefore, we do not violate the parallel trend assumption, at least not by much, while we can clearly identify breaks associated with the arrival of the Nazi regime (see Figure 13 in Online Appendix C.4). Second, in Figure 4, we repeat our main specification but this time as an event history study. By interacting a set of dummy variables for year of marriage with Gi, we can check for any pre-existing trend between our control and treatment groups on a yearly basis. As can be seen from Figure 4, no such pre-existing trend can be documented.
PRE-TRENDS IN DIFFERENTIAL FERTILITY IN 1938 (LHS) AND 1970 (RHS)
Note: Bars indicate the 95 percent confidence intervals of the event history model (main specification with controls and area birth trends) with 1932 as reference year.
Source: RDC of the Federal Statistical Office and Statistical Offices of the Federal States, doi: 10.21242/12111.1970.00.00.3.1.0, own calculations.

A third threat to our identification strategy comes from the non-random selection of individuals between the control and treatment groups. Since our control group consists of migrants to West Germany, we cannot exclude the existence of unobserved factors of selection into migration that are themselves correlated with the fertility of the respondents. Table 2 documents some key characteristics of both groups. We perform balance tests using t-tests for the year of birth and age at marriage, as well as proportion tests for the fractions across educational attainment, occupation, and religion.Footnote 27 On average, women who married in the Third Reich were older and less educated than those who married outside the German territory. They were more likely to have attended only primary school and less likely to have attended higher education, with the exception of technical schools. Outside the Third Reich, most women were Catholics, while inside the Third Reich, Evangelical religion dominated. We also documented some differences regarding learned occupation.
SUMMARY ON BALANCING TESTS FOR WOMEN MARRYING BETWEEN 1928 AND 1937 IN- AND OUTSIDE THE THIRD REICH

Notes: Table 2 shows the results of the balance tests: t-tests for year of birth and age at marriage, and proportion tests for fractions across educational attainment, occupation, and religion. The Evangelical religion includes the Free Church. *** p-value <0.01, ** p-value <0.05, * p-value <0.1.
Source: RDC of the Federal Statistical Office and Statistical Offices of the Federal States, doi: 10.21242/12111.1970.00.00.3.1.0, own calculations.
In order to investigate whether these observed imbalances may confound our estimates, we re-estimate all key results using pre-processing procedures to balance our sample. First, we use entropy balancing (Hainmueller Reference Hainmueller2012) to reweight our sample and ensure that the distributions of covariates in the reweighted data are balanced between our treatment and control groups concerning occupation, education, and year of birth.Footnote 28 In this way, we ensure that any unobserved differences between women living inside and outside the Third Reich in 1939, which are correlated with observable differences, do not drive our conclusions. We also test the non-parametric Coarsened Exact Matching method (Iacus, King, and Porro Reference Iacus, King and Porro2008) and propensity score matching using Mahalanobis distance with two nearest neighbors. Table 18 in Online Appendix C.6 reports the results of our main regression exercises based on the three alternative balanced samples described previously. Our main results are preserved.
To complement our balanced estimates, we propose a final exercise in which we change our treatment group by selecting only migrants to the FRG who came from the GDR and East German territories. In this way, we compare treated and untreated migrants, thus eliminating part of the effect of selection into migration. In this setting, our coefficients of interest are remarkably similar to our preferred estimate (Migrants only in Figure 2 (right panel) and Figure 3). As already done in the case of the 1932 and 1934 marriage cohorts in the previous subsection, we restrict our treatment group to Germans who moved from the Eastern territories to compare treated and untreated forced migrants. Our main results persist once again (Forced migrants in Figures 2 and 3).
If we do not include the husband’s characteristics in our main specification, we do so in the right panel of Figure 2 and in Figure 3 (Partner included) by introducing the partner’s religion and education. Our results are preserved, and the persistent negative effect of family policies on newly married couples remains significant and of the same order of magnitude as in our benchmark estimation, both in the short and the long run (Exercises B in Figure 2 and Exercise C in Figure 3). We also add to our preferred specification the percentage of votes for the NSDAP in the 1933 election at the territorial level as a control to check whether a stronger adherence to the Nazi party might be responsible for our results. If we find that more votes for the Nazi party are associated with lower fertility rates, this does not change the sign and the magnitude of our main effects.
In our main sample, we have 24,260 women who gave birth before their marriage, which could indicate either out-of-wedlock births or births from a previous marriage. To ensure that our results are not driven by this minor margin of fertility, we tested our preferred specification, excluding these women. Our main results in Figures 2 and 3 remain significant, with a magnitude comparable to our primary analysis (no previous kids).
Finally, since fertility is a count variable, a natural specification consists of a Poisson regression model that attempts to determine the probability that woman i, who married at time t in area j, has
 $${\cal N}$$
children. We present our preferred specification using the Poisson regression model in Table 12 (Online Appendix C.3) and conduct robustness checks in Table 19 (Online Appendix C.7), confirming that our main results hold in all cases.
$${\cal N}$$
children. We present our preferred specification using the Poisson regression model in Table 12 (Online Appendix C.3) and conduct robustness checks in Table 19 (Online Appendix C.7), confirming that our main results hold in all cases.
MECHANISMS
In Online Appendix D, we develop a stylized model, following Chiappori (Reference Chiappori1988) in order to rationalize our main results. This model, with endogenous marriage, divorce, and fertility decisions, integrates the main features of the Nazi family policies.
In this model, the apparently generous welfare policies in favor of families and new births explain the general increase in fertility documented in Exercise A. The negative effect obtained in Exercises B and C is explained by the fact that remaining single has become costly. Because of this, women tended to accept low-quality marriage offers, resulting in unions that were comparatively less fertile and more fragile than those entered into without pressure to marry. This implies three testable predictions: (i) marriages of women targeted by Nazi family policies reserved to newlyweds may end up having fewer children than their partially treated counterparts already married due to negative selection into lower-quality unions, (ii) German women who married under the Nazi regime tended to marry earlier, and (iii) they accepted lower-quality unions and thus should have a higher propensity to divorce later. In the next subsections, we test these three mechanisms.
Loan Policy
To explore whether women targeted by the LEM are driving the backlash in fertility, we extend our analysis to a triple-difference approach. We still compare women who married before 1933 (Ti = 0) with women who married after 1933 (Ti = 1), inside (Gi = 1) and outside (Gi = 0) the Reich. In addition, we define a new binary variable, Ei, which takes value one if the woman stopped working definitively within two years before her marriage. It equals zero if the woman stopped working earlier or never worked. This variable captures individual characteristics that theoretically make women eligible for the marriage loan.Footnote 29 We cannot guarantee that women with Ei = 1 actually benefited from the loan, so the effect we measure is an intent-to-treat effect rather than a treatment effect. Nevertheless, it should be remembered, as shown in Figure 1a, that a significant proportion (27.3 percent) of German women who married between 1933 and 1937 benefited from the loan.
We do not include women who definitively stopped working after marriage because we cannot track their labor force participation in the years before they married. Indeed, the 1970 census asked women which year they definitively stopped working, not their entire labor supply history. Despite these limitations, we test the following regression model:
 $${n_{it}} = {\alpha _0} + {\alpha _1}{T_i} + {\alpha _2}{G_i} + {\alpha _3}{E_i} + {\alpha _4}{T_i}{E_i} + {\alpha _5}{T_i}{G_i} + {\alpha _6}{G_i}{E_i} \\+ {\alpha _7}{T_i}{G_i}{E_i} + \beta {X_i} + \gamma {b_{ij}} + {\varepsilon _i},$$
where nit is defined as in the previous sections. A negative sign for α 7 would indicate that the negative effect we capture in our main estimations is driven at least partially by the group of women targeted by the Nazi regime’s policy. Indeed, we find such a negative coefficient in Table 3 (All), while the coefficient α 5 attached to TiGi becomes insignificant. The main conclusion from Table 3 is that the negative association between marrying under the Nazi administration and fertility is driven by the population of women theoretically eligible to receive the loan (All). In essence, the incentives introduced by the Nazi regime to encourage women to stay at home and adhere to the “3Ks” lifestyle seem to have led to a decline in fertility rather than the intended increase. Encouragingly, this result holds true whenever we measure fertility in 1938 or in 1970, suggesting that the long-term effect we observe was established during the Nazi regime.
EFFECT OF ELIGIBILITY TO THE MARRIAGE LOAN ON FERTILITY AND AGE AT MARRIAGE FOR MARRIAGES CELEBRATED IN 1928–1937

Notes: All models rely on an OLS specification and are done with robust standard errors. The vector of basic controls in all estimations includes Education, Religion, Learned Occupation, and Vertriebenenausweis. Note that, the coefficient α 2 appears to be very high, but its interpretation requires also considering the coefficients for the area-specific birth cohort trend. *** p-value < 0.01, ** p-value < 0.05, * p-value < 0.1.
Source: RDC of the Federal Statistical Office and Statistical Offices of the Federal States, doi: 10.21242/12111.1970.00.00.3.1.0, own calculations.
Our theoretical model rationalizes the fact that women who benefited from the most generous features of the Nazi family policies are those who ultimately reduced fertility due to the strongest pressure to marry. These were mostly young women, which implies that the effect we document should concentrate among the youngest women in our sample; this can be verified in Table 3.
Marriage Behavior
To study marriage behavior, we first explore the transition into marriage in and outside the German Reich. We compare women who married between 1928 and 1932, before the rise of the Nazi regime, with those women who married between 1933 and 1937, after the regime’s establishment. We observe a maximum increase of 8.5 percentage points in the likelihood of being married at the age of 26. This difference tended to decrease at older ages, indicating a strong shift in marriage patterns toward younger ages within the Reich. Overall, by the end of women’s reproductive life, the likelihood of being married increased by around 6 percentage points.Footnote 30
To further explore the shift in the age of marriage, we rely on the same specification as in the previous subsection, using the age at marriage as the outcome variable. This allows us to determine whether the shift in marriage age is linked to the eligibility for the LEM and passes through the targeted population. We find a reduction in the age at marriage of 0.13 years for the targeted population.
In summary, we provide evidence that the Nazi era is associated with a higher probability of ever marrying at younger ages. This effect is stronger among the population that was especially targeted by the LEM.
Divorce
In line with our theoretical framework, our results so far suggest that the Nazi policies incentivizing marriage among young women led (i) to fewer births in these newly formed marriages and (ii) to younger marriages. Our theoretical model reconciles these two facts thanks to a general equilibrium argument, making the quality of these precipitated unions lower. In this section, we use divorce as an extreme manifestation of low-quality unions. As our outcome variable, divorce takes the value of one if the respondent is divorced and never remarried and zero if she is still married. As in the rest of the paper, data limitations prevent us from following women who married before or during the Nazi regime, divorced, and remarried after 1938.
In a logistic regression setting, we use the same set of basic controls as in our main specification and focus our attention on two main variables. Ti takes value one if the person married between 1933 and 1937, and zero if she married between 1928 and 1932. Ai is the age at marriage of woman i. Finally, we interact these two variables to capture how the effect of marrying under the Nazi administration on the probability of divorce is modulated by age at marriage. Our specification has been guided by the results in our two previous sections and our theoretical model; it states:
 $$\log \left( {\frac{{{p_i}}}{{1 - {p_i}}}} \right) = {\alpha _0} + {\alpha _1}{A_i} + {\alpha _2}{T_i} + {\alpha _3}{A_i}*{T_i} + \beta {X_i} + \gamma {b_{ij}} + {\varepsilon _i},$$
where pi is the probability that person i is divorced by 1970. In Table 4, we present the results of four logistic regression models using sample splits. Our first regression model focuses on all women who married within the German Territory. We see an overall positive effect of Ti, but this effect becomes smaller and smaller as the age at marriage increases. We estimate that marrying under the Nazi regime is associated with an increase in the probability of divorce for women who married before the age of 31, which is close to the point of return according to the uncontrolled effect of Nazism on marriages (see Figure 14 in Online Appendix E). Thus, the relative increase in the prevalence of young marriages under the Nazi regime was associated with an increased likelihood of divorce. This confirms our interpretation that Nazi family policies relatively depressed the fertility of newly married couples by pushing too many women in the Third Reich to marry early in order to form families and feed the demographic growth of the population. Interestingly, outside the German territory, the interaction between marrying in the Nazi era and age at marriage has an opposite sign. Overall, marriages celebrated during the Nazi era are less likely to end in divorce outside Germany, regardless of age at marriage.Footnote 31
DIVORCE: AGE AT MARRIAGE AND THE QUALITY OF MATCHES

Notes: The table shows the results from sample-split logistic regressions, with the following set of controls included in all estimations: education, religion, learned occupation, and Vertriebenenausweis. “Eligible” refers to women who were either eligible (“Yes”) or not eligible (“No”) according to their labor force participation. All estimations are done with robust standard errors. *** p-value < 0.01, ** p-value < 0.05, * p-value < 0.1.
Source: RDC of the Federal Statistical Office and Statistical Offices of the Federal States, doi: 10.21242/12111.1970.00.00.3.1.0, own calculations.
In the next step, we zoom into the German territory and split our sample into eligible and non-eligible marriages. We also find a higher probability of divorce among the younger women who were eligible for the loan. Again, the turning point is around the age of 31.
These findings, together with those from the previous subsections, provide a comprehensive picture of the impact of Nazism on fertility in Germany. In response to social, economic, and political pressures, single German women within the Reich were pushed into marriage at an earlier age and to accept lower-quality marriages. This reduction in marriage quality explains why these women reduced their relative fertility compared to their counterparts who married before the Nazis came to power. In itself, this negative selection into marriage more than offsets the positive effects of welfare programs for newlyweds (such as “Abkindern”), introduced by the Nazi regime, on completed marital fertility.
To the best of our knowledge, we are the first to provide quantitative evidence of negative selection effects on the marriage market that are strong enough to counteract the expected positive effects of authoritarian family policies on fertility. It is then appropriate to consider whether other data sources or contributions from various fields of human and social sciences might support our findings in the specific case of Germany. It is true that, apart from the 1970 census, reliable sources of data on family dynamics during the Nazi period are scarce. The aggregated results of the 1952 Statistical Yearbook are a potential, albeit limited, source of data. Using Table 18 from Statistisches Bundesamt (1952), we find that 4.09 out of every 1,000 marriages celebrated between 1933 and 1937 ended in a divorce in 1949, compared to only 2.75 per 1,000 marriages celebrated in the pre-Nazi era. In addition to this quantitative source, Online Appendix E.2 presents contributions from historians and sociologists arguing that the Nazi regime transformed marriage from a bond based on love and emotional compatibility into an instrument of population policy and racial selection, ultimately rendering such unions more fragile.
The shift toward more and younger marriages, their reduced stability, and the transmission of fertility decline through eligible women are well in line with the mechanisms predicted by our cooperative household model. However, these observations do not rule out a number of plausible alternative mechanisms. In Online Appendix F, we focus on what we consider to be the four most important competing narratives. These narratives encompass exposure to life shocks in the early stages of the women’s lives, differential child mortality, the Great Depression, and the implementation of alternative family policies in neighboring countries that affected our control group. We show that none of them can explain our main results.
PRONATALIST AND LOAN POLICIES IN OTHER REGIMES
Throughout recent European history, the Nazi approach to natalism was not an isolated phenomenon but part of a wider movement promoting and subsidizing new families. This movement often used loan systems coupled with extra child allowances and tax cuts for large families, propaganda, and social pressure to encourage childbearing. It is remarkable how many similar examples have emerged over time across the continent.
Several years after the Nazis came to power, Francoist Spain adopted a comparable loan policy. Beginning in 1941, married couples were offered preferential loans that became progressively easier to repay with the birth of each child. This policy further incentivized women to leave the workforce by doubling the loan amount if the bride agreed to become a full-time housewife. However, this increase in the value of the loan was conditional on the husband’s continued employment and the absence of disability (Valiente Reference Valiente1996). The resemblance to the Nazi approach is striking, especially given that Francoist Spain, like Nazi Germany, introduced a wide range of additional child allowances. This approach was motivated both by the declining fertility rates the country had experienced in previous decades and by a desire to reverse the empowerment of women promoted by the previous regime, the Second Republic in Spain, and the Weimar Republic in Germany.
As discussed in our robustness checks, although the Fatherland Front in Austria did not implement a loan policy similar to Germany’s (Thorpe Reference Thorpe2010), the concept was introduced in the country with the Anschluss in 1938. Directly inspired by Nazi policy, marriage loans were introduced in Fascist Italy in August 1937. In an environment that promoted traditional gender roles and encouraged women to leave jobs outside the home, newly married couples were entitled to loans of between 1,000 and 3,000 lira. As Caporali and Golini (Reference Caporali and Golini2010) explain, these marriage loans targeted young couples more explicitly than in Germany, as they were only granted if both spouses were under 26 and had an annual income of less than 12,000 lira.
Interestingly, from 1972 onward, the socialist regime that ruled the German Democratic Republic (GDR) after WWII implemented a loan policy similar to that of fascist regimes. Kreyenfeld (Reference Kreyenfeld2004) describes this policy in detail: couples marrying under the age of 26 were eligible for an interest-free loan of 5,000 marks to purchase furniture and household appliances. They could also benefit from the Abkindern system, where the first child reduced the amount to be repaid by 1,000 marks, the second by 1,500 marks, and the third by 2,500 marks. The Abkindern system was ultimately more generous than the Nazi one, as only three children were needed to wipe out the loan entirely. This policy was accompanied by other measures, such as child allowances for large families. However, there was a fundamental difference between the Nazi family policy and that of the Sozialistische Einheitspartei Deutschlands (SED). The SED did not promote traditional gender roles; instead, its pro-natalist policies aimed to compensate for the decline in fertility associated with the empowerment of women and their deep integration into the labor market. Without adopting a causal approach, Kreyenfeld (Reference Kreyenfeld2004) concludes that the policies implemented by the SED were associated with a significant increase in the fertility differential between East and West Germany. This finding sheds important light on our results, as an equivalent policy implemented in a paternalistic environment that promoted traditional gender roles and exerted enormous pressure to marry had negative effects in Nazi Germany.
Since the family, as an institution, is a central element of authoritarian regimes and extremist political manifestos, it is not surprising to see a resurgence of proposals for loan policies and, more generally, pro-natalist policies in contemporary Europe. These new loan policies are accompanied by strong anti-migrant sentiments and aim to promote national families. This is evident in the policy developed by Viktor Orbán in Hungary, where the regime has made native Hungarians in heterosexual relationships the main beneficiaries of very generous measures (Fodor Reference Fodor2022). Similar to past fascist regimes, large families are given substantial allowances and benefits, and an interest-free loan system has been set up for newly married couples. Working couples can apply for a loan of 10 million HUF, roughly equivalent to three years of an average worker’s income. If the couple has three children, the loan does not have to be repaid. In addition to this main loan, several smaller loans are available for the purchase of items such as large family cars. Although Orbán’s government is targeting working couples, which may seem to be in line with the East German empowerment program, Fodor (Reference Fodor2022) points out that childcare responsibilities in the regime’s propaganda are directed exclusively at women, placing social pressure on them to give birth and manage family care in addition to pursuing a career. By promoting the family as a means of ensuring the survival of the “true” Hungarian population, the propaganda and social pressure on women could potentially lead to a backlash against family policies, similar to what happened in Germany in the 1930s.
Finally, Hungary is not an isolated case in today’s Europe. During the 2022 presidential elections, Marine Le Pen, leader of the Rassemblement National—the new name of the Front National, a party founded by her father and French members of the Waffen-SS, Pierre Bousquet and Léon Gaultier—proposed an interest-free loan for young couples that would convert into a subsidy if the couple had three children.Footnote 32 Similarly, in Germany, the Alternative für Deutschland (AfD), an extreme right party and former partner of Rassemblement National and Fratelli d’Italia within the ID group at the European Parliament before its recent exclusion, proposed a policy very similar to that advocated by Orbán and Le Pen.Footnote 33
CONCLUSION
Fascist regimes and extreme right parties place significant emphasis on the family as an institution and on high fertility of native nationals as a means of perpetuating a certain population and traditional values. We argue that placing excessive social and economic pressure on single individuals to marry can lead to a backlash that renders family policies ineffective, if not counterproductive. This backlash results from negative selection in the marriage market. We use Nazi Germany as a case study to provide causal evidence for our claim.
Across different periods and European regions, systems of interest-free loans, with the birth of children reducing the amount to be repaid, were central to the family policies of these regimes. This system was systematically integrated with other pronatalist measures, such as child allowances and tax cuts, particularly targeted at large families. In Nazi Germany, this policy, known as the LEM, was the flagship measure to promote German families. While disentangling the effects of each component of the family policy package offered by extremist regimes is challenging, we propose an identification strategy to determine that the populations targeted by these policies in general, and the loan offer in particular, are responsible for the backlash. In the case of Germany, we show that although the Nazi family policy package temporarily increased the fertility of German women, it ultimately depressed the fertility of fully treated women relative to partially treated women.
Our results challenge the vision of family policies defended by extreme regimes: the pressure they exert on their population to marry worsens the matching process in the marriage market and jeopardizes the quality of marriages. Even if the pressure is not as extreme as in the Third Reich, it can still undermine the effectiveness of pronatalist policies.
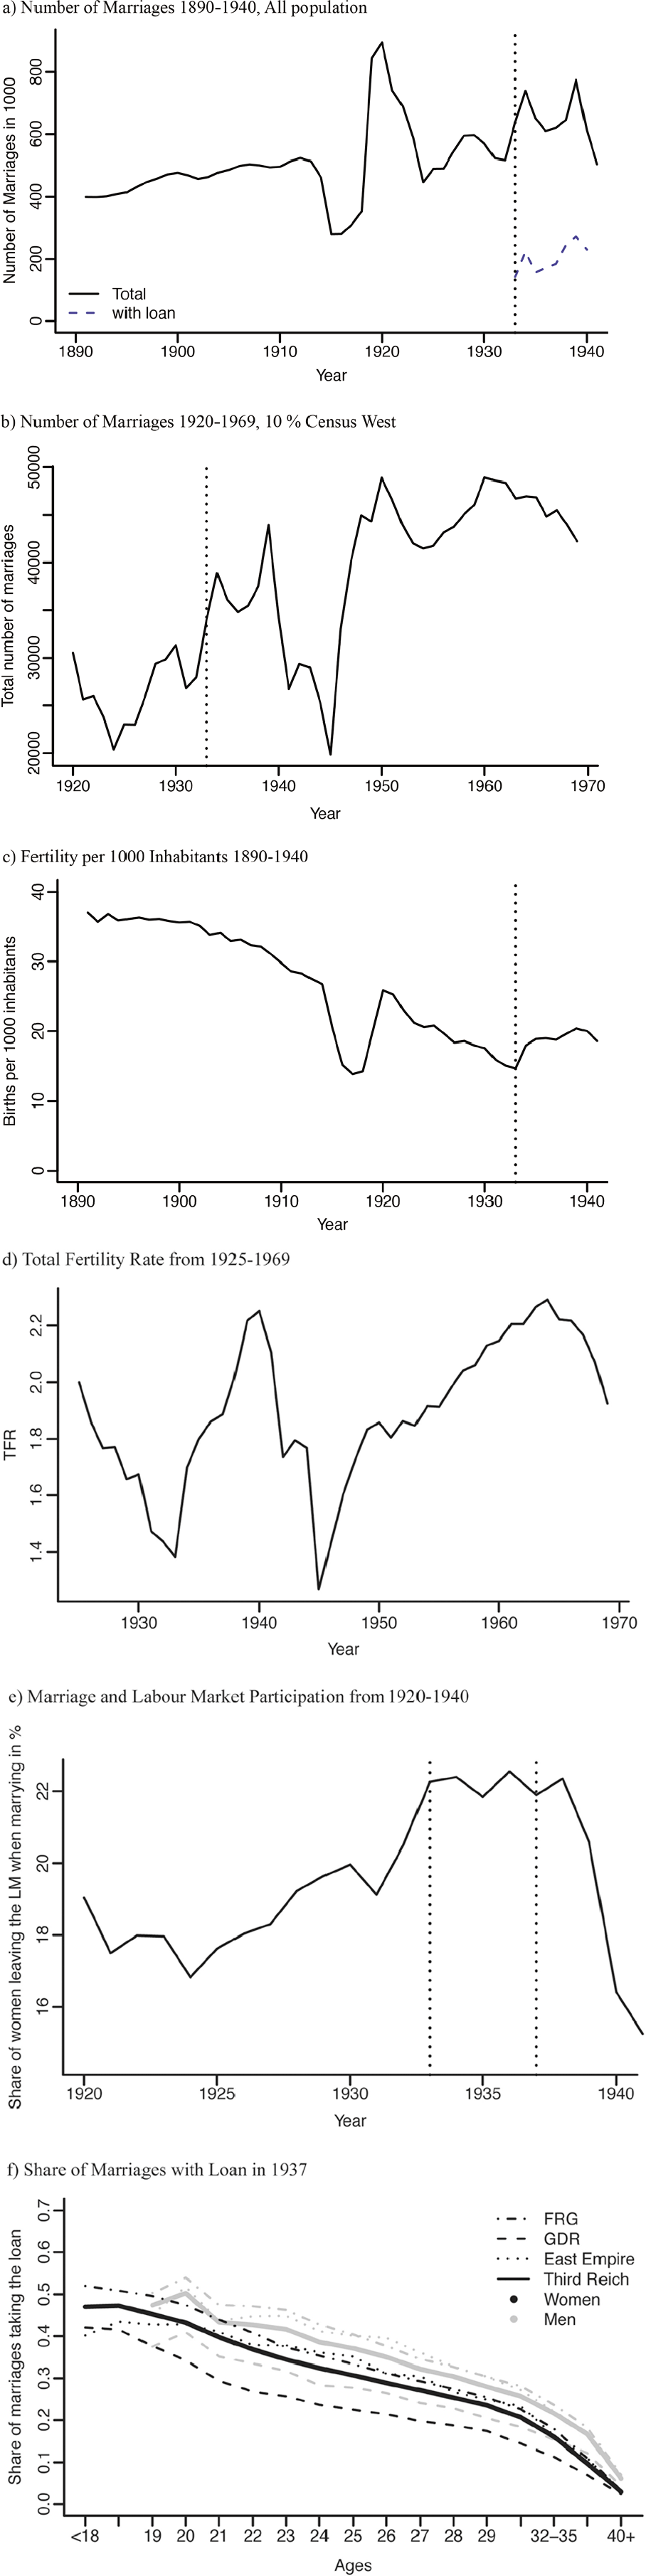
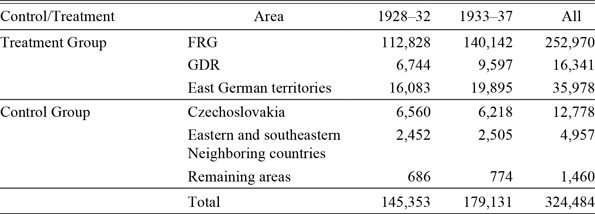
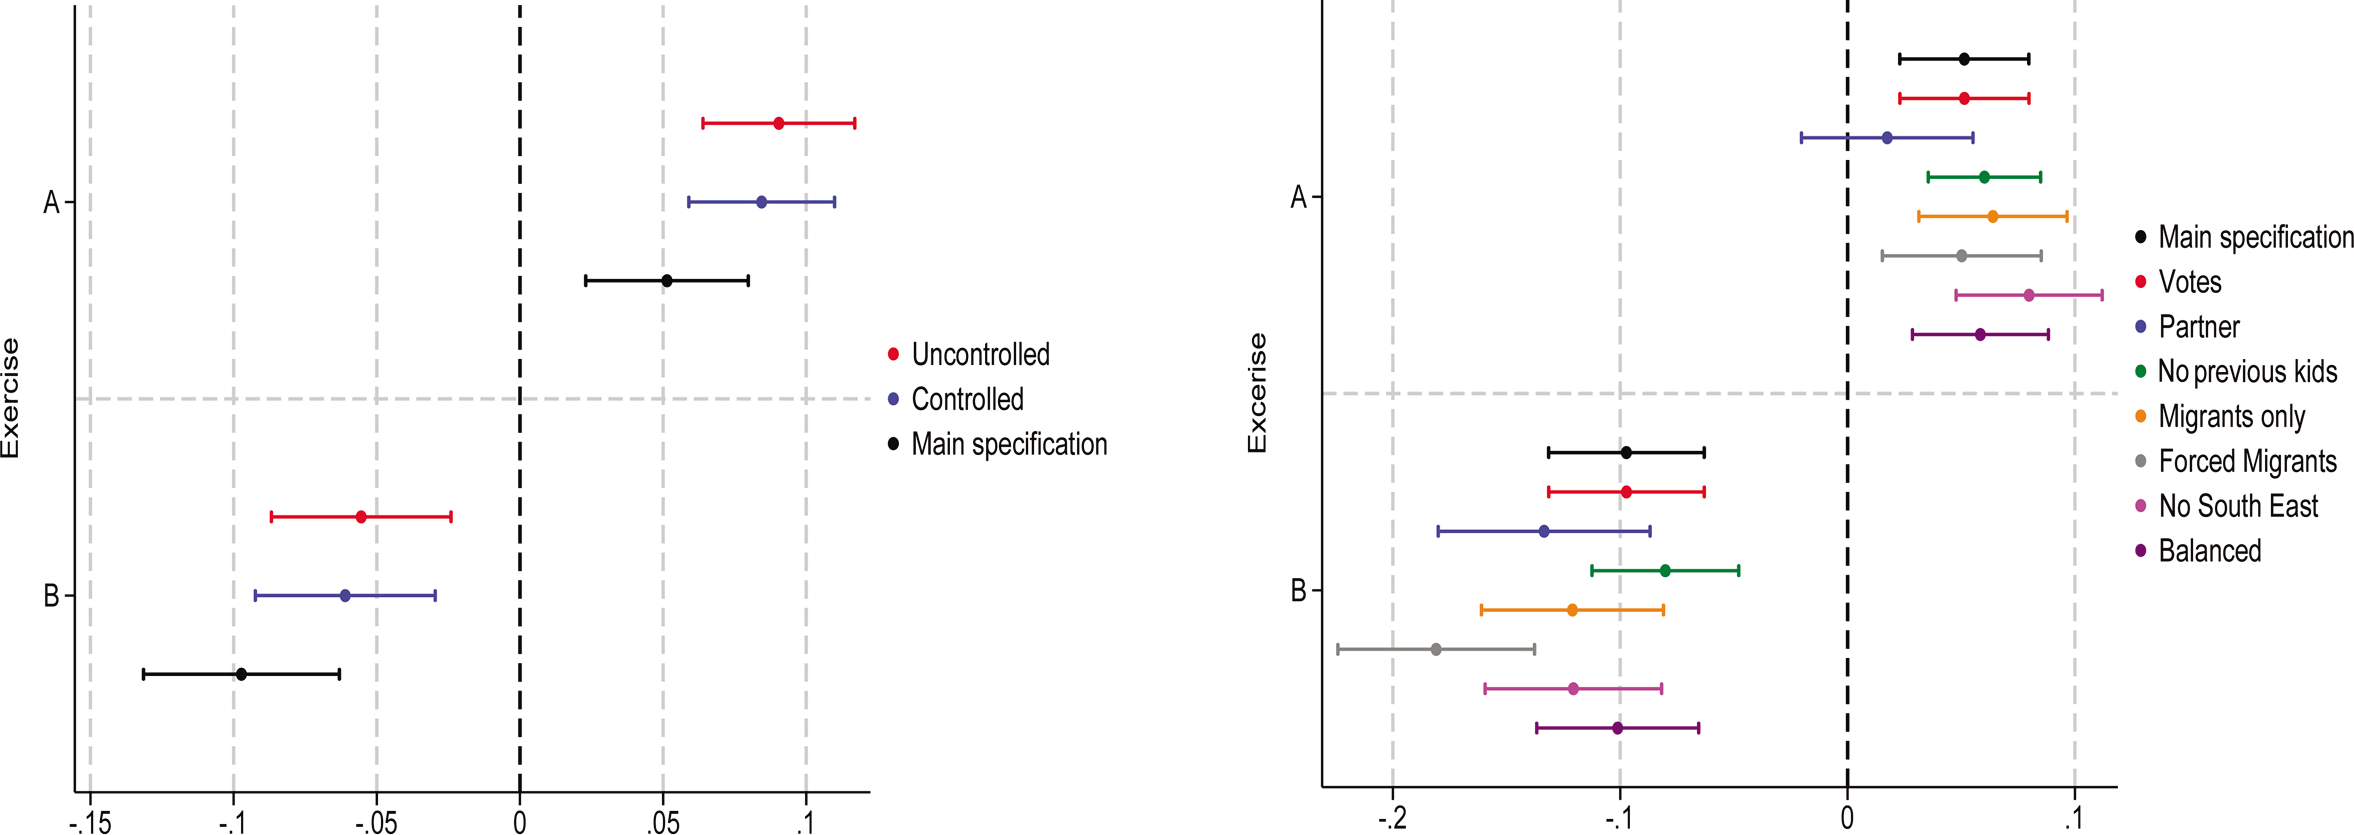
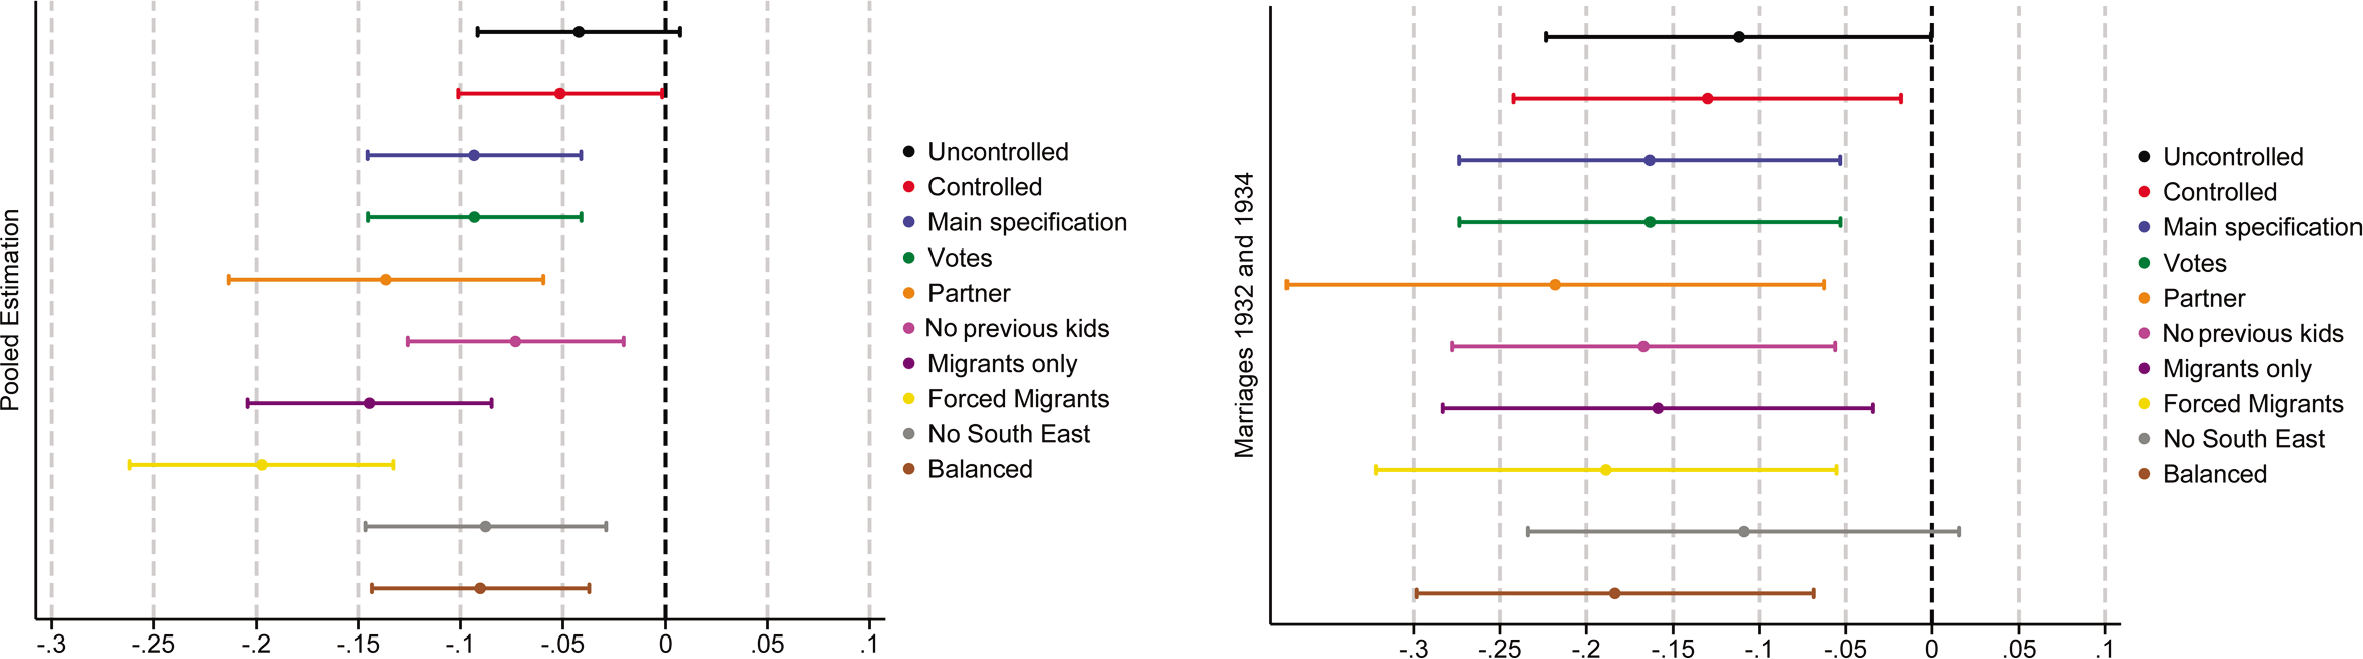
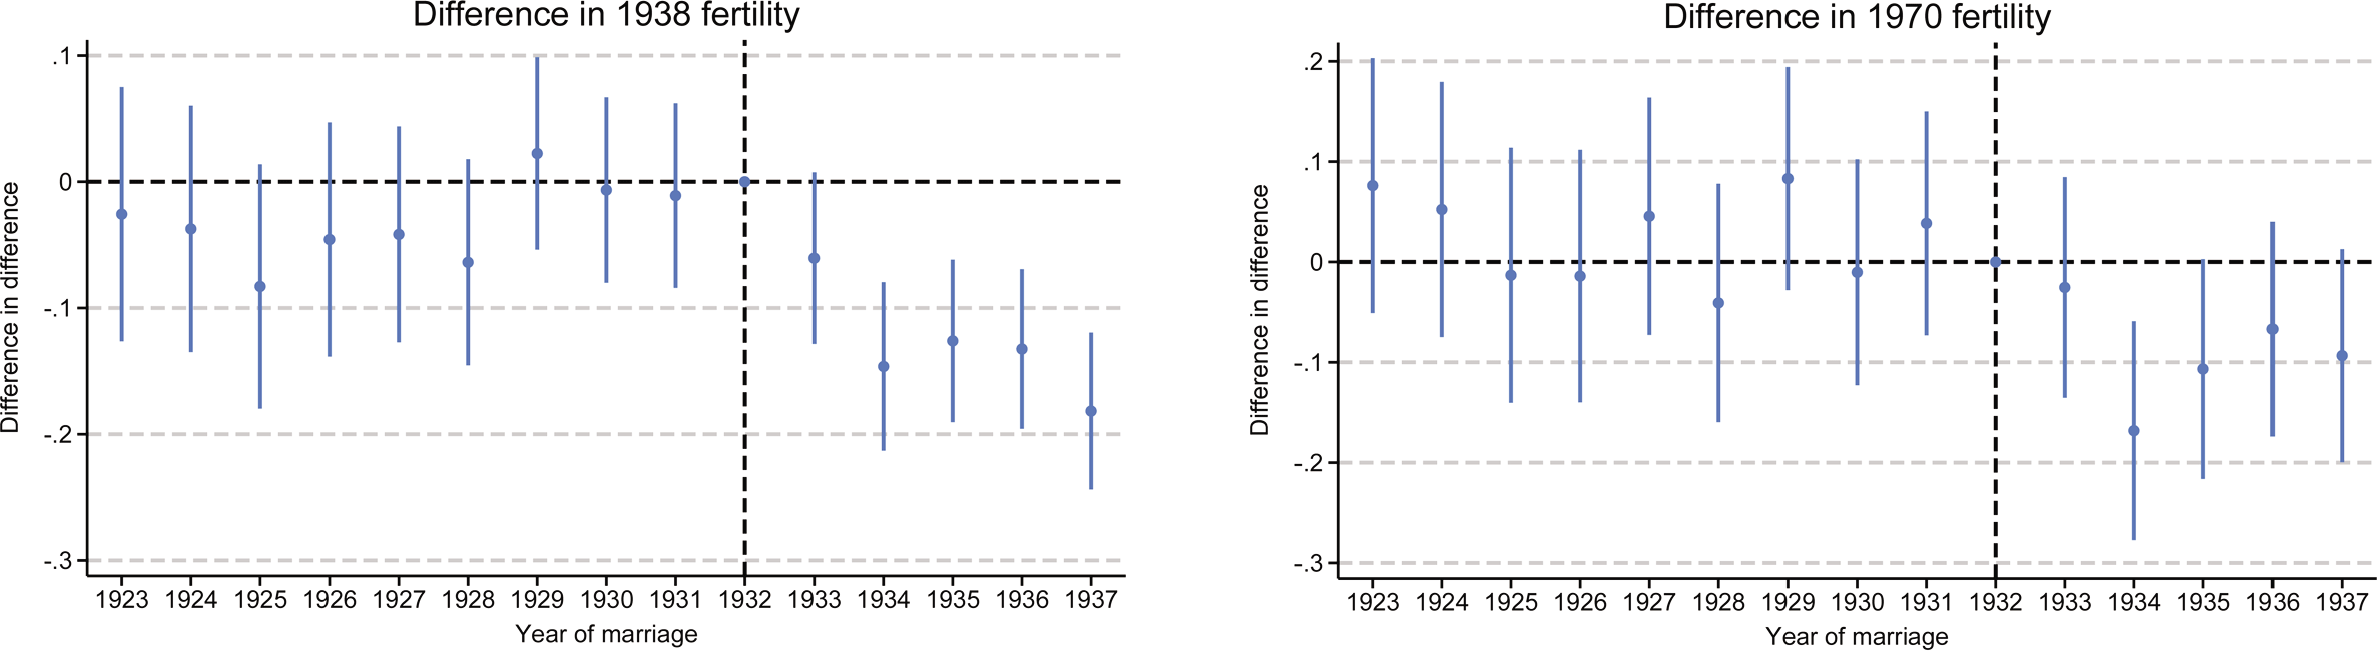
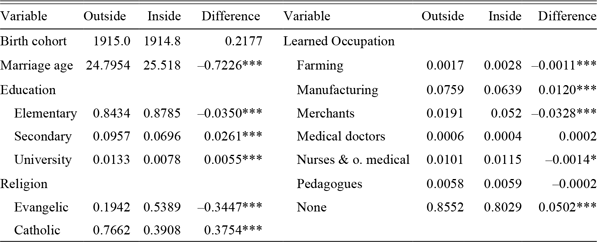
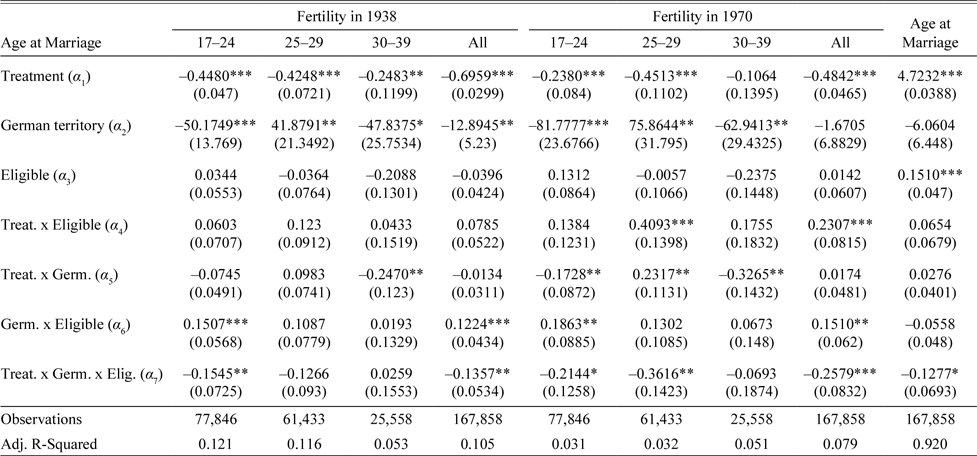
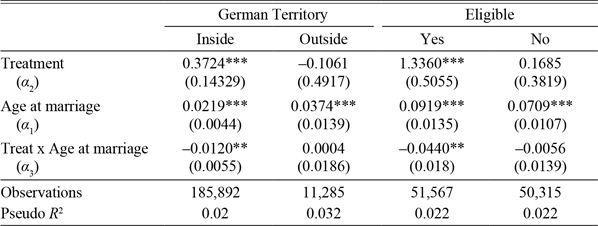


 Open access

