

The increased application of gender quotas has significantly increased the representation of women in parliaments worldwide, but women MPs often remain outnumbered by men (Dahlerup Reference Dahlerup2006; Franceschet, Krook and Piscopo Reference Franceschet, Krook and Piscopo2012; Krook Reference Krook2010). There is an increasing awareness that this is partially due to gendered financial inequalities, as women have less access to financial resources and therefore spend less on their political campaigns. Recent studies indicate, further, that the introduction of quotas coincides with an increase of this gender gap in campaign finance (Buckley and Mariani Reference Buckley and Mariani2021; Smulders, Put and Maddens Reference Smulders, Put and Maddens2019).
Focusing on gendered political finance aligns closely with literature on feminist institutionalism. This approach emphasizes the significance of informal rules and procedures alongside formal ones. A quota rule constitutes a formal regulation shaping candidate selection practices in parties and obliging male dominated elites to put more women on party lists. However, this formal arrangement can be thwarted by sticky masculinist party practices counteracting the increased presence of women among candidates and hindering their political careers (Bjarnegård and Kenny Reference Bjarnegård and Kenny2016; Kenny Reference Kenny, Krook and Mackey2011). One informal mechanism counteracting the impact of formal quota is a tendency among party selectorates to put women in non-winnable positions, merely to comply with quota rules. As a result, both women and party elites might logically decide not to waste money on a seemingly lost cause (Wylie Reference Wylie2020, 127).
Another informal gendered practice is a tendency among party elites to give more financial support to men’s than to women’s election campaigns (Janusz, Barreiro and Cintron Reference Janusz, Barreiro and Cintron2021). In so doing, they do not compensate for, but instead reinforce, the gendered financial disadvantages to which women candidates are prone. Studies show that corporate donors, in particular, are loath to fund women candidates (Sacchet Reference Sacchet2018). In addition, women candidates generally spend less from their own or their family’s fortune due to their economically weaker position, as well as gendered norms and stereotypes that are unsupportive of women’s leadership (Piscopo et al. Reference Piscopo, Hinojosa, Thomas and Siavelis2022).
Even so, it is also possible that quota regulations, while widening the gender gap in the short run, will in the long run lead to a normalization of women in politics, involving a gradual fading out of gendered financial inequalities. Women candidates, whether elected or not, should gradually gain experience and credibility, build political networks, collect electoral capital, and eventually overcome gendered disadvantages with regard to campaign finance. In other words, even though the gender gap increases immediately after the “quota shock,” these disparities will gradually narrow over time. Despite growing literatures on gender quotas as well as gendered political finance, this possibility has not been explored in prior research.
To investigate this question, detailed data on campaign expenditures over a sufficiently extended period are needed, encompassing a timeframe extending from before the introduction of quotas to a significant duration thereafter. In this regard, Belgium presents a unique case, as such data are available spanning a 20-year period, covering elections before the introduction of strict quotas and a substantial post-quota period. This dataset enables, for the first time, an examination of the impact of quota introduction on the gender gap in political finance, in both the short- and the long-term.
In this article, we utilize data on the individual campaign expenses and funding sources of 11,897 candidates between 1999 and 2019. A strict 50:50 quota rule was introduced in Belgium from the 2003 election onwards. A multivariate analysis of this unique dataset provides strong new evidence of the gender gap in campaign spending. We find that this gap appears after the introduction of strict quotas but is limited mainly to non-incumbents. It is only in the long run, after 16 years, that the gender gap appears to narrow, although it never completely disappears. Regarding the funding of the campaigns, we also confirm that women draw significantly less money from their personal wealth and receive less money from their parties when strict quotas are in place.
Gender and Campaign Finance
The relationship between campaign finance and gender was first studied in the United States. This research finds, quite consistently, that campaign expenses and fundraising capacities are not related to gender (Adams and Schreiber Reference Adams and Schreiber2011; Hogan Reference Hogan2007; Jenkins Reference Jenkins2007; Werner Reference Werner1997). In one recent study women candidates were even found to spend more than men (Fulton and Dhima Reference Fulton and Dhima2021). Even so, current research from an intersectionality perspective has shown that women of color are disadvantaged with respect to fundraising in comparison to white women (Grumbach, Sahn, and Staszak Reference Grumbach, Sahn and Staszak2022; Sorensen and Chen Reference Sorensen and Chen2022).
The scientific interest in campaign finance and gender outside the United States is more recent. These studies lead to different results. Women candidates are consistently shown to spend less than men in Switzerland (Engeli and Lutz Reference Engeli and Lutz2014), Chile (Gamboa and Morales Reference Gamboa and Morales2021), Belgium (Wauters, Weekers, and Maddens Reference Wauters, Weekers and Maddens2010; Smulders, Put, and Maddens Reference Smulders, Put and Maddens2019), Ireland (Buckley and Mariani Reference Buckley and Mariani2021), and Colombia (Maddens, Muyters, and Put Reference Maddens, Muyters and Put2023). Data also show that women candidates obtain less funding in Brazil (Speck and Mancuso Reference Speck and Mancuso2014, 46; Sacchet Reference Sacchet2018) and Mexico (Ramírez Reference Mendieta2020).
Evidence suggests that these gender gaps increase when quotas are in place. In Belgium, the gender gap increased when a strict parity rule was introduced, from the 2003 election onwards (Smulders, Put, and Maddens Reference Smulders, Put and Maddens2019). In Ireland, the gender gap only came into being in the 2016 election, the first one with quotas (Buckley and Mariani Reference Buckley and Mariani2021). In Brazil (Sacchet Reference Sacchet2018) and Chile (Gamboa and Morales Reference Gamboa and Morales2021), the gap increased significantly in 2014 and 2017, respectively. In Colombia, the gender gap is limited to the larger constituencies with quotas, while it is non-existent in the smaller ones without quotas (Maddens, Muyters, and Put Reference Maddens, Muyters and Put2023).
This quota effect offers a clue as to the underlying cause of the gender gap in campaign finance. One of the most plausible reasons why women spend less is that they often have to run in non-winnable electoral districts and list positions. If women have little chance of being elected, it is a rational decision on their part to engage less in fundraising and to run less expensive campaigns (Wylie Reference Wylie2020, 127). This may be related to the fact that women politicians have been shown to be more risk-averse than men (Murray Reference Murray2021). Women candidates also appear to perceive their electoral odds more skeptically, in the sense that they are more critical of their electoral chances and therefore more inclined to limit their expenses (Fulton et al. Reference Fulton, Maestas, Maisel and Stone2006).
The introduction of quotas often increases the number of “symbolic” woman candidates, or “sacrificial lambs,” which are only put on the list in order to comply with quota requirements, without any realistic chance of obtaining a seat (Luhiste Reference Luhiste2015). At the same time, quota rules also involve the deselection of men candidates. It appears logical that parties will retain men with considerable fundraising and spending capabilities, while removing the more mediocre ones. That was, for instance, the case after the introduction of a quota system with a zipper placement rule in Sweden (Besley et al. Reference Besley, Folke, Persson and Rickne2017). If only the high quality men are kept on the list, we can expect that the average expenses of men candidates will increase, further widening the gender gap.
If this line of reasoning holds, the gender gap should disappear for candidates in winnable positions, both before and after the introduction of quotas. This would be the case for incumbents, who normally occupy positions on the list with realistic chances of election. This expectation is consistent with past research showing that gender gaps in political finance tend to disappear amongst incumbents and are mainly limited to non-incumbents, as seen in the cases of Brazil (Wylie Reference Wylie2020, 130–3), Colombia (Maddens, Muyters, and Put Reference Maddens, Muyters and Put2023), Ireland (Buckley and Mariani Reference Buckley and Mariani2021, 8), and Italy (Feo, Fiorelli, and Piccio Reference Feo, Fiorelli and Piccio2021, 10–1). In Chile, the gender gap is even reversed amongst incumbents, with women candidates spending more than men (Gamboa and Morales Reference Gamboa and Morales2021, 264–5).
After the initial “quota shock,” we might expect these gaps to fade out. However, whether this occurs will arguably depend on the turnover among new women candidates. If women candidates are constantly replaced, women politicians will not be able to gradually build political and electoral networks needed for political fundraising. At least in Belgium, this pessimistic scenario has not materialized. In general, women politicians survive longer as candidates than men, and after the introduction of gender quotas their careers become even longer (Muyters, Put, and Maddens Reference Muyters, Put and Maddens2022). This suggests that, after the initial “quota shock,” gendered finance patterns will normalize and the spending gap will gradually disappear.
Summing up, these arguments generate the following four hypotheses with regard to gender and campaign expenditures:
H1: There is a gender gap in campaign spending, in the sense that women on average spend less than men.
H2: The gender gap is limited to non-incumbents.
H3: In the short run, this gender gap will increase after the introduction of gender quotas.
H4: In the long run, this gender gap will decrease again after the introduction of gender quotas.
These hypotheses assume that women candidates make deliberate decisions to spend less, probably because they consider their chances of winning too small. However, it is also possible that the main cause of the gender gap is to be found at the income side. For various reasons, women candidates may have less access to campaign funding. Evidence from the global South corroborates this intuition, finding that women often have lower wages and are inhibited from spending their own or their family’s wealth, due to gendered social norms (e.g., Piscopo et al. Reference Piscopo, Hinojosa, Thomas and Siavelis2022,14–5; Wylie Reference Wylie2020, 127–30). Moreover, Piscopo et al. (Reference Piscopo, Hinojosa, Thomas and Siavelis2022) have shown that, in Chile, men candidates draw more financial means from their personal fortune than women.
Women also appear to be disadvantaged with regard to private donations. Donors, mostly men, are often prone to gendered prejudices, as shown in the case of Chile (Piscopo et al. Reference Piscopo, Hinojosa, Thomas and Siavelis2022). But the most robust finding in this respect concerns corporate funding. Many scholars observe that women have less access to large political and financial networks as well as to the business community (Casas-Zamora and Falguera Reference Casas-Zamora and Falguera2017, 27–31; Hillman Reference Hillman2018, 330; Hinojosa and Vázquez Correa Reference Hinojosa, Correa, Freidenberg, Caminotti, Muñoz-Pogossian and Došek2018, 46–7; Muñoz-Pogossian and Finn Reference Muñoz-Pogossian, Finn, Došek, Freidenberg, Caminotti and Muñoz-Pogossian2017, 181;). In Brazil (Sacchet Reference Sacchet2018) and Colombia (Maddens, Muyters, and Put Reference Maddens, Muyters and Put2023), the gender gap is broadest for corporate donations. At the same time, some studies suggest that the disadvantage with regard to corporate donations is counterbalanced by a stronger ability of women to collect small campaign donations from a large number of individual donors. In Italy, men are generally financed from a limited number of corporations, while women report more small donations from individuals. This is related to a stronger local embeddedness of the women, according to the candidates themselves (Feo, Fiorelli, and Piccio Reference Feo, Fiorelli and Piccio2021, 3). In the same vein, in Colombia, the gender gap was found to disappear for individual donations (Maddens, Muyters, and Put Reference Maddens, Muyters and Put2023).
Of course, a slight advantage for women candidates in terms of individual donations will never undo the substantial gap between women and men with regard to corporate donations. Political parties, however, have the capacity to restore the financial balance by transferring campaign money to women candidates, especially in countries with proportional representation electoral systems. Therefore, one proposed gender-targeted funding scheme involves requiring parties to financially support women candidates with the public subsidies they receive (Ohman Reference Ohman2018,12–3). But such measures are seldom applied. In practice, party elites are prone to the same gendered dynamics as corporations, and women are often denied access to party networks. When allocating resources, male dominated party elites generally prefer experienced politicians and incumbents, who are as similar to themselves as possible (Janusz, Barreiro, and Cintron Reference Janusz, Barreiro and Cintron2021, 3). This can be considered another instance of outgroup bias stemming from the historical lack of diversity within the decision-making bodies of political parties (Martínez-Cantó and Verge Reference Martínez-Cantó and Verge2023). As a result, party elites either refuse to neutralize gendered inequalities (Murray Reference Murray2021, 9–10 [on the UK]; Ohman Reference Ohman2018; Piscopo et al. Reference Piscopo, Hinojosa, Thomas and Siavelis2022 [on Chile]), or actively reinforce them, as has been found to be the case in Brazil (Janusz, Barreiro, and Cintron Reference Janusz, Barreiro and Cintron2021; Vallejo Reference Vallejo2024; Wylie and Dos Santos Reference Wylie and Santos2016, 436–7) and Colombia (Maddens, Muyters, and Put Reference Maddens, Muyters and Put2023). One of the scarce exceptions appears to be Ireland, where women receive twice as much financial aid from the parties than men (Buckley and Mariani Reference Buckley and Mariani2021, 8).
Because private donations are an extremely marginal funding source for Belgian candidates, we will not test the effects of private donations on the basis of the Belgian data. This leaves us with two hypotheses related to the gendered funding of political campaigns:
H5: Women candidates draw less funding from their personal wealth than men.
H6: Women candidates receive less money from their parties than men.
Elections, Gender Quotas and Campaign Finance in Belgium
We test these hypotheses using data about the Flemish candidates in the Belgian federal elections (elections to the Lower Chamber and until 2010, to the Senate) as well as in the Flemish regional elections. Data about campaign expenses and funding resources are available from the 1999 election onwards. These data pertain to six federal elections and five regional elections (three of which were held concurrently with the federal one).
All these elections were held under a similar flexible-list proportional representation system. Voters have the option to cast a vote for the entire list as presented by political parties or a preference vote for one or more candidates of the same list. The allocation of the seats to the candidates is largely determined by the order on the list. Apart from the effective candidates on the list (equaling the number of seats in the constituency), there are also successor candidates (equaling about half the number of seats in the constituency), for which the voters can also cast preference votes. When an elected MP resigns or becomes a minister, he or she is replaced by the highest ranked candidate on the successor list.
A first modest quota rule was applied in the 1999 elections. At least one-third of the candidates on the list had to be women, a percentage that was already attained by most parties in 1995. It was only from the 2003 election onwards that a parity rule was applied. Also, in 2003 the law stipulated that at least one of the top three candidates had to be a woman, and from 2007 onwards a woman had to be at least one of the top two candidates. These rules have led to a steady increase of woman MPs in the federal parliament, for instance, from 12% in 1995 to 41.3% in 2019 (Celis and Meier Reference Celis and Meier2006; Meier Reference Meier2012).
In the three months (four months from 2019 onwards) before the election, parties and candidates are subject to a strict spending cap. Ordinary effective candidates may spend 5,000 euros at most and successor candidates (with the exception of the first one) only 2,500 euros. A limited number of so-called first-placed candidates can spend a higher amount, which depends on the number of voters in the district. For example, such a candidate in the largest district of Antwerp could spend 54,278 euros in 2019, against only 30,916 euros in the much smaller district of Limburg. The number of highest placed candidates equals the number of seats obtained by the list at the previous election plus one. Only 13.5% of the candidates are first placed candidates, the vast majority of which (62.2%) are incumbents. Amongst the non-incumbents, only 6.2% were allowed to spend the highest maximum, against 66% amongst the incumbents.
Corporate donations for parties and candidates are explicitly forbidden. Individuals can donate only a limited amount of 500 euros per candidate or party per year, and 2,000 euros for all candidates and parties together. The identity of donors of 125 euros or more must be reported to the parliamentary Control Commission but is not made public. As a result of these restrictions, only a marginal part of the campaign is funded with private donations, as will be seen below. In contrast, parties can freely transfer funds to individual candidates. These transfers constitute the main funding source of candidates. This is related to the fact that the campaign spending cap for parties (one million euros) is relatively low in comparison to the abundant public subsidies which they receive. The surplus money which they cannot spend on their own campaign is transferred to the candidates. In practice, party funding covers the share of the candidate in the joint campaign at the level of the constituency (Maddens, Smulders, and Wolfs Reference Maddens, Smulders and Wolfs2019).
Parties and candidates have to disclose their campaign expenses to the parliamentary Control Commission. From 1999 onwards, they also have to disclose their funding sources. These disclosure reports can be consulted by the voters during a limited period after the election, which enabled us to collect the data used in this investigation. The official report published by the Control Commission only includes the total expenses per party and the individual expenses of the elected candidates.
The campaign expenses of individual candidates have a significant effect on the number of preference votes. Candidates obtain a better electoral score to the extent that they invest more in absolute terms, but also to the extent that they spend a larger share of the total campaign expenses at both the list and the constituency level (Maddens and Put Reference Maddens and Put2013; Vanden Eynde and Maddens Reference Vanden Eynde and Maddens2023). On the other hand, spending more does not increase the odds of actually obtaining a seat. This is due to the flexible or semi-open character of the Belgian list system, which results in an overwhelming effect of the list position on the odds of being elected, as already mentioned. Even so, there is a strong incentive for candidates to spend more and in doing so, increase the number of preference votes. In this way, candidates can rise in the pecking order within the party and increase their chances of obtaining a higher position on the list at the next election (André et al. Reference André, Depauw, Shugart and Chytilek2017). Hence, gender disparities in campaign expenses arguably have adverse effects on the careers of women politicians in Belgium, as they result in poorer electoral outcomes, and in the long run, impede the attainment of more electable list positions.
Data
Our units of analysis are the candidates in the 11 elections held between 1999 and 2019. We collected data on campaign expenses and funding sources for the 11,897 candidates of the six political parties in the region of Flanders, which held seats in each of the parliaments during the entire 1999–2019 period (supplemental material Table A).Footnote 1 All amounts are expressed in euros and in prices of April 2023, based on the Belgian consumer price index.
The expenditures of candidates can be expressed in absolute or in relative terms. A straightforward relative measure is the cost per registered voter, which controls for the differences in district magnitude. An alternative way of standardizing the expenses across districts is to calculate the share which each candidate spends of all the expenses paid by the candidates in the constituency (Benoit and Marsh Reference Benoit and Marsh2008; Speck and Mancuso Reference Speck and Mancuso2014, 39–40). As this share is highly dependent on the number of candidates, we divide it by the expected share if expenses were distributed equally across all candidates in the constituency.
For instance, in a constituency with only two candidates, where the first spends 70% and the second 30%, the standardized expense of the first candidate at the constituency level is 70/50 = 1.4, and of the second candidate 30/50 = 0.6. In other words, this hypothetical second candidate only spends 60% of what we would expect if expenses were distributed equally across all the candidates of the constituency. We can also control for differences between lists, for example between marginal and strong lists, by standardizing at the list level. This means that we calculate to what extent a candidate spends relatively more or less than the other candidates on the same list. In order to check the robustness of our findings, we will use all four measurements of the spending variable in the analysis: the absolute expenses, the relative expenses, and standardized measures at the constituency and at the list levels.
As regards the funding sources of the campaign, the disclosure reports of the candidates allow us to distinguish between the personal funds of the candidate, donations by individuals, and transfers from the party. As a candidate normally spends the entire reported income, there is no need to distinguish between total income and total expenses in the analysis. The funding variables are treated in the same way as the spending variable. For each of the categories, we have four measurements: the absolute amount (for instance, the party funding for a candidate), the relative amount (the party funding per registered voter in the constituency), the standardized amount at the constituency level, and the standardized amount at the list level. For the latter two measurements, we add the total amount of party transfers in the constituency (or the list) and calculate the share of this total amount which the candidate has received.
The crucial independent variables are gender and quota rules. For the latter variable, we will distinguish between three different periods. The first is the period with mild rules, which includes only the 1999 concurrent federal and regional elections. The second period starts with the introduction of the strict parity rule in 2003 and the elections immediately afterwards, the regional elections of 2004 and 2009, and the federal elections of 2007 and 2010. The third period starts 11 years after the introduction of the strict parity rule and includes the 2014 and 2019 concurrent federal and regional elections.
Incumbents are candidates who were an MP during the preceding legislature in either the federal, regional, or European parliament. In other words, if a candidate runs for the federal Chamber but was an MP in the Flemish Parliament during the preceding legislature, he or she is still considered an incumbent. In Belgium, candidates often make switches between federal and regional parliaments. The fact that the elections for these parliaments often concur facilitates such level hopping. Candidates can easily transfer the incumbency advantages from one parliament to another. Also, because there is not really a political hierarchy between these assemblies, there is no need to take into account the parliament where the incumbent comes from (Vanlangenakker, Maddens, and Put Reference Vanlangenakker, Maddens and Put2013). Of all the candidates in the dataset, 13.5% are incumbents. Finally, we control for party by including a dummy for each of the six parties except one, as well as for constituency size, by including the logged number of registered voters.
Results
The Spending Gap
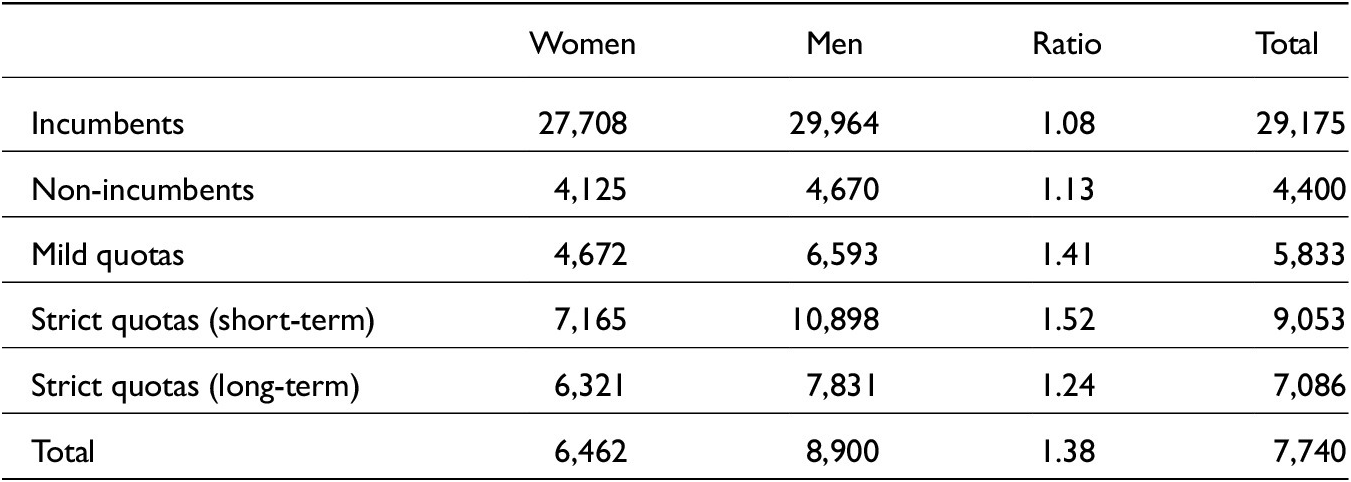
A simple descriptive analysis provides preliminary support for H1 about the gender gap in spending. The average man candidate spends 8,900 euros and the average woman candidate 6,462 euros (see Table 1). The gender gap can be measured by calculating the ratio between the men’s and women’s expenses (8,900/6,462), which is 1.38 overall. Expressed in standardized terms, women on average spend 83% of what would be expected if expenses were equally spread over all candidates in the constituency, and men 114%. For brevity’s sake, we do not report the relative and standardized values in the bivariate analysis and use these only in the multivariate analysis.
Average individual campaign expenses (in euros), according to gender, incumbency status, and quotas

Incumbents spend six times as much as non-incumbents, among both women and men. In line with H2, the gender gap is somewhat smaller amongst incumbents (ratio of 1.08) than non-incumbents (1.13), but the difference is small. H3 and H4 appear to be confirmed by this preliminary analysis: after the introduction of strict 50:50 quota rules, the gender gap increased from a ratio of 1.41 to 1.52. In the long run, however, the gap decreased to 1.24, which is lower than during the mild quota period.
Of course, such a simple bivariate comparison of gender gap ratios across quota periods does not take into account that the composition of the group of women candidates is gradually changing as a consequence of the quotas. The percentage of women candidates increases from 39.6% in the first period to about 50% afterwards. More importantly, within this growing group of woman candidates, the percentage of incumbents also increases. While in the mild quota period only 4.6% of the women candidates is incumbent, this percentage increases to 13% in the middle period, and 8.2% in the last period. The multivariate analysis allows us to control for this changing composition of the group of women candidates.
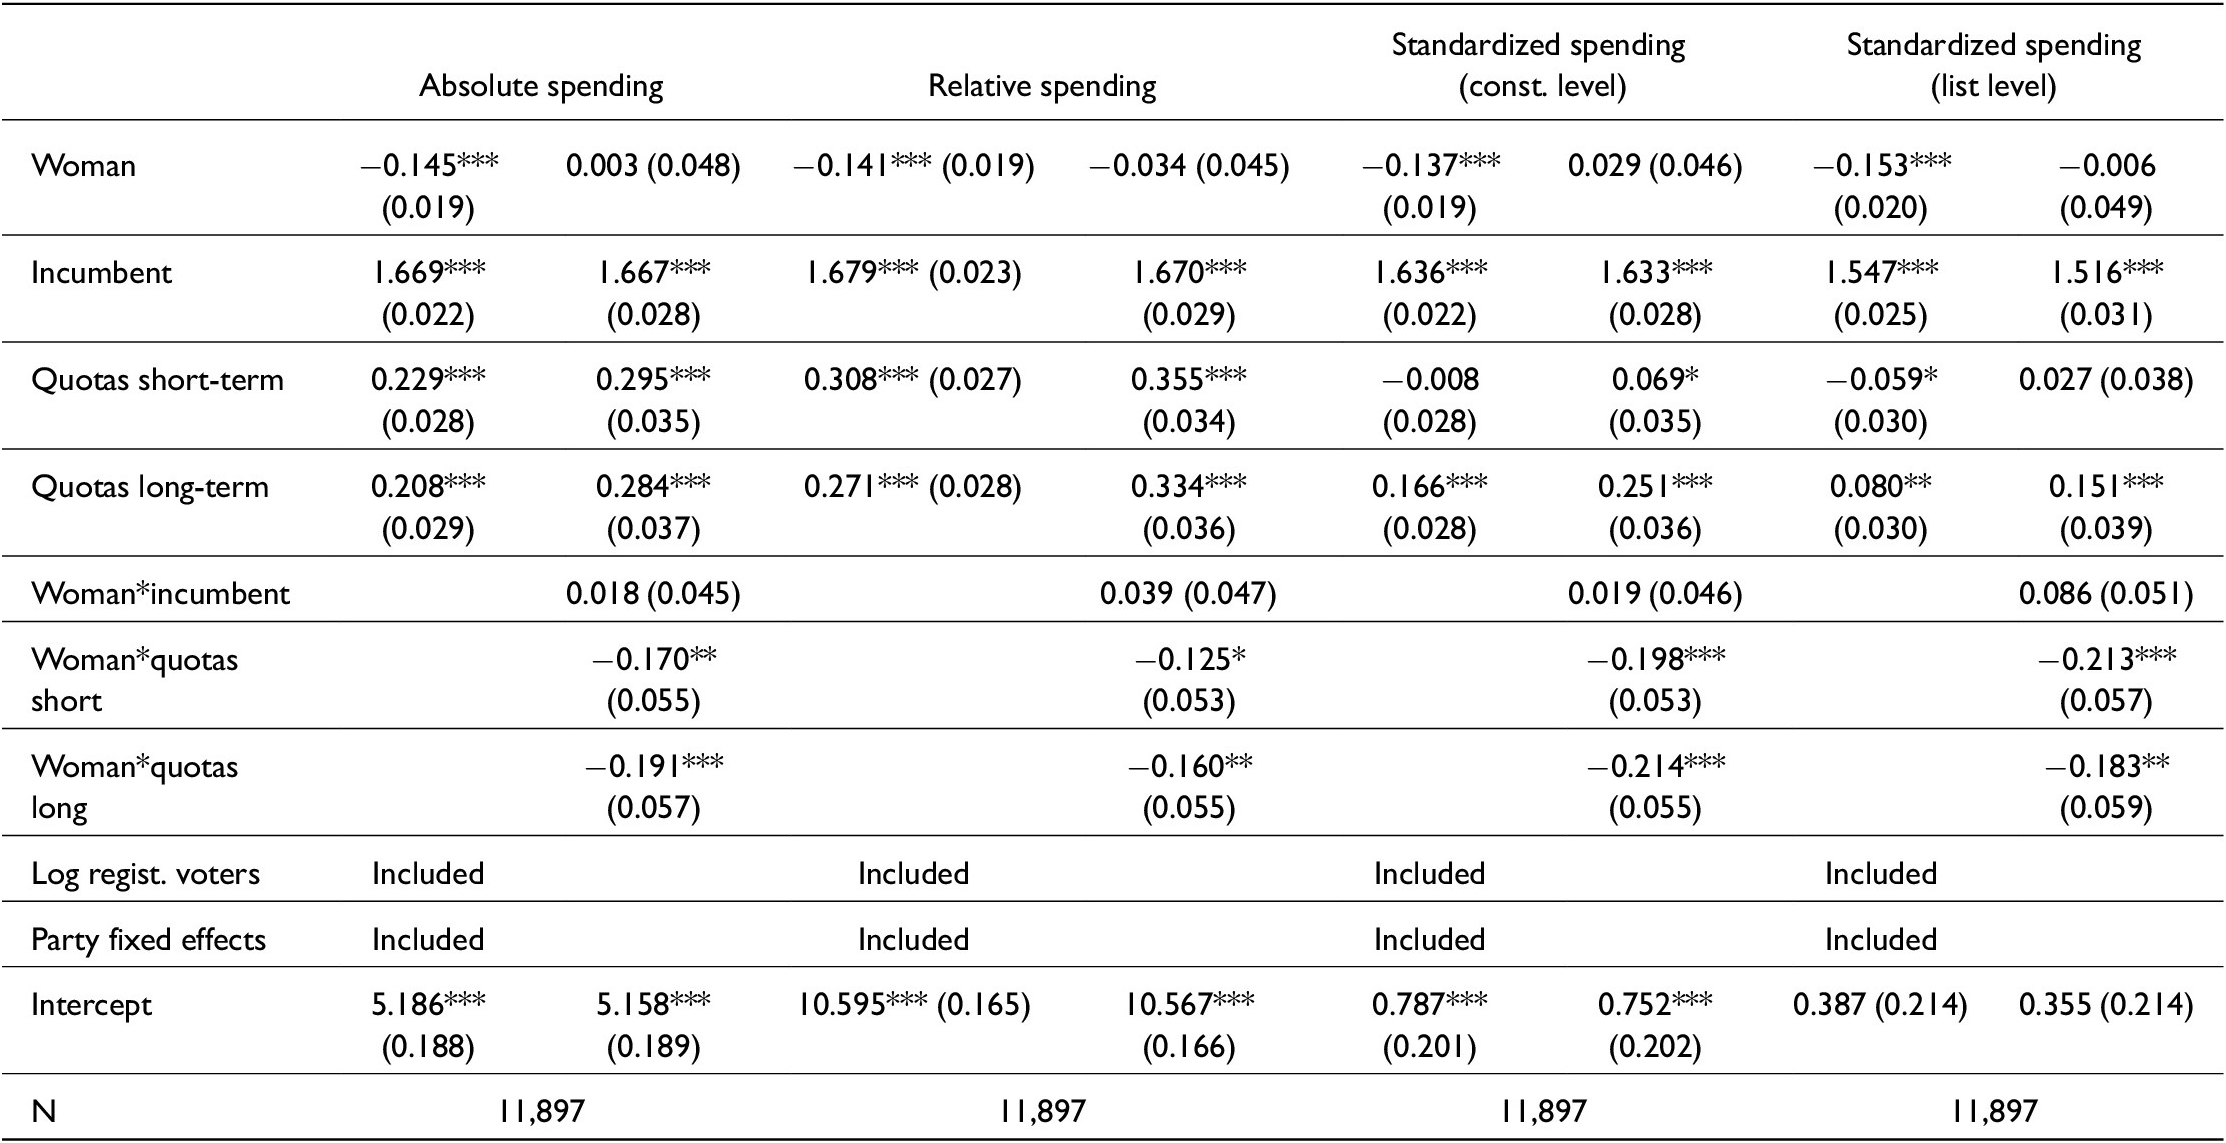
We estimate separate models for each of the four measurements of the spending variable. This dependent variable is semi-continuous, as 10.9% of the candidates declared no expenses and thus have a value of zero. Therefore, we cannot run simple linear regression models, but follow the alternative approach of estimating generalized linear models with a Tweedie distribution, which is a suitable approach to analyze a zero-inflated continuous outcome (Parveen, Mullah, and Ahshanullah Reference Parveen, Mullah and Ahshanullah2016).
The models in the first column for each dependent variable (Table 2) do not include interaction terms and simply estimate the effect of gender on spending, controlling for the other variables. The right column includes the interaction effects. In order to test whether the gender gap is dependent on the incumbency status, we include interactions between this variable and gender. As we are also interested in the impact of quotas on the gender gap, we estimate interactions between gender and the quota period, with the mild quota period being the reference category.
Explaining the level of campaign spending by candidates

Notes: Table reports beta coefficients of a generalized linear model with Tweedie distribution, standard errors between brackets.
* p < 0.05; ** p < 0.01; *** p < 0.001.
The results of the simple models without interactions confirm H1: men spend significantly more than women. These models also show that incumbents spend more. In the models with interactions, the gender effect disappears, while the interactions between gender and the first and second strict quota periods are always significant. The absence of an overall gender effect indicates that there is no gender gap in the mild quota period, which is the reference category. The gender gap only appears in the first strict quota period, as indicated by the significant and negative parameter for all four operationalizations, in line with H3. The interaction between gender and incumbency is never significant, indicating that spending levels do not differ between women and men candidates within the group of incumbents. This confirms H2. In other words, the gender gap is limited to non-incumbents in elections with strict quotas.
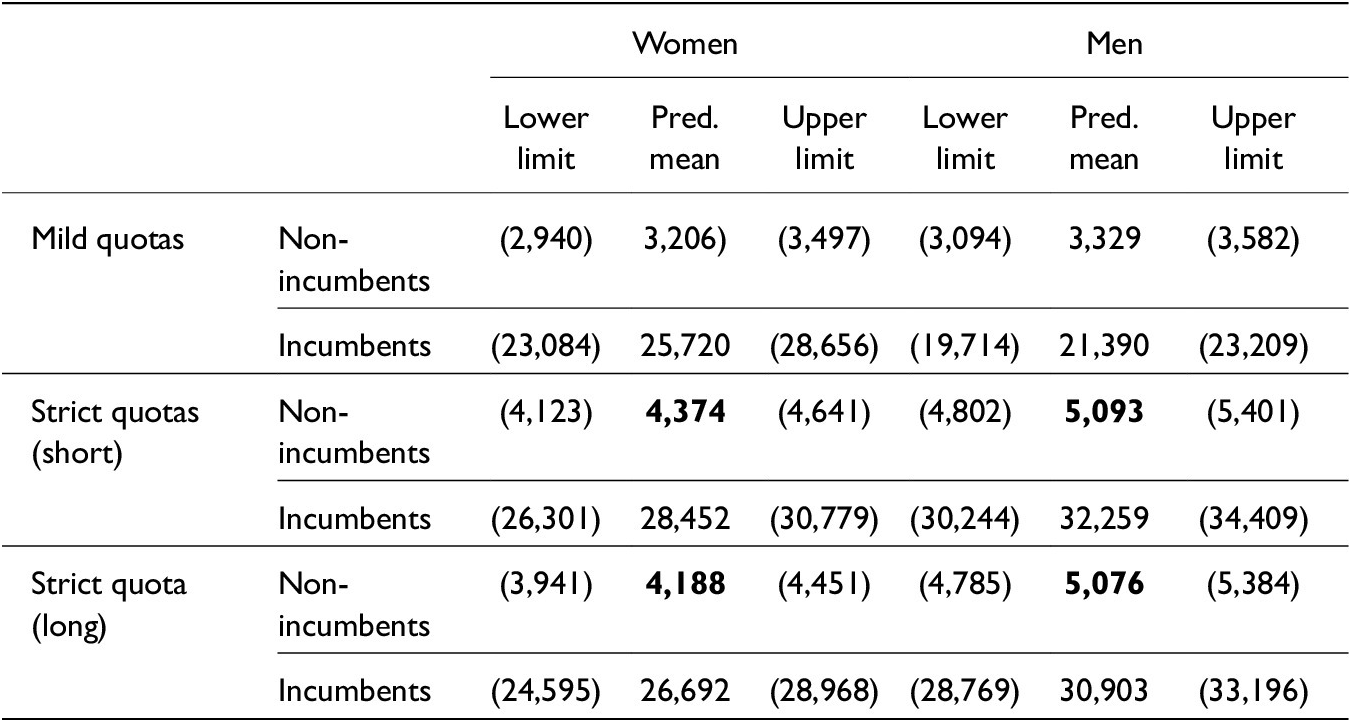
This is also evident from Table 3, showing the mean predicted absolute spending values for the model with interactions, by gender, incumbency, and quota period. It is only in the two strict quota periods that there is a gender gap. During the mild quota period, the spending levels do not significantly differ between men and women, as the confidence intervals overlap. During the next two quota periods, men non-incumbents spend significantly more than women non-incumbents. The spending levels of incumbents, by contrast, do not significantly differ, as the confidence intervals again overlap. In other words, the gender gap is limited to non-incumbents in elections with strict quotas. The predicted values for the other three operationalizations (supplemental material Tables B1, B2, and B3) show similar results, with two exceptions.Footnote 2
Mean predicted values with 95% confidence interval limits (and significant differences in bold), absolute spending, model with interactions

Of course, the strict quota short-term period is quite long — that is, from 2003 to 2010 — involving five elections. One might wonder if the introduction of strict quotas had an immediate effect on the gender gap, or if this took some time. In order to test this, we ran a separate model in which we limited the short term period to the 2003 federal and 2004 regional elections — that is, the first ones at both levels with strict quotas (Table C in the supplemental material). The results are the same, with the exception of the model with the relative expenses as the dependent variable, in which the interaction between gender and the shorter first quota period is insignificant. But the other models indicate that the gender gap effect has kicked in immediately after the introduction of strict quotas.
We had also hypothesized that the gap would disappear in the longer term (H4), but the interaction effect with the second strict quota period remains significant. If we limit the long-term period to the 2019 election — that is, 16 years after the introduction of strict quotas (Table D in the supplemental material) — we find that the interaction parameter with the long-term variable is always lower and not significant with relative expenses as the dependent variable. In other words, there is some evidence that the quota-induced gender gap fades out in the long run, but this “long run” is longer than initially expected.
The Funding Gap
On average, 69% of the expenses of the individual candidates are paid for by the party. The remainder (29.1%) comes almost entirely from the candidate’s private means. Donations are a marginal funding source, covering only 1.1% of the average candidate’s expenses. This limited role of donations is due to the fact that corporate donations are forbidden, as mentioned above. Also, because of the large party transfers to the candidates and the low spending cap, there is no incentive to engage in crowdfunding. In fact, the vast majority of the candidates (95.8%) do not report any donations.
In line with expectations (H5), the average man candidate covers a slightly larger share of the campaign expenses (31%) with his personal means than the average woman (26.9%). Contrary to what was hypothesized (H6), the percentage covered by party transfers is slightly higher for women candidates (71.5%) than for men (66.9%). The absolute amounts of the various funding sources obviously reflects the overall spending gap: the amounts for men are always higher than those for women. This gender gap is smallest for party transfers, with a man receiving on average 6,391 euros and a woman 4,842 euros, yielding a ratio of 1.32. For personal funding, the amounts are 2,283 euros for men and 1,493 euros for women, or a ratio of 1.53.
For the multivariate analysis, we run models with the two main resource categories (personal means and party transfers) in the same way as above. This means that we use the four different measurements of these two funding variables as dependent variables.
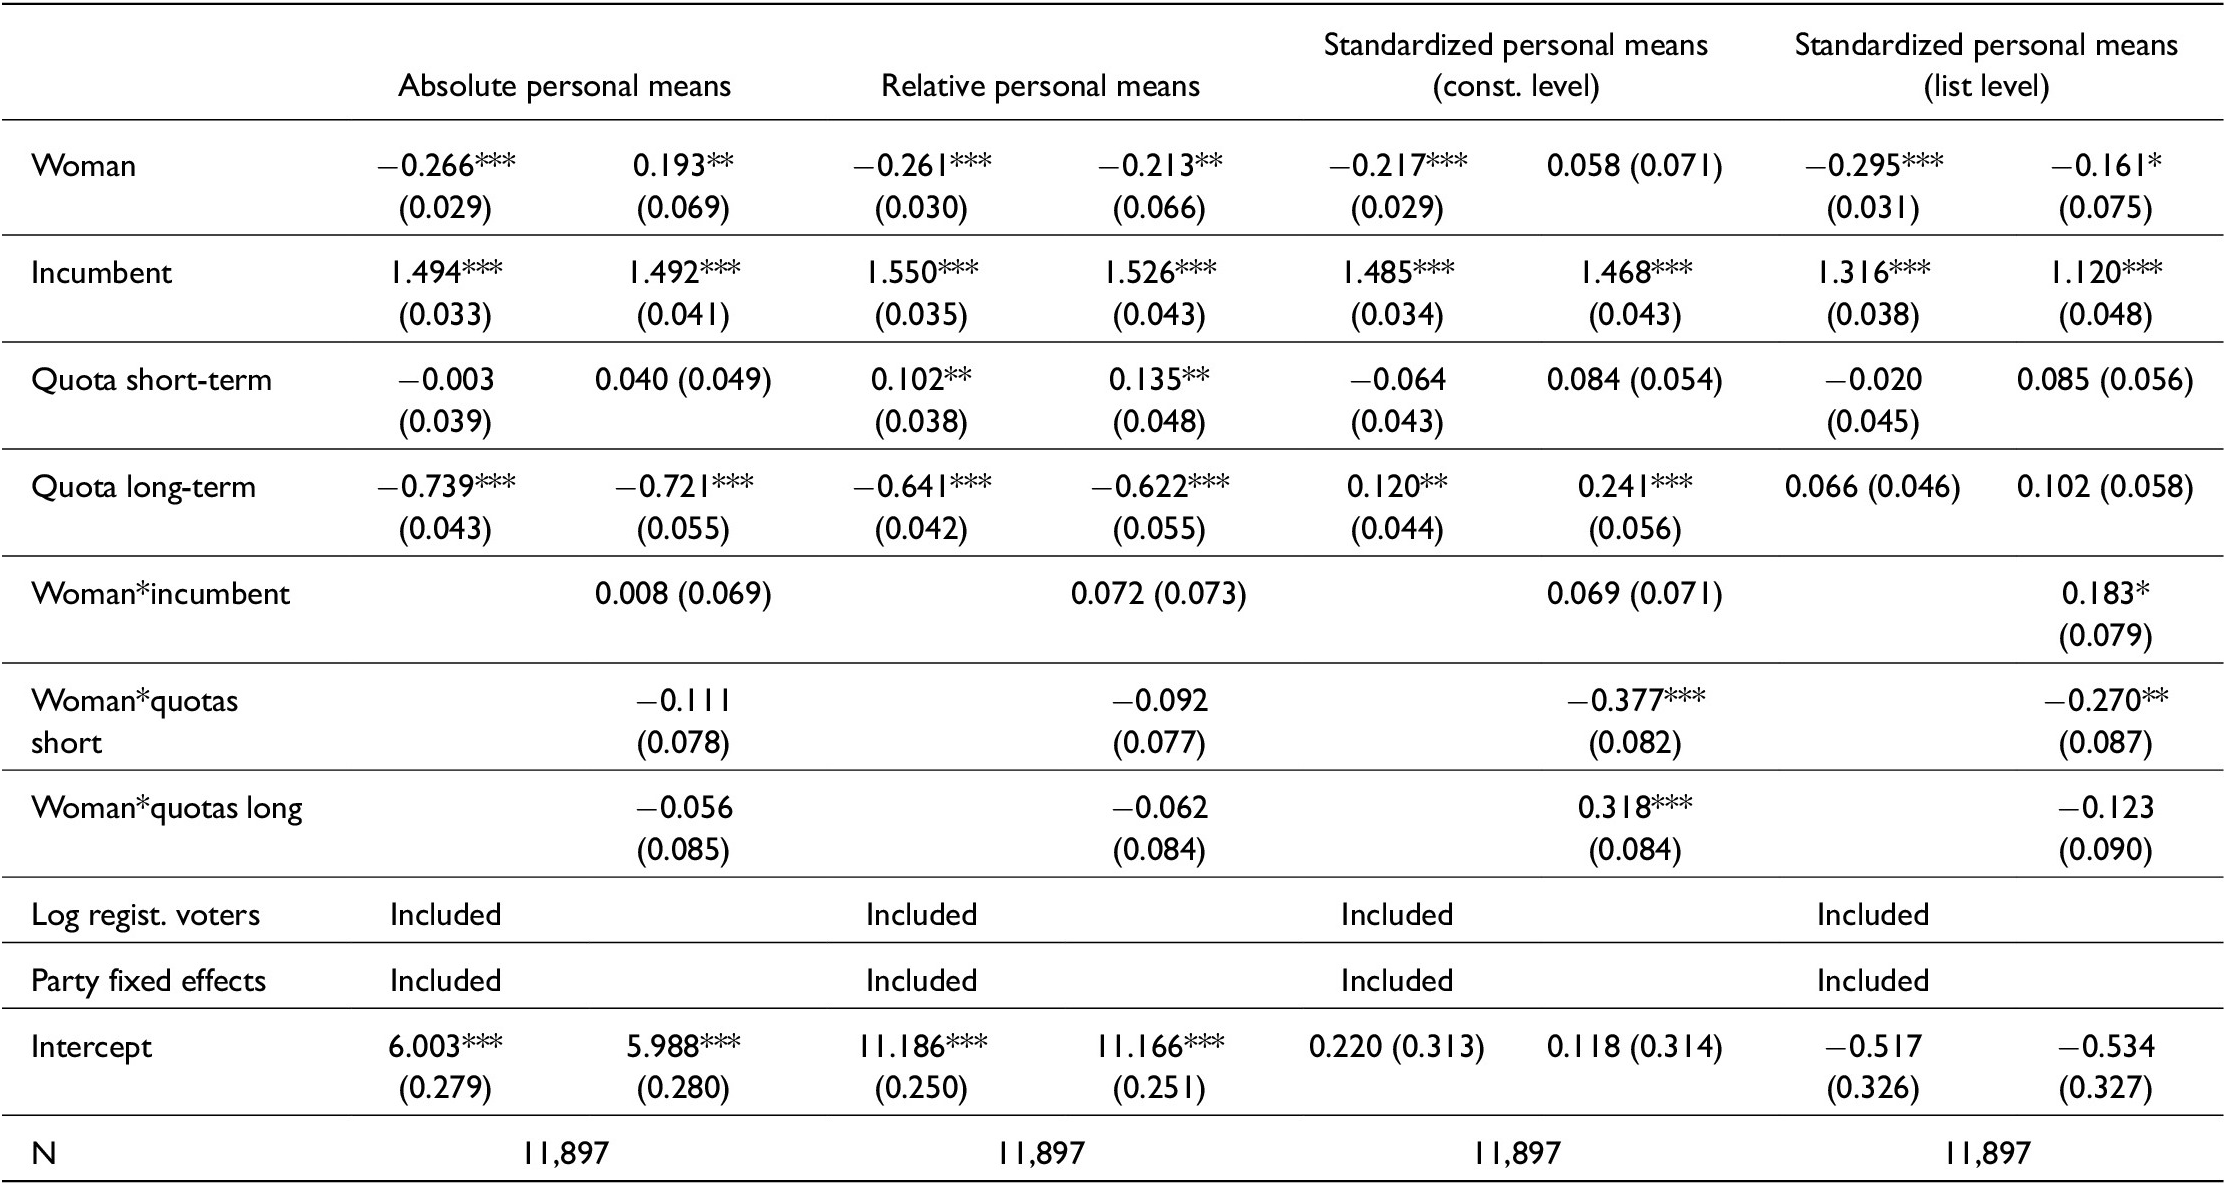
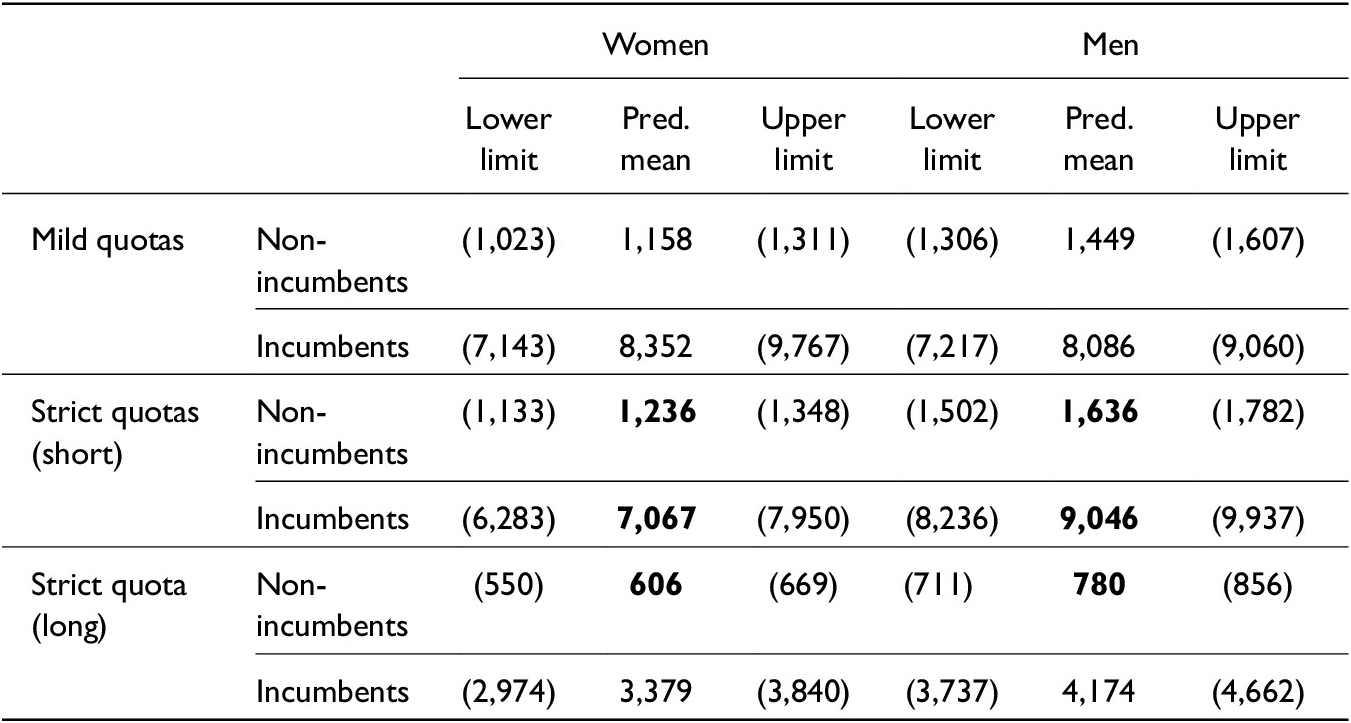
Looking first at personal means, the models without interactions in Table 4 confirm that there is a gender effect: in general, women candidates draw less funding from their own means than men, in line with H5. This main effect of gender is maintained in three of the four models with interactions, while the interactions between gender and the quota periods are only significant in the models with the standardized variables. The mean predicted values for the absolute values (Table 5) suggest that the gender gap with regard to personal means is more structural than for spending in general, as it is significant not only for non-incumbents but also for incumbents in the first strict quota period. But this is not confirmed by the predicted values for the other operationalizations (supplemental material Tables E1, E2, and E3). The model with the relative values indicates that there is already a significant gap for non-incumbents in the mild quota period, and this is also almost the case for absolute personal means. Even so, we have to be cautious, as these results are less clear-cut than was the case with spending in general.
Explaining the level of personal means as a funding source of candidates

Notes: Table reports beta coefficients of a generalized linear model with Tweedie distribution, standard errors between brackets.
* p < 0.05; ** p < 0.01; *** p < 0.001.
Mean predicted values with 95% confidence interval limits, absolute personal means, model with interactions

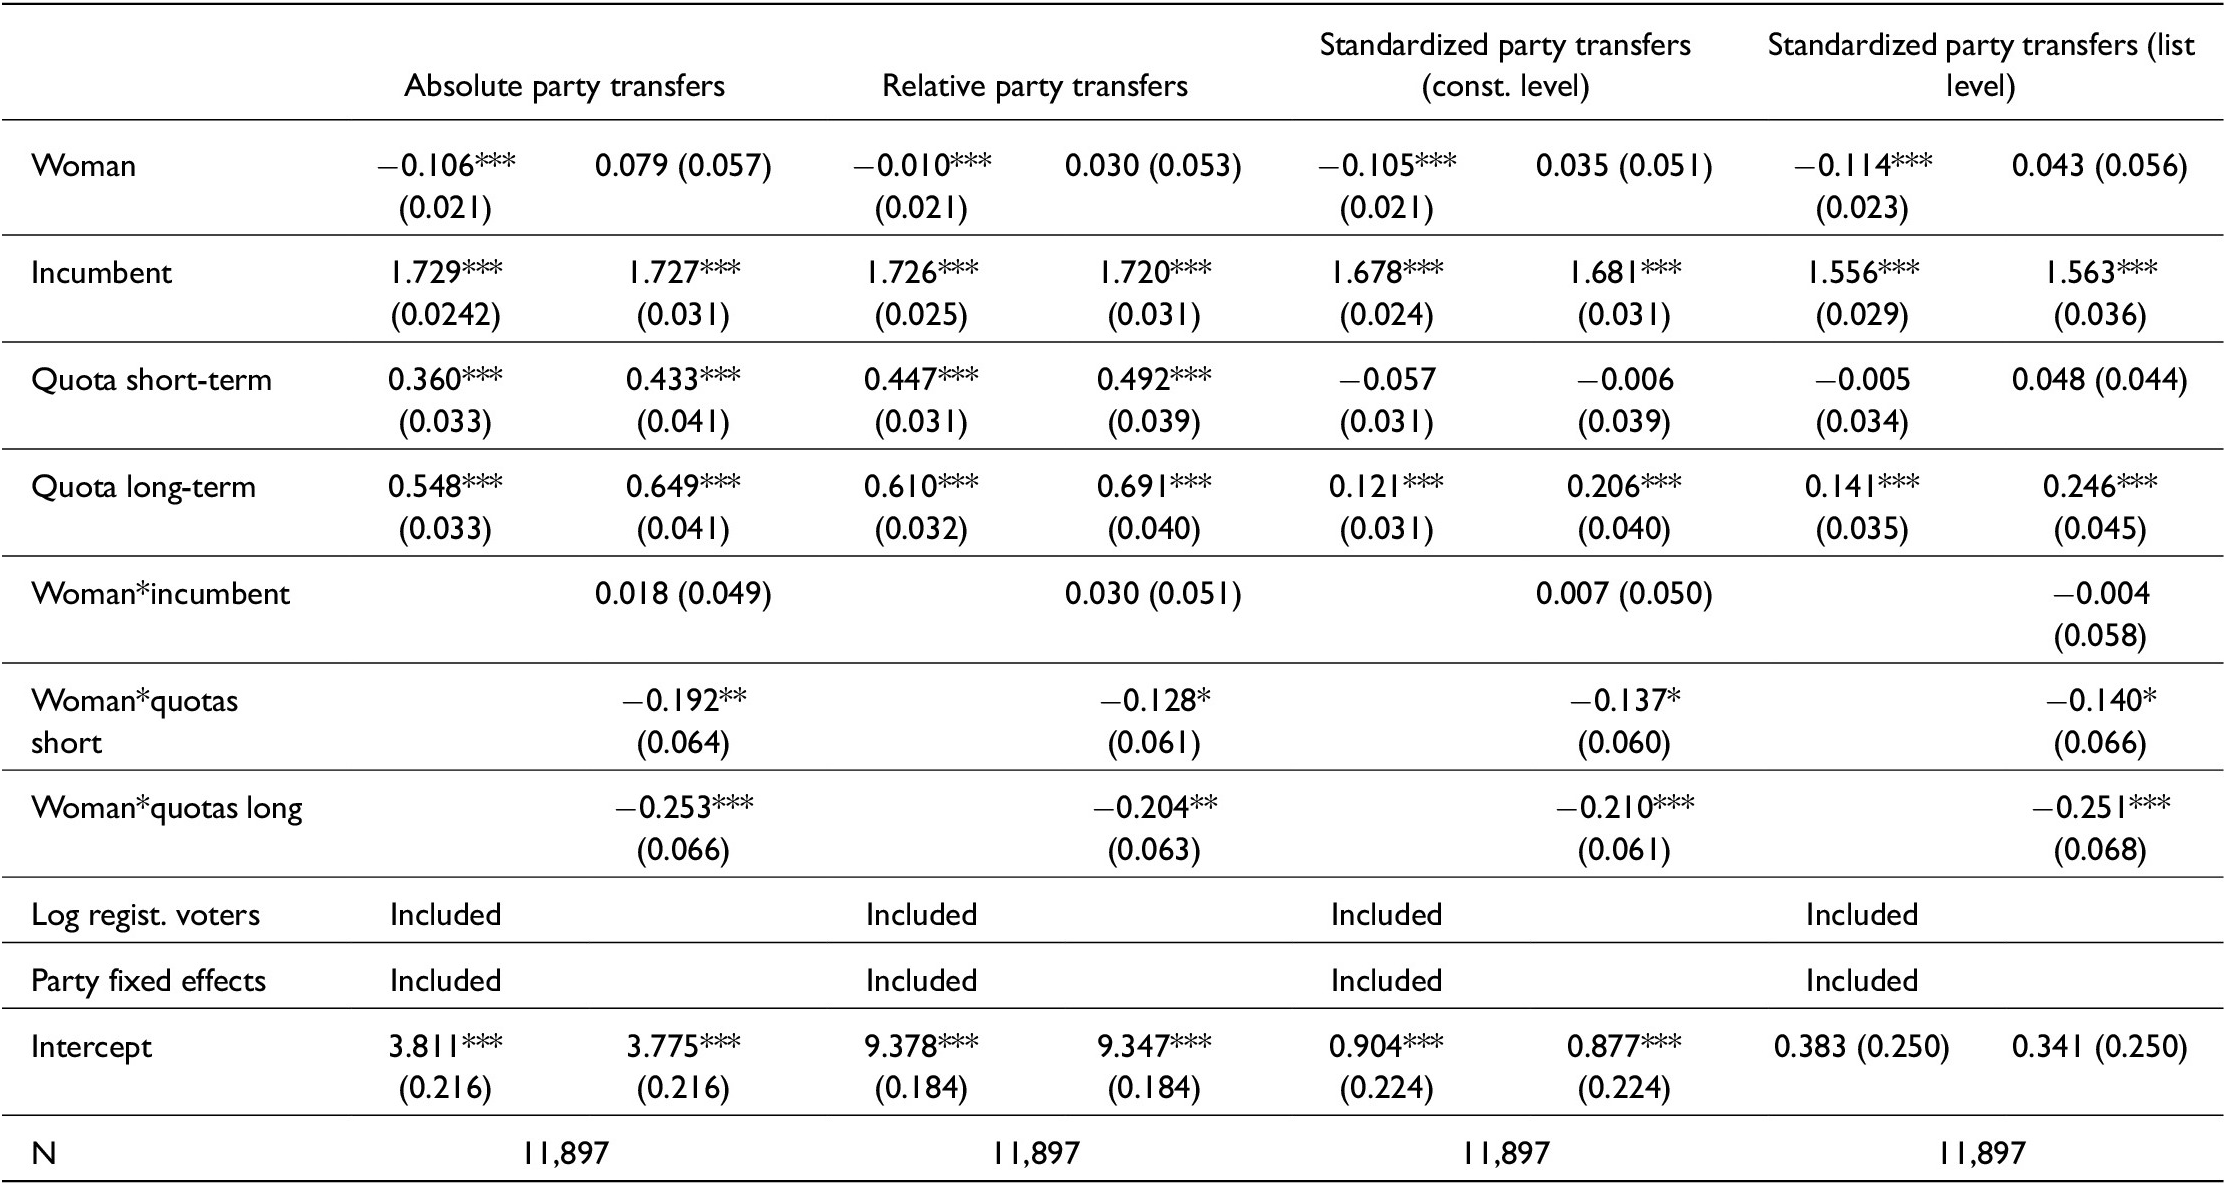
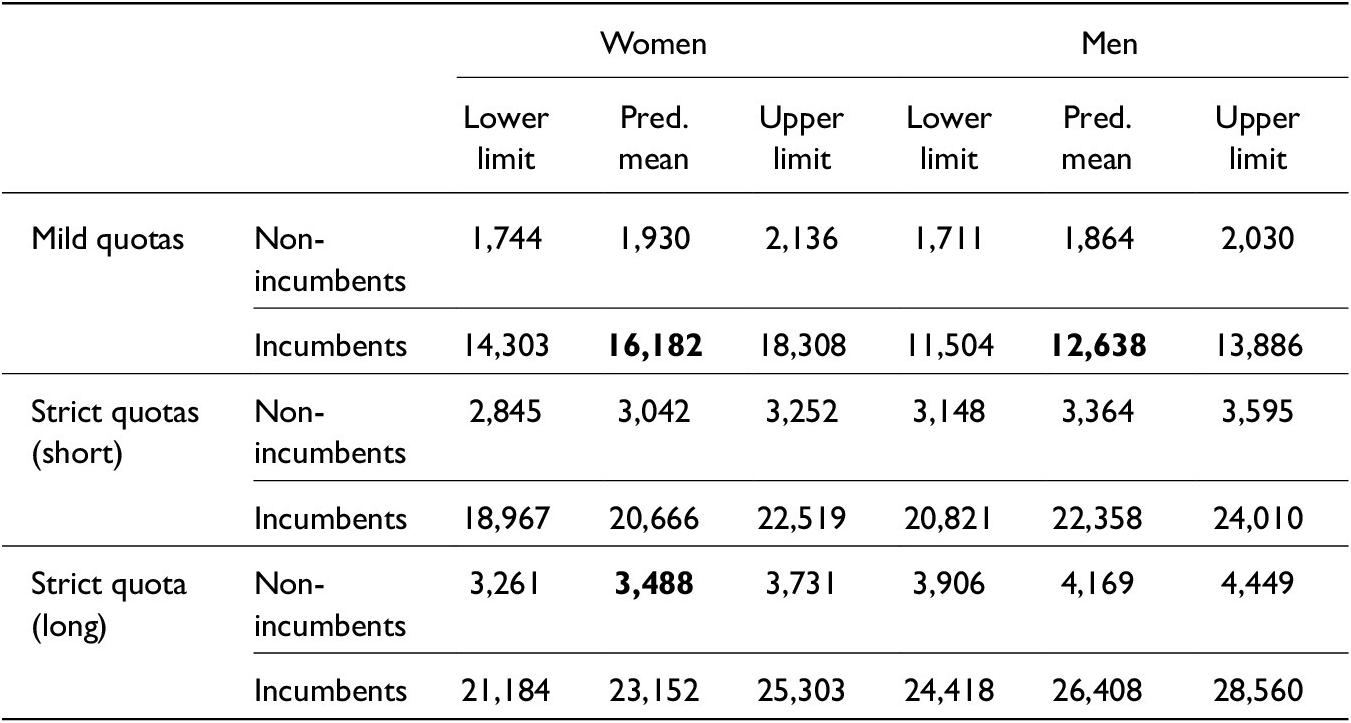
The findings regarding party transfers (Table 6) reflect the earlier discussed results for spending. This does not come as a surprise, as these transfers cover 69% of the expenses. In line with H6, gender always has a significant effect in the simple models. In the models with interactions, the main effect of gender and of the interaction between gender and incumbency are never significant. The interactions between gender and the two quota periods, on the other hand, are always significant, across the four operationalizations. Thus, men candidates obtain more party transfers than women, but only in the first and second strict quota periods. This also appears particularly the case in the second strict quota period, as the interaction parameter is always substantially higher. Indeed, it is only in this second period that the confidence intervals for party transfers do not overlap, and this is across all four operationalizations (Table 7 and supplemental material Tables F1, F2, and F3). In contrast, before the introduction of strict quotas, women candidates receive more party transfers than men, but this is only the case when the absolute amounts of transfers are taken into account, and it is only for the incumbents that the confidence intervals do not overlap. Yet, we should not make too much of this finding, as it is not confirmed by the predicted values for the other three operationalizations.
Explaining the level of party transfers as a funding source of candidates

Notes: Table reports beta coefficients of a generalized linear model with Tweedie distribution, standard errors between brackets.
* p < 0.05; ** p < 0.01; *** p < 0.001.
Mean predicted values with 95% confidence interval limits, absolute party transfers, model with interactions

Discussion and Conclusions
This article adds to the growing evidence that, in proportional electoral systems, the effectiveness of quotas is thwarted by gendered financial inequalities. The Belgian data convincingly show that, in general, women candidates spend significantly less on their political campaigns then men. Taking into account that, in Belgium, spending levels affect electoral success in terms of preference votes, and that this success determines the list position in subsequent elections, it is clear that this spending gap impedes the full representation of women in parliament.
Our article also provides evidence that the gender gap in spending is related to the introduction of quotas. Before strict quotas were introduced, women candidates spent about as much as men. The gender gap only appears when strict quotas are introduced, from the 2003 election onwards. We had hypothesized that this effect would be limited to the initial “quota shock” and its immediate aftermath, as the new women candidates would gradually develop political and electoral networks and after a few elections equal men in spending. We found some evidence that the gap does indeed diminish, but this process took much longer than we expected. It is only in 2019 — that is, 16 years after the “quota shock” — that the gap narrows, although it has not disappeared.
No difference in spending was found between men and women incumbents. In other words, the gender gap is always limited to non-incumbents. As it is normally difficult to obtain a seat as a challenger, this result supports the argument that women candidates spend less because they do not want to throw money at a lost cause. Also in line with the results of earlier studies, women candidates were found to draw less funding from their own financial resources than men. There are some indications that this gender effect for personal funding is more structural than for spending in general, but the larger part of the expenses, 69%, is funded with party transfers. The parties obtain an abundance of public subsidies, as a result of which they have more money at their disposal than they can spend themselves, also due to a low spending cap for parties. This surplus money is channeled to the individual candidates. After the introduction of strict quotas, we found the expected gender bias, in the sense that non-incumbent women candidates obtained less party transfers than men. Interestingly, this is most evident in the second quota period. While we would expect the gender bias with regard to party transfers to disappear to the extent that more women candidates are elected and manage to rise in the party hierarchy, the reverse appears to be the case. The longer quotas are in place, the more women challengers are disadvantaged with regard to party transfers.
These findings are relevant from a perspective of gendered financial institutional arrangements (Muriaas, Wang, and Murray Reference Muriaas, Wang and Murray2020). The gender bias with respect to personal and private funding is one of the reasons why a shift to public campaign finance is recommended as a way to create a more level playing field (Muñoz-Pogossian and Finn Reference Muñoz-Pogossian, Finn, Došek, Freidenberg, Caminotti and Muñoz-Pogossian2017, 180). Yet, the literature on political finance and gendered institutional arrangements (Ohman Reference Ohman2018, 12–4) has already shown that the public funding of parties is not the most efficient way to financially empower women candidates. Even if a part of the subsidy is earmarked for promoting gender equality, it is often difficult to monitor if the money is actually used for that purpose (Ohman Reference Ohman2018, 23–4). The Belgian case, characterized by an abundance of public money for parties, confirms that subsidies in themselves, without gendered flanking measures, will not redress the gender imbalance in campaign finance. After the introduction of strict quota, party transfers reinforced rather than compensated the financial disadvantages of women candidates. Viewed from a feminist institutionalist perspective, this finding suggests that formal rules obliging party elites to nominate women candidates are undermined by informal masculinist practices to thwart political careers of women, and that this informal practice is quite sticky.
This is one of the reasons why quotas in and of themselves cannot guarantee an equal representation of women in parliament. From a normative perspective, it could be argued that the introduction of quotas should be accompanied by measures aimed at the financial empowerment of women. In theory, parties could be obliged to use a part of their public subsidies to fund the campaigns of women candidates and redress the gendered financial inequalities. But taking into account the above mentioned problems with earmarking party subsidies for gender equality, as well as the fact that internal party transfers are notoriously non-transparent, it is doubtful whether the authorities would be able to control and effectively reinforce such a measure. A direct subsidy to the campaigns of women candidates would probably be more advisable, at least as a temporary measure after the introduction of quotas. Such a measure could give women politicians a financial boost to overcome the financial disadvantages which they face in the short run after the introduction of quotas. But the bad news of this study is that this short run may last quite long.
Supplementary material
The supplementary material for this article can be found at http://doi.org/10.1017/S1743923X25000121.
Acknowledgments
We want to thank three anonymous reviewers for their encouraging and critical feedback.
Competing interest
The authors declare that there are no conflicts of interest.


 Open access