


Introduction
Migraine is a common, debilitating neurological disorder afflicting 12% of the general population and affecting more women compared to men in a 3:1 ratio.Reference Sutherland and Griffiths1 However, its social and economic impact on society goes beyond the suffering of any one individual. In the Global Burden of Disease reported in 2017, it was ranked as one of the most burdensome neurological disorders.2
It has been recognized that there is a strong genetic component contributing to the pathophysiology of migraine with first-degree relatives having a fourfold increase in risk for developing this disorder.Reference Russell, Iselius and Olesen3, Reference Russell, Ulrich, Gervil and Olesen4 Furthermore, twin studies suggest a heritability of approximately 42%.Reference Honkasalo, Kaprio, Winter, Heikkilä, Sillanpää and Koskenvuo5–Reference Polderman, Benyamin and de Leeuw7 Recent studies have focused on large-scale genome-wide association studies.8 In spite of advances in technology which allow these large-scale high throughput genetic studies to be completed, the precise genetic basis of migraine remains elusive. In addition to these large-scale studies, there remains scientific value in the study of well-characterized families with complex disorders such as migraine.
We identified an American family in which multiple members were affected with migraine headache, vertigo, and severe motion sickness. We hypothesized that vertigo and motion sickness, which are common comorbidities associated with migraine, may be inherited through different susceptibility genes independent of those conferring a vulnerability to migraine. To test this hypothesis, we performed genetic analysis of each of these disorders separately.
Methods
Clinical
We ascertained a multigenerational American family with multiple members affected with migraine associated with motion sickness and vertigo (Figure 1). The family was recruited with policies and procedures approved by the Institutional Review Board (IRB) of the New Jersey Neuroscience Institute, Edison, New Jersey, USA.
Pedigree of multigenerational family with multiple members affected with migraine (blue), vertigo (red), motion sickness (green), or probably affected with migraine (light blue), or probably affected with motion sickness (light green). Affected members present with individual phenotype or combination of any two or all three phenotypes, indicated by the corresponding colors.
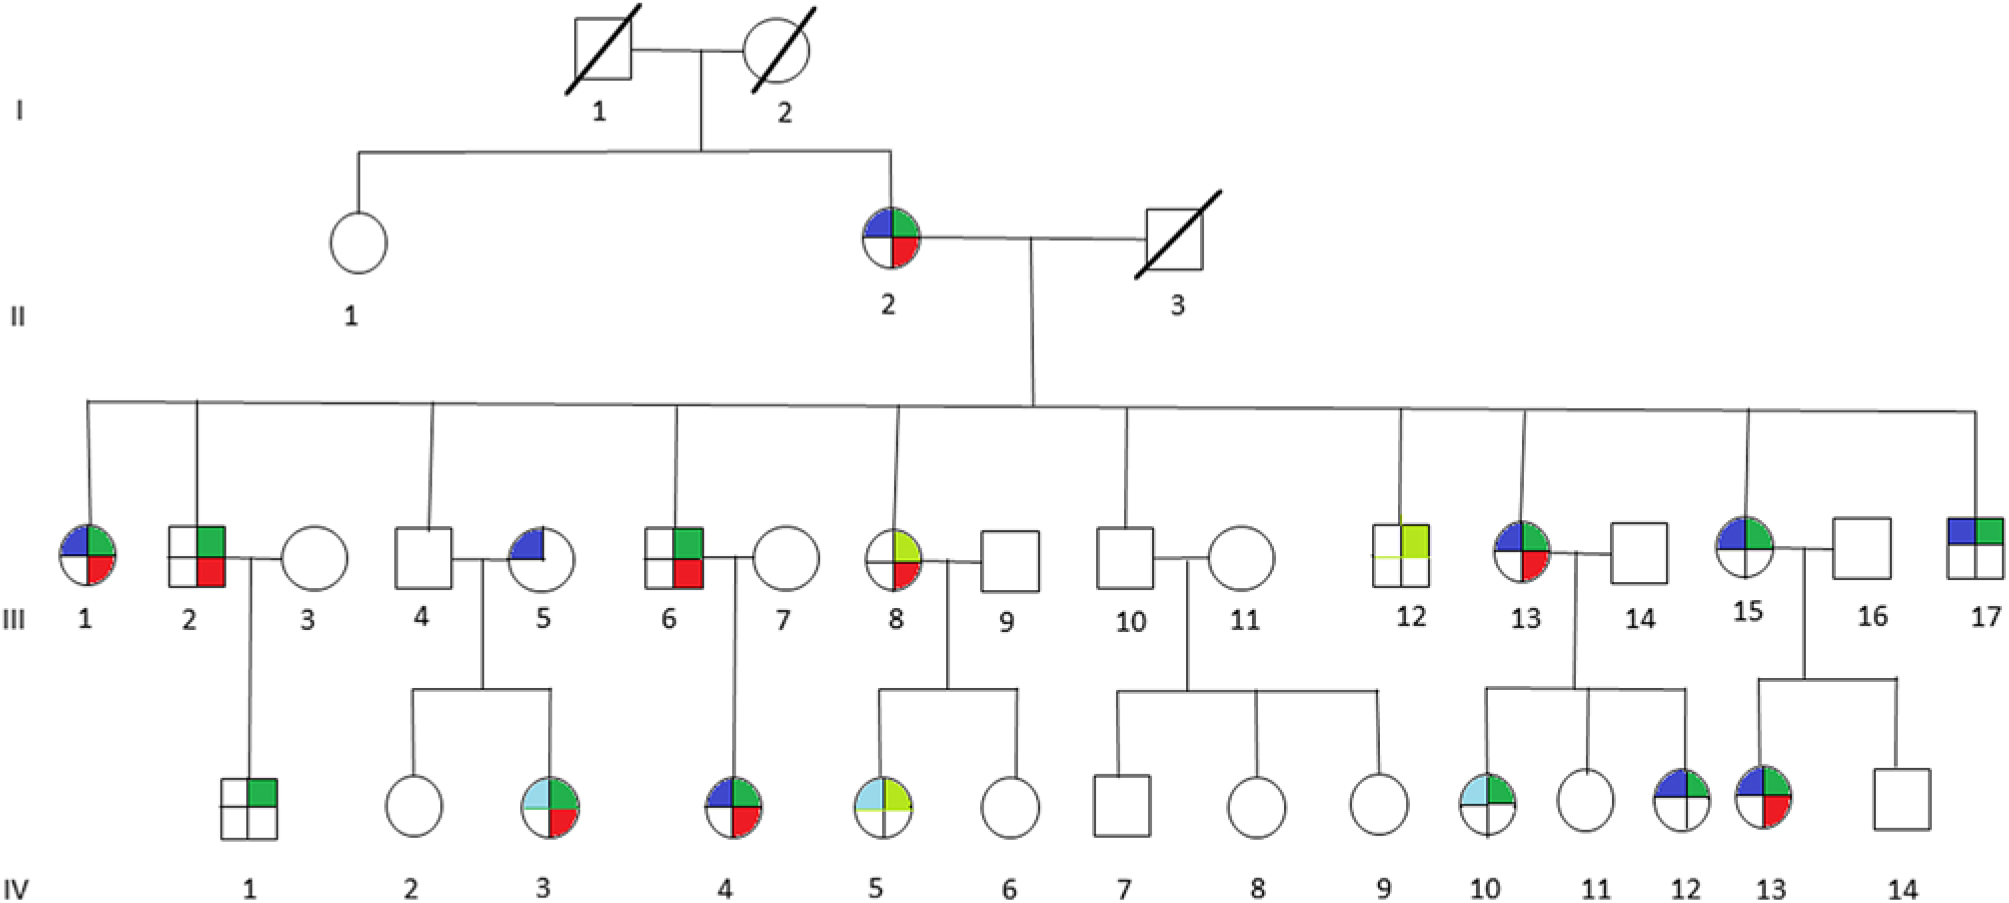
All 29 participating family members were interviewed by neurologists (PDK, PAH, and RPG). The diagnosis of migraine was made on the basis of clinical history and met the International Headache Society diagnostic criteria.8 Motion sickness was diagnosed by clinical history and examination. Vertigo was diagnosed by clinical history, and a Dix-Hallpike maneuver was performed to exclude benign paroxysmal positional vertigo. A complete vestibular examination was performed including video-oculography and a general neurological examination to exclude other vestibular disorders. The family members were coded as affected, probably affected and unaffected for each phenotype.
Genetics
A blood sample was collected from all members of the family and genomic DNA extracted (Puregene Systems, Gentra). All the DNA samples (both affected and unaffected) were subjected to genetic analysis using 400 microsatellite repeat markers spaced at 10 cM throughout the genome (Weber lab screening set 13, Prevention Genetics Inc., Marshfield, WI, USA).
Statistical analysis was performed using two-point and multipoint linkage analysis and for both of these analyses four disease models were studied (Table 1). Each of the four models, which include a dominant model with incomplete penetrance (high), a recessive model with incomplete penetrance (high), a second dominant model with incomplete penetrance (low), and a second recessive model with incomplete penetrance (low), was employed assuming a disease allele frequency of 0.001. Mendelian inconsistencies were detected using PEDCHECK.Reference O’Connell and Weeks9 The two-point parametric linkage analysis was performed using MLINK,Reference Terwillger and Ott10 from the LINKAGE programs, and the multipoint parametric linkage analysis was performed using SIMWALK2.Reference Sobel and Lange11 Each logarithm of odds (LOD) score was converted to report a p-value by first converting to a chi-squared statistic and then employing the standard statistical tables while taking into account the one-sided nature of the test. The three phenotypic traits, migraine, vertigo, and motion sickness were analyzed individually for all autosomal chromosomes. Employing four genetic models to analyze three phenotypes resulted in 12 genome-wide tests. The p-values were adjusted for this multiplicity of testing.Reference Benjamini and Hochberg12
Penetrance values for each genotype in which + represents the wild type allele and D represents the disease allele. Each penetrance is the probability of an individual being affected conditional on a given genotype at the disease locus

Results
The clinical features of the individuals participating in the study are indicated in Table 2. It is interesting to note that of 12 individuals in this family that suffer from migraine, only 1 individual (III-5) did not have associated motion sickness or vertigo. This individual married into this family and all of the remaining individuals have a combination of vertigo and/or motion sickness associated with migraine. Furthermore, 16 members of this family suffered from at least one of these three disorders.
The clinical features of the individuals participating in the study
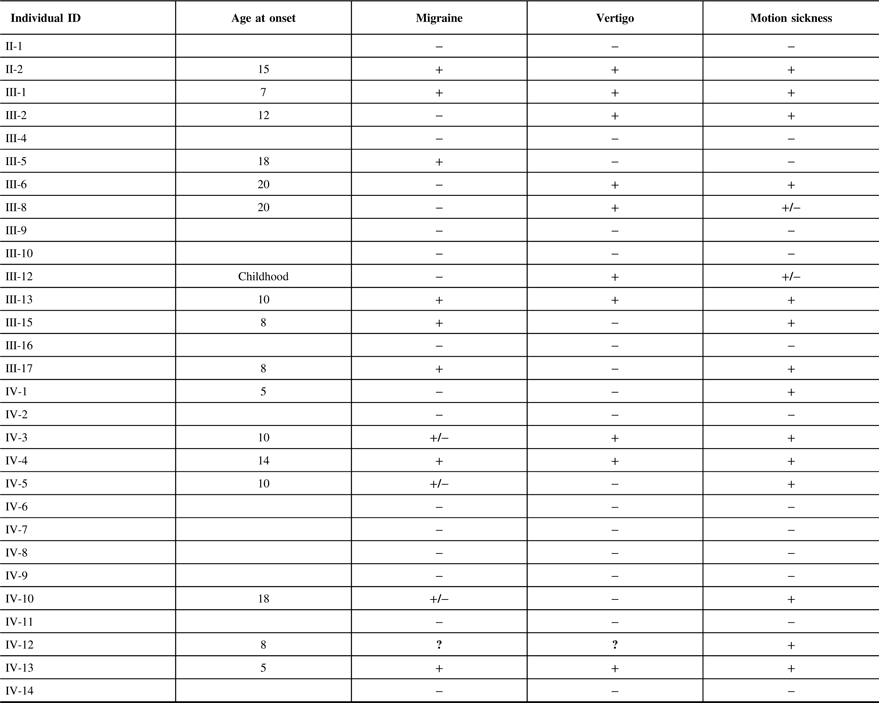
It can be noted that we applied the same uniform diagnostic criteria to III-5, as we did with all other members of the pedigree and coded this individual as affected for migraine. From a statistical perspective, there are two possibilities regarding this individual, either the migraine phenotype is due to a mutation in the same gene as those within the pedigree or a different gene representing locus heterogeneity. A priori, it is not possible to know which of these two possibilities are valid. When the etiology of the migraine phenotype is the same gene as the rest of the pedigree, the recombination fraction for that sib pair (including individual III-5) will be the same as for the other sibling pairs in the pedigree and will result in a moderate increase in the LOD score. We tested this pedigree with this assumption recognizing that analysis with locus heterogeneity would result in a moderate decrease in this calculated LOD score.
The maximum two-point LOD and maximum multipoint LOD scores for each genetic model employed and each of the three phenotypes examined are displayed in Tables 3 and 4. Prior to an adjustment for multiple testing, several scores appear suggestive of linkage as defined by Lander and Kruglyak.Reference Lander and Kruglyak13 However, after adjusting the corresponding p-values, these scores only achieved borderline suggestive significance.
Maximum two point-LOD scores along with their markers and chromosome locations for each genetic model employed and each phenotype analyzed
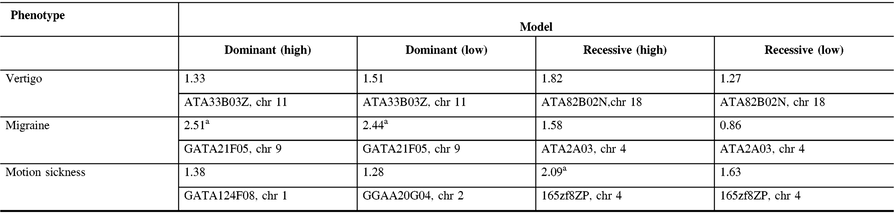
a Indicates LOD scores which are suggestive of linkage prior to an adjustment for multiple testing.
Maximum multipoint LOD scores along with their relative map positions and chromosome locations for each genetic model employed and each phenotype analyzed. Relative map positions are calculated relative to the first marker in the Weber lab screening set 13 for each autosomal chromosome
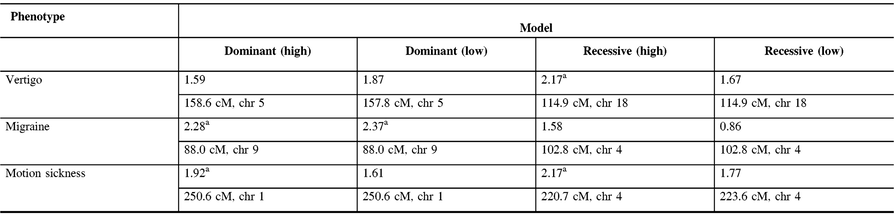
a Indicates LOD scores which are suggestive of linkage prior to an adjustment for multiple testing.
Discussion
Family-based studies have identified many migraine susceptibility loci.Reference Sutherland and Griffiths1 In addition, as of 2017, five major migraine genome-wide association studies (GWAS) have been performed through collaborations and consortia. These have implicated 38 different susceptibility loci for migraine with or without aura.Reference Sutherland and Griffiths1, Reference Gormley, Anttila and Winsvold14
In our study, linkage analysis was performed for three phenotypes, motion sickness, vertigo, and migraine without aura. Our analysis provides evidence suggesting a distinct pattern of linkage for each of these phenotypes to different chromosomes. Although none of the two-point or multipoint LOD scores reached statistical significance, prior to adjusting for multiple testing there are a number of suggestive LOD scores implicating different susceptibility genes depending upon the phenotype analyzed (Tables 3 and 4).
Our two-point and multipoint analyses, employing both high and low dominant models of incomplete penetrance for the migraine phenotype, suggest linkage with a maximum two-point score of 2.51 at marker GATA21F05 (9q13-q22) on chromosome 9 (Tables 3 and 4). Susceptibility loci for migraine on chromosome 9 have been previously reported. For example, the occipito-temporal lobe epilepsy/migraine with aura trait was linked to chromosome 9qReference Deprez, Peeters and Van Paesschen15 and a visual migraine aura trait to 9q21-q22.Reference Tikka-Kleemola, Artto and Vepsäläinen16 In addition, chromosome 9q22.22 locus was identified in genome-wide linkage analysis of migraine in population of Norfolk Island, Australia.Reference Cox, Lea and Bellis17 Furthermore, a single nucleotide polymorphism on chromosome 9q33.1 locus was identified by meta-analysis of data from genome-wide association studies of migraine performed in various populations.Reference Gormley, Anttila and Winsvold14, Reference Anttila, Winsvold and Gormley18 However, although these loci do map to chromosomes 9, none of them localize to the specific chromosome locus identified by our investigation. Utilizing the recessive model with this trait results in LOD scores that are less robust than those obtained for the dominant model with the maximum two-point score at marker ATA2A03 on chromosome 4 (4q21.23). Previously, loci at chromosome 4q24 and 4q12 were reported associated with migraine in a GWAS meta-analysis.Reference Gormley, Anttila and Winsvold14 Once again, these do not map to the specific chromosome 4 locus identified in our study.
The lifetime prevalence for migraine is about 16%, vertigo is 7%, and the comorbidity of these both occurring is 3.2 %. There has been research investigating not only the relationship of vertigo to migraine but also the genetics of vertiginous syndrome.Reference Cha and Baloh19–Reference Frejo, Giegling, Teggi, Lopez-Escamez and Rujescu21 Vestibular migraine manifests as vertigo presenting clinically with attacks of spontaneous vertigo lasting seconds to days. These attacks may be accompanied with headache, phonophobia, photophobia, central spontaneous or positional nystagmus, and less commonly, unilateral vestibular hypofunction.Reference Versino, Sances and Anghileri22, Reference Lempert and Neuhauser23 In a study of a large family with multiple members suffering migraine and migraine-associated vertigo, identity by descent analysis was performed. Depending upon variation in penetrance and phenocopy levels, putative LOD scores analyzing only the migraine-associated vertigo affected females ranged from 1.34 to 1.9 for linkage to a 6.7-Mb interval on chromosome 11q (67957871–74605123 NCBI Build 34).Reference Lee, Jen, Cha, Nelson and Baloh24
In our analysis of only vertigo, there are different LOD scores depending upon the inheritance model selected (Tables 3 and 4). The highest two-point LOD score was obtained by employing a recessive model with high penetrance to genetic marker ATA82B02N on chromosome 18 (18q22.3). The highest two-point LOD score with the dominant model for vertigo maps to chromosome 11 at marker ATA33B03Z (OR51A6P, 11p15.4). This localizes close to a previously reported genetic marker, MRVI1 (rs4910165) for migraine at 11p15.4. We will be analyzing this locus further in future studies.
Depending upon the model employed, our analysis of motion sickness alone produced maximum two-point LOD scores for markers GATA124F08 on chromosome 1 (1q32.2) and 165zf8ZP on chromosome 4 (4q35) (Tables 3 and 4). Motion sickness is associated with both migraine headaches, vertigo, and postoperative nausea and vomiting (PONV).Reference Hromatka, Tung, Kiefer, Do, Hinds and Eriksson25–Reference Golding27 It has been observed that vertigo occurs in patients who habitually suffer from motion sickness, and who have a history of migraine, either with or without aura. Furthermore, although the mechanism of this susceptibility is not well understood, motion sickness occurs in approximately 50% of migraine sufferers. It is postulated that it is due to vestibular dysfunction secondary to vasomotor disturbances during migraine attacks, hyper-excitability of brainstem circuits that produce symptoms of motion sickness and migraine, and heightened susceptibility to visual illusions of movement.Reference Drummond28, Reference Marcus, Furman and Balaban29 There have been few reports investigating the genetics of motion sickness. In one recent study, individuals contributing samples to the 23 and Me database were analyzed for associations of motion sickness, PONV, and migraines. Although the clinical data were self-reported, which is an inherent weakness of such a study, the sample size is large consisting of 80,494 people. Interestingly, 35 SNPs were found associated at the genome-wide level with motion sickness.Reference Hromatka, Tung, Kiefer, Do, Hinds and Eriksson25 None of these loci localize to the chromosome 4 or chromosome 1 markers detected in our study of the motion sickness phenotype. Although in the GWAS on motion sickness there are SNPs localizing to 4p15.1, 4q34.3, 9p21.1, and 9p21.2, only the 9q21.31 locus overlaps with the 9q13-q22 locus detected in our study for the migraine phenotype. A number of the SNPs reported in that GWAS study including rs10970305 (ACO1 gene), rs2150864 (LINGO2 gene), rs149951341 (TLE4 gene), and rs1782031 (TUSC1 gene) all fall within the migraine locus detected in our study at GATA21F05 (9q13-q22).Reference Hromatka, Tung, Kiefer, Do, Hinds and Eriksson25 In addition, GWAS identified SNP rs10514168 (18q22.3) near TSHZ1 gene to be associated with motion sickness.Reference Hromatka, Tung, Kiefer, Do, Hinds and Eriksson25 This is in the same chromosome region 18q22.3 as the locus identified in our analysis of the vertigo phenotype only.
These are interesting results that suggest an overlap between susceptibility genes for migraine, vertigo, and motion sickness. We are in the process of analyzing these chromosomes further to confirm and extend these results.
In this family, there is evidence suggesting that there are separate genes conferring susceptibility to migraine and the associated comorbid conditions vertigo and motion sickness. Although modeled as autosomal recessive or dominant in our analysis, in this family neither migraine, vertigo, or motion sickness are transmitted in a simple Mendelian fashion but involve many different genes. The results of the GWAS studies indicate that there are a number of susceptibility genes involved in the development of a migraine. Recently, the results of these studies have been extended by an analysis of families with migraine where certain common genetic variants are overrepresented contributing to a familial aggregation of this disorder.Reference Gormley, Kurki and Hiekkala30 It is likely that there are both inter- and intra-familial issues of gene penetrance and expressivity further affected by many triggers that include hormonal changes, sleep deprivation, or stress. These factors result in a cumulative threshold effect to the ultimate development of a specific migraine attack.
Conclusions
Our study highlights the challenges of investigating complex disorders such as migraine and the value of studying large well characterized families. The identification of gene(s) involved in migraine headaches and the associated neurotologic symptoms are important. Such discoveries may facilitate improved diagnosis and the development of effective and personalized treatments of patients suffering from these disorders.
Acknowledgements
We are grateful to the family members for their participation in this study.
Disclosures
All authors report no conflict of interest.
Statement of Authorship
All authors contributed to initial drafts of this publication, RPG and LRP revised later drafts. All authors reviewed and approved the final draft. The neurological examinations were performed by RPG, PDK, and PAH, and the statistical analysis was performed by MAL. PLR was involved in generation of genetic data. RPG was involved in supervision of all aspects of the study.


