

1. Introduction
China's rise as a global economic power, spurred by its market-oriented reforms in 1978, reshaped international trade and development dynamics. The Belt and Road Initiative (BRI), introduced in 2013, embodies China's strategy to enhance economic integration across Asia, Africa, Europe and Latin America via massive infrastructure investments, trade facilitation and policy coordination (Nedopil, Reference Nedopil2025). Although the BRI has fostered economic growth and cross-border connectivity (Chen, Reference Chen2023), it has sparked serious concerns regarding its environmental impact, particularly in low- and middle-income countries undergoing rapid industrialization. The BRI-related infrastructure development has been linked to increased ecological risks, including land degradation, biodiversity loss and pollution. In response, Chinese authorities have stressed the importance of integrating development goals and environmental safeguards into the BRI framework. Despite this policy emphasis, systematic empirical evidence on the environmental consequences of the BRI remains limited.
Over time, the ecological footprint (EF) has increased substantially in China, particularly since the late 1990s (Figure A1 in the online appendix). From 1961 to the early 1980s, it grew by <1.5 gha per capita. However, after the early 1980s, this trend surged, reaching over 3 gha per capita by 2022. China's historical economic dominance, illustrated by its substantial global gross domestic product (GDP) share during the Han, Tang and Qing dynasties, shaped its contemporary ambitions under the BRI (Mühlhahn, Reference Mühlhahn2019). Since the launch of economic reforms in 1978, China has transitioned from a centrally planned economy to a major global economy, marked by substantial GDP growth and significant poverty reduction. However, this rapid industrialization has paralleled an increase in EF, particularly since 2000, following China's accession to the World Trade Organization. The expansive infrastructure projects under the BRI exacerbate these environmental pressures, necessitating a rigorous assessment of their sustainability impacts.
Empirical research on the environmental impacts of BRI has increased; however, gaps in the literature remain. Much of the literature relies on carbon emissions as the main environmental indicator, overlooking broader aspects, such as land use, biodiversity, and resource consumption (Sattar et al., Reference Sattar, Hussain and Ilyas2022; Zhou et al., Reference Zhou, Wang and Luo2023). In parallel, existing studies largely depend on single-country or regional case analysis and rarely apply advanced causal inference techniques such as difference-in-differences (DiD) and propensity score matching (PSM)–DiD to large-scale cross-country datasets. These limitations constrain the ability to draw generalizable conclusions regarding the environmental effects of BRI participation.
This study addresses these limitations by using per-capita EF, a composite measure covering six environmental dimensions, and by applying advanced econometric methods to data from 176 countries. It further examines whether information and communication technology (ICT) and renewable energy (RE) consumption mediate the environmental effects of BRI participation, given their potential to support cleaner production and governance improvements. The limited research on regional and developmental differences in environmental effects underscores the need for a thorough empirical investigation.
The analytical framework is informed by Ecological Modernization Theory (EMT) (Bugden, Reference Bugden2022) and the Environmental Kuznets Curve (EKC) hypothesis (Grossman and Krueger, Reference Grossman and Krueger1995), which together emphasize the role of technological progress and structural transformation in shaping environmental outcomes. Building on these perspectives, the study pursues three objectives: (1) estimate the causal effect of BRI participation on EF, (2) evaluate how ICT development influences environmental outcomes, and (3) explore whether RE consumption promotes sustainability by lowering EF. Correspondingly, the study addresses three research questions: (1) Does BRI participation significantly affect EF? (2) To what extent does ICT development mediate these effects? (3) Does RE consumption mitigate the environmental impacts of BRI projects?
The environmental implications of the BRI have raised concerns among scholars and policymakers, particularly given the expansion of carbon-intensive sectors (e.g., infrastructure, energy and transportation) in countries with weak environmental governance capacity (Liu and Ma, Reference Liu and Ma2023). Existing empirical studies focusing on carbon emissions as the main environmental indicator are often limited to region-specific analyses and face methodological challenges in handling endogeneity and long-term dynamics (Fang et al., Reference Fang, Wang, He, Song, Fang and Jia2021; Sattar et al., Reference Sattar, Hussain and Ilyas2022). By employing a multidimensional environmental indicator and a global quasi-experimental design, this study contributes evidence with broader applicability to debates on large-scale development initiatives and sustainability.
This study has several limitations. Reliance on EF data may fail to reflect certain dimensions of environmental impacts, including localized pollution effects. Although methodologically strong, a quasi-experimental design cannot fully control for unobserved confounding factors. Variations across the BRI partner countries create differences in institutional and economic contexts that can influence the generalizability of the findings. Nevertheless, the use of a comprehensive dataset and advanced econometric techniques strengthened the credibility of the empirical results.
Appendix Figure A2 illustrates the research process, data sources, and methodological approach adopted in our study. The remainder of this paper is organized as follows. Section 2 reviews the relevant literature, highlighting key debates and theoretical frameworks. Section 3 outlines the research methodology. Section 4 reports and discusses the empirical results, and Section 5 summarizes the main findings, acknowledges limitations, and suggests future research avenues.
2. Literature review and hypothesis development
2.1. Environmental implications of BRI participation
Rapid industrialization in the 20th and 21st centuries has generated substantial economic growth, accompanied by serious ecological degradation, largely driven by rising greenhouse gas emissions. The BRI has contributed significantly to infrastructure expansion and economic development; however, these advances have intensified concerns regarding its environmental consequences. Although the initiative has the potential to support environmental improvements under effective regulatory frameworks, such outcomes remain relatively uncommon in practice (Cao et al., Reference Cao, Teng and Zhang2021). These findings indicate that policy formulation and implementation strongly influence the environmental outcomes of large-scale development initiatives. Elish and AboElsoud (Reference Elish and AboElsoud2024) identified a notable increase in the EF across several African countries following BRI participation, primarily driven by unregulated industrial activity and limited environmental protection. Comparable evidence was found in South Asia, where BRI-related infrastructure development has been linked to higher pollution levels and a faster depletion of natural resources (Ali et al., Reference Ali, Faqir, Haider, Shahzad and Nosheen2022). These findings underscore the importance of strong institutional quality and effective regulatory enforcement in reducing the adverse environmental effects of large-scale economic initiatives.
Several BRI partner countries are vulnerable to pollution havens due to weak enforcement, inadequate regulation and limited institutional capacity, particularly given the concentration of BRI investment in environmentally intensive sectors such as energy, transportation and construction. Inadequate regulatory oversight frequently leads to higher emissions, habitat degradation and excessive resource use (Sattar et al., Reference Sattar, Hussain and Ilyas2022). This highlights the importance of environmental governance in preventing the infrastructure expansion from undermining ecological sustainability. China has promoted a ‘green BRI’ aligned with the United Nations' Sustainable Development Goals (NDRC, 2017); however, empirical evidence points to persistent implementation gaps. For example, Jalil et al. (Reference Jalil, Rauf, Sikander, Yonghong and Tiebang2021) reported rising greenhouse gas emissions along key BRI transport corridors, attributing this increase to insufficient environmental coordination between China and the host countries. This finding emphasizes the importance of cross-border cooperation in limiting the environmental impact of large-scale infrastructure projects. Similarly, the EKC suggests that environmental degradation increases during the early stages of economic development before declining at higher income levels (Huang et al., Reference Huang, Rahman, Meo, Ali and Khan2024). Many BRI countries remain in the early or intermediate stages of industrialization and urbanization, where infrastructure-led growth is associated with deforestation, high carbon emissions and unsustainable resource use. Taken together, these insights suggest that, without institutional reform and environmental accountability, BRI-related investments may intensify ecological stress in low- and middle-income countries.
These arguments indicate that BRI participation, particularly in countries with limited institutional capacities and environmental safeguards, places additional strain on ecosystems. The documented increase in EF following BRI-related activities reinforces the view that infrastructure investment alone does not guarantee environmental improvements. Accordingly, we propose the following hypothesis:
H1: Participation in the BRI negatively affects environmental sustainability in partner countries.
2.2. Influence of ICT development on environmental outcomes of BRI participation
The expansion of the Digital Silk Road under the BRI signals a shift toward integrating technological progress with infrastructure development through ICT investment. In 2024, ICT-related investments exceeded US$22 billion, highlighting a growing focus on digital connectivity across BRI partner countries (Nedopil, Reference Nedopil2025). These investments have supported the rollout of optical fiber networks, data centers and 5G infrastructure, thereby improving digital access and technological capacity in previously underserved regions. According to EMT, these developments are crucial for enabling a shift toward more ecologically friendly economic structures (Spaargaren and Mol, Reference Spaargaren and Mol1992). Technological applications are valuable during rapid infrastructure expansion, helping to reduce ecological pressures arising from industrialization and urbanization (Wu et al., Reference Wu, Xu, Wang, Jiang, Xue, Jiang and Quan2025). Integrating digital innovation within the BRI can promote environmental sustainability under effective governance and adequate capacity building in partner countries.
Empirical evidence supports the environmental role of ICT in the BRI. Evidence from 148 participating countries suggests that wider ICT adoption is linked to lower EF, mainly through improved energy efficiency and environmental monitoring (Khan et al., Reference Khan, Ullah and Nobanee2024). A study of European BRI partners found that ICT infrastructure expansion notably reduced carbon emissions, largely because of the adoption of cleaner production technologies (Javed and Rapposelli, Reference Javed and Rapposelli2024). ICT acts as a development enabler and determinant of environmental outcomes, with benefits dependent on institutional strength. Governance quality and regulatory consistency determine whether ICT produces meaningful environmental gains or is constrained by weak implementation and fragmented policies (Rehman et al., Reference Rehman, Radulescu, Ahmad, Kamran Khan, Iacob and Cismas2023). This emphasizes the need to align technological advancements with coherent and enforceable policy frameworks.
Within the BRI, ICT serves as a structural factor shaping the environmental outcomes of infrastructure-driven development. Traditional investments in energy and transportation infrastructure often result in environmental degradation. In contrast, technologies such as real-time pollution monitoring, automated energy management systems and precision agriculture tools provide practical means to mitigate these impacts. By promoting the efficient and adaptive use of natural resources, these technologies alleviate environmental stresses typically linked to industrial growth. The EKC framework provides a useful theoretical perspective, suggesting that ICT adoption enables developing countries to reach the income level at which environmental conditions improve earlier in the economic growth process. ICT accelerates the spread of cleaner technologies, facilitating faster decoupling of economic activity from environmental harm (Avom et al., Reference Avom, Nkengfack, Fotio and Totouom2020). Empirical evidence shows that digital transformation in developing countries can reduce the turning point of the EKC by 20–30 per cent (Al-Mulali et al., Reference Al-Mulali, Gholipour and Solarin2022). These findings indicate that ICT supports BRI members in pursuing environmentally sustainable infrastructure development over the long term.
Building on EMT, the EKC framework, and growing empirical evidence, we expect that ICT mediates the environmental effects of BRI participation. ICT infrastructure strengthens environmental oversight, improves resource efficiency and supports cleaner production processes, which are central to reducing the ecological impacts from infrastructure development. However, the environmental benefits of ICT largely depend on governance quality and policy frameworks in host countries. Accordingly, we propose the following hypothesis:
H2: ICT mediates the relationship between the BRI and EF in countries with weak governance.
2.3. The role of RE in enhancing environmental sustainability
Energy from renewable sources, including solar, wind, geothermal and biomass, is vital for enhancing environmental sustainability. These sources are less harmful to the environment than fossil fuels and can be naturally replenished. However, RE adoption faces challenges due to policy uncertainty, which can deter investment and maintain reliance on fossil fuels (Dai et al., Reference Dai, Farooq and Alam2025). Global RE consumption has increased significantly, reaching 14.6 per cent of primary energy use in 2023, with China accounting for 35 per cent of this growth (Rapier, Reference Rapier2024). Empirical research has consistently highlighted the environmental benefits of RE. A higher share of RE significantly reduces carbon emissions (You et al., Reference You, Li and Waqas2024). In China, a 1 per cent increase in RE consumption lowers carbon emissions by 1.39 per cent and 0.50 per cent in the long and short term, respectively. By contrast, Raihan and Mainul Bari (Reference Raihan and Mainul Bari2024) showed that greater fossil fuel use and economic growth increase emissions, indicating that without a shift to cleaner energy, continued growth may worsen environmental challenges.
The expansion of RE in developing BRI countries is subject to significant structural and institutional constraints. The limited financial capacity hinders large-scale RE infrastructure development. Progress in wind and solar energy depends on the available financial resources (Geng, Reference Geng2021). This issue is compounded by ongoing fossil fuel subsidies, which distort market signals and weaken RE competitiveness. Technological gaps limit progress, as many BRI countries lack access to advanced renewable technologies and expertise in implementation and maintenance (Falcone, Reference Falcone2023). Inadequate infrastructure, particularly in energy storage and grid systems, constrains the scalability of RE projects. Multilateral financial institutions, including the Green Climate Fund, have helped to reduce capital costs and enable RE investments in financially constrained settings (Briera and Lefèvre, Reference Briera and Lefèvre2024). The “China Belt and Road Initiative Investment Report” notes that China invested US$11.8 billion in green energy and hydropower in BRI countries in 2024, including US$1.8 billion in direct investment and US$10 billion in construction projects (Nedopil, Reference Nedopil2025). Nevertheless, financial inputs alone are insufficient, as policy instability and weak regulatory frameworks discourage long-term investment (Wang et al., Reference Wang, Feng and Chang2024). The BRI has facilitated energy cooperation and financing, particularly for hydropower projects in Southeast Asia (Chin et al., Reference Chin, Ong, Ooi and Puah2024). These findings highlight the need for a coordinated strategy that integrates funding, technology development, and effective legislation to promote RE adoption across BRI countries.
RE is key to promoting environmental sustainability in the BRI. BRI participation supports RE expansion in partner countries, contributing to broader sustainability goals (Geng, Reference Geng2021). Its success depends on adequate financial resources and effective implementation of supportive policies. Climate-focused financing under the BRI has advanced clean energy initiatives and energy efficiency, supporting emissions reduction efforts (Zeng et al., Reference Zeng, Sheng, Gu, Wang and Wang2022). RE adoption enhances environmental quality in various national and regional contexts. In Kazakhstan, greater reliance on RE has substantially reduced emissions (Raihan and Tuspekova, Reference Raihan and Tuspekova2022). Similar effects are observed in ASEAN countries, where a 1 per cent increase in RE use reduces emissions by 0.46 per cent (Amin et al., Reference Amin, Shabbir, Song and Abbass2024), and in OECD nations (Khan et al., Reference Khan, Zakari, Ahmad, Irfan and Hou2022). Across the BRI countries, RE production has driven modest but meaningful emission reductions (Sheng et al., Reference Sheng, Meng and Akbar2023). Increased investment and installed capacity have improved ecological performance, although gains may plateau beyond a certain threshold (Twum et al., Reference Twum, Zhang, Ding and Cobbinah2024). These findings inform the development of Hypothesis 3.
H3: RE improves environmental sustainability in BRI partner countries.
3. Data and methods
3.1. Empirical context
To test these hypotheses, we used a DiD design to estimate the direct impact of the BRI on EF. This study employs a quasi-experimental approach to compare BRI countries with their non-BRI counterparts. Although proposed in late 2013, the initiative transitioned from a concept to a formal policy in 2014. The BRI was integrated into China's national development agenda in the 2014 Government Work Report (Xinhua, 2014), marking the formation of policy frameworks, project planning, and international cooperation. Consistent with Hu and Jernej (Reference Hu and Jernej2025), Wei et al. (Reference Wei, Yan, Zeng, Yang and Wang2025) and Wu and Si (Reference Wu and Si2022), this study identified 2014 as the intervention year and coded the post-treatment period as 1 for 2014 and later, and 0 otherwise. As the study period is from 2003 to 2022, countries that formally signed a BRI cooperation agreement by 2022 constituted the treatment group, whereas the remaining countries formed the control group. Initially, all 203 World Bank-listed countries were considered; however, those lacking EF data were excluded using list-wise deletion, after which the analytical sample comprised 176 countries, including 138 BRI and 38 non-BRI countries in the treatment and control groups, respectively.
3.2. Sample and data
The data for all variables were primarily sourced from the World Bank's World Development Indicators, except for EF, which was obtained from the Global Footprint Network. This study uses a country-level balanced panel of 176 countries from 2003 to 2022, covering 7 years before and 8 years after the intervention.
The samples were selected using a two-stage process. First, 176 countries were identified based on the availability of EF data. Second, countries were assigned to the treatment group only if they formally signed a BRI cooperation Memorandum of Understanding (MoU) by the end of 2022, following the official list and joining dates reported by Nedopil (Reference Nedopil2023). This criterion ensured a robust empirical design and excluded Russia, which had not signed a formal MoU, and Italy, which withdrew from the initiative. This transparent, rule-based selection reduces potential selection bias by maintaining consistent group assignments. The final dataset included 3,520 country–year observations. Appendix Table A14 provides a list of BRI partner countries with joining dates.
3.2.1. Explained variable
The dependent variable is EF, expressed in logarithmic form (lnEF), representing the natural resource consumption of an individual, community or country relative to the Earth's regenerative capacity. The EF was calculated based on the biologically productive areas required for cropland, grazing land, fishing grounds, built-up land and forests. It is measured in Gha per person and provides a standardized metric for cross-country comparison.
3.2.2. Explanatory variable
The primary independent variable is the interaction BRI*POST, which combined BRI participation with the post-intervention period. BRI and non-BRI countries were coded as 1 (treatment group) and 0 (control group), respectively. The post-intervention period was set as 2014, with a binary variable set to 0 for years before 2014 and 1 for 2014 onward.
3.2.3. Mediating variables
The study has included two mediators: ICT and RE. The ICT Development Index is constructed from World Development Indicator data as the arithmetic mean of four normalized components per 100 people: Internet users, mobile subscriptions, fixed broadband subscriptions and fixed telephone subscriptions. This unweighted average provides a balanced and transparent measure of ICT infrastructure and access following established practices (You et al., Reference You, Li and Waqas2024). RE is measured as the share of renewable sources in the total final energy consumption, reflecting shifts in the energy mix and progress toward sustainable energy use. Its inclusion as a mediator captures its role in reducing the resource intensity and emissions. ICT development represents improvements in data exchange, automation and operational efficiency, contributing to lower energy use and reduced environmental impacts. Both mediators capture key technological and energy dynamics central to the influence of BRI and are supported by established sustainability metrics.
3.2.4. Control variables
The analysis controls for institutional, demographic and economic factors that may affect environmental outcomes – GDP, total population (POP), regulatory quality (RQ), foreign direct investment (FDI), surface area (SA), political stability (PS), and manufacturing value added as a share of GDP (MAN). These controls are guided by previous empirical studies (Sattar et al., Reference Sattar, Hussain and Ilyas2022; Elish and AboElsoud, Reference Elish and AboElsoud2024). The GDP, in constant 2015 US dollars, represents economic development and its link to resource use and environmental governance. The total population (in millions) captures demographic pressure, whereas SA (in km2) accounts for geographical scale and land use variation. FDI, measured as net inflows as a percentage of GDP, reflects economic openness and the potential environmental effects of foreign capital and technology. RQ is measured using the World Bank Worldwide Governance Indicators and reported as a percentile rank ranging from 0 to 100. Political stability accounts for the broader governance context affecting policy implementation and environmental outcomes.
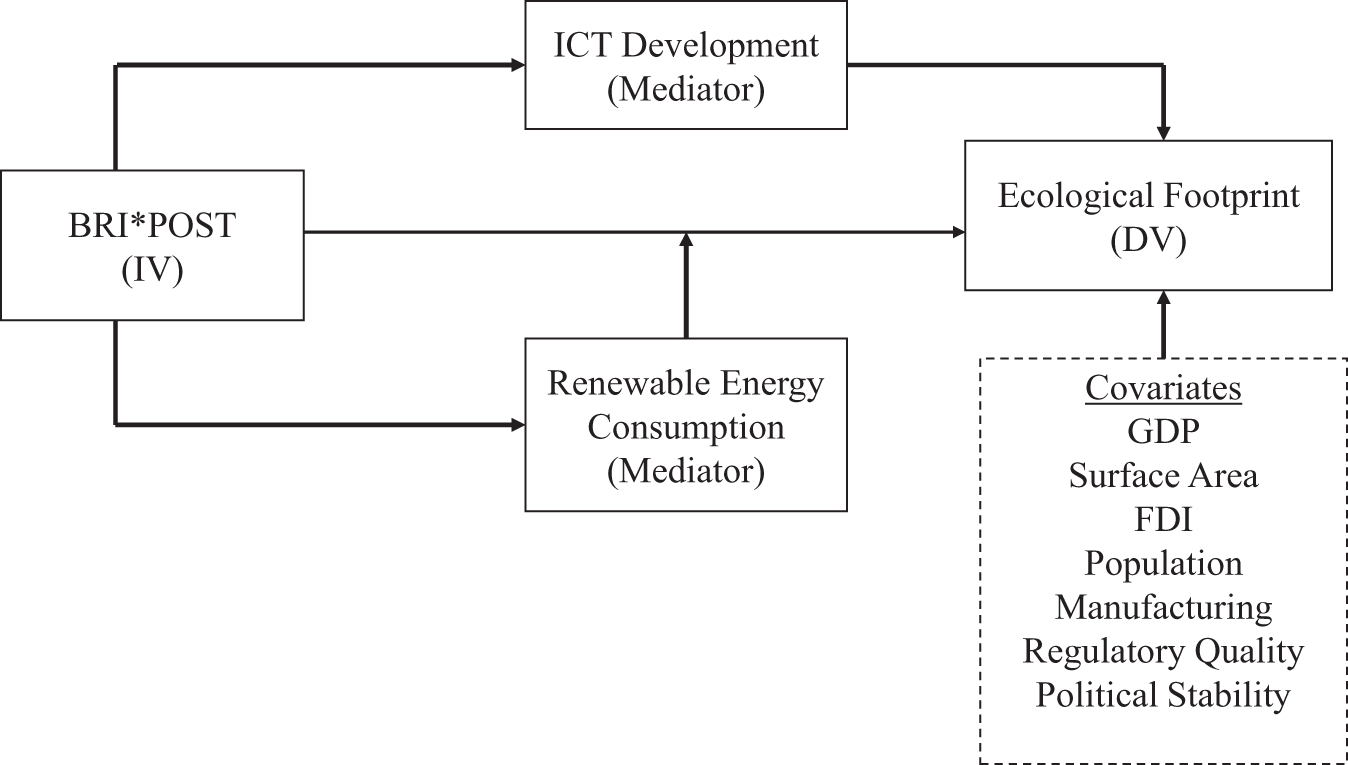
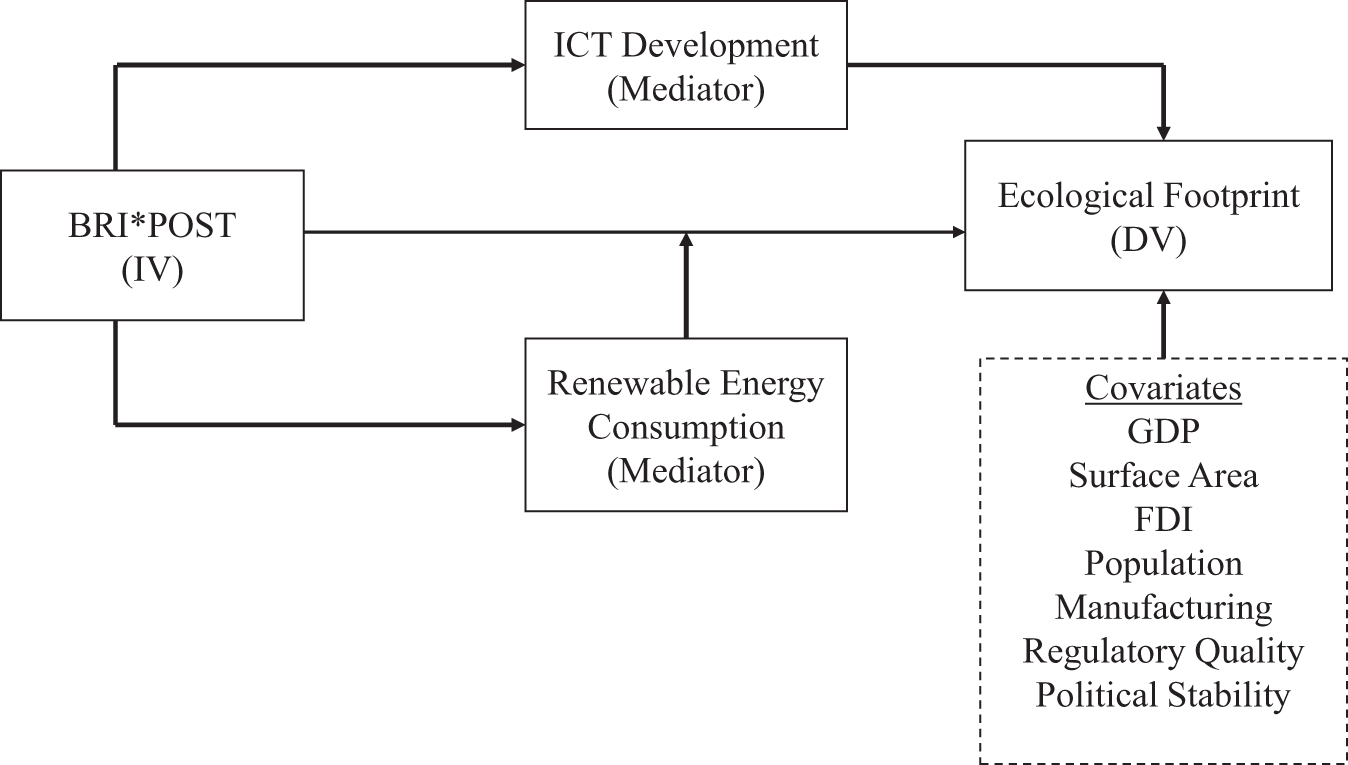
These variables offered a comprehensive framework for isolating the effects of the main factors. By controlling for contextual influences, this study reduces omitted-variable bias, yielding more accurate estimates of the determinants of environmental sustainability. Appendix Table A1 details the variable definitions and data sources, and Figure 1 illustrates the conceptual framework linking EF as an independent variable and BRI as a dependent variable.
Conceptual framework of the impact of BRI on ecological footprint.
3.3. Measure and models
A key measure in this analysis is the change in the EF of partner countries after joining the BRI. The EF represents the biologically productive land and water needed to supply consumed resources and absorb waste, considering current technology and resource management. It is expressed in gha and reflects the average biological productivity of the Earth's surface. The EF includes six components: built-up land, carbon footprint, cropland, fishing grounds, forest land, and grazing land, providing a comprehensive measure of human demand for ecological systems.
The study used DiD to compare the EF changes between BRI and non-BRI countries before and after the 2014 intervention. This widely recognized policy evaluation method, as outlined by Bertrand et al. (Reference Bertrand, Duflo and Mullainathan2004), forms the basis for this analysis. The pre — and post-treatment periods were 2003–2013 and 2014–2022, respectively. The study also tested the parallel trend assumption (PTA) to confirm that the EF trends in BRI and non-BRI countries were similar before the intervention. The baseline model is as follows:
 \begin{equation*}lnEF_{it}\,=\beta_o+\beta_1(BRI{}_i\times\,POST_t)\,+\,\beta_2X_{it}+\,\mu_t+\,\omega_c+\,\in_{it}\end{equation*}
 The DiD equation estimates the impact of the BRI on environmental sustainability, using lnEF as the dependent variable. The model includes the intercept  ${\beta _0}$, and ${\beta _1}$ captures the interaction effect of BRI participation and the post-BRI period $\left(BRI_i\times POST_t\right)$. includes control variables such as ICT, lnSA, POP, FDI, RE, PS, MAN, RQ and lnGDP, and ${\omega _c}$ denote year and country fixed effects, respectively, whereas captures unobserved factors affecting the outcome. This model assesses the impact of BRI participation and the post-2014 period on outcomes while controlling for other relevant factors.
4. Empirical results
4.1. Preliminary tests
4.1.1. Descriptive statistics
Table A2 in the appendix reports descriptive statistics for BRI partner and non-BRI countries. On average, non-BRI economies exhibit higher environmental pressure, with a mean lnEF of 1.191, compared to 0.813 for BRI participants. Non-BRI countries displayed higher ICT penetration, with an average ICT value of 47.38 compared with 34.767 for BRI partners. These differences reflect underlying structural and development gaps between the groups, which are relevant for assessing the environmental implications of the BRI.
The preliminary diagnostic checks suggested no evidence of multicollinearity or heteroscedasticity in the estimated models. All variance inflation factors remained below the threshold value of 10, with a mean value of 2.594, and the Breusch–Pagan test did not reject the null hypothesis of homoscedasticity. These diagnostic results indicate stable and reliable regression estimates. The detailed correlation results and diagnostic tests are reported in Tables A3 and A4 in the appendix.
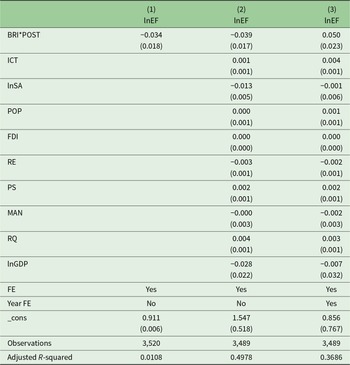
4.2. Baseline regression
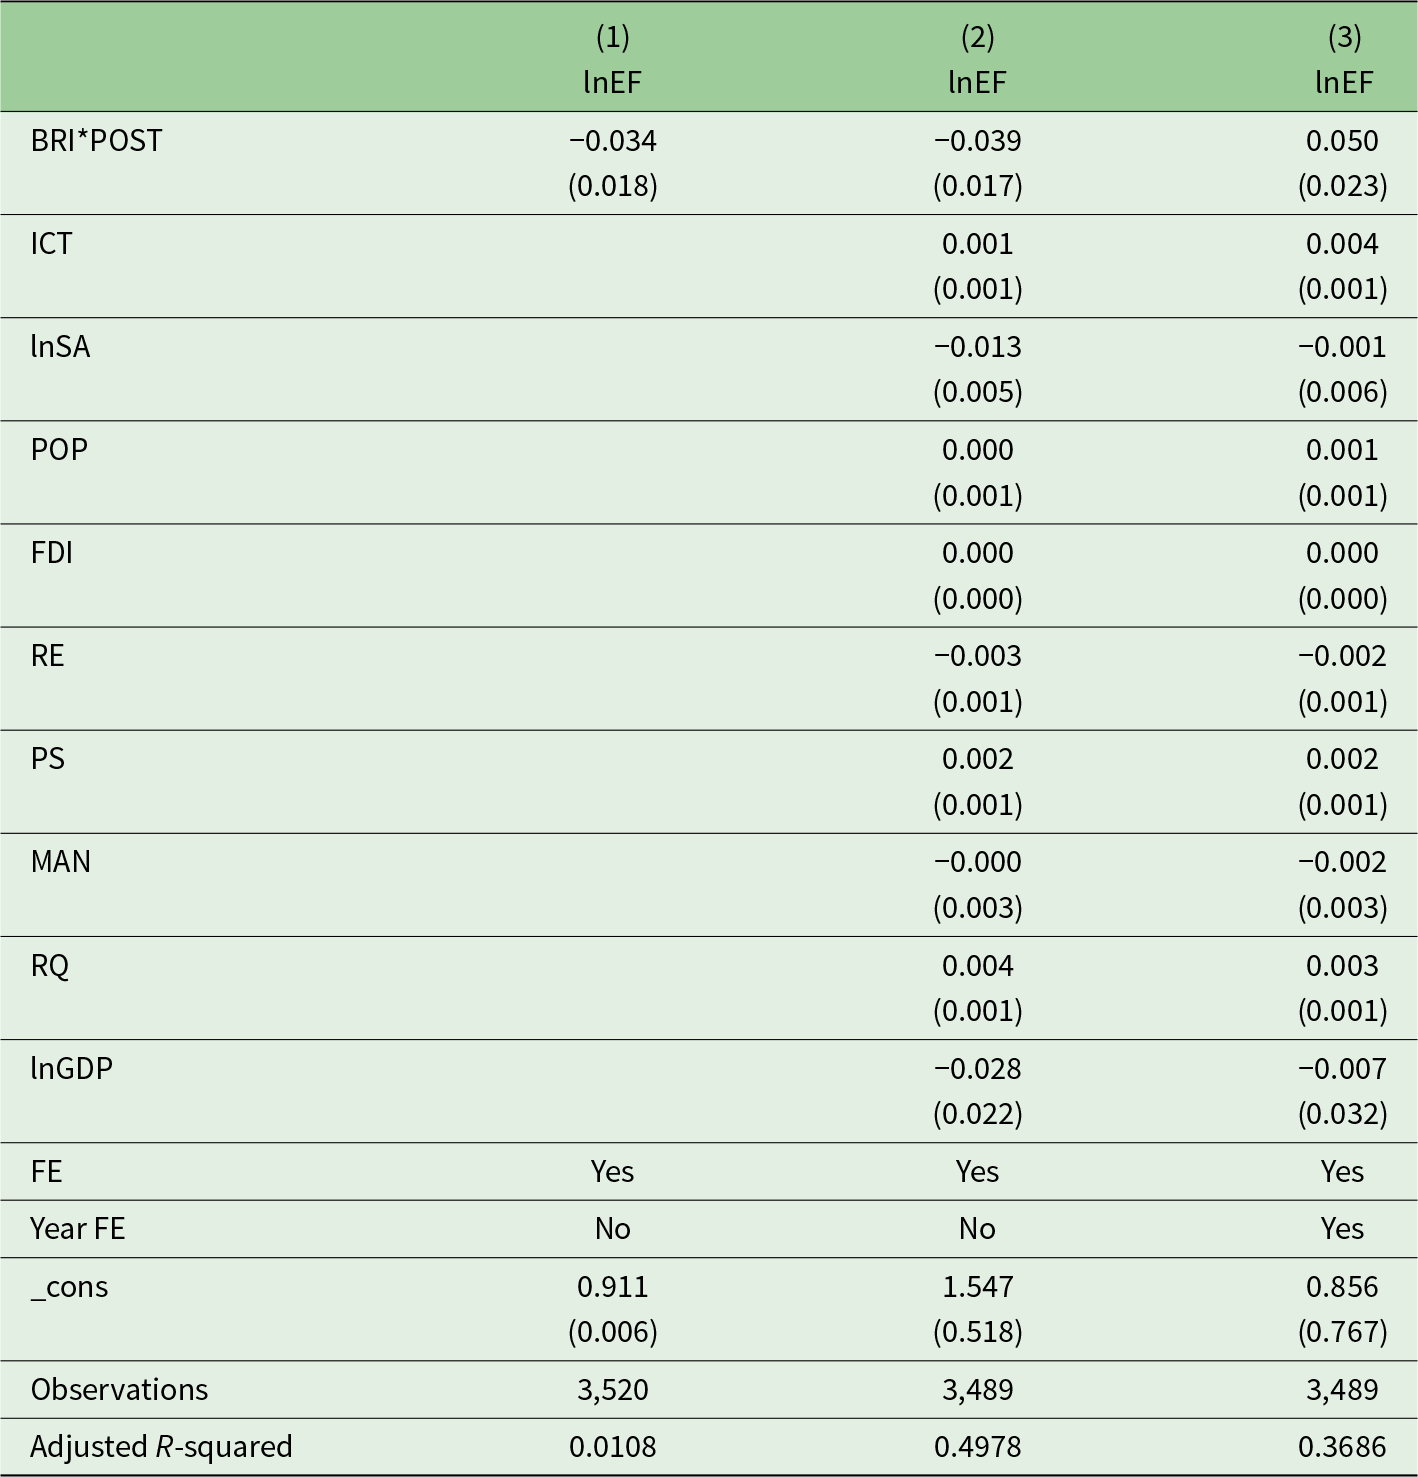
Table 1 reports baseline estimates across three model specifications. Column (1) presents the results without covariates, Column (2) adds covariates but omits year effects, and Column (3) shows the full specification with country and year effects. The H1 and H3 suggest that BRI participation increases environmental pressures, and RE use mitigates this effect. The empirical findings provide clear support for both hypotheses.
Baseline regression results for the impact of BRI on ecological footprint
Note: Standard errors are clustered by country and shown in parentheses.
In the fully specified model, the interaction term BRI*POST showed a positive and statistically significant coefficient (0.050), indicating that BRI economies experienced an approximately 5 per cent increase in EF after 2014. Similar results for EF and lnEF are reported in Tables A5 and A9. This finding aligns with previous evidence (Sattar et al., Reference Sattar, Hussain and Ilyas2022; Elish and AboElsoud, Reference Elish and AboElsoud2024). RE use partially offsets this effect, as indicated by the small yet statistically significant negative coefficient on RE (−0.002). Taken together, these results suggest that the BRI countries experienced increased environmental pressure in the post-intervention period, likely driven by infrastructure-related resource demands. This pattern is consistent with the EKC framework, as many partner economies remain in the development stage, where environmental pressures rise before stabilizing.
Following standard panel data practice, this study adopts a fixed-effects model as the primary estimation approach throughout the analysis.
4.3. Examining the PTA
The validity of the DiD estimation relies primarily on the PTA, which requires that in the absence of the intervention, the average outcomes of the treatment and control groups follow similar trajectories over time. To test this, dummy variables for the years before and after the BRI were included in the DiD model, consistent with the approach used by Zhou et al. (Reference Zhou, Wang and Luo2023). Accordingly, we estimate the following dynamic specifications:
 \begin{equation*}lnEF\,=\,\alpha_c\sum_{t=\text{2006}}^\text{2020}\beta_t(BRI_i\times\varphi_t)+\gamma\cdot X_{it}+\in_{it}\end{equation*}
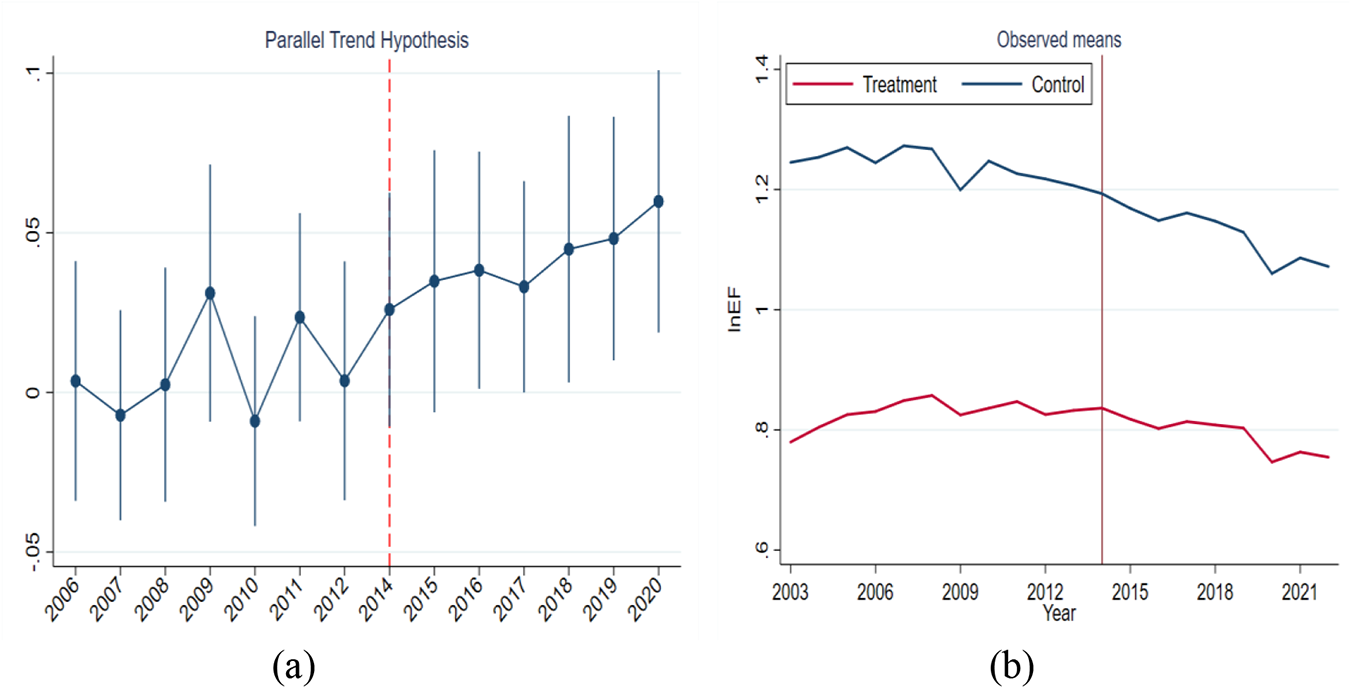
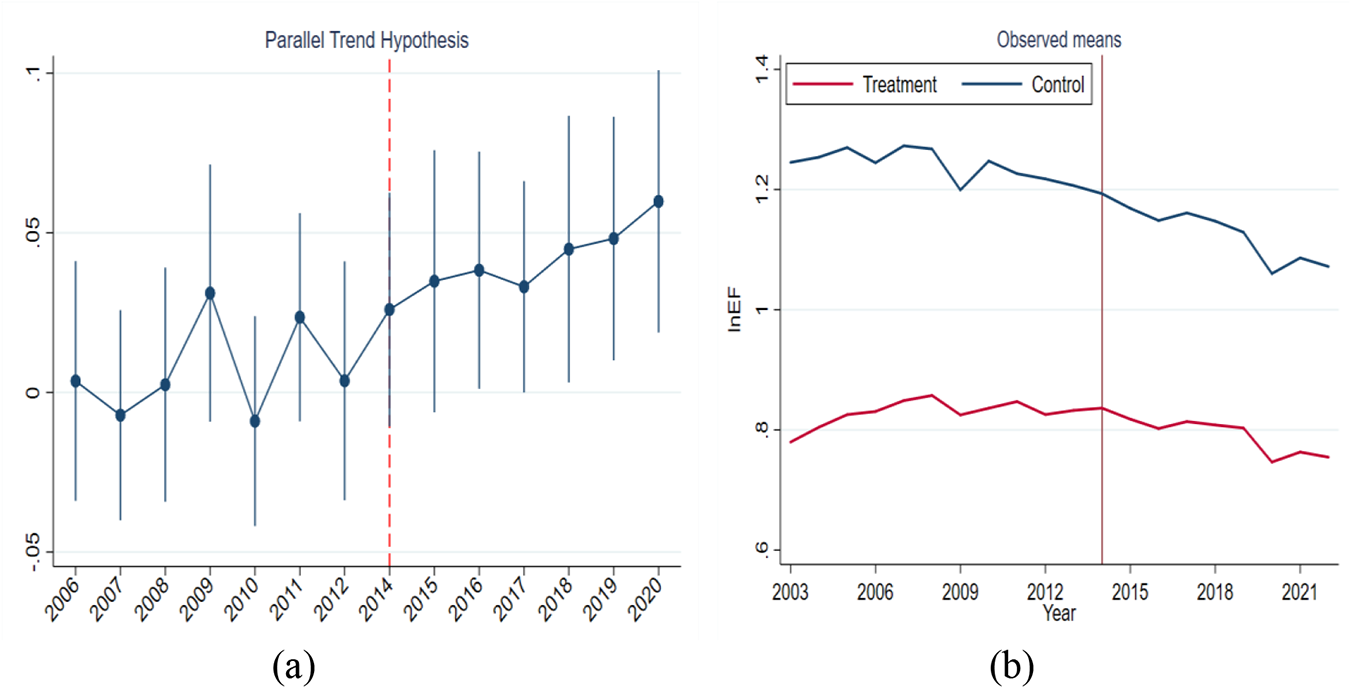
where  ${\beta _t}$ represents the year-specific interaction terms between BRI participation and year indicators, and 2013 is used as the reference year. This specification allows the identification of pre-trend behavior and post-treatment effects. The pre-intervention coefficients for 2006–2012 were statistically insignificant and showed no systematic pattern (Table A6), supporting the assumption that the treated and control groups followed similar trends before 2014. This is supported by Figure 2, which shows no systematic divergence between the groups before 2014. After 2014, the interaction coefficients exhibited a consistent upward shift, indicating a treatment effect associated with BRI participation. These results confirm the PTA, thereby strengthening the causal interpretation of the BRI*POST coefficient in the baseline regression model.
Testing the PTA by pre — and post-period trend, along with observed means.
4.4. Mechanism analysis
Appendix Table A13 reports the mechanism analysis, providing evidence on the channels through which BRI participation affects environmental sustainability. Regressions using BRI*POST as the key explanatory variable reveal significant effects on ICT and RE. The positive and significant coefficient on BRI*POST for ICT indicates improved digital infrastructure and technology diffusion, whereas the negative and significant coefficient for RE suggests a reallocation of resources away from RE investment. Other variables do not exhibit significant effects. Overall, the results indicate that BRI effects operate mainly through technological progress and shifts in energy investment priorities.
4.5. Additional robustness checks
4.5.1. Placebo test
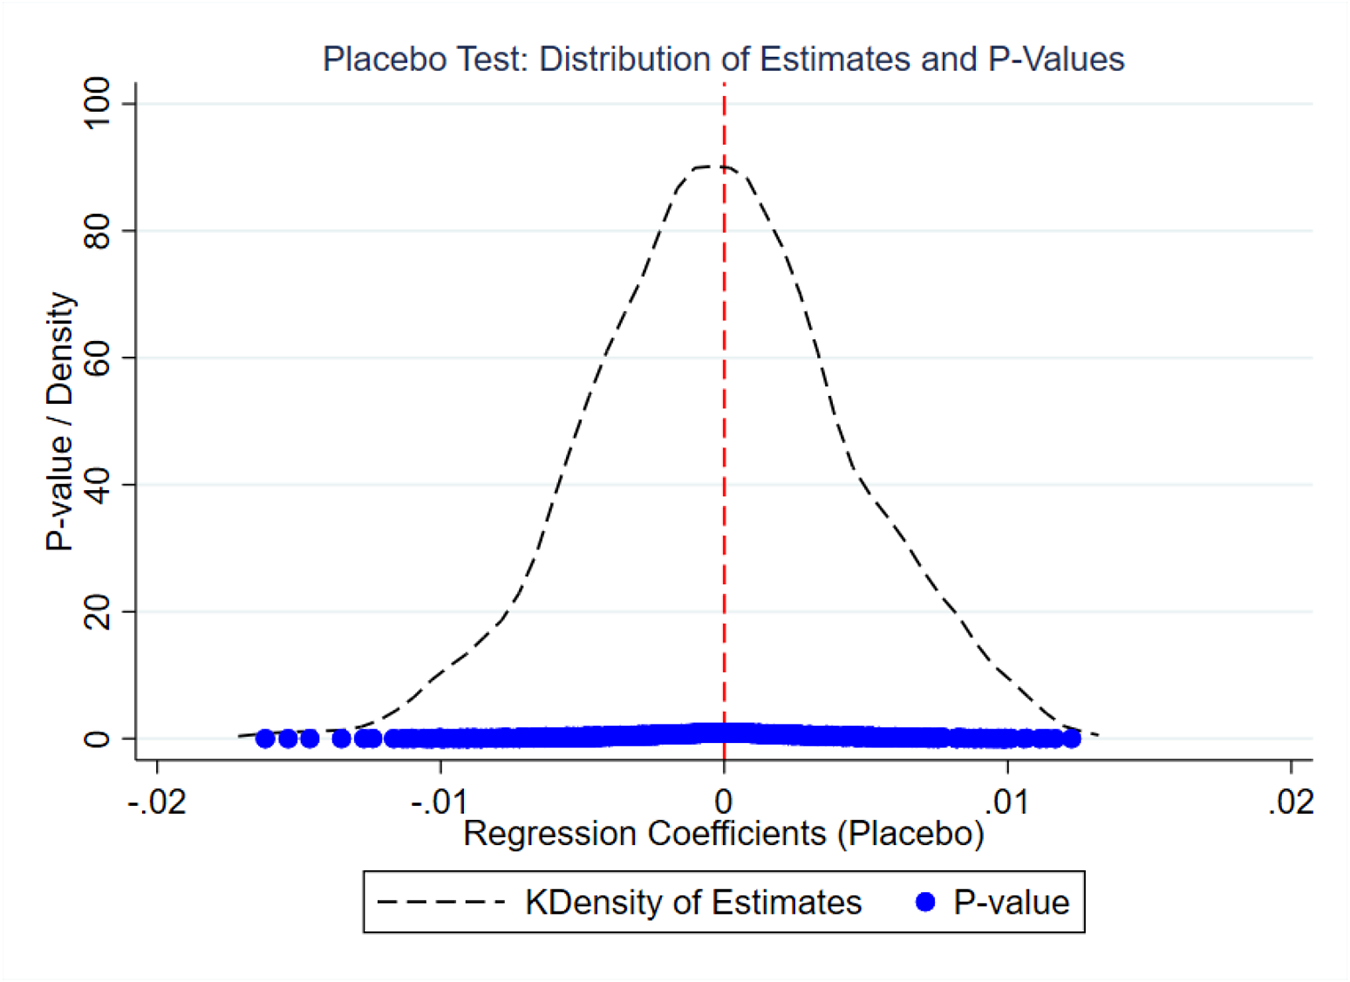
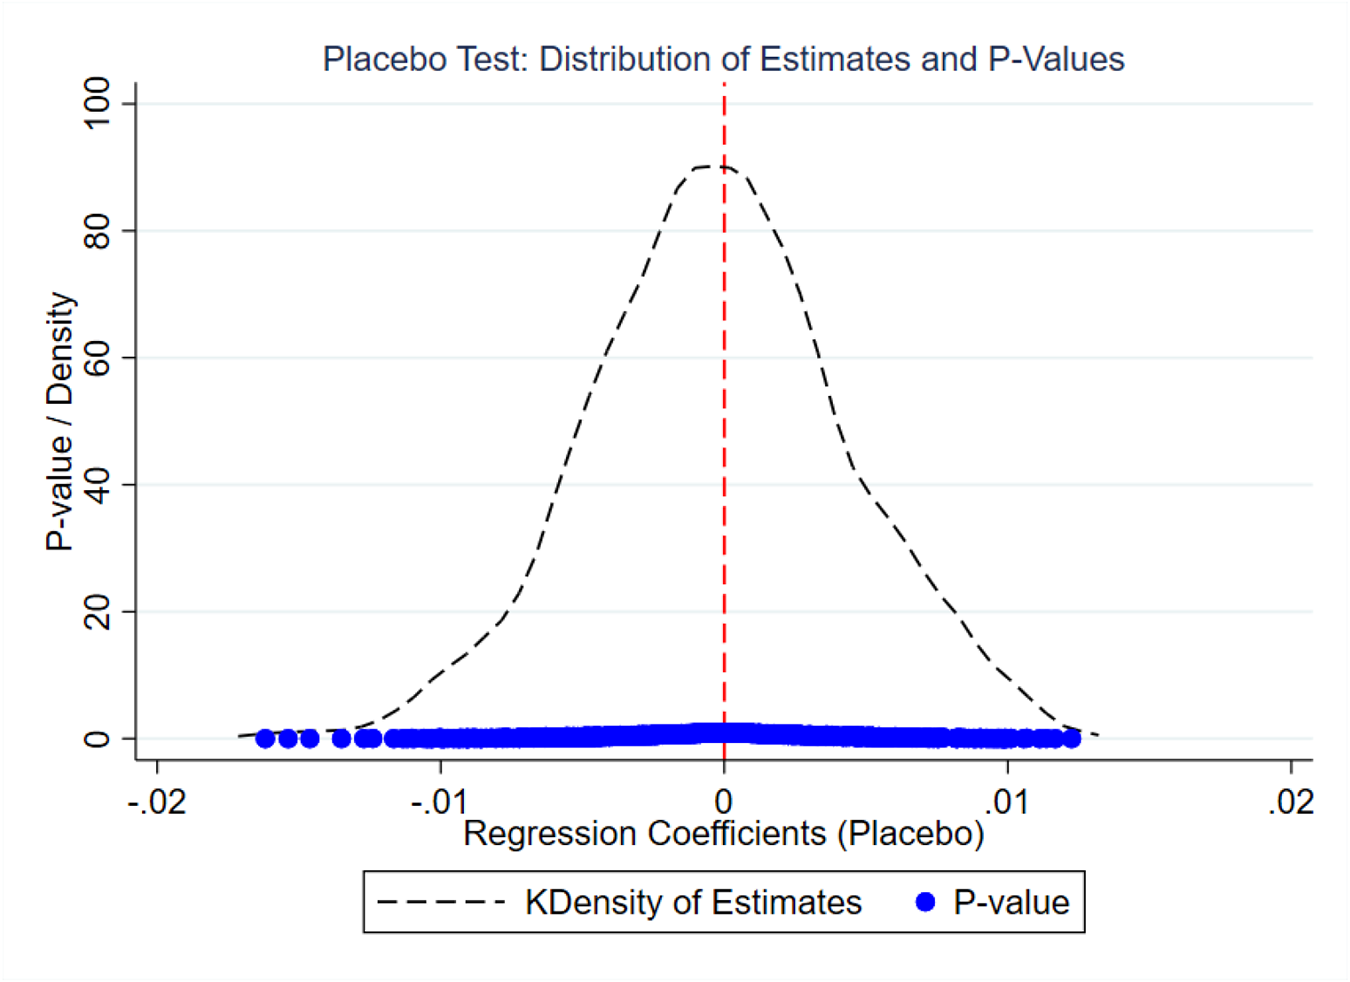
The placebo test is a falsification strategy used to evaluate the reliability of the estimated treatment effect captured by the BRI*POST. By randomly reallocating treatment status across countries and estimating the baseline DiD model 1,000 times, Figure 3 shows that the actual coefficient falls into the extreme tail of the placebo distribution, indicating that the observed effect is unlikely to be driven by random variation. Moreover, a falsification test using 2007-2010 respectively as the placebo intervention year produced statistically insignificant coefficients for the interaction and all corresponding pre- and post-treatment terms, with P-values above the conventional significance levels (see appendix Tables A7 and A8). These results show no pre-trends or timing distortions. Estimates cluster around zero with near-uniform p-values, indicating no specification bias and reinforcing that the identified BRI environmental effects are not driven by spurious correlations or arbitrary timing.
Placebo test with distribution of estimates and p-values.
4.5.2. PSM-DiD
Although our baseline strategy uses a DiD design to control for time-invariant unobserved heterogeneity, the treated and control countries may still differ systematically in terms of observable characteristics. To address this, we applied PSM as a robustness check, creating a matched sample of countries with similar economic, demographic and trade-related covariates to reduce observable selection bias. These covariates were selected because they influence a country's likelihood of participating in the BRI and its EF, ensuring that the matching addresses potential confounders. We then estimated the treatment effect on the matched sample using DiD. The PSM–DiD approach has been widely applied in policy evaluation studies to enhance causal credibility (Li et al., Reference Li, Zhou and Chen2025).
The matching procedure, based on a probit model and implemented using nearest neighbor matching with a caliper of 0.01, successfully balanced the observable covariates between the treated and control groups. The PSM results in appendix Table A11 indicate a marked improvement in covariate balance between the treated and control countries. Before matching, several covariates – including RQ, ICT, population, PS and GDP – showed large and statistically significant differences, indicating a potential baseline selection bias. After matching, the mean differences across all covariates were substantially reduced, with t-tests largely insignificant, suggesting that the treated and control groups had comparable observable characteristics. The direction and magnitude of the probit coefficients confirm the theoretical relevance of the covariates in predicting BRI participation.
The post-matching diagnostics (see Table A10 and Figure A3 in the appendix), showed a clear improvement in the covariate balance between the treated and control units. The pseudo-R2 decreased from 0.151 to 0.017, and the mean and median standardized biases declined to 8.9 per cent and 10.3 per cent, respectively, meeting the 20 per cent threshold proposed by Rosenbaum and Rubin (Reference Rosenbaum and Rubin1983). The variance ratios for most covariates were within the recommended range, and although the overall bias B was 31.0 per cent, it was acceptable for a large panel. These diagnostics confirm that the matched sample achieves a satisfactory balance, supporting a reliable DiD estimation.
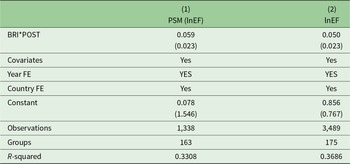
Table 2 shows that BRI participation is associated with a statistically significant increase in EF in both matched and full samples. In the matched sample (PSM–DiD), the interaction term BRI*POST was positive and statistically significant at the 5 per cent level (0.059), indicating that after controlling for covariate imbalances, treated countries experienced higher EF than comparable controls. In the full sample (standard DiD), the effect remained positive and significant (0.050), confirming the robustness of the baseline estimates. These results consistently indicate positive environmental effects of BRI participation across specifications.
PSM–DiD with matched and full sample

Notes: This table presents the matched (column (1)) and full samples (column (2)). Robust standard errors are in parentheses.
4.6. Mediation analysis
Mediation analysis evaluates whether an intervention operates through an intermediate channel. This study investigated whether ICT and RE mediate the effect of BRI participation on environmental outcomes. This approach follows standard procedures in applied economics, decomposing the total treatment effect into direct and indirect paths through a mediator. This framework is formally expressed as follows:
 \begin{equation*}lnE{F_{it}}\, = \,\,{\alpha _0} + {\alpha _1}(BR{I_{it}} \times POS{T_{it}}) + {\alpha _2}{X_{it}} + {\mu _i} + {\lambda _t} + { \in _{it}}\end{equation*}
This estimates the total effect of BRI participation on EF during the post-intervention period:
 \begin{equation*}Mediato{r_{it}} = {\beta _0} + {\beta _1}(BR{I_{it}} \times POS{T_{it}}) + {X_{it}}\delta + \mu {}_i + {\lambda _t} + { \in _{it}}\end{equation*}
This estimates the effect of BRI participation on the mediator (ICT):
 \begin{equation*}lnE{F_{it}} = \,{\theta _0} + \theta {}_1(BR{I_{it}} \times POS{T_{it}}) + {\theta _2}ICT{}_{it} + {X_{it}}\eta + {\mu _i} + {\lambda _t} + { \in _{it}}\end{equation*}
 The indirect effect is computed as the product  ${\alpha _1}{\beta _2}$, aligned with previous studies (Baron and Kenny, Reference Baron and Kenny1986; Imai et al., Reference Imai, Keele and Tingley2010; Xie et al., Reference Xie, Chen, Wang and Zhang2023). Bootstrapped confidence intervals were used to provide robust inferences for indirect effects in the panel data.
4.6.1. Mediating role of ICT
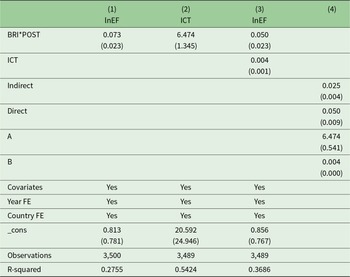
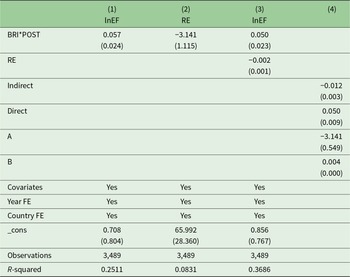
Table 3 shows that ICT partially mediates the effect of BRI participation on environmental sustainability, as measured using lnEF, thus supporting Hypothesis 2. The direct effect of BRI*POST on lnEF was 0.050, whereas the indirect effect via ICT was 0.025, indicating that approximately 33.3 per cent of the total effect (0.075) operates through the ICT channel. The mediator model demonstrates that BRI*POST significantly enhances ICT development (a = 6.474), and that including ICT in the outcome model yields a positive and significant coefficient (b = 0.004), confirming partial mediation. Bootstrap results based on 5,000 replications confirm the significance of the indirect effect. The findings indicate that BRI induced ICT expansion may raise environmental pressures in the absence of complementary green and energy efficient technologies (Khan et al., Reference Khan, Ullah and Nobanee2024).
The mediating role of ICT development
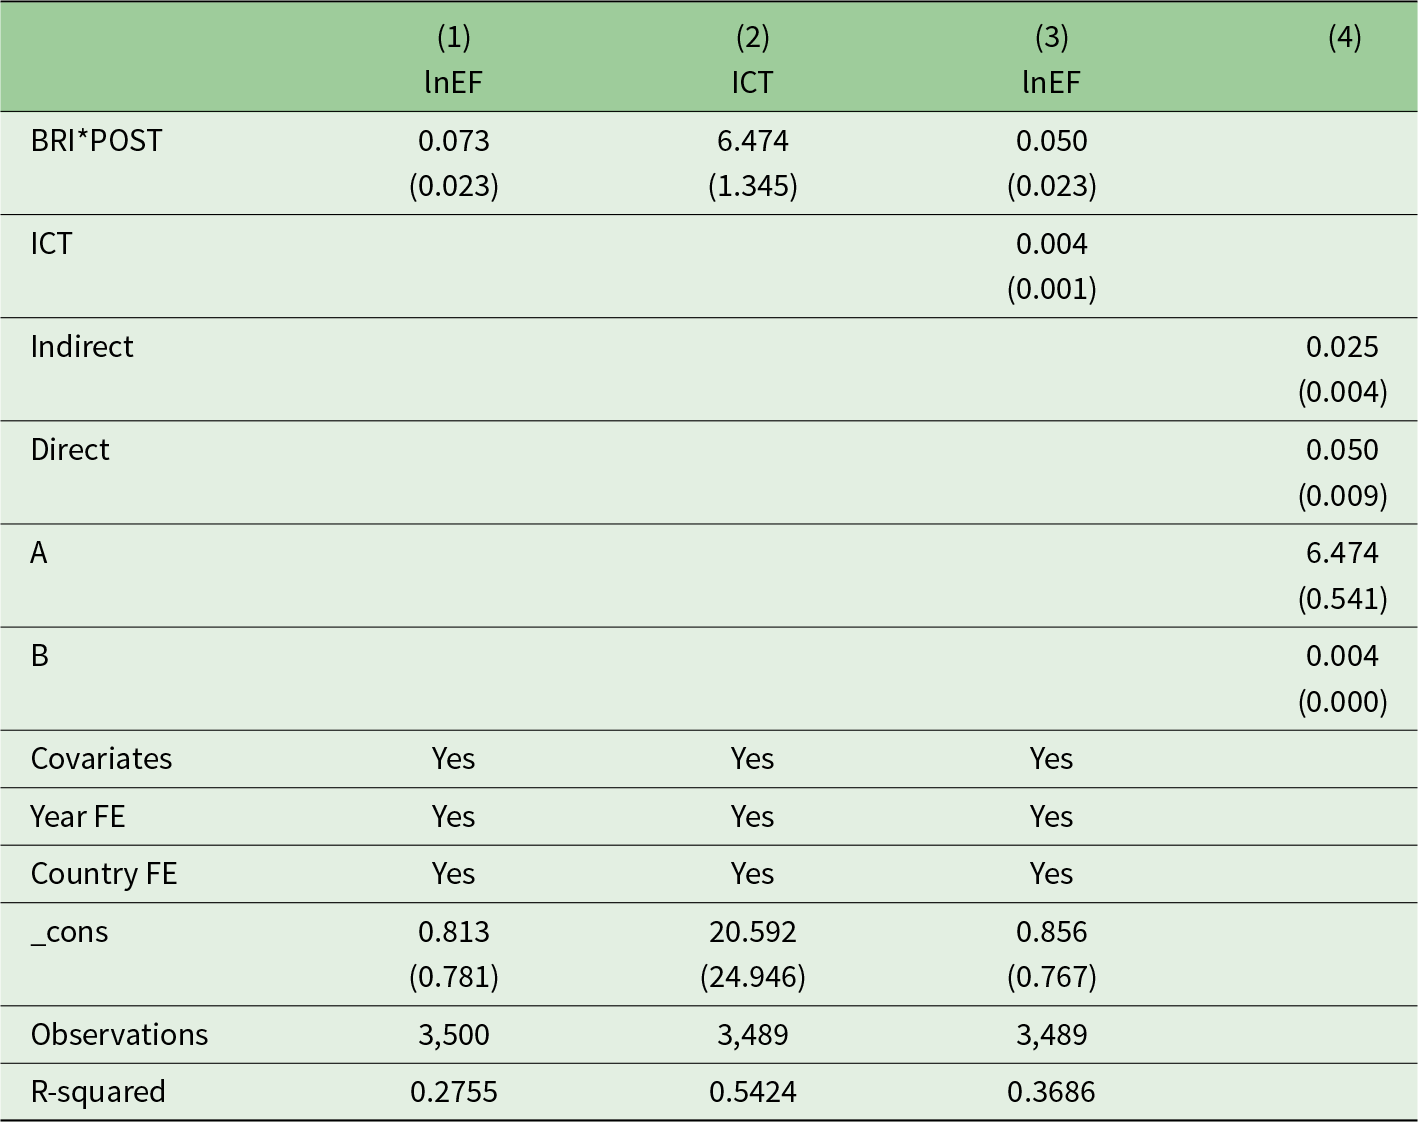
Notes: This table presents results from a two-stage mediation analysis. Column (1) reports the total effect of BRI*POST on lnEF. Column (2) shows its effect on the mediator ICT. Column (3) reports the effect of ICT on lnEF. Column (4) separates indirect and direct effects. Standard errors are clustered by country and shown in parentheses.
4.6.2. Mediating role of RE consumption
Table 4 shows that RE is a significant mediator between BRI participation and environmental outcomes, supporting Hypothesis 3. The indirect effect through RE is −0.012, whereas the direct effect is 0.050, indicating that approximately 19.4 per cent of the total effect (0.062) passes through the RE channel. The negative and significant first-stage coefficient (a = −3.141) indicates that BRI engagement promotes RE adoption, and the second-stage coefficient (b = − 0.002) confirms that higher RE use reduces environmental pressure. Bootstrap results with 5,000 replications confirm the reliability of the indirect effect. These findings indicate that RE expansion helps offset part of the environmental burden from BRI activities, consistent with evidence that RE improves environmental outcomes in BRI countries (You et al., Reference You, Li and Waqas2024).
The mediating role of RE consumption
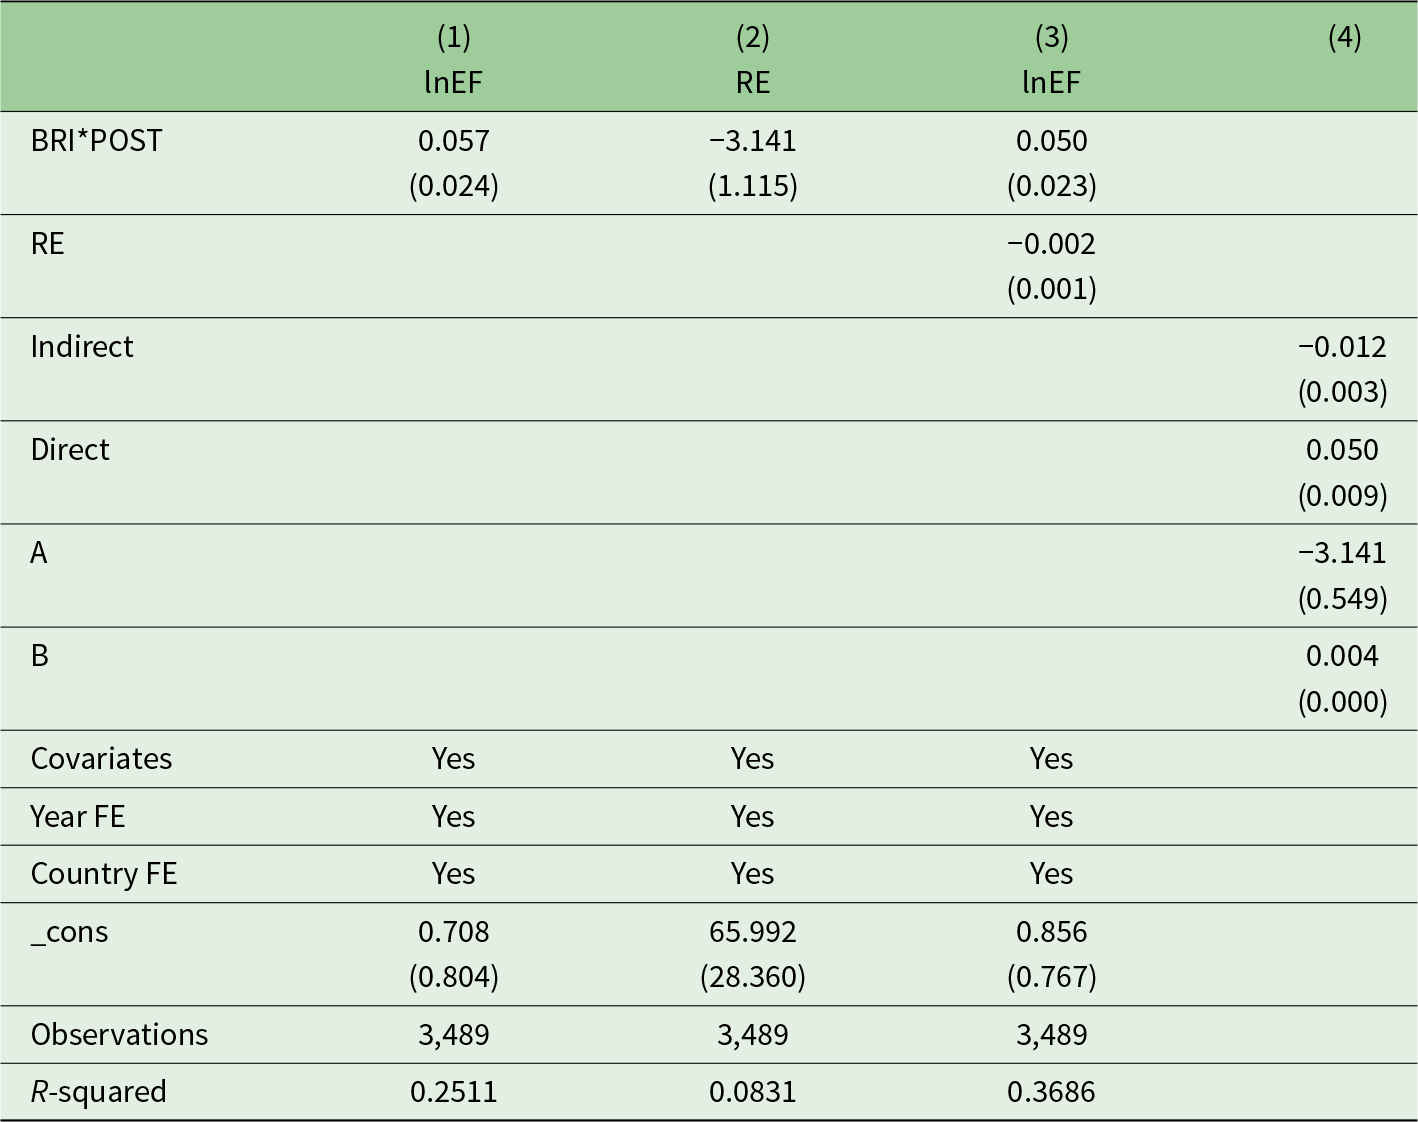
Note: Country clustered standard errors appear in parentheses.
4.7. Heterogeneity analysis
4.7.1. Geographical location
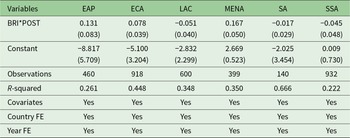
Regional heterogeneity analysis shows that the environmental effects of BRI vary across areas (Table 5). The effect was significant and positive in the Middle East and North Africa at 0.167, indicating an increase in lnEF after BRI participation. Europe and Central Asia showed a smaller, marginally significant increase of 0.078. Other regions – including East Asia and the Pacific, Latin America and the Caribbean, South Asia, and Sub-Saharan Africa – did not exhibit significant changes, indicating region-specific dynamics in environmental impacts of BRI. More substantial effects were observed in the Middle East, parts of Europe, and Central Asia, reflecting variation in BRI project scale and types. Construction activity in the Middle East increased significantly in 2024, with countries such as Saudi Arabia, Iraq and the UAE receiving major energy and infrastructure projects, increasing resource use and energy demand (Nedopil, Reference Nedopil2025). This explains the high EF in this region. In Europe and Central Asia, Mohsin et al. (Reference Mohsin, Naseem, Sarfraz and Azam2022) showed that growth in economic activity, energy consumption, and foreign investment is linked to higher emissions, consistent with the current findings. Regions with lower project intensity or slower implementation show weaker or insignificant effects, indicating that economic scale conditions environmental outcomes.
Heterogeneity analysis of geographical location
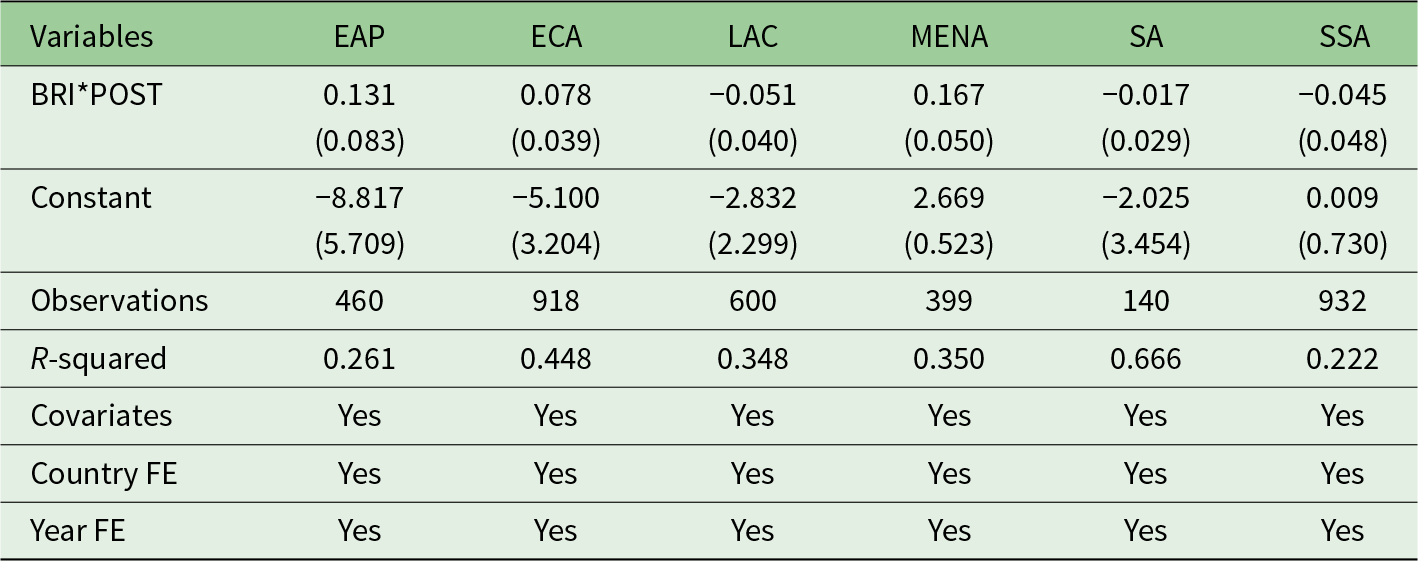
Notes: The table reports result for six geographical groups: East Asia and the Pacific (EAP), Europe and Central Asia (ECA), Latin America and the Caribbean (LAC), Middle East and North Africa (MENA), South Asia (SA) and Sub-Saharan Africa (SSA). Robust standard errors are shown in parentheses.
4.7.2. Income group
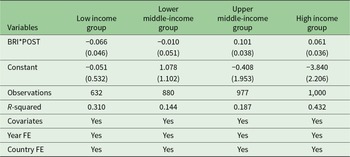
Table 6 shows that the environmental effects of the BRI vary by income group. Low- and lower-middle-income countries exhibit no significant EF changes, whereas upper-middle- and high-income countries exhibit significant and marginally significant increases, indicating stronger environmental pressures in more developed economies. These effects reflect large capital intensive projects and stronger capacity to absorb Chinese FDI, which can intensify energy use and emissions. Pham et al. (Reference Pham, Nguyen, Nguyen and Tran2025) confirm that outward FDI increases CO2 emissions where industrial activity and technological capacity are higher.
Heterogeneity analysis by income group
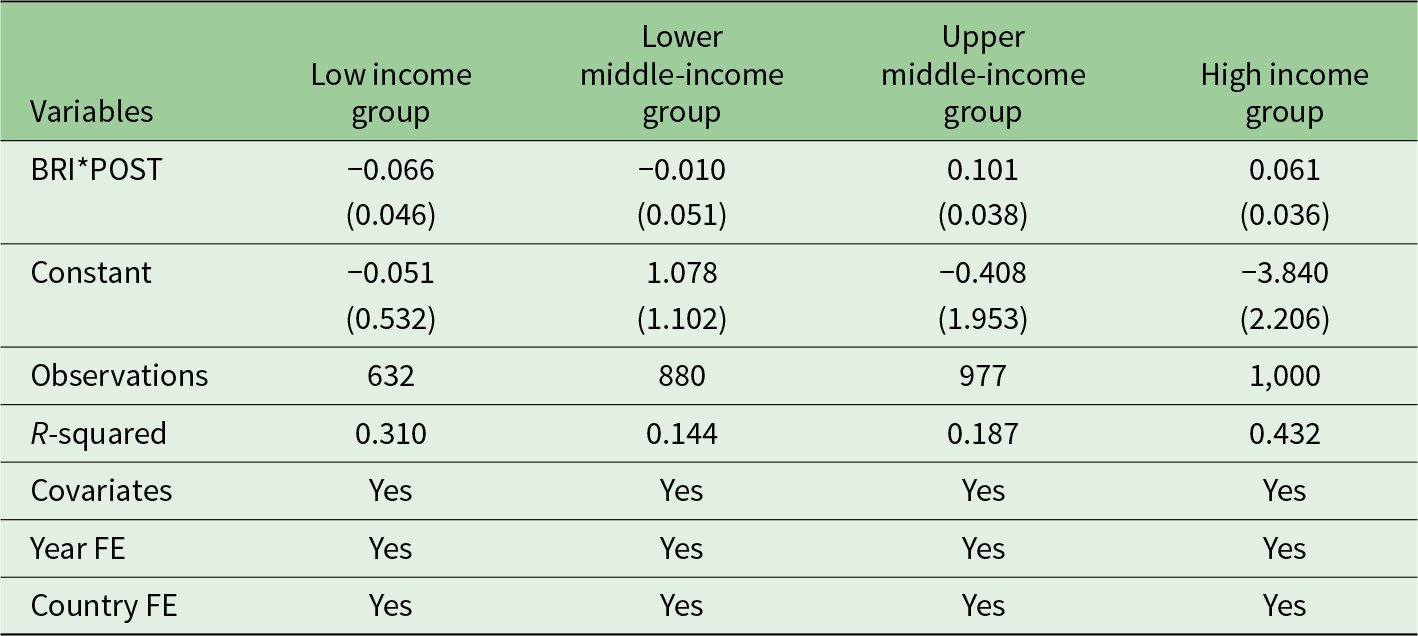
Note: Robust standard errors reported in parentheses.
4.7.3. Time of joining
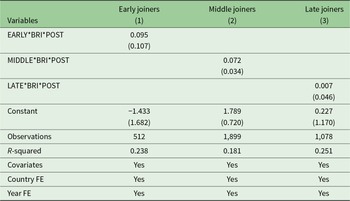
Table 7 shows that environmental impacts of BRI vary by accession timing and over time; related estimates by year are presented in Table A12. Middle joiners exhibit a significant increase in EF (0.072), whereas early and late joiners show no significant change, indicating limited or no observable impact. These findings suggest that mid-period entrants faced more environmentally intensive projects, whereas early joiners likely benefited from longer adjustment periods, and late joiners have yet to experience substantial environmental effects from BRI participation.
Time of joining the BRI
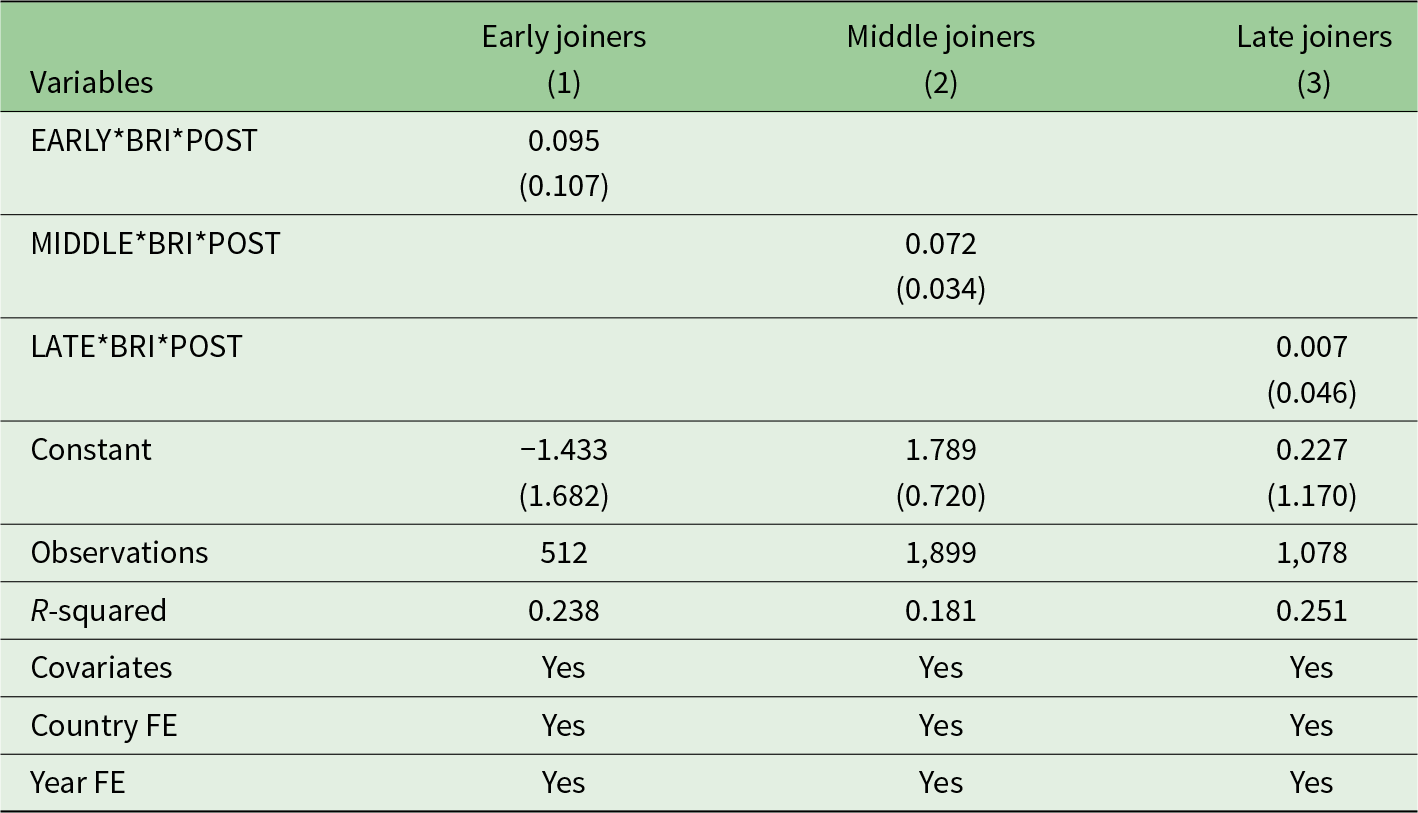
Notes: Columns (1), (2), and (3) report results for countries that joined the BRI before 2016, between 2016 and 2019, and after 2019, respectively. Robust standard errors are in parentheses.
4.8. Discussion
This study contributes to the literature by assessing the environmental effects of BRI using lnEF as a sustainability indicator. BRI participation was confirmed to be associated with a deteriorating EF in partner countries (Elish and AboElsoud, Reference Elish and AboElsoud2024). The analysis shows that ICT acts as an adverse mediator, as ICT-driven activity increases energy demand, infrastructure expansion and electricity use, thereby intensifying ecological pressure. This is consistent with Wu et al. (Reference Wu, Xu, Wang, Jiang, Xue, Jiang and Quan2025), who reported that the negative impact of ICT on biocapacity outweighed its mitigating effect on EF across most quantiles, thus explaining its environmentally adverse role in several country groups. RE consumption mitigates the adverse environmental effects of the BRI, underscoring the role of clean energy investments in sustainability efforts. The results provide partial support for EMT, in line with Bugden (Reference Bugden2022), indicating that technological progress alone cannot offset the environmental stress linked to economic and industrial expansion. These findings are consistent with the EKC hypothesis, which predicts increasing ecological pressure in the earlier stages of economic growth (Huang et al., Reference Huang, Rahman, Meo, Ali and Khan2024). Overall, this evidence supports the hypotheses of this study. Hypothesis 1 is confirmed, indicating that BRI participation worsens environmental sustainability. Hypothesis 2 is supported, with ICT mediating the relationship between BRI and EF, although the effect varies across regions and income groups. Hypothesis 3 is validated, as RE consumption is negatively associated with EF.
The heterogeneity analysis provides additional insights. The largest increase in EF was observed in the MENA region (Elish and AboElsoud, Reference Elish and AboElsoud2024), whereas Europe and Central Asia showed smaller but marginally significant increases. In terms of income level, upper-middle — and high-income countries experienced a higher EF after BRI participation. Countries that joined from 2016 to 2019 exhibited a significant increase in EF, suggesting differences in project scale, composition, or regulatory preparedness. These results emphasize the role of local economic and institutional conditions in shaping environmental outcomes and highlight the dual nature of the BRI, which combines efficiency gains with increased ecological pressure.
5. Conclusion and policy recommendations
5.1. Conclusion
This study shows that BRI participation has a statistically significant effect on environmental sustainability, as measured using EF per capita. Baseline estimates indicate an approximately 5 per cent increase in ecological pressure after BRI implementation, which increases to approximately 5.9 per cent after accounting for endogeneity and selection bias using fixed effects and the PSM–DiD approach. The BRI-related environmental effects vary across countries and depend on regional, institutional and energy structures. RE mitigates these effects, as higher use is associated with lower EF. In contrast, ICT expansion – particularly under the Digital Silk Road – intensifies environmental pressure mainly through increased energy demand. Stronger regulatory quality offsets part of the adverse environmental impact of the BRI, reinforcing the role of institutional capacity in aligning development initiatives with environmental objectives.
5.2. Theoretical contributions
These findings contribute to theoretical research by engaging multiple frameworks. The EKC hypothesis is partially supported as most BRI countries remain in the upward phase of the curve, where economic growth correlates with environmental degradation, with no identifiable turning point. This study examined the role of EMT, demonstrating that technology without sustainable energy can exacerbate environmental pressures rather than reduce them. ICT expansion under the BRI improves efficiency; however, it does not improve environmental outcomes unless paired with clean energy solutions. Overall, this study elucidates how large-scale development initiatives interact with ecological dynamics and institutions, providing policy relevant insights for aligning infrastructure investment with environmental sustainability.
5.3. Policy recommendations and future research
These findings highlight key policy imperatives for aligning the BRI with environmental sustainability. Environmental Impact Assessments should apply to all BRI projects, covering ICT impacts. A Green Technology Fund could finance renewable-powered digital systems, low-emission data centers and networks. A standardized sustainability certification framework consistent with global best practices can improve accountability, and cross-country policy exchange platforms can spread cleaner technologies and regulatory norms. Future research should aim to capture the long-term environmental effects of the BRI, conduct sector-specific analyses to distinguish project impacts, compare the BRI with other global infrastructure initiatives, and incorporate subnational or more detailed governance and environmental indicators to improve measurement precision and robustness.
Supplementary material
The supplementary material for this article can be found at https://doi.org/10.1017/S1355770X26100473.
Funding
This research was supported by the National Science Foundation (Grant No. 72572125).
Competing interests
The authors declare none.


 Open access

