

Excessive dietary intakes of refined carbohydrates and fat strongly correlate with weight gain, obesity and associated metabolic diseases( Reference Conterno, Fava and Viola 1 ), while also influencing the intestinal microbiota composition of the host( Reference Turnbaugh, Backhed and Fulton 2 – Reference Walker, Ince and Duncan 5 ). The human intestine harbours trillions of micro-organisms, containing over 100-fold more genes than the host genome, whereby the collective genome of these micro-organisms has co-evolved with the host and contributes to biochemical and metabolic functions that the host could not otherwise perform( Reference Ley, Turnbaugh and Klein 6 – Reference Backhed, Ding and Wang 8 ).
Recent advances in non-culture-based analysis, such as 16S rRNA sequencing technology, have provided extensive data in relation to the microbial composition of an ecosystem. Briefly, the 16S rRNA gene has been most frequently targeted as a means of identifying the microbial composition of an ecosystem due to its presence in all prokaryotes and the existence of variable domains that allow different taxa to be distinguished( Reference Guinane and Cotter 9 ). Such technology has revealed clear alterations in the intestinal microbiota of obese mouse models( Reference Murphy, Cotter and Healy 10 ) and human subjects( Reference Ley, Turnbaugh and Klein 6 ), compared with their lean counterparts. The obese phenotype harbours a gut microbial population that is capable of extracting energy efficiently from ingested food and has superior ability to produce SCFA( Reference Turnbaugh, Ley and Mahowald 11 , Reference Schwiertz, Taras and Schafer 12 ). Recent studies have reported the effects of specific dietary fatty acid subtypes, such as SFA, MUFA and PUFA, on metabolic parameters and intestinal microbial populations( Reference Buettner, Parhofer and Woenckhaus 13 – Reference Devkota, Wang and Musch 17 ). For example, Buettner et al. ( Reference Buettner, Parhofer and Woenckhaus 13 ) showed a reduction in liver inflammation and TAG levels following high levels of fish oil feeding, while others have demonstrated that hamsters fed a low-MUFA diet with a low ratio of PUFA:SFA exhibited increased weight gain and body fat accumulation( Reference Liao, Liou and Shieh 14 ). Furthermore, while a diverse intestinal microbiota is preferable, ingestion of a high-fat diet containing palm oil has been reported to decrease bacterial diversity( Reference de Wit, Derrien and Bosch-Vermeulen 15 , Reference Mujico, Baccan and Gheorghe 16 ). While some studies have shown that subtle alterations caused by the ingestion of different dietary fatty acid subtypes indeed have an impact on the intestinal microbiota, the major difficulty arises in linking these changes in the microbiota to the metabolic health status of the host. Potential mechanisms that link how the diet alters the intestinal microbiota have been suggested, such as through changes to lipid metabolism-related genes in the distal small intestine or through changes in host bile composition caused by the diet( Reference de Wit, Derrien and Bosch-Vermeulen 15 , Reference Devkota, Wang and Musch 17 , Reference Huang, Leone and Devkota 18 ); however, it is imperative to further understand the influence that different fat qualities, as opposed to quantities and energy types, have on the intestinal microbiota for the future prevention of obesity.
Therefore, the aims of the present study were to investigate how different qualities of fat in the diet, achieved through altering dietary fatty acid compositions and different sources of energy in the diet, have an impact on the metabolic health status of the host, and furthermore, to investigate the influence of diets on the delicate nature of host intestinal microbiota composition by employing 16S rRNA sequencing technology. For this purpose, mice were fed high-fat (HF, 45 % energy from fat) diets containing either (1) palm oil (mainly SFA), (2) olive oil (MUFA), (3) safflower oil (n-6 PUFA) or (4) flaxseed/fish oil (n-3 PUFA). In parallel, to investigate metabolic parameters and the intestinal microbiota composition of the host, mice were fed low-fat (LF) diets rich in either maize starch (12 % energy from fat and 41 % maize starch) or sucrose (12 % energy from fat and 65 % sucrose) for 16 weeks.
Materials and methods
Animals and diets
Wild-type C57BL/6J male mice (21 d old) were obtained from Harlan Limited and housed under barrier-maintained conditions within the Biological Services Unit, Teagasc, Moorepark. All experiments involving animals were approved by the University College Cork Animal Ethics Committee, and experimental procedures were conducted under appropriate license from the Irish Government in compliance with the institutional and national guidelines for the care and use of animals. Mice were allowed to acclimatise for 5 weeks before the commencement of the experiments, and were subsequently randomly divided into the following six dietary groups (n 9–10 mice per group): (1) LF-high-maize starch diet (12 % energy from fat and 41 % maize starch; n 10); (2) LF-high-sucrose diet (12 % energy from fat and 65 % sucrose; n 10); (3) HF-palm oil (mainly SFA) diet (45 % energy from fat; n 10); (4) HF-olive oil (extra-virgin) (MUFA) diet (45 % energy from fat; n 9); (5) HF-safflower oil (n-6 PUFA) diet (45 % energy from fat; n 10); (6) HF-flaxseed/fish oil (n-3 PUFA) diet (45 % energy from fat; n 9). Mice were housed in groups of four to five per cage with two cages per dietary treatment group, allowed free access to food and water at all times and maintained under a 12 h light–12 h dark cycle. All diets were supplied by Harlan Limited. Fatty acid compositions of the experimental diets are shown in Table 1. Body weight and food intake were recorded weekly. Following 16 weeks of dietary treatment, fat and lean body mass were measured using a Minispec mq benchtop NMR spectrometer (Bruker Instruments), and mice were killed by cervical dislocation. Liver, brain, fat pads (epididymal, perirenal, mesenteric and subcutaneous) and caecal contents were removed, blotted dry on filter paper, weighed and flash-frozen immediately in liquid N2. Blood samples were collected from fasted animals and allowed to clot for at least 30 min at 4°C before centrifugation at 2000 g for 20 min. All samples were stored at − 80 °C until processed.
Dietary components and fatty acid compositions of experimental oils

LF, low fat; HF, high fat.
Biochemical markers and measurements of plasma variables
Blood glucose was determined using a Contour glucose meter and blood glucose strips. Plasma insulin and leptin concentrations were measured using the Ultra Sensitive Mouse Insulin ELISA Kit (Crystal Chem, Inc.) and the Mouse Leptin ELISA Kit (Crystal Chem, Inc.), according to the manufacturer's instructions. Plasma NEFA levels were determined using the commercial NEFA-HR( Reference Turnbaugh, Backhed and Fulton 2 ) kit (Wako Diagnostics), and plasma TAG levels were measured using Infinity Triglyceride Liquid Stable Reagent (Thermo Scientific).
Determination of liver TAG levels
Lipids from 50 mg of frozen liver were extracted and purified according to the method of Folch( Reference Folch, Lees and Sloane-Stanley 19 ). Liver lipids were extracted using chloroform–methanol (2:1, v/v; Thermo Scientific) and an aliquot of the organic phase was collected, dried and resuspended in Infinity Triglyceride Liquid Stable Reagent (Thermo Scientific). All samples and standards were analysed in duplicate, and TAG content was determined as described previously( Reference Murphy, Cotter and Healy 10 ).
RNA extraction and complementary DNA synthesis
Total RNA was isolated from liver tissue using the commercial RNeasy mini kit (Qiagen), according to the manufacturer's instructions, and quantified using the Nanodrop (Thermo Scientific). Single-stranded complementary DNA (cDNA) was synthesised from 1 μg of total RNA using 2·5 ng/μl of random primers (Promega), 10 mm-PCR nucleotide mix (Promega), 40 units/μl of RNasin Plus RNase Inhibitor (Promega) and Im-Prom II reverse transcriptase (Promega), according to the manufacturer's instructions.
Real-time PCR analysis
Amplification of generated cDNA was performed in the LightCycler 480 System (Roche Diagnostics Limited) using 0·25 μm-primers (Eurofins MWG Operon), 1 μl cDNA and the LightCycler 480 SYBR Green I Master Kit (Roche Diagnostics Limited), according to the manufacturer's instructions. Real-time PCR conditions were set at 95°C for 10 min followed by fifty cycles at 95°C for 10 s, 60°C for 5 s and 72°C for 15 s. Specific forward and reverse primers used to amplify cDNA were newly designed and are listed as follows: fatty acid synthase (Fas) cDNA: forward 5′-GGCCACCTCAGTCCTTGATATCATG-3′ and reverse 5′-GCCCGCGAACCACTAACGAG-3′; sterol regulatory element-binding protein-1c (Srebp-1c) cDNA: forward 5′-CTCCAGCTCATCAACAACCAAGAC-3′ and reverse 5′-AGAGGAGGCCAGAGAAGCAGAAGA-3′; PPARα cDNA: forward 5′-ATGGGGGTGATCGGAGGCTAATAG-3′ and reverse 5′-GGGTGGCAGGAAGGGAACAGAC-3′; PPARγ cDNA: forward 5′-TCAGGTTTGGGCGGATGC-3′ and reverse 5′-TCAGCGGGAAGGACTTTATGTATG-3′. All samples were analysed in duplicate and normalised to β-actin as a constitutively expressed control gene: forward 5′-AGAGGGAAATCGTGCGTGAC-3′ and reverse, 5′-CAATAGTGATGACCTGGCGT-3′. Melting curve analysis allowed validation of the authenticity of real-time PCR products. Basic relative quantification of expression was determined using the comparative 2− ΔΔC t method.
Lipid extraction and fatty acid analysis
Lipids were extracted and purified with chloroform–methanol (2:1, v/v; Thermo Scientific) according to the method of Folch( Reference Folch, Lees and Sloane-Stanley 19 ). Fatty acid methyl esters (FAME) were prepared using first 10 ml of 0·5 m NaOH (Sigma) in methanol for 10 min at 90°C followed by 10 ml of 14 % BF3 in methanol (Sigma) for 10 min at 90°C( Reference Park and Goins 20 ). FAME were recovered with hexane (Fisher Scientific). Before GLC analysis, samples were dried over 0·5 g anhydrous sodium sulphate (Sigma) for 1 h and stored at − 20°C. FAME were separated by GLC (Varian 3400; JVA Analytical) fitted with a flame ionisation detector using a Chrompack CP Sil 88 column (100 m × 0·25 mm internal diameter and 0·20 μm film thickness, Chrompack; JVA Analytical) and He as a carrier gas. The column oven was programmed initially at 80°C for 8 min and then increased by 8·5°C/min to a final column temperature of 200°C. The injection volume used was 0·6 μl, with an automatic sample injection on a SPI 1093 splitless on-column temperature-programmable injector. Peaks were integrated by using the Varian Star Chromatography Workstation version 6.0 software, and were identified by comparison of retention times with pure FAME standards (Nu-Chek Prep). The percentage of individual fatty acids was calculated according to the peak areas relative to the total area (total fatty acids were set at 100 %). All fatty acid data are presented as means with their standard errors in g/100 g FAME.
SCFA analysis
Approximately 100 mg of caecal contents were vortex-mixed with 1·0 ml Milli-Q water and after standing for 10 min at room temperature, the contents were centrifuged at 10 000 g for 5 min to pellet bacteria and other solids. A supernatant fluid was obtained, to which 3·0 mm-2-ethylbutyric acid (Sigma) was added as an internal standard, and the samples were filtered before being transferred to clean vials. Standard solutions containing 10·0, 8·0, 6·0, 4·0, 2·0, 1·0 and 0·5 mmol/l of acetic acid, propionic acid, isobutyric acid and butyric acid (Sigma), respectively, were used for calibration. The concentration of SCFA was measured using a Varian 3500 GC flame ionisation system, fitted with a Nukol-FFAP column (30 m × 0·32 mm × 0·25 μm; Sigma). He gas was used as a carrier at a flow rate of 1·3 ml/min. The initial oven temperature was 100°C for 0·5 min, raised to 180°C at 8°C/min and held for 1 min, then increased to 200°C at 20°C/min, and finally held at 200°C for 5 min. The temperatures of the detector and injector were set at 250 and 240°C, respectively. Peaks were integrated by using the Varian Star Chromatography Workstation version 6.0 software. Standards were included in each run to maintain calibration.
DNA extraction and pyrosequencing
Total DNA was extracted from the caecal contents of all mice using the QIAamp DNA Stool Mini Kit (Qiagen), coupled with an initial bead-beating step. Universal 16S rRNA primers, designed to amplify from highly conserved regions corresponding to those flanking the V4 region, as described previously( Reference Murphy, Cotter and Healy 10 ), were used for Taq-based PCR amplification. Sequencing was performed on a Roche 454 GS-FLX using Titanium chemistry within the Teagasc 454 Sequencing Platform. Raw sequences were quality trimmed using the Qiime Suite of programmes( Reference Caporaso, Kuczynski and Stombaugh 21 ); any reads not meeting the quality criteria of a minimum quality score of 25 and a sequence length shorter than 150 bp for 16S amplicon reads were discarded. Trimmed FASTA sequences were then BLASTed( Reference Altschul, Madden and Schaffer 22 ) against a previously published 16S-specific database( Reference Urich, Lanzen and Qi 23 ) using default parameters. The resulting BLAST output was parsed using MEGAN( Reference Huson, Auch and Qi 24 ). MEGAN assigns reads to NCBI taxonomies by using the Lowest Common Ancestor algorithm. Bit scores were used from within MEGAN for filtering the results before tree construction and summarisation. A bit score of 86 was selected as previously used for 16S ribosomal sequence data( Reference Urich, Lanzen and Qi 23 ). Phylum and family counts for each subject were extracted from MEGAN. Sequences were clustered into operational taxonomical units, chimera checked and aligned using the default pipeline within Qiime, and subsequently α and β diversities were generated. A phylogenetic tree was calculated using the FastTree software (doi:10.1093/molbev/msp077). The resulting principal coordinate analysis was visualised within KiNG.
Statistical analysis
All results are presented as means with their standard errors (per group). To assess whether differences between the treatment groups were significant, data were analysed using one-way ANOVA followed by post hoc Tukey's multiple comparison test using GraphPad Prism version 4.0 for Windows (GraphPad Software). Compositional data were statistically analysed using Minitab release 15.1.1.0 (www.minitab.com). A non-parametric Kruskal–Wallis test was used to estimate the relationships between the different dietary groups. Statistical significance was accepted at P< 0·05.
Results
Effect of varying dietary fatty acid compositions on weight gain, body composition and host fat storage
A higher percentage of weight gain was observed in the group fed the HF-palm oil diet for 16 weeks compared with the HF-olive oil (P< 0·05)- and LF-high sucrose (P< 0·05)-fed groups, despite no differences in cumulative energy intake between these groups (Table 2). Furthermore, subcutaneous fat mass was higher following feeding of the HF-palm oil diet than after feeding of the HF-olive oil diet (P< 0·05; Table 2). The group supplemented with the HF-palm oil diet also had a higher percentage of fat mass (P< 0·05; Fig. 1(A)) and a lower percentage of lean mass (P< 0·05; Fig. 1(B)) than the HF-olive oil-fed group and both LF-high-carbohydrate-fed groups. The percentage lean mass was higher in the group fed the olive oil diet for 16 weeks than in the other HF diet-fed groups (P< 0·05; Fig. 1(B)). The percentage of weight gain was higher in the LF-high maize starch-fed group than in the LF-high sucrose-fed group (P< 0·05; Table 2), which was most probably due to the greater food intake (P< 0·05; Table 2) and therefore greater cumulative energy intake (P< 0·05; Table 2) in the former group. Visceral fat mass was also higher in the LF-high maize starch-fed group than in the LF-high sucrose-fed group after feeding for 16 weeks (P< 0·05; Table 2).
Body mass, fat mass, food intake and cumulative energy intake of mice fed high-fat (HF) diets supplemented with either palm oil, olive oil, safflower oil or flaxseed/fish oil compared with those fed low-fat (LF) diets supplemented with either high sucrose or high maize starch for 16 weeks (Mean values with their standard errors; n 9–10 mice per group)
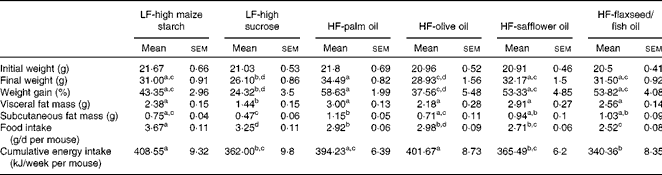
a,b,c,dMean values within a row with unlike superscript letters were significantly different (P< 0·05; ANOVA followed by post hoc Tukey's multiple comparison test).
(A) Body composition as determined by NMR showing the percentage of fat mass for mice fed high-fat (HF) diets supplemented with either palm oil, olive oil, safflower oil or flaxseed/fish oil compared with those fed low-fat (LF) diets supplemented with either high sucrose or high maize starch for 16 weeks. Values are means (n 9–10), with their standard errors represented by vertical bars. a,b,cMean values with unlike letters were significantly different (P< 0·05; ANOVA followed by post hoc Tukey's multiple comparison test). (B) Body composition as determined by NMR showing the percentage of lean mass for mice fed HF diets supplemented with either palm oil, olive oil, safflower oil or flaxseed/fish oil compared with those fed LF diets supplemented with either high sucrose or high maize starch for 16 weeks. Values are means (n 9–10), with their standard errors represented by vertical bars. a,b,c,dMean values with unlike letters were significantly different (P< 0·05; ANOVA followed by post hoc Tukey's multiple comparison test).

Since the energy content of the LF-high-carbohydrate diets (16 kJ/g) was only approximately 3 kJ/g lower than that of the high-fat diets (19 kJ/g), differences in total cumulative energy intake between the groups resulted from differences in food intake, due to dietary preference. The LF-high maize starch-fed group consumed more food over the study period, resulting in a significantly higher cumulative energy intake, than the groups supplemented with the HF-safflower oil and HF-flaxseed/fish oil diets and the LF-high-sucrose diet. However, no differences in the overall percentage of weight gain were observed between the groups fed the LF-high-maize starch, HF-safflower oil and HF-flaxseed/fish oil diets.
Higher plasma glucose and leptin concentrations associated with saturated fat
No differences in plasma TAG, insulin or NEFA concentrations were found between the groups following 16 weeks of dietary feeding (Table 3). Fasting glucose levels were higher in the HF-palm oil-fed group than in both the HF-safflower oil- and LF-high sucrose-fed groups (P< 0·05; Table 3), while plasma glucose concentrations were lower in the LF-high sucrose-fed group than in the groups fed the LF-high-maize starch, HF-palm oil and HF-olive oil diets (P< 0·05; Table 3). Circulating plasma leptin concentrations were also higher in the HF-palm oil-fed group than in the HF-olive oil- and both LF-high carbohydrate-fed groups (P< 0·05; Table 3).
Plasma variables in mice fed high-fat (HF) diets supplemented with either palm oil, olive oil, safflower oil or flaxseed/fish oil compared with those fed low-fat (LF) diets supplemented with either high sucrose or high maize starch for 16 weeks* (Mean values with their standard errors; n 9–10 mice per group)
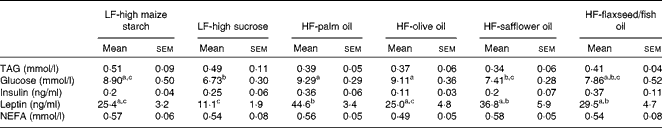
a,b,cMean values within a row with unlike superscript letters were significantly different (P< 0·05; ANOVA followed by post hoc Tukey's multiple comparison test).
* Blood was collected after animals were fasted.
Saturation of fat influences host liver mass, TAG levels and hepatic gene expression
Liver tissue weight (Fig. 2(A)) and total liver TAG levels (Fig. 2(B)) were higher (P< 0·05) in the palm oil-fed group than in all the other dietary groups. Among the high-fat diets, as the degree of saturation shifted from the more SFA source of palm oil to the n-3 PUFA source of flaxseed/fish oil, the levels of liver TAG steadily decreased in a coinciding manner (Fig. 2(B)).
(A) Total liver weight of mice fed high-fat (HF) diets supplemented with either palm oil, olive oil, safflower oil or flaxseed/fish oil compared with those fed low-fat (LF) diets supplemented with either high sucrose or high maize starch for 16 weeks. Values are means (n 9–10), with their standard errors represented by vertical bars. a,bMean values with unlike letters were significantly different (P< 0·05; ANOVA followed by post hoc Tukey's multiple comparison test). (B) Total liver TAG levels of mice fed HF diets supplemented with either palm oil, olive oil, safflower oil or flaxseed/fish oil compared with those fed LF diets supplemented with either high sucrose or high maize starch for 16 weeks. Values are means (n 9–10), with their standard errors represented by vertical bars. a,b,cMean values with unlike letters were significantly different (P< 0·05; ANOVA followed by post hoc Tukey's multiple comparison test).

Briefly, the expression of certain genes related to fatty acid metabolism and inflammation in the liver was assessed in an effort to correlate their expression with liver mass and TAG levels. Hepatic expression of Fas was higher in the palm oil-fed group than in the flaxseed/fish oil-fed group (P< 0·05; see online supplementary Fig. S1). Furthermore, the olive oil-fed group had a higher hepatic expression of Fas than the flaxseed/fish oil-fed group (P< 0·05; see online supplementary Fig. S1), while Fas expression was higher in the LF-high-maize starch-fed group than in the HF-safflower oil-, HF-flaxseed/fish oil- and LF-high sucrose-fed groups (P< 0·05; see online supplementary Fig. S1). Hepatic expression of Srebp-1c was higher in the LF-high maize starch-fed group than in the high-fat diet-fed groups (except the olive oil-fed group) and the LF-high sucrose-fed group (P< 0·05; see online supplementary Fig. S1). Hepatic expression of PPARα was reduced in all the dietary groups compared with the LF-high maize starch-fed group (P< 0·05; see online supplementary Fig. S1), while PPARα expression was higher in all the high-fat diet-fed groups than in the LF-high sucrose-fed group (P< 0·05; see online supplementary Fig. S1).
Impact of different sources of fat and energy on host tissue fatty acid compositions
The palm oil-fed group had higher levels of palmitic acid (16 : 0) in the liver and brain compared with the other high-fat diet-fed groups and the LF-high sucrose-fed group (P< 0·05; Tables 4 and 6), and in epididymal adipose tissue compared with all the other dietary groups (P< 0·05; Table 5). Additionally, the palm oil-fed group had higher levels of oleic acid (18 : 1 cis-9) in liver (P< 0·05; Table 4) and epididymal adipose tissue (P< 0·05; Table 5) compared with all the other dietary groups, except the olive oil-fed group, which had higher levels of oleic acid in the epididymal adipose tissue only compared with all the other diet-fed groups (P< 0·05; Table 5). The safflower oil-fed group had higher levels of linoleic acid (18 : 2n-6), γ-linolenic acid (18 : 3n-6) and arachidonic acid (20 : 4n-6) in all tissues compared with all the other diet-fed groups (P< 0·05; Tables 4–6) . Both the LF-high carbohydrate-fed groups had higher levels of dihomo-γ-linolenic acid (20 : 3n-6) in the brain (P< 0·05; Table 6) and higher levels of palmitoleic acid (16 : 1 cis-9) in the liver (P< 0·05; Table 4) compared with all the other dietary groups. α-Linolenic acid (18 : 3n-3) levels were higher in all tissues (P< 0·05; Tables 4–6) of the flaxseed/fish oil-fed group than those of the other diet-fed groups, except in the brain of the LF-high sucrose-fed group. Furthermore, the flaxseed/fish oil-fed group had higher levels of EPA (20 : 5n-3), docosapentaenoic acid (22 : 5n-3) and DHA (22 : 6n-3) in all tissues (P< 0·05; Table 4–6), lower levels of arachidonic acid in the brain (P< 0·05; Table 6) and higher levels stearic (18 : 0) and myristic (14 : 0) acids in epididymal adipose tissue (P< 0·05; Table 5) compared with the other dietary groups.
Fatty acid profile (g/100 g FAME) in the liver of mice fed high-fat (HF) diets supplemented with either palm oil, olive oil, safflower oil or flaxseed/fish oil compared with those fed low-fat (LF) diets supplemented with either high sucrose or high maize starch for 16 weeks (Mean values with their standard errors; n 9–10 mice per group)

FAME, fatty acid methyl ester.
a,b,c,dMean values within a row with unlike superscript letters were significantly different (P< 0·05; ANOVA followed by post hoc Tukey's multiple comparison test).
Fatty acid profile (g/100 g FAME) in the epididymal adipose tissue of mice fed high-fat (HF) diets supplemented with either palm oil, olive oil, safflower oil or flaxseed/fish oil compared with those fed low-fat (LF) diets supplemented with either high sucrose or high maize starch for 16 weeks (Mean values with their standard errors; n 9–10 mice per group)

FAME, fatty acid methyl ester; ND, not detected.
a,b,c,d,e,fMean values within a row with unlike superscript letters were significantly different (P< 0·05; ANOVA followed by post hoc Tukey's multiple comparison test).
Fatty acid profile (g/100 g FAME) in the brain of mice fed high-fat (HF) diets supplemented with either palm oil, olive oil, safflower oil or flaxseed/fish oil compared with those fed low-fat (LF) diets supplemented with either high sucrose or high maize starch for 16 weeks (Mean values with their standard errors; n 9–10 mice per group)

FAME, fatty acid methyl ester; ND, not detected.
a,b,c,d,eMean values within a row with unlike superscript letters were significantly different (P< 0·05; ANOVA followed by post hoc Tukey's multiple comparison test).
Saturated fat is associated with higher caecal concentrations of SCFA
The mean total concentrations of SCFA (acetate, propionate, butyrate and isobutyrate) in caecal contents were found to be highest in the palm oil-fed group compared with the other dietary groups (P< 0·05; Table 7). Of these SCFA, the concentrations of propionate, butyrate and isobutyrate were found to be higher in the palm oil-fed group than in the other diet-fed groups (P< 0·05; Table 7), while the concentration of acetate was found to be higher in the palm oil-fed group compared with the other diet-fed groups (P< 0·05; Table 7), except the LF-high maize starch-fed group.
SCFA concentrations (μmol/g) in the caecal contents of mice fed high-fat (HF) diets supplemented with either palm oil, olive oil, safflower oil or flaxseed/fish oil compared with those fed low-fat (LF) diets supplemented with either high sucrose or high maize starch for 16 weeks (Mean values with their standard errors; n 9–10 mice per group)
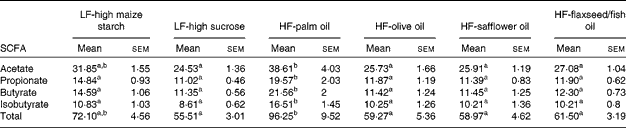
a,bMean values within a row with unlike superscript letters were significantly different (P< 0·05; ANOVA followed by post hoc Tukey's multiple comparison test).
Fat and energy sources influence differently on the composition of the intestinal microbiota
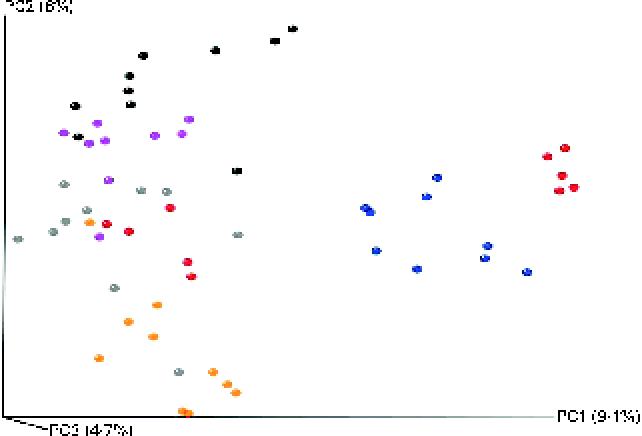
The microbial composition in the caecal contents of individual mice was elucidated through high-throughput DNA sequencing (Roche 454-Titanium) of 16S rRNA (V4) amplicons after 16 weeks of dietary intervention. A total of 355 743 reads were sequenced, corresponding to an average of 6134 reads/mouse. Of these reads, 318 586 (89 %) were assigned at the phylum level, 285 224 (80 %) at the family level and 180 584 (51 %) at the genus level. At the 97 % similarity level, a total of five measures were used to indicate sufficient sampling for all the groups. Estimations for species richness, coverage and diversity were calculated for each dataset (see online supplementary Figs. S2–S6). All measures showed a high level of overall diversity within all samples, and rarefraction curves for each group indicated a sufficient depth of sequencing. For the Chao1-α diversity metric (see online supplementary Fig. S2), olive oil and flaxseed/fish oil feeding resulted in the least and most diverse intestinal microbiota, respectively. This trend is somewhat reflected in all the other diversity metrics (see online supplementary Figs. S3–S6). Furthermore, all diets were significantly different from each other. Principal coordinate analysis plots generated using an unweighted Unifrac distance matrix showed that mice clustered into relatively distinct groups based on dietary treatment (Fig. 3). This suggests that exposure to different qualities of dietary fats or different energy sources (fat v. carbohydrate) can significantly alter intestinal microbial populations.
Principal coordinate analysis using unweighted UniFrac distances for mice fed high-fat (HF) diets supplemented with either palm oil, olive oil, safflower oil or flaxseed/fish oil compared with those fed low-fat (LF) diets supplemented with either high sucrose or high maize starch for 16 weeks. ![]() , LF-high maize starch group;
, LF-high maize starch group; ![]() , HF-palm oil group;
, HF-palm oil group; ![]() , HF-olive oil group;
, HF-olive oil group; ![]() , HF-safflower oil group;
, HF-safflower oil group; ![]() , HF-flaxseed/fish oil group;
, HF-flaxseed/fish oil group; ![]() , LF-high sucrose group.
, LF-high sucrose group.
Taxonomy-based analysis of the assigned sequences showed that at the phylum level, the mouse intestinal microbiota was dominated by Firmicutes and Bacteroidetes (together harbouring on average 92·3 % of sequences; Fig. 4). At the family level, the most dominant groups were Lachnospiraceae, Erysipelotrichaceae, Ruminococcaceae, Rikenellaceae and Deferribacteraceae (Table 8 and Fig. 5). Consistent with the high levels of Firmicutes and Bacteroidetes detected, the dominant bacteria detected at the genus level were Allobaculum, Ruminococcaceae Incertae sedis, Bacteroides and Rikenella (Table 8 and Fig. 6).
Phylum-level distributions of the microbial communities in caecal contents, expressed as a percentage of the total population of assignable tags, in mice fed high-fat (HF) diets supplemented with either palm oil, olive oil, safflower oil or flaxseed/fish oil compared with those fed low-fat (LF) diets supplemented with either high sucrose or high maize starch for 16 weeks. a,b,cValues with unlike letters were significantly different (P< 0·05; Kruskal–Wallis algorithm). ■, LF-high maize starch; □, LF-high sucrose; ![]() , HF-palm oil;
, HF-palm oil; ![]() , HF-olive oil;
, HF-olive oil; ![]() , HF-safflower oil;
, HF-safflower oil; ![]() , HF-flaxseed/fish oil.
, HF-flaxseed/fish oil.

Intestinal microbiota composition (% reads) in the caecal contents of mice fed high-fat (HF) diets supplemented with either palm oil, olive oil, safflower oil or flaxseed/fish oils compared with those fed low-fat (LF) diets supplemented with either high sucrose or high maize starch for 16 weeks (n 9–10 mice per group)

a,bMean values within a row with unlike superscript letters were significantly different (P< 0·05; Kruskal–Wallis algorithm).
Family-level taxonomic distributions of the microbial communities in caecal contents, expressed as a percentage of total tags assignable at the family level, in mice fed high-fat (HF) diets supplemented with either palm oil, olive oil, safflower oil or flaxseed/fish oil compared with those fed low-fat (LF) diets supplemented with either high sucrose or high maize starch for 16 weeks. a,b,cValues with unlike letters were significantly different (P< 0·05; Kruskal–Wallis algorithm). ■, LF-high maize starch; □, LF-high sucrose; ![]() , HF-palm oil;
, HF-palm oil; ![]() , HF-olive oil;
, HF-olive oil; ![]() , HF-safflower oil;
, HF-safflower oil; ![]() , HF-flaxseed/fish oil.
, HF-flaxseed/fish oil.

Genus-level taxonomic distributions of the microbial communities present in caecal contents, expressed as a percentage of total tags assignable at the genus level, in mice fed high-fat (HF) diets supplemented with either palm oil, olive oil, safflower oil or flaxseed/fish oil compared with those fed low-fat (LF) diets supplemented with either high sucrose or high maize starch for 16 weeks. a,b,cValues with unlike letters were significantly different (P< 0·05; Kruskal–Wallis algorithm). ■, LF-high maize starch; □, LF-high sucrose; ![]() , HF-palm oil;
, HF-palm oil; ![]() , HF-olive oil;
, HF-olive oil; ![]() , HF-safflower oil;
, HF-safflower oil; ![]() , HF-flaxseed/fish oil.
, HF-flaxseed/fish oil.

The palm oil-fed group had reduced caecal populations of Bacteroidetes at the phylum level (P< 0·05; Fig. 4), at 10·5 %, compared with the olive oil- and safflower oil-fed groups (both 20 %). All the other phyla remained at relatively similar proportions across the groups. At the family level, the palm oil- and LF-high sucrose-fed groups had higher populations of Lachnospiraceae (46·4 and 49·6 %, respectively, P< 0·05; Fig. 5) than the LF-high maize starch- and flaxseed/fish oil-fed groups (17·1 and 24·2 %, respectively). Among the high-fat diets, as the degree of saturation shifted from the more SFA source of palm oil to the n-3 PUFA source of flaxseed/fish oil, the intestinal populations of Lachnospiraceae steadily decreased in a coinciding manner. Reduced proportions of Lachnospiraceae were also found in the safflower oil-fed group, relative to the LF-high sucrose-fed group (P< 0·05; Fig. 5). Within the LF-high carbohydrate-fed groups, contrasting results were found. The relative proportions of Ruminococcaceae were higher in the high sucrose-fed group than in the high maize starch-fed group (P< 0·05; Fig. 5), while the high maize starch-fed group had a higher population of Erysipelotrichaceae than the high sucrose-fed group (P< 0·05; Fig. 5). The olive oil- and flaxseed/fish oil-fed groups had a greater abundance of Erysipelotrichaceae compared with the LF-high sucrose-fed group (P< 0·05; Fig. 5). Again, among the high-fat dietary groups, as the degree of saturation shifted from the more SFA source of palm oil to the n-3 PUFA source of flaxseed/fish oil, the intestinal populations of Erysipelotrichaceae steadily increased in a coinciding manner. Thus, the saturation or quality of fat can shift the intestinal microbiota population in numerous ways. Interestingly, higher proportions of Bacteroidaceae and Bacteroides were found in the olive oil-fed group compared with the palm oil-, flaxseed/fish oil- and LF-high sucrose-fed groups (P< 0·05; Figs. 5 and 6). Additionally, the n-3 PUFA-rich flaxseed/fish oil diet was the only diet to increase intestinal populations of Bifidobacteriaceae and Bifidobacterium compared with the LF-high maize starch diet (P< 0·05; Figs. 5 and 6).
At the genus level, Allobaculum was found to be higher in the LF-high maize starch-, HF-flaxseed/fish oil- and HF-olive oil-fed groups than in the LF-high sucrose-fed group (38·9, 38·7, 23·8 and 5·4 % respectively, P< 0·05; Fig. 6). High populations of uncultured Lachnospiraceae, Oscillibacter, Odoribacter and Anaerotruncus were detected in the LF-high sucrose-fed group, reaching significance compared with a variety of different groups within each population (P< 0·05; Table 8 and Fig. 6).
Discussion
The data presented herein reveal that different dietary fatty acids and qualities of dietary fats from different sources (palm oil, olive oil, safflower oil and flaxseed/fish oil) and high-carbohydrate diets (maize starch and sucrose) significantly influenced both metabolic parameters and the composition of the intestinal microbiota in mice. The present study has further highlighted that consumption of MUFA and PUFA is generally healthful in comparison with SFA, whereby chronic dietary SFA intake (palm oil) for 16 weeks resulted in significant increases in the percentage of body-weight gain, the percentage of body fat mass, subcutaneous fat mass and plasma glucose and leptin concentrations compared with the other groups. In contrast, consumption of MUFA (olive oil) for 16 weeks was associated with a significant decrease in the percentage of body-weight gain and the percentage of body fat mass compared with mice ingesting a palm oil-rich diet. Current nutritional recommendations suggest that a reduction in SFA consumption with an increase in plant oils containing MUFA is desirable; however, the mechanism by which MUFA may be responsible for a reduction in body weight is largely unknown. Recently, a study( Reference Martin-Pelaez, Covas and Fito 25 ) has reviewed numerous health benefits associated with the polyphenol fraction of olive oil, such as anti-inflammatory and antioxidant activities, which may possibly provide further evidence for the positive impact the olive oil diet has on body-weight gain observed in the present study.
The group that ingested the LF-high sucrose diet had the lowest percentage of weight gain over the 16-week study period, while the LF-high maize starch-fed group exhibited a higher percentage of weight gain and plasma blood glucose levels compared with the high sucrose-fed group. This difference can partly be explained by the greater food intake of the high maize starch-fed group compared with the high sucrose-fed group. The maize starch diet had a greater impact on food intake, glucose intolerance and weight gain, compared with dietary sucrose as the primary carbohydrate source in the diet. While a combination of high dietary fat with high sucrose has been reported to induce insulin resistance and glucose intolerance( Reference Yang, Miyahara and Takeo 26 ), it appears that dietary sucrose itself has differential effects depending on the amount of fat in the diet( Reference Surwit, Feinglos and Rodin 27 ).
Dietary SFA is known to play a substantial clinical role in the onset and progression of non-alcoholic fatty liver disease( Reference Wang, Wei and Pagliassotti 28 – Reference Tetri, Basaranoglu and Brunt 30 ). Supplementation with palm oil significantly increased both liver weight and TAG levels in mice after 16 weeks compared with all the other groups. Interestingly, it was shown herein that as the degree of saturation shifted from SFA (palm oil), to MUFA (olive oil), to n-6 PUFA (safflower oil) and finally to n-3 PUFA (flaxseed/fish oil), the levels of liver TAG steadily decreased in a coinciding manner. This indicates that it is not only the quantity of fat but also the quality of fat consumed that has an impact on the tissue distribution of fat in the host. Furthermore, the increased hepatic expression of Fas and Srebp-1c, which are involved in de novo lipogenesis, correlated with the increase in the levels of hepatic TAG observed for the palm oil-fed group.
The clinical implications of n-3 PUFA in preventing the progression of non-alcoholic fatty liver disease have been described( Reference Parker, Johnson and Burdon 31 ). The reduced levels of liver TAG observed following dietary intake of flaxseed/fish oil for 16 weeks may be partly explained by the increase in the hepatic expression of PPARγ found for this group, given that PPARγ is associated with a reduction in inflammatory responses in the liver( Reference Galli, Crabb and Ceni 32 – Reference Marra, Efsen and Romanelli 34 ). Furthermore, flaxseed/fish oil feeding increased the levels of α-linolenic acid, EPA, docosapentaenoic acid and DHA in the liver, epididymal adipose tissue and brain. Dietary EPA and DHA exert anti-inflammatory properties( Reference Mori and Beilin 35 ) by altering cytokine production( Reference Calder 36 , Reference Browning 37 ), often at the expense of arachidonic acid, whereby pro-inflammatory eicosanoids derived from arachidonic acid, such as PGE2 and leukotriene B4, are replaced by anti-inflammatory eicosanoids derived from EPA and DHA( Reference Calder 38 ). The present study has demonstrated favourable increases in tissue EPA, docosapentaenoic acid and DHA and decreases in tissue arachidonic acid for the flaxseed/fish oil-fed group, whereby DHA has been shown to play important roles in neurogenesis, neurotransmission and protection against oxidative stress( Reference Hashimoto, Hossain and Shimada 39 – Reference Lim, Calon and Morihara 41 ). Importantly, the present study has demonstrated the ability of flaxseed/fish oil-derived fatty acids EPA, docosapentaenoic acid and DHA to cross the blood–brain barrier where it is understood that DHA may influence cognitive processes such as learning and memory in the brain( Reference Henriksen, Haugholt and Lindgren 42 , Reference Yurko-Mauro, McCarthy and Rom 43 ). This further highlights the importance of n-3 PUFA-derived dietary fatty acids to the brain–gut axis.
Diet composition significantly altered intestinal microbial populations and diversity after 16 weeks of feeding. A key finding was that all measures of α diversity demonstrated a high level of overall diversity between the dietary groups, whereby mice clustered into distinct groups based on dietary treatment. Decreases in the populations of Bacteroidetes and Bacteroidaceae at the phylum and family levels, respectively, and increases in the population of Lachnospiraceae at the family level were observed for the palm oil-fed group. Interestingly, other studies have demonstrated similar trends in the Bacteroidetes population that positively correlate with the development of obesity( Reference Ley, Turnbaugh and Klein 6 , Reference Turnbaugh, Hamady and Yatsunenko 44 ). Based on previous studies, it is generally understood that the gut microbiota can indeed increase the energy-harvesting capacity of the host through the fermentation of non-digestible complex polysaccharides in the intestine and thus producing SCFA( Reference Turnbaugh, Ley and Mahowald 11 , Reference Jumpertz, Le and Turnbaugh 45 ). In the present study, the palm oil-fed group increased total caecal SCFA produced compared with all the other groups. While the positive impact these SCFA have on human gastrointestinal health has previously been described( Reference D'Argenio, Cosenza and Delle Cave 46 – Reference Topping and Clifton 49 ), the process by which they drive energy production has also been portrayed as a potential mechanism involved in the increase in host fat mass storage( Reference Turnbaugh, Ley and Mahowald 11 ). Furthermore, it is unclear whether the beneficial effect of SCFA is somehow compromised in obese subjects, or whether the effect is simply not strong enough to compensate for an adverse diet.
The group that ingested the olive oil-rich diet had increased populations of Bacteroidaceae in the caecum at the family level compared with the palm oil- and flaxseed/fish oil-fed groups. Interestingly, these bacteria maintain a complex and generally beneficial relationship with the host when retained in the gut and their role as commensals has been extensively reviewed( Reference Xu and Gordon 50 ). In the present study, between the two LF-high carbohydrate-fed groups, the proportions of Allobaculum were reduced while populations of Lachnospiraceae were increased in the caecum of the high sucrose-fed group compared with the maize starch-fed group. Interestingly, a recent study by Ravussin et al. ( Reference Ravussin, Koren and Spor 51 ) reported an association between low-fat feeding and increases in the genus Allobaculum, thus suggesting that high dietary sucrose may be responsible for a reduction in the caecal numbers of Allobaculum.
The flaxseed/fish oil diet was the only diet to significantly increase the intestinal populations of Bifidobacteriaceae and Bifidobacterium, at the family and genus levels, respectively, possibly through the increased ability of flaxseed/fish oil to increase the adhesion of bifidobacteria to the intestinal wall.
The results from the present study indicate that dietary ingestion of different fatty acids in a high-fat diet, or a chronic intake of high levels of maize starch or sucrose significantly influences the distribution of fat in the host and also the composition of the intestinal microbiota. While subtle differences in the intestinal microbiota did exist between the two LF-high carbohydrate-fed groups in the present study, it is apparent that dietary maize starch has a greater impact on weight gain and glucose intolerance than sucrose. We demonstrated that dietary SFA (palm oil) had a negative impact on host metabolic parameters often associated with obesity and the metabolic syndrome, while also shifting the intestinal microbiota population to one similar to that seen in an obese phenotype. In contrast, dietary MUFA (olive oil) may beneficially alter the bacterial population in the intestine by increasing the populations of commensal bacteria. Finally, the present study has demonstrated that a rich dietary source of n-3 PUFA (flaxseed/fish oil) may have a bifidogenic effect on the intestinal microbiota composition of the host by increasing the levels of Bifidobacterium, while also positively influencing the composition of host tissues with n-3 PUFA-derived health-promoting fatty acids.
Indeed, the mechanism by which dietary fat types alter the intestinal microbiota remains largely to be elucidated. Promisingly, recent reports by Devkota et al. and de Wit et al. suggest that certain saturated fat types can alter conditions for gut microbial assemblage by promoting changes in host bile composition( Reference Devkota, Wang and Musch 17 ) and that an overflow of palm oil to the distal small intestine rather than obesity itself may trigger an elevation of lipid metabolism-related genes in the distal small intestine, thus altering the intestinal microbiota( Reference de Wit, Derrien and Bosch-Vermeulen 15 ). Further future studies will confirm a precise mechanism by which diet alters the intestinal microbiota. In conclusion, the present study has demonstrated some novel findings on how different qualities of fat and energy subtypes have an impact on the metabolic health and intestinal microbiota composition of the host.
Supplementary material
To view supplementary material for this article, please visit http://dx.doi.org/10.1017/S0007114514000117
Acknowledgements
The authors acknowledge Aileen Hogan, Tatiana Marques and Eva Rosberg-Cody for technical assistance.
E. P. was supported by funding from the Teagasc Walsh Fellowship Scheme, and the present study was supported by the Science Foundation of Ireland-funded Centre for Science, Engineering and Technology, the Alimentary Pharmabiotic Centre, CSET grant 07/CE/B1368.
The authors' contributions were as follows: C. S., R. M. O. D., E. F. M., G. F. F. and R. P. R. designed the research; E. P., E. F. M., R. W., K. N. and P. D. C. conducted the research; E. P., E. F. M. and O. O' S. analysed the data; E. P. and C. S. wrote the manuscript; C. S. had primary responsibility for the final content.
The authors declare that there are no conflicts of interest.


