


1. Introduction
Gravity-driven liquid films are thin layers of fluid that flow down an inclined surface due to gravity. These flows have long attracted great interest as they are highly relevant both to fundamental science and a wide range of applications, such as film coating and heat exchangers. Since these flows are inherently unstable, understanding the mechanisms that govern their stability is crucial for predicting and controlling their behaviour.
The classical stability of gravity-driven liquid films has been extensively studied under idealised conditions where the film is unbounded in the spanwise direction. In such a configuration, the hydrodynamic instability is primarily governed by the interplay between inertia, viscosity and gravity, while surface tension plays a minimal role in the long-wavelength limit. Under these conditions, the critical Reynolds number becomes independent of capillary effects. This classical framework has formed the foundation of our understanding of isothermal falling-film instability and is particularly applicable where spanwise effects are negligible.
Nevertheless, when the flow is confined in the spanwise direction, the stability behaviour deviates significantly from the classical predictions. The interaction between inertia, viscous and capillarity, and spanwise confinement introduces new complexities that are not yet fully explored. In our recent work (Mohamed, Sesterhenn & Biancofiore Reference Mohamed, Sesterhenn and Biancofiore2023), we investigated the influence of spanwise confinement on the linear stability of gravity-driven liquid films using a combined experimental and theoretical framework based on a temporal biglobal stability analysis. We showed that perturbations at moderate frequencies experience heavy damping caused by spanwise confinement, leading to fragmentation of the instability domain. This distinctive stabilisation was found to be a result of two mechanisms: the first is the presence of different types of stability modes that are suppressed differently by the spanwise confinement, while the second reason is due to a global bifurcation between the stability modes. We identified two different stability mode types, the Kapitza hydrodynamic mode, usually known as H-mode, which is dominant at weak spanwise confinement, and a new wall-confined stability mode, which we named W-mode and which dominates at strong spanwise confinement. These results demonstrate how geometric confinement restructures the linear stability landscape of film flows, offering new insights into the interaction between instability mechanisms and boundary conditions.
A key simplifying assumption in our earlier model was to neglect wetting effects at the side walls. While this assumption simplifies the stability model and facilitates the study of geometric confinement, it overlooked a physically important phenomenon, namely side-wall wetting. It is shown analytically and experimentally that the meniscus at the side walls alters the local interface shape and can result in a velocity overshoot in the vicinity of the side walls (Scholle & Aksel Reference Scholle and Aksel2001; Haas, Pollak & Aksel Reference Haas, Pollak and Aksel2011). Such modifications to the flow become particularly important in confined channels or in systems with strong capillarity, where the interaction between capillarity and spanwise confinement is expected to play a crucial role in shaping the flow dynamics.
To date, the influence of wetting on the stability of falling films has been investigated exclusively through experimental studies, with no theoretical or numerical studies directly addressing this aspect. For instance, Vlachogiannis et al. (Reference Vlachogiannis, Samandas, Leontidis and Bontozoglou2010) and Georgantaki et al. (Reference Georgantaki, Vatteville, Vlachogiannis and Bontozoglou2011) demonstrated that, unlike classical theory, the onset of the long-wave instability can be shifted by strong wetting effects, even when the channel width is orders of magnitude larger than the film thickness. Their experiments with aqueous solutions of glycerol or isopropanol had Kapitza numbers of the order of a few thousand, $\mathcal{O} (10^3)$
. The latter study attributed this behaviour to a transverse long-range capillary attenuation mechanism originating from the wetting effects at the side walls. In addition, Pollak, Haas & Aksel (Reference Pollak, Haas and Aksel2011) further confirmed that wetting introduces localised capillary effects near the side walls that stabilise the flow even when surface tension is weak. This was demonstrated by obtaining the stability neutral curves at different spanwise locations and observing a stabilising shift in the stability curves near the side walls. They also showed that the streamwise velocity overshoot has a minor destabilising effect compared with the dominant stabilising effect induced by wetting. It is important to note, however, that these experimental studies were limited to channels much wider than the film thickness, where the stabilising effect of the spanwise confinement is absent. Relatively narrower channels were not considered, where wetting could interact with the confinement-induced stabilisation.
$\mathcal{O} (10^3)$
. The latter study attributed this behaviour to a transverse long-range capillary attenuation mechanism originating from the wetting effects at the side walls. In addition, Pollak, Haas & Aksel (Reference Pollak, Haas and Aksel2011) further confirmed that wetting introduces localised capillary effects near the side walls that stabilise the flow even when surface tension is weak. This was demonstrated by obtaining the stability neutral curves at different spanwise locations and observing a stabilising shift in the stability curves near the side walls. They also showed that the streamwise velocity overshoot has a minor destabilising effect compared with the dominant stabilising effect induced by wetting. It is important to note, however, that these experimental studies were limited to channels much wider than the film thickness, where the stabilising effect of the spanwise confinement is absent. Relatively narrower channels were not considered, where wetting could interact with the confinement-induced stabilisation.
Despite these experimental results, a comprehensive theoretical or numerical framework is still lacking to describe how wetting and confinement jointly shape film stability. In this work, we address this gap by extending our previous biglobal stability framework (Mohamed et al. Reference Mohamed, Sesterhenn and Biancofiore2023) to incorporate wetting effects at the side walls. By explicitly resolving the modifications on the base state and perturbations introduced by the wetting, we aim to quantify how wetting alters the confinement-induced stabilisation and examine whether the velocity overshoot could lead to flow destabilisation. This approach enables us to systematically investigate the interaction among contact angle, surface tension and geometric confinement, thereby offering a more complete and physically accurate insight into the stability characteristics of gravity-driven liquid films.
This work is organised as follows. In § 2, we present the non-dimensional governing equations and introduce the relevant dimensionless parameters. The derivation of the steady-state solution and the linear stability problem are also included in the same section. Section 3 presents our results and discussion. Finally, §§ 4 and 5 present the concluding remarks and potential directions for future investigations.
2. Theoretical formulation
This section presents the theoretical foundation of this work, consisting of the governing equations, the appropriate non-dimensional scaling, the base state solution and the linear stability problem. Figure 1 shows a three-dimensional liquid film flowing down an inclined surface. The channel width is $2W$
, with side walls located at
$2W$
, with side walls located at $z=\pm W$
, and the plate is inclined at an angle
$z=\pm W$
, and the plate is inclined at an angle $\beta$
. A Cartesian coordinate system (
$\beta$
. A Cartesian coordinate system ( $x,y,z$
) is used, where
$x,y,z$
) is used, where $x$
denotes the streamwise direction,
$x$
denotes the streamwise direction, $y$
is normal to the bottom wall and
$y$
is normal to the bottom wall and $z$
represents the spanwise direction. More importantly, the flow is subject to wetting, with
$z$
represents the spanwise direction. More importantly, the flow is subject to wetting, with $\theta$
denoting the contact angle at the side walls. The film thickness far from the side walls is
$\theta$
denoting the contact angle at the side walls. The film thickness far from the side walls is $H$
, while the capillary elevation due to wetting is given by
$H$
, while the capillary elevation due to wetting is given by $\zeta (z)$
. Thus, the local film thickness is given by
$\zeta (z)$
. Thus, the local film thickness is given by ${h}(z) = H + \zeta (z)$
. We now introduce the following scales to non-dimensionalise the governing equations and boundary conditions:
${h}(z) = H + \zeta (z)$
. We now introduce the following scales to non-dimensionalise the governing equations and boundary conditions:
 \begin{align} \begin{array}{ccc} h\rightarrow H \ h^*, &(x,y,z) \rightarrow H \ (x^*,y^*,z^*), &W\rightarrow H \ W^*, \\ t \rightarrow H^2 \rho / \mu \ t^*, & (u,v,w) \rightarrow \mu / (\rho H) \ (u^*,v^*,w^*), & p \rightarrow \mu ^2 / (\rho H^2) \ p^*. \end{array}\end{align}
By using these scales and dropping the asterisks for simplicity, we obtain the dimensionless governing equations, namely, the continuity and Navier–Stokes equations, as follows:
 \begin{align} \partial _x u + \partial _y v + \partial _z w & =0, \\[-30pt]\nonumber \end{align}
 \begin{align} \partial _t u +\boldsymbol{u} \boldsymbol{\cdot }\boldsymbol{\nabla }{u} & = - \partial _x p + \boldsymbol{\nabla} ^2 {u} + \textit{Re} , \\[-30pt]\nonumber \end{align}
 \begin{align} \partial _t v +\boldsymbol{u} \boldsymbol{\cdot }\boldsymbol{\nabla }{v} & = - \partial _y p + \boldsymbol{\nabla} ^2 {v} - \textit{Ct} , \\[-30pt]\nonumber \end{align}
 \begin{align} \partial _t w +\boldsymbol{u} \boldsymbol{\cdot }\boldsymbol{\nabla }{w} & = - \partial _z p + \boldsymbol{\nabla} ^2 {w},\\[0pt]\nonumber \end{align}
where $\boldsymbol{u} = (u,v,w)$
is the velocity field,
$\boldsymbol{u} = (u,v,w)$
is the velocity field, $p$
is pressure,
$p$
is pressure, $\textit{Re} = g \sin (\beta ) H^3 / \nu ^2$
is the Reynolds number based on the Nusselt film solution (Nusselt Reference Nusselt1916) and
$\textit{Re} = g \sin (\beta ) H^3 / \nu ^2$
is the Reynolds number based on the Nusselt film solution (Nusselt Reference Nusselt1916) and $\textit{Ct} = \textit{Re} \cot (\beta )$
is the inclination number.
$\textit{Ct} = \textit{Re} \cot (\beta )$
is the inclination number.
Schematic diagram of a liquid film falling down an inclined channel. $h(x,z,t)$
is the local film thickness,
$h(x,z,t)$
is the local film thickness, $H$
is the mean film thickness and
$H$
is the mean film thickness and $\zeta (z)$
is the capillary elevation due to wetting effects.
$\zeta (z)$
is the capillary elevation due to wetting effects.

The boundary conditions at the free surface at $y=h(x,z,t)$
are described as follows:
$y=h(x,z,t)$
are described as follows:
 \begin{align} v &= \partial _t h + u \partial _x h + w \partial _z h, \end{align}
 \begin{align} p &= {2}\Big [ (\partial _x h)^2 \partial _x u + (\partial _z h)^2 \partial _z w + \partial _x h \partial _z h (\partial _z u + \partial _x w) \nonumber \\ &\quad - \partial _x h (\partial _y u + \partial _x v)- \partial _z h (\partial _z v + \partial _y w) + \partial _y v\Big ]/\hat {n}^2 \nonumber \\ & \quad - (Re/\textit{Ca} ) \Big [ \partial _{xx} h(1+(\partial _z h)^2) + \partial _{zz}h (1+(\partial _x h)^2) - 2\partial _x h \partial _z h \partial _{xz} h \Big ]/\hat {n}^3 , \end{align}
 \begin{align} 0 &= 2\partial _x h (\partial _y v - \partial _x u) + (1-(\partial _x h)^2)(\partial _y u + \partial _x v) - \partial _z h (\partial _z u + \partial _x w) \nonumber \\ & \quad -\partial _x h \partial _z h(\partial _z v + \partial _y w), \end{align}
 \begin{align} 0 &= 2\partial _z h (\partial _y v - \partial _z w) + (1-(\partial _z h)^2)(\partial _y w + \partial _z v) - \partial _x h (\partial _z u + \partial _x w) \nonumber \\ & \quad - \partial _x h \partial _z h(\partial _y u + \partial _x v) ,\\[10pt]\nonumber \end{align}
where $ \hat {n} = [ 1+(\partial _x h)^2 + (\partial _z h)^2]^{1/2}$
and
$ \hat {n} = [ 1+(\partial _x h)^2 + (\partial _z h)^2]^{1/2}$
and $\textit{Ca}$
is the capillary number which relates the viscous forces to capillary forces. Using the characteristic streamwise velocity
$\textit{Ca}$
is the capillary number which relates the viscous forces to capillary forces. Using the characteristic streamwise velocity $U_c = \rho g \sin (\beta ) H^2/ \mu$
(Nusselt Reference Nusselt1916), the capillary number can be defined as follows:
$U_c = \rho g \sin (\beta ) H^2/ \mu$
(Nusselt Reference Nusselt1916), the capillary number can be defined as follows:
 \begin{equation} \textit{Ca} = \frac {\mu U_c}{\sigma }= \frac { \rho g \sin (\beta ) H^2 }{\sigma }. \end{equation}
Although the Kapitza number $\textit{Ka}$
does not appear explicitly in the governing equations, it is beneficial to introduce it, mainly to relate to experimental studies:
$\textit{Ka}$
does not appear explicitly in the governing equations, it is beneficial to introduce it, mainly to relate to experimental studies:
 \begin{equation} \textit{Ka} = \frac {\sigma }{\rho (g \sin \beta )^{1/3} \nu ^{4/3} } = \frac {Re^{2/3}}{Ca}, \end{equation}
where $\textit{Ka}$
measures the relative importance of capillary to viscous-gravity force scales in the streamwise direction (Chakraborty et al. Reference Chakraborty, Nguyen, Ruyer-Quil and Bontozoglou2014). In the present configuration, we define the non-dimensional capillary length from the balance between the capillary and hydrostatic pressure in the direction normal to the plate, and use it to characterise the spanwise extent of the wetting effect at the side walls:
$\textit{Ka}$
measures the relative importance of capillary to viscous-gravity force scales in the streamwise direction (Chakraborty et al. Reference Chakraborty, Nguyen, Ruyer-Quil and Bontozoglou2014). In the present configuration, we define the non-dimensional capillary length from the balance between the capillary and hydrostatic pressure in the direction normal to the plate, and use it to characterise the spanwise extent of the wetting effect at the side walls:
 \begin{equation} l_c = \sqrt {\frac {\sigma }{\rho g \cos \beta }} / H. \end{equation}
At the side walls, the free surface meets the solid wall with an apparent contact angle $\theta$
, which is imposed through the geometric slope-angle relation:
$\theta$
, which is imposed through the geometric slope-angle relation:
 \begin{equation} \frac {\partial h}{\partial z}\bigg |_{z=\pm W} = \pm \cot (\theta ). \end{equation}
In general, the contact angle $\theta$
is governed by local contact-line physics, such as dissipation, slip and hysteresis, and may depend on the contact-line motion (e.g. Hocking Reference Hocking1987; Viola, Brun & Gallaire Reference Viola, Brun and Gallaire2018). In the present work,
$\theta$
is governed by local contact-line physics, such as dissipation, slip and hysteresis, and may depend on the contact-line motion (e.g. Hocking Reference Hocking1987; Viola, Brun & Gallaire Reference Viola, Brun and Gallaire2018). In the present work, $\theta$
is prescribed as the static contact angle
$\theta$
is prescribed as the static contact angle $\theta _s$
in the base state, while the treatment of the contact angle perturbation in the linear problem depends on the adopted order of approximation and is specified in § 2.2.
$\theta _s$
in the base state, while the treatment of the contact angle perturbation in the linear problem depends on the adopted order of approximation and is specified in § 2.2.
With respect to the wall boundary conditions, we apply a standard no-slip boundary condition at the bottom wall ( $y=0$
):
$y=0$
):
 \begin{equation} u = v = w = 0. \end{equation}
With regards to the side walls ( $z=\pm W$
), the classical no-slip condition yields unbounded stress (Huh & Scriven Reference Huh and Scriven1971; Dussan & Davis Reference Dussan, E. and Davis1974), due to the well-documented singularity arising from a freely moving contact line over the solid substrate. This issue is commonly resolved by replacing the no-slip condition by a slip boundary condition (Navier Reference Navier1823; Sui, Ding & Spelt Reference Sui, Ding and Spelt2014). Specifically, the tangential velocity at the side wall is assumed to be proportional to the local viscous stress at the wall, while a no-penetration condition is imposed in the normal direction:
$z=\pm W$
), the classical no-slip condition yields unbounded stress (Huh & Scriven Reference Huh and Scriven1971; Dussan & Davis Reference Dussan, E. and Davis1974), due to the well-documented singularity arising from a freely moving contact line over the solid substrate. This issue is commonly resolved by replacing the no-slip condition by a slip boundary condition (Navier Reference Navier1823; Sui, Ding & Spelt Reference Sui, Ding and Spelt2014). Specifically, the tangential velocity at the side wall is assumed to be proportional to the local viscous stress at the wall, while a no-penetration condition is imposed in the normal direction:
 \begin{equation} u = l_s (\boldsymbol{\tau } \boldsymbol{\cdot }\boldsymbol{n_z}) \boldsymbol{\cdot }\boldsymbol{e_x} , \qquad v = l_s (\boldsymbol{\tau } \boldsymbol{\cdot }\boldsymbol{n_z}) \boldsymbol{\cdot }\boldsymbol{e_y} , \qquad w = 0, \end{equation}
where $l_s$
is the non-dimensional slip length regulating the slip condition,
$l_s$
is the non-dimensional slip length regulating the slip condition, $\boldsymbol{\tau }$
is the non-dimensional viscous stress tensor and
$\boldsymbol{\tau }$
is the non-dimensional viscous stress tensor and $\boldsymbol{n_z}$
is the outward normal vector at the side walls, defined as
$\boldsymbol{n_z}$
is the outward normal vector at the side walls, defined as
 \begin{equation} \boldsymbol{\tau } = \boldsymbol{\nabla }\boldsymbol{u} + \boldsymbol{\nabla} ^T \boldsymbol{u}, \qquad \boldsymbol{n_z}({\pm W}) = (0,0,\mp 1). \end{equation}
For an incompressible fluid and flat side walls, substituting (2.10) into (2.9) gives, at $z = \pm W$
 \begin{equation} u(\pm W) = \mp l_s \partial _zu , \qquad v(\pm W) = \mp l_s \partial _z v , \qquad w(\pm W) = 0. \end{equation}
In summary, this formulation describes the essential physics of gravity-driven thin films confined in the spanwise direction and under side-wall-induced wetting. The governing equations and boundary conditions for the base state and the linear stability analysis are presented in the following sections.
2.1. Steady-state solution
The steady-state solution (base flow) represents the undisturbed flow state on which the linear stability analysis is based. In the present configuration, the base state is influenced not only by the spanwise confinement, but also by wetting effects at the side walls. This base flow has been studied analytically using asymptotic approaches (Scholle & Aksel Reference Scholle and Aksel2001) and experimentally by Haas et al. (Reference Haas, Pollak and Aksel2011). Nevertheless, we compute the base state numerically, obtaining the interface shape, and the associated velocity and pressure fields.
We consider a two-dimensional base flow driven by the streamwise component of gravity along the plate. The flow is assumed to be fully developed ( $\partial _t=0$
) and homogeneous in the streamwise direction (
$\partial _t=0$
) and homogeneous in the streamwise direction ( $\partial _x=0$
). In the absence of any body force or pressure gradient in the spanwise direction, the base state z-momentum equation reduces to
$\partial _x=0$
). In the absence of any body force or pressure gradient in the spanwise direction, the base state z-momentum equation reduces to $\partial _z \bar {p} = 0$
. Together with the homogeneity condition
$\partial _z \bar {p} = 0$
. Together with the homogeneity condition $\partial _x=0$
, the continuity equation can be satisfied by
$\partial _x=0$
, the continuity equation can be satisfied by $\bar {v} = \bar {w} = 0$
. Thus, the variables associated with this base flow are taken as
$\bar {v} = \bar {w} = 0$
. Thus, the variables associated with this base flow are taken as
 \begin{equation} u = \bar {u}(y,z), \quad \bar {v} = 0, \quad \bar {w}=0, \quad p = \bar {p}(y), \quad h = \bar {h}(z), \end{equation}
which reflects the absence of any motion in the spanwise or bottom wall-normal direction. Under these assumptions, the governing equations (2.2) and boundary conditions (2.3)–(2.11) simplify to the following:
 \begin{align} \partial _{yy} \bar {u} + \partial _{zz}\bar {u} + \textit{Re} & = 0, \end{align}
 \begin{align} \partial _y \bar {p} + \textit{Ct} & = 0, \end{align}
 \begin{align} \partial _z \bar {p} & = 0,\\[6pt]\nonumber \end{align}
with the interface boundary conditions at $y = \bar {h}(z)$
:
$y = \bar {h}(z)$
:
 \begin{align} \partial _y \bar {u} - d_z \bar {h} \partial _z \bar {u} & = 0, \end{align}
 \begin{align} \bar {p} + \frac {Re }{Ca} \Big [1 + (d_z \bar {h})^2\Big ]^{-3/2} d_{zz} \bar {h} & = 0.\\[6pt]\nonumber \end{align}
At the side walls, the contact line condition is
 \begin{equation} \frac {d \bar {h}}{d z}\bigg |_{z=\pm W} = \pm \cot (\theta _s). \end{equation}
The bottom and side walls velocity conditions are
 \begin{align} \bar {u}(y=0,z) & = 0, \end{align}
 \begin{align} \bar {u}(y,z=\pm W) & = \mp l_s \partial _z\bar {u}.\\[10pt]\nonumber \end{align}
The governing equations for the streamwise velocity (2.13a
) and pressure (2.13b
) are coupled through the interface boundary conditions (2.14) via the interface profile $\bar {h}(z)$
, which motivates a more systematic approach to the problem. We proceed in two steps. First, we obtain the pressure and interface shape. Integrating equation (2.13b
) and using the condition
$\bar {h}(z)$
, which motivates a more systematic approach to the problem. We proceed in two steps. First, we obtain the pressure and interface shape. Integrating equation (2.13b
) and using the condition $\bar {p}|_{y={H}} = 0$
gives
$\bar {p}|_{y={H}} = 0$
gives
 \begin{equation} \bar {p}(y) = \textit{Ct} (H - y). \end{equation}
Substituting this expression into the interface condition (2.14b ) yields
 \begin{equation} \textit{Ct}(H - \bar {h}(z)) =-\frac {\textit{Re}}{\textit{Ca}} \Big [1 + (d_z \bar {h})^2\Big ]^{-3/2} d_{zz} \bar {h}. \end{equation}
We then write the interface profile as $\bar {h}(z) = H + \zeta (z)$
. This leads to the governing equation for the capillary elevation
$\bar {h}(z) = H + \zeta (z)$
. This leads to the governing equation for the capillary elevation $\zeta (z)$
:
$\zeta (z)$
:
 \begin{equation} \zeta = \frac {Re}{\textit{Ca} \textit{Ct} } \Bigg [1 + (d_z \zeta )^2\Bigg ]^{-3/2} d_{zz} \zeta = \frac {Re}{\textit{Ca} \textit{Ct}} \ \frac {\rm d}{\rm {d}z} \Bigg [ \frac {d_z \zeta }{ \sqrt { 1 + (d_z \zeta )^2} } \Bigg ]. \end{equation}
Multiplying by $ d_z \zeta$
and integrating by parts while using the conditions
$ d_z \zeta$
and integrating by parts while using the conditions $\zeta (0) = d_z \zeta (0) = 0$
, we obtain
$\zeta (0) = d_z \zeta (0) = 0$
, we obtain
 \begin{equation} \zeta ^2 - \frac {2 \textit{Re}}{\textit{Ca} \textit{Ct}} \Bigg [ 1 - \frac {1}{ \sqrt { 1 + (d_z \zeta )^2} } \Bigg ] = 0. \end{equation}
After rearrangement, this can be written as the first-order problem:
 \begin{equation} d_z \zeta = \Bigg [ \frac {1}{ \left(1 - \frac {\textit{Ca} \textit{Ct}}{2Re} \zeta ^2 \right)^2 } - 1 \Bigg ]^{1/2}. \end{equation}
Equation (2.21) is then solved numerically to compute $\zeta (z)$
for a channel configuration in which the capillary elevation and its slope vanish at the centre, consistent with the condition
$\zeta (z)$
for a channel configuration in which the capillary elevation and its slope vanish at the centre, consistent with the condition $\zeta (0) = d_z \zeta (0) = 0$
used in the derivation. This corresponds to channels for which wetting introduces variations in the film thickness and velocity in the vicinity of the side walls, while the central part of the flow remains effectively one-dimensional (1-D). In practice, this regime corresponds to
$\zeta (0) = d_z \zeta (0) = 0$
used in the derivation. This corresponds to channels for which wetting introduces variations in the film thickness and velocity in the vicinity of the side walls, while the central part of the flow remains effectively one-dimensional (1-D). In practice, this regime corresponds to $W{\kern-2pt}/{\kern-0.25pt}l_c \gtrsim 10$
. For smaller ratios, the lateral menisci are no longer local and they overlap and reshape the film across the entire spanwise direction, requiring a different base state formulation. Within this range, (2.21) is solved numerically for
$W{\kern-2pt}/{\kern-0.25pt}l_c \gtrsim 10$
. For smaller ratios, the lateral menisci are no longer local and they overlap and reshape the film across the entire spanwise direction, requiring a different base state formulation. Within this range, (2.21) is solved numerically for $\zeta (z)$
using the boundary condition at the walls:
$\zeta (z)$
using the boundary condition at the walls:
Base state solution: (a) interface profile and (b) interface velocity in the vicinity of the side walls. Our results are compared with the experimental data of Haas et al. (Reference Haas, Pollak and Aksel2011).

 \begin{equation} \zeta (z=\pm W) = \Bigg [ \frac {2Re}{\textit{Ca} \textit{Ct}} (1 - \sin (\theta _s)) \Bigg ]^{1/2}. \end{equation}
This leads to the interface profile $\bar {h}(z)$
, which defines the physical domain of the base flow. Given
$\bar {h}(z)$
, which defines the physical domain of the base flow. Given $\bar {h}(z)$
, the velocity and pressure fields are then obtained by solving the governing equations (2.13a
,
b
) with the boundary conditions (2.14) and the above-mentioned wall conditions. The resulting boundary-value problems for
$\bar {h}(z)$
, the velocity and pressure fields are then obtained by solving the governing equations (2.13a
,
b
) with the boundary conditions (2.14) and the above-mentioned wall conditions. The resulting boundary-value problems for $\bar {u}(y,z)$
and
$\bar {u}(y,z)$
and $\bar {p}(y)$
are solved numerically using Chebyshev differentiation in a rectangular computational domain, to which the physical domain defined by
$\bar {p}(y)$
are solved numerically using Chebyshev differentiation in a rectangular computational domain, to which the physical domain defined by $\bar {h}(z)$
is mapped. Further details of the mapping are provided in Appendix A.
$\bar {h}(z)$
is mapped. Further details of the mapping are provided in Appendix A.
Figure 2 presents the validation of our numerical solver against the experimental data obtained by Haas et al. (Reference Haas, Pollak and Aksel2011). Figure 2(a) shows the interface profile near the side walls for different contact angle values, and shows excellent agreement with experiments in both elevation amplitude and interface curvature. More importantly, the interface profile is accurately captured even for small contact angles ( $\theta =8^{\circ }$
), which corresponds to a higher capillary elevation. This notable increase in elevation is a result of the smaller radius of curvature, which increases the capillary forces pulling the liquid upward.
$\theta =8^{\circ }$
), which corresponds to a higher capillary elevation. This notable increase in elevation is a result of the smaller radius of curvature, which increases the capillary forces pulling the liquid upward.
Moreover, a distinctive feature of the base state solution is the velocity overshoot in the vicinity of the side walls. The capillary elevation induces a non-uniform film thickness in the spanwise direction. Under the same gravitational forces, the local Nusselt solution scales with the square of the film thickness, so the thicker regions support higher streamwise velocities. This spanwise variation of the film thickness leads to an overshoot in the streamwise velocity near the side walls (Zhou & Prosperetti Reference Zhou and Prosperetti2020). Excellent agreement is found between our numerically obtained velocity profile and the experiments of Haas et al. (Reference Haas, Pollak and Aksel2011), as shown in figure 2(b). The magnitude of the velocity overshoot is proportional to the capillary elevation to base interface height ratio ( $\zeta /H$
). As shown, the velocity overshoot becomes more pronounced as this ratio increases, while the peak velocity shifts further away from the side walls. This emphasises the important role of wetting effects and capillary elevation in shaping the velocity field near the side walls.
$\zeta /H$
). As shown, the velocity overshoot becomes more pronounced as this ratio increases, while the peak velocity shifts further away from the side walls. This emphasises the important role of wetting effects and capillary elevation in shaping the velocity field near the side walls.
2.2. Linear stability analysis
We perform a modal linear stability analysis based on the biglobal approach, which accounts for the variations in both the wall-normal ( $y$
) and spanwise directions (
$y$
) and spanwise directions ( $z$
), enabling the examination of the stability modes affected by spanwise confinement, and more importantly, wetting effects. The flow field is decomposed into a combination of the steady state and infinitesimal perturbations as follows:
$z$
), enabling the examination of the stability modes affected by spanwise confinement, and more importantly, wetting effects. The flow field is decomposed into a combination of the steady state and infinitesimal perturbations as follows:
 \begin{align} \boldsymbol{u}(x,y,z,t) & = \bar {\boldsymbol{u}}(y,z) + \epsilon \tilde {\boldsymbol{u}}(x,y,z,t), \end{align}
 \begin{align} {p}(x,y,z,t) &= \bar {{p}}(y) + \epsilon \tilde {{p}}(x,y,z,t), \end{align}
 \begin{align} h(x,z,t) &= \bar {h}(z) + \epsilon \tilde {h}(x,z,t),\\[10pt]\nonumber \end{align}
where $\epsilon \ll 1$
is the perturbation amplitude. Substituting this expansion into the governing equations (2.2) and boundary conditions (2.3)–(2.11), and retaining the terms up to
$\epsilon \ll 1$
is the perturbation amplitude. Substituting this expansion into the governing equations (2.2) and boundary conditions (2.3)–(2.11), and retaining the terms up to $O(\epsilon )$
leads to the linearised equations governing the perturbations, which are expressed as follows:
$O(\epsilon )$
leads to the linearised equations governing the perturbations, which are expressed as follows:
 \begin{align} \partial _x \tilde {u} + \partial _y \tilde {v} + \partial _z \tilde {w} &= 0, \end{align}
 \begin{align} \partial _t \tilde {u} + \bar {u} \partial _x \tilde {u} + (\partial _y \bar {u} )\tilde {v} + (\partial _z \bar {u}) \tilde {w} + \partial _x \tilde {p} - \boldsymbol{\nabla} ^2 \tilde {u} &= 0, \end{align}
 \begin{align} \partial _t \tilde {v} + \bar {u} \partial _x \tilde {v} + \partial _y \tilde {p} - \boldsymbol{\nabla} ^2 \tilde {v} &= 0, \end{align}
 \begin{align} \partial _t \tilde {w} + \bar {u} \partial _x \tilde {w} + \partial _z \tilde {p} - \boldsymbol{\nabla} ^2 \tilde {w} & = 0.\\[10pt]\nonumber \end{align}
The linearised interface boundary conditions are
 \begin{align} & \partial _t \tilde {h} + \bar {u} \partial _x \tilde {h} + \partial _z \bar {h} \tilde {w} - \tilde {v}= 0, \end{align}
 \begin{align} &\tilde {p} + \partial _y \bar {p} \tilde {h} - {2} \big [ ( \partial _z \bar {h})^2 \partial _z \tilde {w} - \partial _z \bar {h} (\partial _z \tilde {v} + \partial _y \tilde {w}) + \partial _y \tilde {v} \big ] / \bar {n}^2 \nonumber \\ & \qquad \qquad \qquad \qquad \qquad \qquad + \text{} (Re/Ca) \big [ [1+ ( \partial _z \bar {h})^2] \partial _{xx} \tilde {h} + \partial _{zz} \tilde {h} \big ] / {\bar {n}^3} = 0, \end{align}
 \begin{align} & \partial _{yy} \bar {u} \tilde {h} + \partial _y \tilde {u} + \partial _x \tilde {v} - \partial _z \bar {u} \partial _z \tilde {h} - \partial _z \bar {h} ( \partial _z \tilde {u} + \partial _{zy} \bar {u} \tilde {h} + \partial _x \tilde {w} ) = 0, \end{align}
 \begin{align} & (1 - (\partial _z \bar {h})^2) (\partial _y \tilde {w} + \partial _z \tilde {v}) - \partial _z \bar {u} \partial _x \tilde {h} - \partial _z \bar {h} \partial _y \bar {u} \partial _x \tilde {h} + 2\partial _z \bar {h} (\partial _y \tilde {v} - \partial _z \tilde {w})=0.\\[10pt]\nonumber \end{align}
Notably, the interface boundary conditions are significantly more complex compared with those in the non-wetting case, as new terms proportional to $\partial _z \bar {h}$
appear. With regards to the contact line condition, contact line dynamics enter only beyond leading order linear stability analysis (Snoeijer et al. Reference Snoeijer, Andreotti, Delon and Fermigier2007; Savva, Rednikov & Colinet Reference Savva, Rednikov and Colinet2017; Viola & Gallaire Reference Viola and Gallaire2018). Accordingly, we impose no perturbation of the contact angle (
$\partial _z \bar {h}$
appear. With regards to the contact line condition, contact line dynamics enter only beyond leading order linear stability analysis (Snoeijer et al. Reference Snoeijer, Andreotti, Delon and Fermigier2007; Savva, Rednikov & Colinet Reference Savva, Rednikov and Colinet2017; Viola & Gallaire Reference Viola and Gallaire2018). Accordingly, we impose no perturbation of the contact angle ( $\tilde {\theta }=0$
). Linearisation of the geometric slope-angle relation (2.7) thus yields the free-edge boundary condition:
$\tilde {\theta }=0$
). Linearisation of the geometric slope-angle relation (2.7) thus yields the free-edge boundary condition:
 \begin{equation} \frac {\partial \tilde {h}}{\partial z}\bigg |_{z=\pm W} =0. \end{equation}
This free-edge condition is the most suitable closure for the present configuration. An alternative would be a pinned contact line, $\tilde {h} = 0$
, which enforces zero displacement at the side walls and is typically associated with geometric pinning or brim-full containers (Kidambi Reference Kidambi2007). In contrast, the present problem involves a partially filled channel with a prescribed static contact angle at the side walls, for which the free-edge condition provides a more appropriate leading-order physical interpretation.
$\tilde {h} = 0$
, which enforces zero displacement at the side walls and is typically associated with geometric pinning or brim-full containers (Kidambi Reference Kidambi2007). In contrast, the present problem involves a partially filled channel with a prescribed static contact angle at the side walls, for which the free-edge condition provides a more appropriate leading-order physical interpretation.
The linearised boundary conditions at the bottom wall are
 \begin{equation} \tilde {u} = \tilde {v} = \tilde {w} = 0, \end{equation}
while at the side walls ( $z = \pm W)$
, we have
$z = \pm W)$
, we have
 \begin{align} \tilde {u} \pm l_s \partial _z \tilde {u} & = 0 , \end{align}
 \begin{align} \tilde {v} \pm l_s\partial _z \tilde {v} & = 0. \end{align}
 \begin{align} \tilde {w} & = 0,\\[10pt]\nonumber \end{align}
Additionally, we introduce the compatibility condition for the pressure perturbation at the bottom and side walls (Theofilis, Duck & Owen Reference Theofilis, Duck and Owen2004):
 \begin{align} & \partial _y \tilde {p} = \boldsymbol{\nabla} ^2 \tilde {v} - \bar {u} \partial _x \tilde {v}, \end{align}
 \begin{align} & \partial _z \tilde {p} = \boldsymbol{\nabla} ^2 \tilde {w} - \bar {u} \partial _x \tilde {w}.\\[10pt]\nonumber \end{align}
Finally, the perturbations are assumed to have the following form:
 \begin{align} \tilde {\boldsymbol{u}}(x,y,z,t) & = \boldsymbol{\hat {u}}(z,y) \exp (ikx - i\omega t), \end{align}
 \begin{align} \tilde {{p}}(x,y,z,t) & = {\hat {p}}(z,y) \exp (ikx - i\omega t), \end{align}
 \begin{align} \tilde {h}(x,z,t) & = \hat {h}(z) \exp (ikx - i\omega t).\\[10pt]\nonumber \end{align}
We follow a temporal stability analysis where $k$
represents the wavenumber of the perturbations in the streamwise direction,
$k$
represents the wavenumber of the perturbations in the streamwise direction, $\omega$
is the complex angular frequency, where the imaginary part
$\omega$
is the complex angular frequency, where the imaginary part $\omega _i$
determines the temporal growth rate: at
$\omega _i$
determines the temporal growth rate: at $\omega _i \gt 0$
, the perturbations grow and the flow is unstable and vice versa.
$\omega _i \gt 0$
, the perturbations grow and the flow is unstable and vice versa.
2.3. Numerical method
Substituting the expansions (2.30) into the linearised governing equations and boundary conditions (2.24)–(2.29) results in a general eigenvalue problem. This problem is discretised using spectral collocation methods with Chebyshev polynomials in both the wall-normal ( $y$
) and spanwise (
$y$
) and spanwise ( $z$
) directions (Trefethen Reference Trefethen2000). The boundary conditions are enforced by appropriately modifying the corresponding rows of the spectral matrices.
$z$
) directions (Trefethen Reference Trefethen2000). The boundary conditions are enforced by appropriately modifying the corresponding rows of the spectral matrices.
A two-dimensional mapping is implemented to transform the non-rectangular physical domain into the rectangular computational Chebyshev domain, which accounts for the curved free surface associated with the meniscus. Further details on the numerical mapping are provided in Appendix A. The resulting eigenvalue problem is solved using the QZ algorithm, where the solution consists of the eigenvalues ( $\omega$
), and the associated eigenfunctions (
$\omega$
), and the associated eigenfunctions ( $ \boldsymbol{\hat {u}}, \hat {p}, \hat {h}$
), which represent the perturbation amplitudes.
$ \boldsymbol{\hat {u}}, \hat {p}, \hat {h}$
), which represent the perturbation amplitudes.
With regards to the slip length $l_s$
, prescribing a physically realistic molecular value is not computationally feasible, as molecular slip lengths are typically on the nanometre scale (Eggers & Stone Reference Eggers and Stone2004), which is far below feasible numerical resolutions. Consequently, the slip length in the present formulation does not represent its exact molecular value; instead, it serves as an effective parameter that regularises the singularity at the side walls, with its value linked to grid resolution (Renardy, Renardy & Li Reference Renardy, Renardy and Li2001; Afkhami, Zaleski & Bussmann Reference Afkhami, Zaleski and Bussmann2009). For the results reported here, the non-dimensional slip length is chosen to be
$l_s$
, prescribing a physically realistic molecular value is not computationally feasible, as molecular slip lengths are typically on the nanometre scale (Eggers & Stone Reference Eggers and Stone2004), which is far below feasible numerical resolutions. Consequently, the slip length in the present formulation does not represent its exact molecular value; instead, it serves as an effective parameter that regularises the singularity at the side walls, with its value linked to grid resolution (Renardy, Renardy & Li Reference Renardy, Renardy and Li2001; Afkhami, Zaleski & Bussmann Reference Afkhami, Zaleski and Bussmann2009). For the results reported here, the non-dimensional slip length is chosen to be $10^{-2}$
, while the minimum grid spacing is fixed to
$10^{-2}$
, while the minimum grid spacing is fixed to $\Delta z_{min} = 1 \times 10^{-3}$
. Grid convergence tests and a detailed discussion on the sensitivity of the results to the slip length are presented in Appendix B.
$\Delta z_{min} = 1 \times 10^{-3}$
. Grid convergence tests and a detailed discussion on the sensitivity of the results to the slip length are presented in Appendix B.
3. Results
The linear stability of gravity-driven liquid films is classically examined in a two-dimensional configuration where the spanwise direction is considered to be infinite, and the main controlling parameters are inertia, viscosity, gravity and, at finite wavenumber, capillarity. When spanwise confinement is introduced, our previous study (Mohamed et al. Reference Mohamed, Sesterhenn and Biancofiore2023) has shown that the ratio of channel half-width to mean film thickness ( $W/H$
) significantly modifies the stability behaviour when
$W/H$
) significantly modifies the stability behaviour when $W/H \lesssim 50$
, with notable stabilisation of perturbations at moderate wavenumbers. This effect arises primarily from the development of a viscous boundary layer near the side walls, which locally damps perturbations and suppresses the hydrodynamic instability.
$W/H \lesssim 50$
, with notable stabilisation of perturbations at moderate wavenumbers. This effect arises primarily from the development of a viscous boundary layer near the side walls, which locally damps perturbations and suppresses the hydrodynamic instability.
In the present work, we investigate the influence of side-wall wetting on the linear stability and its interaction with the stabilising effect of the side-wall viscous boundary layers caused by spanwise confinement. We first consider a geometric confinement ratio of $W/H =20$
, for which the viscous boundary layer thickness at the side walls is non-negligible compared with the film width, leading to the stabilising effect previously described. We therefore refer to
$W/H =20$
, for which the viscous boundary layer thickness at the side walls is non-negligible compared with the film width, leading to the stabilising effect previously described. We therefore refer to $W/H = 20$
as a ‘confined’ channel in the sense that side-wall viscous boundary layers are dynamically important. In contrast, at
$W/H = 20$
as a ‘confined’ channel in the sense that side-wall viscous boundary layers are dynamically important. In contrast, at $W/H = 100$
, the instability of the flow is weakly influenced by the side-wall viscous boundary layers and the stability characteristics are similar to those of a two-dimensional unconfined falling film limit. Based on this, we refer to
$W/H = 100$
, the instability of the flow is weakly influenced by the side-wall viscous boundary layers and the stability characteristics are similar to those of a two-dimensional unconfined falling film limit. Based on this, we refer to $W/H = 100$
as a ‘weakly confined’ channel, in which viscous effects due to spanwise confinement are negligible.
$W/H = 100$
as a ‘weakly confined’ channel, in which viscous effects due to spanwise confinement are negligible.
To quantify the spatial extent of the wall-induced wetting, we use the confinement to capillary length ratio $W{\kern-2pt}/{\kern-0.25pt}l_c$
. We focus on channel configurations in which wetting introduces local modifications of the film thickness, curvature and velocity in the vicinity of the side walls, while the bulk of the flow behaves mainly as an unconfined falling film. For this configuration, the smallest ratio considered is
$W{\kern-2pt}/{\kern-0.25pt}l_c$
. We focus on channel configurations in which wetting introduces local modifications of the film thickness, curvature and velocity in the vicinity of the side walls, while the bulk of the flow behaves mainly as an unconfined falling film. For this configuration, the smallest ratio considered is $W{\kern-2pt}/{\kern-0.25pt}l_c = 10$
, where smaller ratios lead to overlapping lateral menisci that reshape the flow across the entire width, defining a different physical regime that lies outside the scope of this work. A third key parameter is the contact angle
$W{\kern-2pt}/{\kern-0.25pt}l_c = 10$
, where smaller ratios lead to overlapping lateral menisci that reshape the flow across the entire width, defining a different physical regime that lies outside the scope of this work. A third key parameter is the contact angle $\theta$
at the side walls, which together with
$\theta$
at the side walls, which together with $l_c$
, controls the meniscus shape and thereby influences the stability characteristics.
$l_c$
, controls the meniscus shape and thereby influences the stability characteristics.
For clarification, the capillary number is chosen as the primary control parameter for wetting effects. This method ensures a constant confinement-to-capillary-length ratio ( $W{\kern-2pt}/{\kern-0.25pt}l_c$
), which preserves the shape and influence of the wall induced meniscus across different flow regimes. The Kapitza number is also reported according to (2.5), to offer qualitative comparison with experimental data which is typically based on
$W{\kern-2pt}/{\kern-0.25pt}l_c$
), which preserves the shape and influence of the wall induced meniscus across different flow regimes. The Kapitza number is also reported according to (2.5), to offer qualitative comparison with experimental data which is typically based on $\textit{Ka}$
. This approach ensures both physical consistency in the modelling and relevance to experimental observations.
$\textit{Ka}$
. This approach ensures both physical consistency in the modelling and relevance to experimental observations.
Temporal growth rate contours in $ \textit{Re}{-}k$
space for different values of
$ \textit{Re}{-}k$
space for different values of $W{\kern-2pt}/{\kern-0.25pt}l_c$
and
$W{\kern-2pt}/{\kern-0.25pt}l_c$
and $ \theta$
, with
$ \theta$
, with $ W/H = 20$
and
$ W/H = 20$
and $ \beta = 10^\circ$
. Panels (a–c) correspond to a capillary number
$ \beta = 10^\circ$
. Panels (a–c) correspond to a capillary number $ \textit{Ca} = 0.15$
, while panels (d–f) correspond to
$ \textit{Ca} = 0.15$
, while panels (d–f) correspond to $ \textit{Ca} = 0.04$
. The purple line represents the neutral curve for the 1-D (unconfined) flow, corresponding to
$ \textit{Ca} = 0.04$
. The purple line represents the neutral curve for the 1-D (unconfined) flow, corresponding to $ W \to \infty$
.
$ W \to \infty$
.

3.1. Confined channels ( $W/H = 20$
)
$W/H = 20$
)

We begin our analysis by considering a confined channel characterised by a confinement ratio of $W/H=20$
. In this regime, the side walls introduce a strong viscous boundary layer near the side walls that leads to confinement-induced stabilisation. The objective here is to investigate how wetting effects interact with and potentially modulate this stabilising mechanism.
$W/H=20$
. In this regime, the side walls introduce a strong viscous boundary layer near the side walls that leads to confinement-induced stabilisation. The objective here is to investigate how wetting effects interact with and potentially modulate this stabilising mechanism.
Figure 3 shows the temporal growth rate contours in the $\textit{Re}{-}k$
plane for different values of the channel width to capillary length ratio
$\textit{Re}{-}k$
plane for different values of the channel width to capillary length ratio $W{\kern-2pt}/{\kern-0.25pt}l_c$
and contact angle
$W{\kern-2pt}/{\kern-0.25pt}l_c$
and contact angle $\theta$
. The ratio
$\theta$
. The ratio $W{\kern-2pt}/{\kern-0.25pt}l_c$
is varied by adjusting the capillary number
$W{\kern-2pt}/{\kern-0.25pt}l_c$
is varied by adjusting the capillary number $\textit{Ca}$
, while keeping the channel width
$\textit{Ca}$
, while keeping the channel width $W$
fixed. In terms of the Kapitza number, the present parameters correspond to
$W$
fixed. In terms of the Kapitza number, the present parameters correspond to $\textit{Ka} = 200{-}800$
, which lies within the range reported in earlier experiments (Georgantaki et al. Reference Georgantaki, Vatteville, Vlachogiannis and Bontozoglou2011). In the absence of wetting (
$\textit{Ka} = 200{-}800$
, which lies within the range reported in earlier experiments (Georgantaki et al. Reference Georgantaki, Vatteville, Vlachogiannis and Bontozoglou2011). In the absence of wetting ( $\theta =90^\circ$
), the well-documented confinement-induced stabilisation is observed for both
$\theta =90^\circ$
), the well-documented confinement-induced stabilisation is observed for both $W{\kern-2pt}/{\kern-0.25pt}l_c$
values where perturbations at intermediate wavenumbers are suppressed. For the larger
$W{\kern-2pt}/{\kern-0.25pt}l_c$
values where perturbations at intermediate wavenumbers are suppressed. For the larger $W{\kern-2pt}/{\kern-0.25pt}l_c$
value corresponding to weaker capillary forces, the instability domain extends to higher wavenumbers, while the onset of the long-wave instability in the limit
$W{\kern-2pt}/{\kern-0.25pt}l_c$
value corresponding to weaker capillary forces, the instability domain extends to higher wavenumbers, while the onset of the long-wave instability in the limit $k \rightarrow 0$
remains unchanged, consistent with classical theory in which surface tension plays no role in this limit. This is evident when comparing panels (a) and (d). With regards to the ridge that appears at moderate wavenumbers, it marks a change in the identity of the most unstable eigenmode. In this region of the
$k \rightarrow 0$
remains unchanged, consistent with classical theory in which surface tension plays no role in this limit. This is evident when comparing panels (a) and (d). With regards to the ridge that appears at moderate wavenumbers, it marks a change in the identity of the most unstable eigenmode. In this region of the $\textit{Re}{-}k$
plane, different types of instability modes have comparable growth rates, and since figure 3 shows only the leading eigenvalue, the switch from one branch to the other appears as a ridge rather than a smooth variation of the growth rate. This mode competition was examined in more detail and discussed extensively in our previous work (Mohamed et al. Reference Mohamed, Sesterhenn and Biancofiore2023).
$\textit{Re}{-}k$
plane, different types of instability modes have comparable growth rates, and since figure 3 shows only the leading eigenvalue, the switch from one branch to the other appears as a ridge rather than a smooth variation of the growth rate. This mode competition was examined in more detail and discussed extensively in our previous work (Mohamed et al. Reference Mohamed, Sesterhenn and Biancofiore2023).
Normalised base state streamwise velocity at $y = \bar {h}(z)$
for different
$y = \bar {h}(z)$
for different $W{\kern-2pt}/{\kern-0.25pt}l_c$
values for
$W{\kern-2pt}/{\kern-0.25pt}l_c$
values for $W/H=20$
.
$W/H=20$
.

When wetting is introduced ( $\theta = 65^{\circ }$
), the stabilisation effect of confinement at moderate wavenumbers is unexpectedly weakened. The instability contours start to resemble those of the unconfined 1-D case, especially when surface tension is stronger (i.e.
$\theta = 65^{\circ }$
), the stabilisation effect of confinement at moderate wavenumbers is unexpectedly weakened. The instability contours start to resemble those of the unconfined 1-D case, especially when surface tension is stronger (i.e. $W{\kern-2pt}/{\kern-0.25pt}l_c=10$
). As the contact angle decreases further to
$W{\kern-2pt}/{\kern-0.25pt}l_c=10$
). As the contact angle decreases further to $\theta =15^{\circ }$
, the confinement-induced stabilisation is almost entirely eliminated, as shown in panel (f). This behaviour indicates that increasing wall wettability enhances capillary elevation near the side walls, which counteracts the stabilising influence of the viscous boundary layer. Importantly, while changes in
$\theta =15^{\circ }$
, the confinement-induced stabilisation is almost entirely eliminated, as shown in panel (f). This behaviour indicates that increasing wall wettability enhances capillary elevation near the side walls, which counteracts the stabilising influence of the viscous boundary layer. Importantly, while changes in $\theta$
do not alter the ratio
$\theta$
do not alter the ratio $W{\kern-2pt}/{\kern-0.25pt}l_c$
, they do modify the interface curvature and thereby the magnitude of the lateral capillary forces.
$W{\kern-2pt}/{\kern-0.25pt}l_c$
, they do modify the interface curvature and thereby the magnitude of the lateral capillary forces.
To better understand the influence of wetting on the confinement-induced stabilisation, we examine the streamwise base flow velocity for different $W{\kern-2pt}/{\kern-0.25pt}l_c$
values. Figure 4 presents the normalised base state streamwise velocity at the interface
$W{\kern-2pt}/{\kern-0.25pt}l_c$
values. Figure 4 presents the normalised base state streamwise velocity at the interface $\hat {u}= \bar {u}(y=\bar h(z),z)/\bar {U}(H)$
, where
$\hat {u}= \bar {u}(y=\bar h(z),z)/\bar {U}(H)$
, where $\bar {U}(H)$
is the interface streamwise velocity in an infinitely wide channel. When wetting effects are negligible (
$\bar {U}(H)$
is the interface streamwise velocity in an infinitely wide channel. When wetting effects are negligible ( $ W \gg l_c$
), the velocity profile exhibits a clear deceleration in the vicinity of the side walls, indicative of a viscous boundary layer which leads to flow stabilisation. However, as wetting is introduced (
$ W \gg l_c$
), the velocity profile exhibits a clear deceleration in the vicinity of the side walls, indicative of a viscous boundary layer which leads to flow stabilisation. However, as wetting is introduced ( $W{\kern-2pt}/{\kern-0.25pt}l_c$
decreases), the flow is accelerated near the side walls, causing a velocity overshoot which becomes more pronounced with smaller
$W{\kern-2pt}/{\kern-0.25pt}l_c$
decreases), the flow is accelerated near the side walls, causing a velocity overshoot which becomes more pronounced with smaller $W{\kern-2pt}/{\kern-0.25pt}l_c$
values, resulting in the reduction of the thickness of the stabilising viscous boundary layer.
$W{\kern-2pt}/{\kern-0.25pt}l_c$
values, resulting in the reduction of the thickness of the stabilising viscous boundary layer.
These findings suggest that, in confined channels, the presence of side-wall wetting can substantially reduce, and in some cases almost cancel, the viscous boundary layer induced stabilisation provided by spanwise confinement. In this sense, side-wall wetting plays a previously unreported relatively destabilising role. Next, we turn to the weakly confined channel case, in which the stabilising effect of the side-wall boundary layers is negligible.
3.2. Weakly confined channels (
$W/H = 100)$

Next, we consider the case of weakly confined channels, in which the spanwise confinement ratio $W/H$
is sufficiently large that the thickness of the side-wall boundary layer is negligible compared with the channel width and therefore no confinement-induced stabilising effect is present. In this configuration, the stability behaviour is effectively similar to that of the 1-D unconfined case, which allows us to isolate the role of wetting without the interference from spanwise confinement.
$W/H$
is sufficiently large that the thickness of the side-wall boundary layer is negligible compared with the channel width and therefore no confinement-induced stabilising effect is present. In this configuration, the stability behaviour is effectively similar to that of the 1-D unconfined case, which allows us to isolate the role of wetting without the interference from spanwise confinement.
Temporal growth rate contours in the $ \textit{Re}{-}k$
space for different values of
$ \textit{Re}{-}k$
space for different values of $W{\kern-2pt}/{\kern-0.25pt}l_c$
and
$W{\kern-2pt}/{\kern-0.25pt}l_c$
and $ \theta$
, with
$ \theta$
, with $ W/H = 100$
and
$ W/H = 100$
and $ \beta = 10^\circ$
. Panels (a)–(c) correspond to a fixed capillary number
$ \beta = 10^\circ$
. Panels (a)–(c) correspond to a fixed capillary number $ \textit{Ca} = 0.008$
, while panels (d)–(f) correspond to
$ \textit{Ca} = 0.008$
, while panels (d)–(f) correspond to $ \textit{Ca} = 0.002$
. The purple line represents the neutral curve for the 1-D (unconfined) flow, corresponding to
$ \textit{Ca} = 0.002$
. The purple line represents the neutral curve for the 1-D (unconfined) flow, corresponding to $ W \to \infty$
.
$ W \to \infty$
.

Similarly, figure 5 presents the temporal growth rate contours in the $ \textit{Re}{-}k$
plane for various values of
$ \textit{Re}{-}k$
plane for various values of $W{\kern-2pt}/{\kern-0.25pt}l_c$
ratio and contact angle. For
$W{\kern-2pt}/{\kern-0.25pt}l_c$
ratio and contact angle. For $\theta = 90^{\circ }$
, the unstable region narrows only at high wavenumbers as
$\theta = 90^{\circ }$
, the unstable region narrows only at high wavenumbers as $W{\kern-2pt}/{\kern-0.25pt}l_c$
decreases, which is caused by the increase in surface tension. The onset of the long-wave instability remains unchanged, consistent with the classical 1-D theory. Furthermore, the instability contours match those of the 1-D unconfined case, confirming the absence of confinement-induced stabilisation.
$W{\kern-2pt}/{\kern-0.25pt}l_c$
decreases, which is caused by the increase in surface tension. The onset of the long-wave instability remains unchanged, consistent with the classical 1-D theory. Furthermore, the instability contours match those of the 1-D unconfined case, confirming the absence of confinement-induced stabilisation.
As the contact angle decreases to $\theta = 65^{\circ }$
, more pronounced wetting results in a contraction of the instability region at small wavenumbers, leading to the suppression of long-wave perturbations. This leads to a shift in the onset of the instability to higher Reynolds numbers, while the growth rate at larger wavenumbers (
$\theta = 65^{\circ }$
, more pronounced wetting results in a contraction of the instability region at small wavenumbers, leading to the suppression of long-wave perturbations. This leads to a shift in the onset of the instability to higher Reynolds numbers, while the growth rate at larger wavenumbers ( $k\gtrsim 0.1$
) remains largely unchanged. This effect is more pronounced with a decreasing
$k\gtrsim 0.1$
) remains largely unchanged. This effect is more pronounced with a decreasing $W{\kern-2pt}/{\kern-0.25pt}l_c$
ratio. A further reduction in contact angle to
$W{\kern-2pt}/{\kern-0.25pt}l_c$
ratio. A further reduction in contact angle to $15^{\circ }$
strengthens this effect, with long-wave instability being completely suppressed in the given parameter range under strong wetting conditions. The parameters presented here correspond to a Kapitza number in the range
$15^{\circ }$
strengthens this effect, with long-wave instability being completely suppressed in the given parameter range under strong wetting conditions. The parameters presented here correspond to a Kapitza number in the range $\textit{Ka} = 3000{-}15000$
, which lies within the values reported in the earlier experiments of Georgantaki et al. (Reference Georgantaki, Vatteville, Vlachogiannis and Bontozoglou2011).
$\textit{Ka} = 3000{-}15000$
, which lies within the values reported in the earlier experiments of Georgantaki et al. (Reference Georgantaki, Vatteville, Vlachogiannis and Bontozoglou2011).
Additionally, figure 6 illustrates the temporal growth rate $\omega _i$
as a function of wavenumber
$\omega _i$
as a function of wavenumber $k$
at two different Reynolds numbers. A clear stabilisation is observed across all wavenumbers, particularly in the long-wave limit (
$k$
at two different Reynolds numbers. A clear stabilisation is observed across all wavenumbers, particularly in the long-wave limit ( $k \rightarrow 0$
) at low Reynolds numbers
$k \rightarrow 0$
) at low Reynolds numbers $\textit{Re} = 50$
shown in panel (a). This behaviour is consistent with the wetting-induced stabilisation observed in the contour plots. However, at higher Reynolds number (
$\textit{Re} = 50$
shown in panel (a). This behaviour is consistent with the wetting-induced stabilisation observed in the contour plots. However, at higher Reynolds number ( $\textit{Re}=100$
), shown in panel (b), the stabilisation influence of wetting becomes significantly weaker at all wavenumbers. The growth rate curves for different contact angles nearly converge across all wavenumbers, indicating diminishing wetting stabilisation.
$\textit{Re}=100$
), shown in panel (b), the stabilisation influence of wetting becomes significantly weaker at all wavenumbers. The growth rate curves for different contact angles nearly converge across all wavenumbers, indicating diminishing wetting stabilisation.
In both cases, the wetting influence on the flow is similar since the capillary number is fixed. The observed reduction in the stabilisation is therefore not a result of weakening the wetting itself, but rather due to a shift of the dominant mechanism. As $\textit{Re}$
increases, inertial effects become more dominant over wetting and the flow transitions into an inertia-dominated regime that is less sensitive to wetting effects. This indicates that wetting is more effective at low
$\textit{Re}$
increases, inertial effects become more dominant over wetting and the flow transitions into an inertia-dominated regime that is less sensitive to wetting effects. This indicates that wetting is more effective at low $\textit{Re}$
, where capillary forces play a more dominant role over inertial forces.
$\textit{Re}$
, where capillary forces play a more dominant role over inertial forces.
Taken together, the results highlight a distinct difference in the influence of wetting on the stability between confined and weakly confined channels, despite maintaining a fixed $W{\kern-2pt}/{\kern-0.25pt}l_c$
ratio. In weakly confined channels, stronger surface tension and larger capillary elevations are possible since the geometric restrictions on meniscus formation are weak. This provides room for strong wetting effects that lead to the stabilisation of long-wave perturbations, shifting the instability onset to higher Reynolds numbers.
$W{\kern-2pt}/{\kern-0.25pt}l_c$
ratio. In weakly confined channels, stronger surface tension and larger capillary elevations are possible since the geometric restrictions on meniscus formation are weak. This provides room for strong wetting effects that lead to the stabilisation of long-wave perturbations, shifting the instability onset to higher Reynolds numbers.
However, in confined channels, the geometric constraint limits stronger wetting effects and prevents the strong stabilising effect observed in wide channels. Instead, the velocity overshoot that develops near the side walls due to capillary elevation weakens the viscous boundary layer that drives the confinement-induced stabilisation. Therefore, wetting acts as a relatively destabilising effect with respect to the non-wetting confined case. In weakly confined channels, however, the velocity overshoot is restricted to a small region near the side walls and thus has a negligible effect on the stability. This interpretation is consistent with the experimental observations of Pollak et al. (Reference Pollak, Haas and Aksel2011), who found that in wide channels, the destabilising role of velocity overshoot is minor relative to the dominant stabilising influence of surface tension.
Temporal growth rate for different contact angle values for (a) $\textit{Re} = 50$
and (b)
$\textit{Re} = 50$
and (b) $\textit{Re} = 100$
, when
$\textit{Re} = 100$
, when $W/H = 100$
,
$W/H = 100$
, $\textit{Ca} = 0.01$
,
$\textit{Ca} = 0.01$
, $\beta = 10^{\circ }$
.
$\beta = 10^{\circ }$
.

3.3. Transition between confined and weakly confined channels
The previous sections examined the effect of side-wall wetting in two limiting configurations. In a confined channel ( $W/H=20$
), where viscous boundary layers at the side walls are dynamically important, wetting was found to have a relatively destabilising effect on the flow, as it reduces the effectiveness of the viscous boundary layers that stabilise the flow at moderate wavenumbers. In contrast, wetting was found to have little influence on the long-wave instability in the limit
$W/H=20$
), where viscous boundary layers at the side walls are dynamically important, wetting was found to have a relatively destabilising effect on the flow, as it reduces the effectiveness of the viscous boundary layers that stabilise the flow at moderate wavenumbers. In contrast, wetting was found to have little influence on the long-wave instability in the limit $k \rightarrow 0$
. For a weakly confined channel (
$k \rightarrow 0$
. For a weakly confined channel ( $W/H=100$
), where viscous confinement effects are negligible and the stability characteristics are similar to those of a 1-D configuration, side-wall wetting acts as a stabilising mechanism for long-wave perturbations, leading to a significant increase in the instability threshold Reynolds number.
$W/H=100$
), where viscous confinement effects are negligible and the stability characteristics are similar to those of a 1-D configuration, side-wall wetting acts as a stabilising mechanism for long-wave perturbations, leading to a significant increase in the instability threshold Reynolds number.
Phase diagram of wetting-induced modifications to linear stability neutral curve as a function of the wavenumber $k$
and the confinement ratio
$k$
and the confinement ratio $W/H$
. Colour contours show the percentage shift of the critical Reynolds number due to wetting according to (3.1). Parameters:
$W/H$
. Colour contours show the percentage shift of the critical Reynolds number due to wetting according to (3.1). Parameters: $\beta =5^{\circ }$
,
$\beta =5^{\circ }$
, $\textit{Ca}=0.056$
and
$\textit{Ca}=0.056$
and $\theta =15^{\circ }$
.
$\theta =15^{\circ }$
.

To examine the transition between these distinct roles of wetting across different confinement levels, figure 7 presents a phase diagram showing the wetting-induced shift of the stability threshold as a function of the confinement ratio $W/H$
and the wavenumber
$W/H$
and the wavenumber $k$
. The colour contours represent the relative change in the critical Reynolds number due to wetting:
$k$
. The colour contours represent the relative change in the critical Reynolds number due to wetting:
 \begin{equation} \varDelta _{\textit{wet}} = \frac {\textit{Re}_c^{\textit{visc}} - \textit{Re}_c^{\textit{wet+visc}}}{\textit{Re}_c^{\textit{visc}}} \times 100, \end{equation}
where $\textit{Re}_c^{\textit{visc}}$
denotes the critical Reynolds number in the non-wetting confined case and
$\textit{Re}_c^{\textit{visc}}$
denotes the critical Reynolds number in the non-wetting confined case and $\textit{Re}_c^{\textit{wet+visc}}$
denotes the corresponding value when wetting is included. Wetting is destabilising relative to the non-wetting confined flow for positive values of
$\textit{Re}_c^{\textit{wet+visc}}$
denotes the corresponding value when wetting is included. Wetting is destabilising relative to the non-wetting confined flow for positive values of $\Delta _{\textit{wet}}$
, while negative values indicate stabilisation. Moreover, the top horizontal axis shows the corresponding channel width to capillary length ratio, obtained as
$\Delta _{\textit{wet}}$
, while negative values indicate stabilisation. Moreover, the top horizontal axis shows the corresponding channel width to capillary length ratio, obtained as
 \begin{equation} \frac {W}{l_c} = \frac {W}{H} \sqrt {\frac {Ca}{\tan {\beta }}}, \end{equation}
where $\textit{Ca}$
and
$\textit{Ca}$
and $\beta$
are fixed. This axis provides a measure of the change in the spatial extent over which side-wall wetting forces act as the confinement ratio is varied. Moreover, the dotted line corresponds to a threshold for viscous confinement stabilisation defined as
$\beta$
are fixed. This axis provides a measure of the change in the spatial extent over which side-wall wetting forces act as the confinement ratio is varied. Moreover, the dotted line corresponds to a threshold for viscous confinement stabilisation defined as
 \begin{equation} \varDelta _{\textit{visc}} = \frac {\textit{Re}_c^{\textit{visc}} - \textit{Re}_c^{\text{1-D}}}{\textit{Re}_c^{\text{1-D}}} \times 100 = 2\,\%, \end{equation}
indicating the boundary at which viscous side-wall confinement effects become negligible to within $2\,\%$
. To the right of this line, the non-wetting flow closely approaches the 1-D stability limit.
$2\,\%$
. To the right of this line, the non-wetting flow closely approaches the 1-D stability limit.
To the left of the dotted line, viscous boundary layers at the side walls play an important stabilising role. In this region, wetting acts to weaken this stabilisation effect, leading to a relative destabilisation at moderate wavenumbers. The magnitude of this destabilisation decreases as confinement is relaxed. At the same time, the influence of wetting on long-wave perturbations remains comparatively weak.
As the confinement ratio increases, the stabilising influence of the viscous boundary layer is diminished and the wetting-induced destabilisation at moderate wavenumbers fades. At the same time, despite the fact that the local strength of the side-wall wetting decreases as $W{\kern-2pt}/{\kern-0.25pt}l_c$
increases, capillary effects are able to act over an increasingly wide spanwise region. Consequently, wetting emerges as a dominant mechanism controlling long-wave instability, leading to the pronounced stabilisation at small wavenumbers. Subsequently, this stabilisation weakens as the confinement ratio is increased further. For sufficiently large confinement ratio (
$W{\kern-2pt}/{\kern-0.25pt}l_c$
increases, capillary effects are able to act over an increasingly wide spanwise region. Consequently, wetting emerges as a dominant mechanism controlling long-wave instability, leading to the pronounced stabilisation at small wavenumbers. Subsequently, this stabilisation weakens as the confinement ratio is increased further. For sufficiently large confinement ratio ( $W/H \gtrsim 190$
), the flow approaches the 1-D limit, and both viscous confinement and wetting effects are diminished, consistent with the absence of any side-wall influence in the unconfined channel limit.
$W/H \gtrsim 190$
), the flow approaches the 1-D limit, and both viscous confinement and wetting effects are diminished, consistent with the absence of any side-wall influence in the unconfined channel limit.
Overall, the phase diagram demonstrates that side-wall wetting plays two distinct and competing roles depending on the confinement level. In confined channels, wetting counteracts the stabilising influence of the side-wall viscous boundary layer at moderate wavenumbers and therefore acts as a relatively destabilising mechanism. As confinement is relaxed and viscous stabilisation becomes negligible, wetting acts as a stabilising mechanism for long-wave perturbations and becomes the dominant factor controlling the instability threshold.
3.4. Long-wave instability threshold and confinement scaling
The results of the previous sections indicate that side-wall wetting can significantly increase the long-wave instability threshold even in channels that would traditionally be classified as non-confined based on the geometric confinement ratio $W/H$
. To isolate the underlying mechanism, we investigate the stability of long-wave disturbances
$W/H$
. To isolate the underlying mechanism, we investigate the stability of long-wave disturbances $(k=0.01)$
by computing the critical Reynolds number as a function of the Kapitza number
$(k=0.01)$
by computing the critical Reynolds number as a function of the Kapitza number $\textit{Ka}$
and of the channel width to capillary length ratio
$\textit{Ka}$
and of the channel width to capillary length ratio $(W{\kern-2pt}/{\kern-0.25pt}l_c)$
. In these computations, the geometric confinement ratio
$(W{\kern-2pt}/{\kern-0.25pt}l_c)$
. In these computations, the geometric confinement ratio $W/H$
is held fixed, while the ratio
$W/H$
is held fixed, while the ratio $W{\kern-2pt}/{\kern-0.25pt}l_c$
varies with
$W{\kern-2pt}/{\kern-0.25pt}l_c$
varies with $\textit{Ka}$
through its dependence on fluid properties. This parametrisation isolates the dependence of the instability threshold on
$\textit{Ka}$
through its dependence on fluid properties. This parametrisation isolates the dependence of the instability threshold on $\textit{Ka}$
at a prescribed geometric confinement level.
$\textit{Ka}$
at a prescribed geometric confinement level.
Critical Reynolds number normalised by the classical 1-D critical Reynolds number for different contact angles $\theta$
as a function of (a) the Kapitza number
$\theta$
as a function of (a) the Kapitza number $\textit{Ka}$
and (b) the channel-width-to-capillary-length ratio
$\textit{Ka}$
and (b) the channel-width-to-capillary-length ratio $W{\kern-2pt}/{\kern-0.25pt}l_c$
.
$W{\kern-2pt}/{\kern-0.25pt}l_c$
.

Figure 8(a) shows the normalised critical Reynolds number $\hat {Re}_c = \textit{Re}_c/\textit{Re}_{c_{1D}}$
as a function of
$\hat {Re}_c = \textit{Re}_c/\textit{Re}_{c_{1D}}$
as a function of $\textit{Ka}$
for different contact angles. In the non-wetting limit (
$\textit{Ka}$
for different contact angles. In the non-wetting limit ( $\theta = 90^{\circ }$
),
$\theta = 90^{\circ }$
), $\hat {Re}_c$
is essentially independent of
$\hat {Re}_c$
is essentially independent of $\textit{Ka}$
and matches the classical 1-D prediction. This confirms that the delay in the instability threshold cannot be attributed to surface tension effects in the bulk alone, but requires side-wall wetting effects, consistent with the physical mechanism proposed in the experiments. In contrast, when wetting is present (
$\textit{Ka}$
and matches the classical 1-D prediction. This confirms that the delay in the instability threshold cannot be attributed to surface tension effects in the bulk alone, but requires side-wall wetting effects, consistent with the physical mechanism proposed in the experiments. In contrast, when wetting is present ( $\theta \lt 90^{\circ }$
),
$\theta \lt 90^{\circ }$
), $\hat {Re}_c$
increases strongly with
$\hat {Re}_c$
increases strongly with $\textit{Ka}$
, where this effect intensifies as the contact angle decreases, reflecting a progressively stronger stabilising influence of wetting. The observed dependence on
$\textit{Ka}$
, where this effect intensifies as the contact angle decreases, reflecting a progressively stronger stabilising influence of wetting. The observed dependence on $\textit{Ka}$
is therefore a result of a coupling between capillarity and side-wall wetting, rather than from surface tension in the bulk.
$\textit{Ka}$
is therefore a result of a coupling between capillarity and side-wall wetting, rather than from surface tension in the bulk.
Furthermore, figure 8(b) shows the variation of $\hat {Re}_c$
with
$\hat {Re}_c$
with $W{\kern-2pt}/{\kern-0.25pt}l_c$
. For large
$W{\kern-2pt}/{\kern-0.25pt}l_c$
. For large $W{\kern-2pt}/{\kern-0.25pt}l_c$
, the instability threshold approaches the 1-D value
$W{\kern-2pt}/{\kern-0.25pt}l_c$
, the instability threshold approaches the 1-D value $\textit{Re}_{c_{1D}}$
, indicating that the influence of side walls becomes negligible as the capillary length becomes small compared with the channel width. As
$\textit{Re}_{c_{1D}}$
, indicating that the influence of side walls becomes negligible as the capillary length becomes small compared with the channel width. As $W{\kern-2pt}/{\kern-0.25pt}l_c$
decreases, the instability threshold increases rapidly, with a stronger rise for smaller contact angles. The grey-shaded region indicates
$W{\kern-2pt}/{\kern-0.25pt}l_c$
decreases, the instability threshold increases rapidly, with a stronger rise for smaller contact angles. The grey-shaded region indicates $W{\kern-2pt}/{\kern-0.25pt}l_c \lt 10$
, corresponding to a regime in which the capillary elevations from the two side walls overlap and the entire spanwise direction is reshaped by capillarity; this regime is outside the scope of this study. We therefore restrict our analysis to
$W{\kern-2pt}/{\kern-0.25pt}l_c \lt 10$
, corresponding to a regime in which the capillary elevations from the two side walls overlap and the entire spanwise direction is reshaped by capillarity; this regime is outside the scope of this study. We therefore restrict our analysis to $W{\kern-2pt}/{\kern-0.25pt}l_c \ge 10$
, where the central part of the film remains close to the 1-D Nusselt solution (Nusselt Reference Nusselt1916). The rapid rise in
$W{\kern-2pt}/{\kern-0.25pt}l_c \ge 10$
, where the central part of the film remains close to the 1-D Nusselt solution (Nusselt Reference Nusselt1916). The rapid rise in $\hat {Re}_c$
indicates the onset of a strong stabilisation, rather than a true singular limit as
$\hat {Re}_c$
indicates the onset of a strong stabilisation, rather than a true singular limit as $W{\kern-2pt}/{\kern-0.25pt}l_c \to 10$
.
$W{\kern-2pt}/{\kern-0.25pt}l_c \to 10$
.
3.5. Comparison with experimental measurements
In this section, we assess the quantitative consistency of our theoretical stability predictions with the experimental measurements of Georgantaki et al. (Reference Georgantaki, Vatteville, Vlachogiannis and Bontozoglou2011). In those experiments, the influence of side-wall wetting on the long-wave instability was investigated by measuring the shift of the instability threshold as the Kapitza number increases for a fixed channel width, using aqueous solutions of glycerol. It was shown that the critical Reynolds number increases significantly with $\textit{Ka}$
and, at sufficiently large
$\textit{Ka}$
and, at sufficiently large $\textit{Ka}$
, reaches a plateau whose value depends on the channel width. This plateau value was shown to be correlated with the channel width to capillary length ratio
$\textit{Ka}$
, reaches a plateau whose value depends on the channel width. This plateau value was shown to be correlated with the channel width to capillary length ratio $W{\kern-2pt}/{\kern-0.25pt}l_c$
through the relation
$W{\kern-2pt}/{\kern-0.25pt}l_c$
through the relation $\textit{Re}_c/\textit{Re}_{c_{1D}} = 1 + 125/ (W{\kern-2pt}/{\kern-0.25pt}l_c)$
.
$\textit{Re}_c/\textit{Re}_{c_{1D}} = 1 + 125/ (W{\kern-2pt}/{\kern-0.25pt}l_c)$
.
In the experiments, $\textit{Ka}$
is varied primarily through changes in viscosity. Over the range of mixtures considered, density and surface tension vary significantly less than viscosity, so the capillary length defined in (2.6), and hence
$\textit{Ka}$
is varied primarily through changes in viscosity. Over the range of mixtures considered, density and surface tension vary significantly less than viscosity, so the capillary length defined in (2.6), and hence $W{\kern-2pt}/{\kern-0.25pt}l_c$
, varies weakly for a fixed channel width. To approximate this experimental configuration, we fix
$W{\kern-2pt}/{\kern-0.25pt}l_c$
, varies weakly for a fixed channel width. To approximate this experimental configuration, we fix $W{\kern-2pt}/{\kern-0.25pt}l_c$
at the value inferred from the reported high-
$W{\kern-2pt}/{\kern-0.25pt}l_c$
at the value inferred from the reported high- $\textit{Ka}$
plateau via the above-mentioned correlation. Under this constraint, the film thickness
$\textit{Ka}$
plateau via the above-mentioned correlation. Under this constraint, the film thickness $H$
, and hence the ratio
$H$
, and hence the ratio $W/H$
, is not imposed independently; instead, it follows from the scaling relation in (3.2), once
$W/H$
, is not imposed independently; instead, it follows from the scaling relation in (3.2), once $\textit{Ka}$
and neutral
$\textit{Ka}$
and neutral $\textit{Re}$
are determined.
$\textit{Re}$
are determined.
The static contact angle of the aqueous solutions on Plexiglas (PMMA) side walls is not reported by Georgantaki et al. (Reference Georgantaki, Vatteville, Vlachogiannis and Bontozoglou2011). We therefore compare the experimental measurements against an envelope of theoretical predictions obtained by varying the static contact angle over a representative partially wetting range. Reported contact angles of water and glycerol on PMMA typically lie in the range $65^{\circ } {-} 75^{\circ }$
(Abdel-Fattah Reference Abdel-Fattah2019). We therefore consider an interval of
$65^{\circ } {-} 75^{\circ }$
(Abdel-Fattah Reference Abdel-Fattah2019). We therefore consider an interval of $[60^{\circ }{-} 80^{\circ }]$
to account for uncertainties resulting from surface preparation and mixture compositions.
$[60^{\circ }{-} 80^{\circ }]$
to account for uncertainties resulting from surface preparation and mixture compositions.
Figure 9 compares the theoretical predictions with the experimental measurements for the $W=100\, \text{mm}$
channel, for which the plateau correlation yields
$W=100\, \text{mm}$
channel, for which the plateau correlation yields $W{\kern-2pt}/{\kern-0.25pt}l_c \approx 30$
. The calculations are performed at a wavenumber
$W{\kern-2pt}/{\kern-0.25pt}l_c \approx 30$
. The calculations are performed at a wavenumber $k=0.01$
and inclination angle
$k=0.01$
and inclination angle $\beta =10^{\circ }$
. The resulting geometric confinement ratio satisfies
$\beta =10^{\circ }$
. The resulting geometric confinement ratio satisfies $W/H\gt 100$
, consistent with the experimental regime. The theoretical predictions reproduce the experimentally observed monotonic increase of the critical Reynolds number with
$W/H\gt 100$
, consistent with the experimental regime. The theoretical predictions reproduce the experimentally observed monotonic increase of the critical Reynolds number with $\textit{Ka}$
, as well as the saturation at larger values. The experimental data fall within the theoretical envelope over the measured
$\textit{Ka}$
, as well as the saturation at larger values. The experimental data fall within the theoretical envelope over the measured $\textit{Ka}$
range. Overall, the agreement provides quantitative support for the present theoretical framework and its interpretation of the wetting-induced mechanisms presented in the previous sections.
$\textit{Ka}$
range. Overall, the agreement provides quantitative support for the present theoretical framework and its interpretation of the wetting-induced mechanisms presented in the previous sections.
3.6. Perturbation mode shape
To gain a deeper insight into how wetting weakens the confinement-induced stabilisation in confined channels, or stabilises the long-wave perturbations in weakly confined channels, we examine the eigenmode amplitude fields for two representative cases. Figure 10 shows the interface perturbation amplitude $\hat {h}(z)$
and the velocity perturbation amplitudes
$\hat {h}(z)$
and the velocity perturbation amplitudes $\hat {u},\hat {v},\hat {w}$
for a relatively destabilising short-wave mode in a confined channel (panel a,
$\hat {u},\hat {v},\hat {w}$
for a relatively destabilising short-wave mode in a confined channel (panel a, $W/H=20$
), and a stabilising effect on a long-wave perturbation in a weakly confined channel (panel b,
$W/H=20$
), and a stabilising effect on a long-wave perturbation in a weakly confined channel (panel b, $W/H=100$
).
$W/H=100$
).
Comparison between theoretical predictions and experimental measurements of the normalised critical Reynolds number as a function of the Kapitza number for the channel $W=100$
mm of Georgantaki et al. (Reference Georgantaki, Vatteville, Vlachogiannis and Bontozoglou2011).
$W=100$
mm of Georgantaki et al. (Reference Georgantaki, Vatteville, Vlachogiannis and Bontozoglou2011).

Perturbation eigenmode structures: (a) relatively destabilising case ( $k=0.4$
,
$k=0.4$
, $\theta = 80^{\circ }$
,
$\theta = 80^{\circ }$
, $\textit{Ca}=0.2$
); (b) stabilising case (
$\textit{Ca}=0.2$
); (b) stabilising case ( $k=0.01$
,
$k=0.01$
, $\theta = 45^{\circ }$
,
$\theta = 45^{\circ }$
, $\textit{Ca} = 0.02$
). Panels show the real part of the phase-aligned eigenfields
$\textit{Ca} = 0.02$
). Panels show the real part of the phase-aligned eigenfields $\hat {h}(z),\hat {u},\hat {v},\hat {w}$
. For each mode (column), all fields are scaled by the factor
$\hat {h}(z),\hat {u},\hat {v},\hat {w}$
. For each mode (column), all fields are scaled by the factor $\max |\hat {h}|$
so that the colour scale is consistent.
$\max |\hat {h}|$
so that the colour scale is consistent.

In the relatively destabilising case in confined channels (panel a), the interface perturbation $\hat {h}$
peaks at the centre, but decays towards the side walls with steep lateral gradients and without a notable flattening at the boundaries, indicating a weaker pinning effect caused by wetting. More importantly, both
$\hat {h}$
peaks at the centre, but decays towards the side walls with steep lateral gradients and without a notable flattening at the boundaries, indicating a weaker pinning effect caused by wetting. More importantly, both $\hat {u}$
and
$\hat {u}$
and $\hat {w}$
develop intense structures within the meniscus region, indicating that the disturbance is strongly influenced by the near-wall region.
$\hat {w}$
develop intense structures within the meniscus region, indicating that the disturbance is strongly influenced by the near-wall region.
In contrast, for the stabilising case (panel b), the interface perturbation remains at a maximum at the channel centre, but approaches smaller values near the side walls, consistent with a stronger wall-anchoring of the disturbance shape. The velocity perturbations are predominantly organised away from the meniscus region. The streamwise component $\hat {u}$
is mainly concentrated in the core,
$\hat {u}$
is mainly concentrated in the core, $\hat {v}$
shows relatively small fields near the boundaries and
$\hat {v}$
shows relatively small fields near the boundaries and $\hat {w}$
forms a pair of counter-rotating cells that fill most of the span, with their centre located outside the meniscus region.
$\hat {w}$
forms a pair of counter-rotating cells that fill most of the span, with their centre located outside the meniscus region.
Overall, wall-anchoring of the interface together with span-filling secondary-flow structures correlates with a stabilising influence of wetting, while the absence of interface anchoring and the presence of vortical structures in the meniscus region correlate with a relatively destabilising effect. Furthermore, these modal structures relate directly to the experimental observations of Georgantaki et al. (Reference Georgantaki, Vatteville, Vlachogiannis and Bontozoglou2011), who inferred the existence of a recirculating motion in the streamwise-spanwise plane where liquid is transported from the channel centre towards the side walls along the wave crest and returns from the side walls towards the centre at a different streamwise phase. The spanwise vortices associated with the eigenmodes in figure 10 represent the onset of this secondary motion and the corresponding spanwise redistribution of liquid, driven by lateral variations of film thickness and interface curvature between the channel centre and lateral menisci.
4. Conclusions
In this work, we investigate the effect of side-wall wetting on the linear stability of gravity-driven liquid films confined in the spanwise direction. In such a configuration, the interplay among the classical hydrodynamic instability, spanwise confinement and capillarity associated with side-wall wetting has remained largely unexplored. We develop a biglobal stability framework based on the linearised Navier–Stokes equations, regularised by a Navier slip condition at the side walls to resolve the moving contact line singularity. The base state solution is obtained by mapping the curved physical domain onto a rectangular computational grid, and the resulting meniscus shape and near-wall velocity overshoot are verified against the experiments of Haas et al. (Reference Haas, Pollak and Aksel2011).
We consider two limiting regimes. In confined channels ( $W/H=20$
), spanwise confinement alone provides a significant stabilising influence at moderate wavenumbers. When side-wall wetting is introduced, the computed
$W/H=20$
), spanwise confinement alone provides a significant stabilising influence at moderate wavenumbers. When side-wall wetting is introduced, the computed $ \textit{Re}{-}k$
stability contours reveal that wetting substantially reduces the confinement-induced stabilisation effect, and in some cases, can nearly cancel it. Therefore, wetting plays a relatively destabilising role with respect to the non-wetting confined case. Analysis of the associated base state shows that this behaviour is linked to a streamwise velocity overshoot region near the side walls, which weakens the effective viscous damping provided by the side-wall boundary layer.
$ \textit{Re}{-}k$
stability contours reveal that wetting substantially reduces the confinement-induced stabilisation effect, and in some cases, can nearly cancel it. Therefore, wetting plays a relatively destabilising role with respect to the non-wetting confined case. Analysis of the associated base state shows that this behaviour is linked to a streamwise velocity overshoot region near the side walls, which weakens the effective viscous damping provided by the side-wall boundary layer.
In contrast, in weakly confined channels ( $W/H=100$
), spanwise confinement plays no significant role in the absence of wetting and the classical 1-D stability behaviour is recovered. When wetting is introduced,
$W/H=100$
), spanwise confinement plays no significant role in the absence of wetting and the classical 1-D stability behaviour is recovered. When wetting is introduced, $ \textit{Re}{-}k$
stability contours show little change at moderate wavenumbers, but have a pronounced effect on long-wave perturbations
$ \textit{Re}{-}k$
stability contours show little change at moderate wavenumbers, but have a pronounced effect on long-wave perturbations $k \rightarrow 0$
. The instability threshold is shifted to higher Reynolds numbers, with the onset increasing to larger
$k \rightarrow 0$
. The instability threshold is shifted to higher Reynolds numbers, with the onset increasing to larger $\textit{Re}$
as wetting becomes stronger.
$\textit{Re}$
as wetting becomes stronger.
A phase diagram quantifying the wetting-induced modification of the instability neutral curves shows that the cross-over from the relative destabilisation to long-wave stabilisation occurs smoothly over a finite range of $W/H$
, rather than a sudden regime switch. Moreover, we provide a quantitative comparison with the experimental measurements of Georgantaki et al. (Reference Georgantaki, Vatteville, Vlachogiannis and Bontozoglou2011) based on the critical Reynolds number of long-wave perturbations. The experimental data fall within a physically consistent envelope of theoretical predictions, and show similar trends and comparable magnitudes within the accessible parameter range.
$W/H$
, rather than a sudden regime switch. Moreover, we provide a quantitative comparison with the experimental measurements of Georgantaki et al. (Reference Georgantaki, Vatteville, Vlachogiannis and Bontozoglou2011) based on the critical Reynolds number of long-wave perturbations. The experimental data fall within a physically consistent envelope of theoretical predictions, and show similar trends and comparable magnitudes within the accessible parameter range.
Furthermore, the mechanisms behind the distinct relative destabilisation and stabilisation effects are clarified by examining the perturbation eigenmode structures. In confined channels, wetting introduces vortical structures that are localised in the meniscus region, associated with streamwise velocity overshoot, which weaken the confinement-induced stabilisation. In contrast, in weakly confined channels, the velocity perturbations remain concentrated in the centre of the channel, while the interface perturbation exhibits strong anchoring at the side walls, consistent with a net stabilisation driven by interface ‘tensioning’ due to wetting.
5. Future work
A nonlinear stability analysis constitutes a natural continuation of this study, as it would capture the finite-amplitude dynamics of the moving contact line and the nonlinear interaction between different unstable modes. In particular, nonlinear contact line dynamics may introduce additional dissipation or coupling effects that are not captured within the present linear framework. Such an analysis would provide a more comprehensive understanding of the influence of wetting beyond the onset of the instability.
Another promising direction concerns the interaction of wetting with thermal instabilities. Thermocapillary (Mohamed & Biancofiore Reference Mohamed and Biancofiore2024) and vapour instabilities (Mohamed & Biancofiore Reference Mohamed and Biancofiore2020) exhibit inherently three-dimensional structures with significant spanwise modulation. It would therefore be valuable to investigate how these modes interact with side-wall wetting and geometric confinement within a similar biglobal framework.
The present study is restricted to wetting conditions with contact angles $\theta \le 90^\circ$
, for which capillary elevation near the side walls leads to local thickening of the film. A further extension concerns conditions with
$\theta \le 90^\circ$
, for which capillary elevation near the side walls leads to local thickening of the film. A further extension concerns conditions with $\theta \gt 90^\circ$
, where the wetting behaviour is reversed and capillary depression leads to a local decrease in the film thickness near the side walls. This modification of the base state structure is expected to affect the stability characteristics. A systematic investigation of this regime remains to be carried out.
$\theta \gt 90^\circ$
, where the wetting behaviour is reversed and capillary depression leads to a local decrease in the film thickness near the side walls. This modification of the base state structure is expected to affect the stability characteristics. A systematic investigation of this regime remains to be carried out.
Declaration of interests
The authors report no conflict of interest.
Appendix A. Coordinate transformation
The physical domain in this work is not rectangular due to the presence of the curved meniscus at the side walls. Therefore, the physical domain with coordinates bounded as ( $y \in [0, \bar {h}(z)]$
,
$y \in [0, \bar {h}(z)]$
, $z \in [-W,W]$
) is mapped into the Chebyshev domain (
$z \in [-W,W]$
) is mapped into the Chebyshev domain ( $y_c \in [-1,1]$
and
$y_c \in [-1,1]$
and $z_c \in [-1,1]$
) using the following transformations:
$z_c \in [-1,1]$
) using the following transformations:
 \begin{align} & z = W z_c, \end{align}
 \begin{align} & y = \frac {\bar {h}(z)}{2} (y_c + 1),\\[7pt]\nonumber \end{align}
where $\bar {h}(z)$
is the base state interface shape defining the top boundary of the domain. For an arbitrary function
$\bar {h}(z)$
is the base state interface shape defining the top boundary of the domain. For an arbitrary function $\phi (z,y)$
, the partial derivative in the physical domain can be related to the partial derivatives in the computational domain using the following transformations (Anderson Reference Anderson1995):
$\phi (z,y)$
, the partial derivative in the physical domain can be related to the partial derivatives in the computational domain using the following transformations (Anderson Reference Anderson1995):
 \begin{align} \frac {\partial \phi }{\partial y} & = \frac {\partial y_c}{ \partial y} \frac {\partial \phi }{\partial y_c}, \end{align}
 \begin{align} \frac {\partial \phi }{\partial z} & = \frac {\partial z_c}{\partial z} \frac {\partial \phi }{\partial z_c} + \frac {\partial y_c}{\partial z} \frac {\partial \phi }{\partial y_c}, \end{align}
 \begin{align} \frac {\partial ^2 \phi }{\partial y^2} & = \Big (\frac {\partial y_c}{\partial y}\Big )^2 \frac {\partial ^2 \phi }{\partial y_c^2}, \end{align}
 \begin{align} \frac {\partial ^2 \phi }{\partial z^2} & = \Big (\frac {\partial z_c}{\partial z}\Big )^2 \frac {\partial ^2 \phi }{\partial z_c^2} + 2\,\frac {\partial z_c}{\partial z}\frac {\partial y_c}{\partial z} \frac {\partial ^2 \phi }{\partial z_c \partial y_c} + \Big (\frac {\partial y_c}{\partial z}\Big )^2 \frac {\partial ^2 \phi }{\partial y_c^2} + \frac {\partial ^2 y_c}{\partial z^2}\frac {\partial \phi }{\partial y_c} + \frac {\partial ^2 z_c}{\partial z^2}\frac {\partial \phi }{\partial z_c} ,\end{align}
 \begin{align} \frac {\partial ^2 \phi }{\partial z \partial y} & = \frac {\partial ^2 y_c}{\partial z \partial y} \frac {\partial \phi }{\partial y_c} + \frac {\partial y_c}{\partial z} \frac {\partial y_c}{\partial y} \frac {\partial ^2 \phi }{\partial y_c^2} + \frac {\partial z_c}{\partial z} \frac {\partial y_c}{\partial y} \frac {\partial ^2 \phi }{\partial z_c \partial y_c},\\[9pt]\nonumber \end{align}
where the following expressions define the derivatives of the computational coordinates with respect to the physical coordinates:
 \begin{align} \frac {\partial z_c}{\partial z} & = \frac {1}{W}, \quad\quad\quad\quad\quad\,\,\,\frac {\partial y_c}{\partial y} = \frac {2}{\bar {h}(z)}, &\frac {\partial y_c}{\partial z} = \frac {-2 y}{\bar {h}^2} \frac {{\rm d}\bar {h}}{{\rm d}z}, \end{align}
 \begin{align} \frac {\partial ^2 y_c}{\partial z^2} & = \frac {4 y}{\bar {h}^3} \Big ( \frac {{\rm d}\bar {h}}{{\rm d}z} \Big )^2 - \frac {2y}{\bar {h}^2} \frac {{\rm d}^2 \bar {h}}{{\rm d}z^2}, &\frac {\partial ^2 y_c}{\partial z \partial y} = \frac {-2}{\bar {h}^2} \frac {{\rm d} \bar {h}}{{\rm d}z}.\\[10pt]\nonumber \end{align}
Appendix B. Grid convergence and slip-length sensitivity
The relation between the slip length $l_s$
and the spatial resolution is a key numerical consideration. When the slip length is sufficiently larger than the smallest grid spacing, its effect on the solution is properly resolved, whereas when it is smaller than the grid spacing, the solution becomes numerically indistinguishable from the no-slip limit.
$l_s$
and the spatial resolution is a key numerical consideration. When the slip length is sufficiently larger than the smallest grid spacing, its effect on the solution is properly resolved, whereas when it is smaller than the grid spacing, the solution becomes numerically indistinguishable from the no-slip limit.
We first assess the grid convergence for a fixed non-dimensional slip length $l_s = 10^{-2}$
, which is the value used throughout the manuscript. The convergence test is performed for a representative and numerically demanding configuration in which confinement and wetting effects are particularly strong, namely
$l_s = 10^{-2}$
, which is the value used throughout the manuscript. The convergence test is performed for a representative and numerically demanding configuration in which confinement and wetting effects are particularly strong, namely $W/H=20$
,
$W/H=20$
, $W{\kern-2pt}/{\kern-0.25pt}l_c=10$
and
$W{\kern-2pt}/{\kern-0.25pt}l_c=10$
and $\theta =15^{\circ }$
. Figure 11 compares the growth rate curves obtained using several grid resolutions in the spanwise direction. The results show that further grid refinement leads to negligible changes in the growth rate curves and dominant eigenvalues, demonstrating convergence with respect to spatial resolution. The finest grid shown (
$\theta =15^{\circ }$
. Figure 11 compares the growth rate curves obtained using several grid resolutions in the spanwise direction. The results show that further grid refinement leads to negligible changes in the growth rate curves and dominant eigenvalues, demonstrating convergence with respect to spatial resolution. The finest grid shown ( $n_z = 220$
) yields a minimum grid spacing near the side walls of
$n_z = 220$
) yields a minimum grid spacing near the side walls of $\Delta z_{min} = 1 \times 10^{-3}$
, which is smaller than the chosen slip length, ensuring that the slip boundary condition is well resolved. Unless otherwise stated, this resolution is chosen in the remainder of the study.
$\Delta z_{min} = 1 \times 10^{-3}$
, which is smaller than the chosen slip length, ensuring that the slip boundary condition is well resolved. Unless otherwise stated, this resolution is chosen in the remainder of the study.
Grid convergence of the temporal growth rate for a confined channel with strong wetting ( $W/H=20$
,
$W/H=20$
, $W{\kern-2pt}/{\kern-0.25pt}l_c=10$
,
$W{\kern-2pt}/{\kern-0.25pt}l_c=10$
, $\theta =15^{\circ }$
,
$\theta =15^{\circ }$
, $\textit{Re} = 50$
and
$\textit{Re} = 50$
and $\beta =10^{\circ }$
). Results are shown for three spanwise resolutions,
$\beta =10^{\circ }$
). Results are shown for three spanwise resolutions, $n_z = 140, 180 \text{ and } 220$
, corresponding to minimum grid spacing
$n_z = 140, 180 \text{ and } 220$
, corresponding to minimum grid spacing $\Delta z_{min} = 2.5 \times 10^{-3}, 1.5 \times 10^{-3} \text{ and } 1 \times 10^{-3}$
, respectively.
$\Delta z_{min} = 2.5 \times 10^{-3}, 1.5 \times 10^{-3} \text{ and } 1 \times 10^{-3}$
, respectively.

Next, we examine the sensitivity of the results with respect to the slip length on the converged grid. Figure 12(a) shows the base state interface velocity at the side walls, normalised by the velocity at the channel centre, as a function of the slip length for both confined and weakly confined channel configurations, with the grid spacing fixed to $\Delta z_{\textit{min}} \approx 10^{-3}$
. For
$\Delta z_{\textit{min}} \approx 10^{-3}$
. For ${l}_s \lesssim 10^{-3}$
, the wall velocity collapses onto the no-slip limit, reflecting the fact that such small slip lengths are under-resolved. As the slip length increases and becomes several times larger than the grid spacing, its influence becomes apparent as the interface velocity increases approximately logarithmically with
${l}_s \lesssim 10^{-3}$
, the wall velocity collapses onto the no-slip limit, reflecting the fact that such small slip lengths are under-resolved. As the slip length increases and becomes several times larger than the grid spacing, its influence becomes apparent as the interface velocity increases approximately logarithmically with $l_s$
. This behaviour is consistent with the classical contact line theory, in which the slip length enters macroscopic predictions through logarithmic dependence (Voinov Reference Voinov1976; Cox Reference Cox1986). Importantly, the base state response to slip length is found to be very similar in confined and weakly confined channel configurations, indicating that the slip length condition has a local effect, rather than a global effect on the whole channel width.
$l_s$
. This behaviour is consistent with the classical contact line theory, in which the slip length enters macroscopic predictions through logarithmic dependence (Voinov Reference Voinov1976; Cox Reference Cox1986). Importantly, the base state response to slip length is found to be very similar in confined and weakly confined channel configurations, indicating that the slip length condition has a local effect, rather than a global effect on the whole channel width.
Effect of slip length on the base state and linear stability. (a) Normalised base-state interface velocity at the side wall as a function of $l_s$
. (b, c) Temporal growth-rate curves for (b) a confined channel (
$l_s$
. (b, c) Temporal growth-rate curves for (b) a confined channel ( $W/H=20$
) and (c) a weakly confined channel (
$W/H=20$
) and (c) a weakly confined channel ( $W/H=100$
) for several slip lengths. Unless otherwise stated,
$W/H=100$
) for several slip lengths. Unless otherwise stated, $\textit{Re}=100$
,
$\textit{Re}=100$
, $W{\kern-2pt}/{\kern-0.25pt}l_c=10$
,
$W{\kern-2pt}/{\kern-0.25pt}l_c=10$
, $\theta =15^\circ$
and
$\theta =15^\circ$
and $\beta =10^\circ$
.
$\beta =10^\circ$
.

Furthermore, figures 12(b) and 12(c) show the corresponding linear stability results for several slip length values. Panel (b) represents the confined channel configuration ( $W/H = 20$
), where the side wall boundary layers play an important role. In this case, changing the slip length, while keeping it sufficiently resolved by the grid, results in a modest shift in the growth rate curves, most noticeably at moderate wavenumbers, reflecting a weakening of the confinement-induced viscous damping. The maximum variation in the growth rate between the smallest and largest slip length remains below
$W/H = 20$
), where the side wall boundary layers play an important role. In this case, changing the slip length, while keeping it sufficiently resolved by the grid, results in a modest shift in the growth rate curves, most noticeably at moderate wavenumbers, reflecting a weakening of the confinement-induced viscous damping. The maximum variation in the growth rate between the smallest and largest slip length remains below $2\,\%$
. Additionally, panel (c) shows the same analysis for a weakly confined channel configuration (
$2\,\%$
. Additionally, panel (c) shows the same analysis for a weakly confined channel configuration ( $W/H = 100$
). In this regime, the growth rates for different slip lengths are indistinguishable on the scale of the figure over the entire wavenumber range, including the small-wavenumber stabilisation band discussed previously in figure 6. This confirms that the stabilisation mechanism at small wavenumbers in weakly confined channels is not affected by near-wall slip regularisation.
$W/H = 100$
). In this regime, the growth rates for different slip lengths are indistinguishable on the scale of the figure over the entire wavenumber range, including the small-wavenumber stabilisation band discussed previously in figure 6. This confirms that the stabilisation mechanism at small wavenumbers in weakly confined channels is not affected by near-wall slip regularisation.
Overall, the aforementioned results demonstrate that linear stability characteristics depend weakly on the slip length once it is sufficiently resolved on the grid. The modest sensitivity observed in the confined configuration does not change the qualitative stability behaviour or the main findings of this study. Consequently, unless otherwise stated, all the results reported in this study are obtained using a minimum grid spacing of $\Delta z_{\textit{min}} \approx 10^{-3}$
and non-dimensional slip length of
$\Delta z_{\textit{min}} \approx 10^{-3}$
and non-dimensional slip length of $l_s=0.01$
.
$l_s=0.01$
.


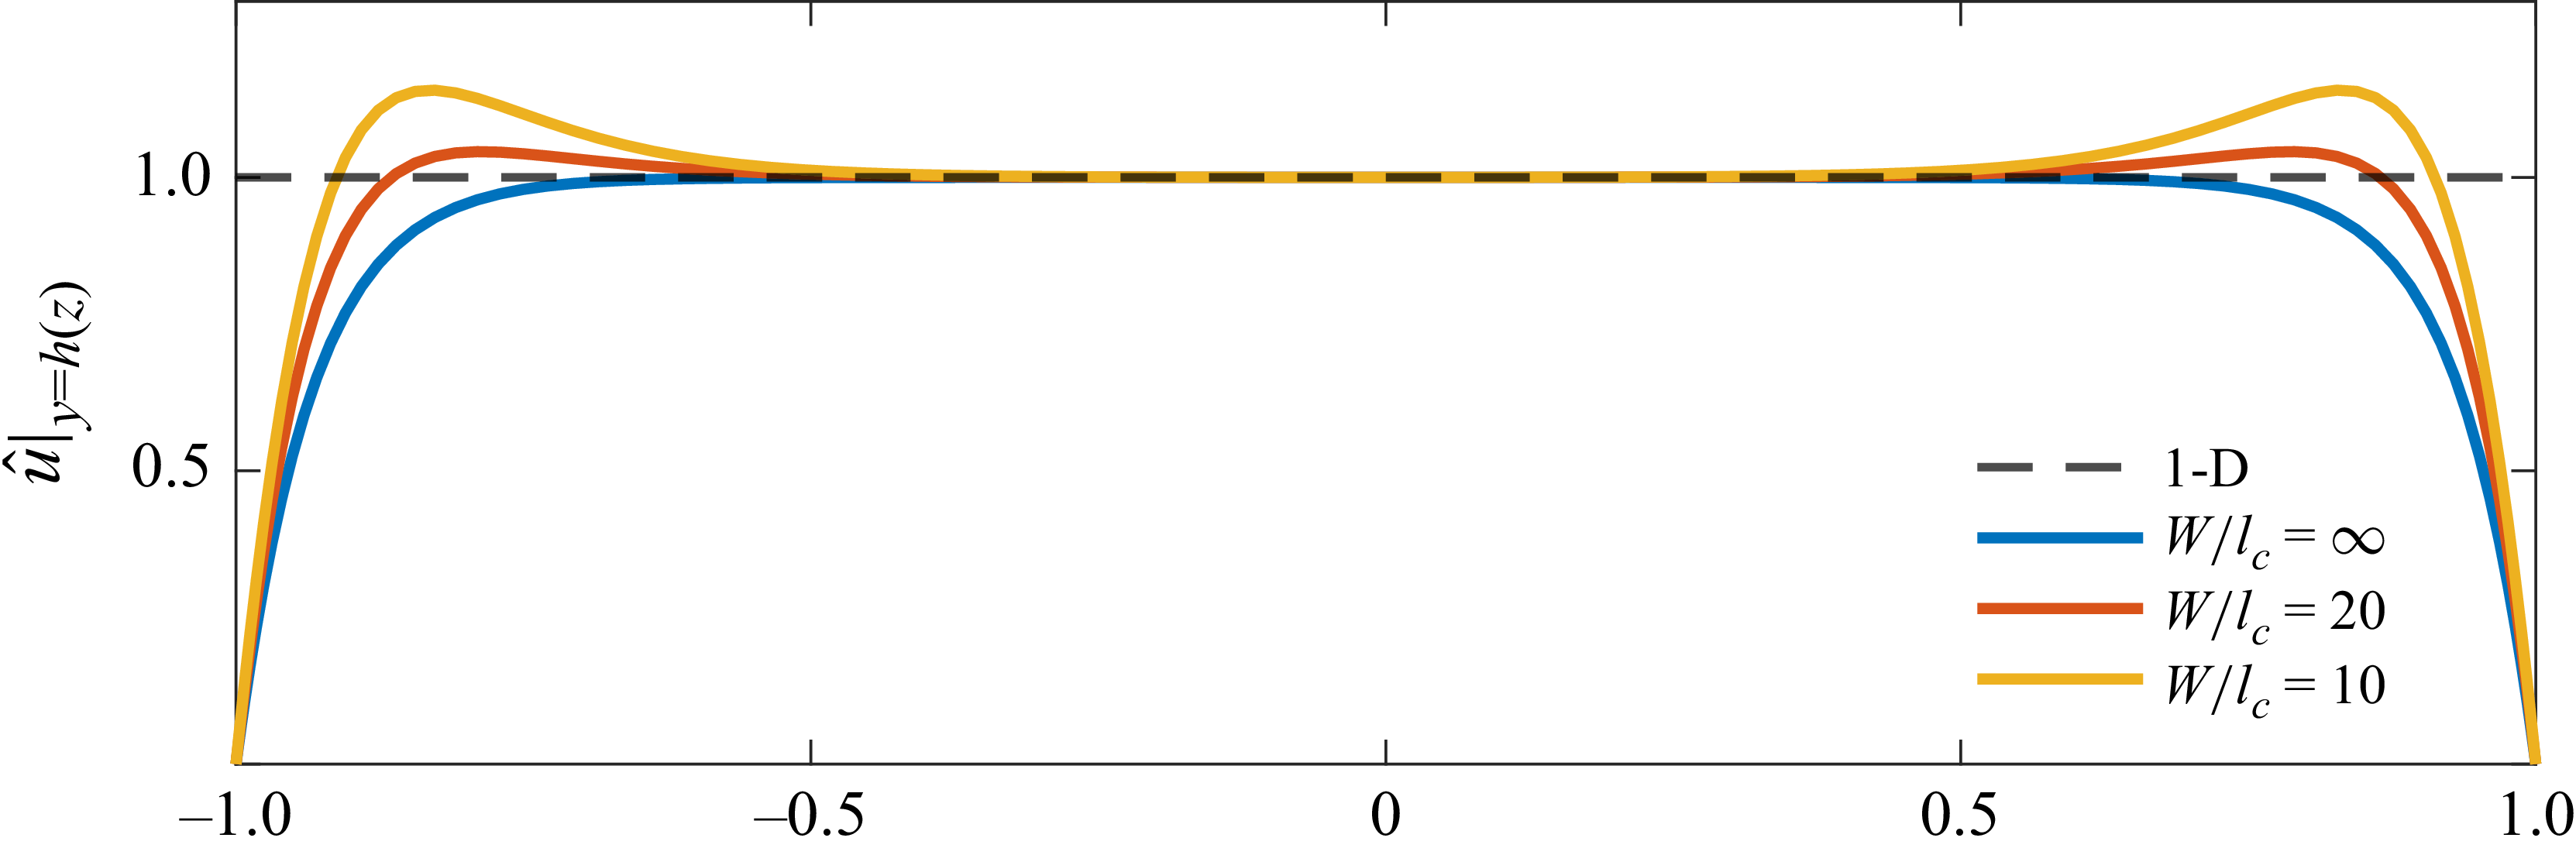


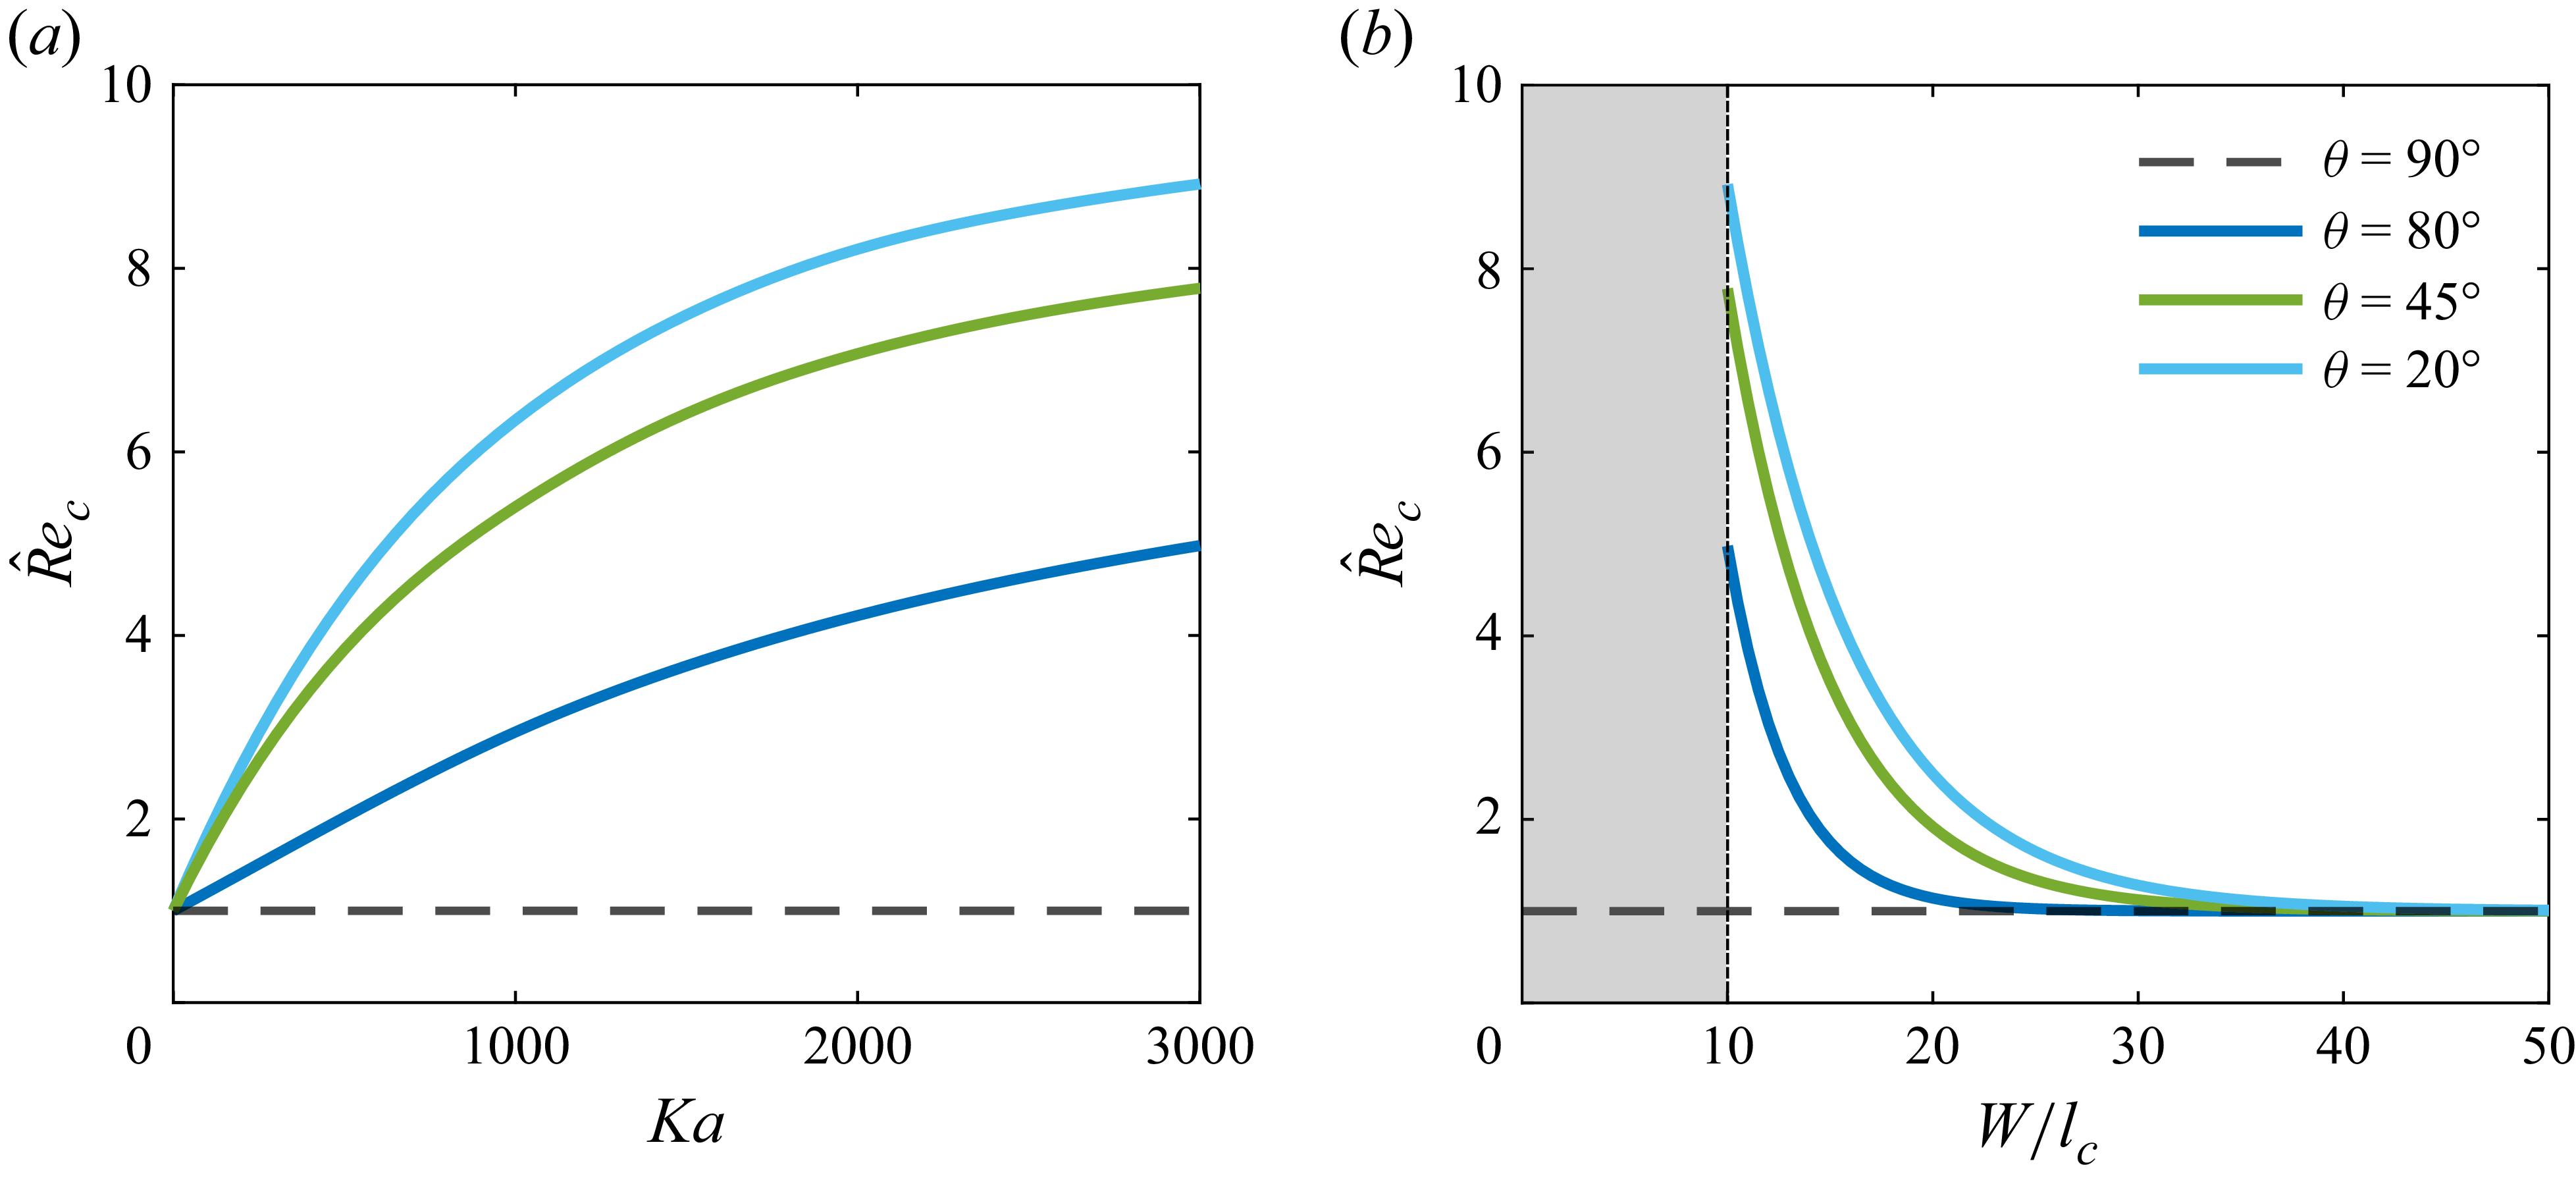


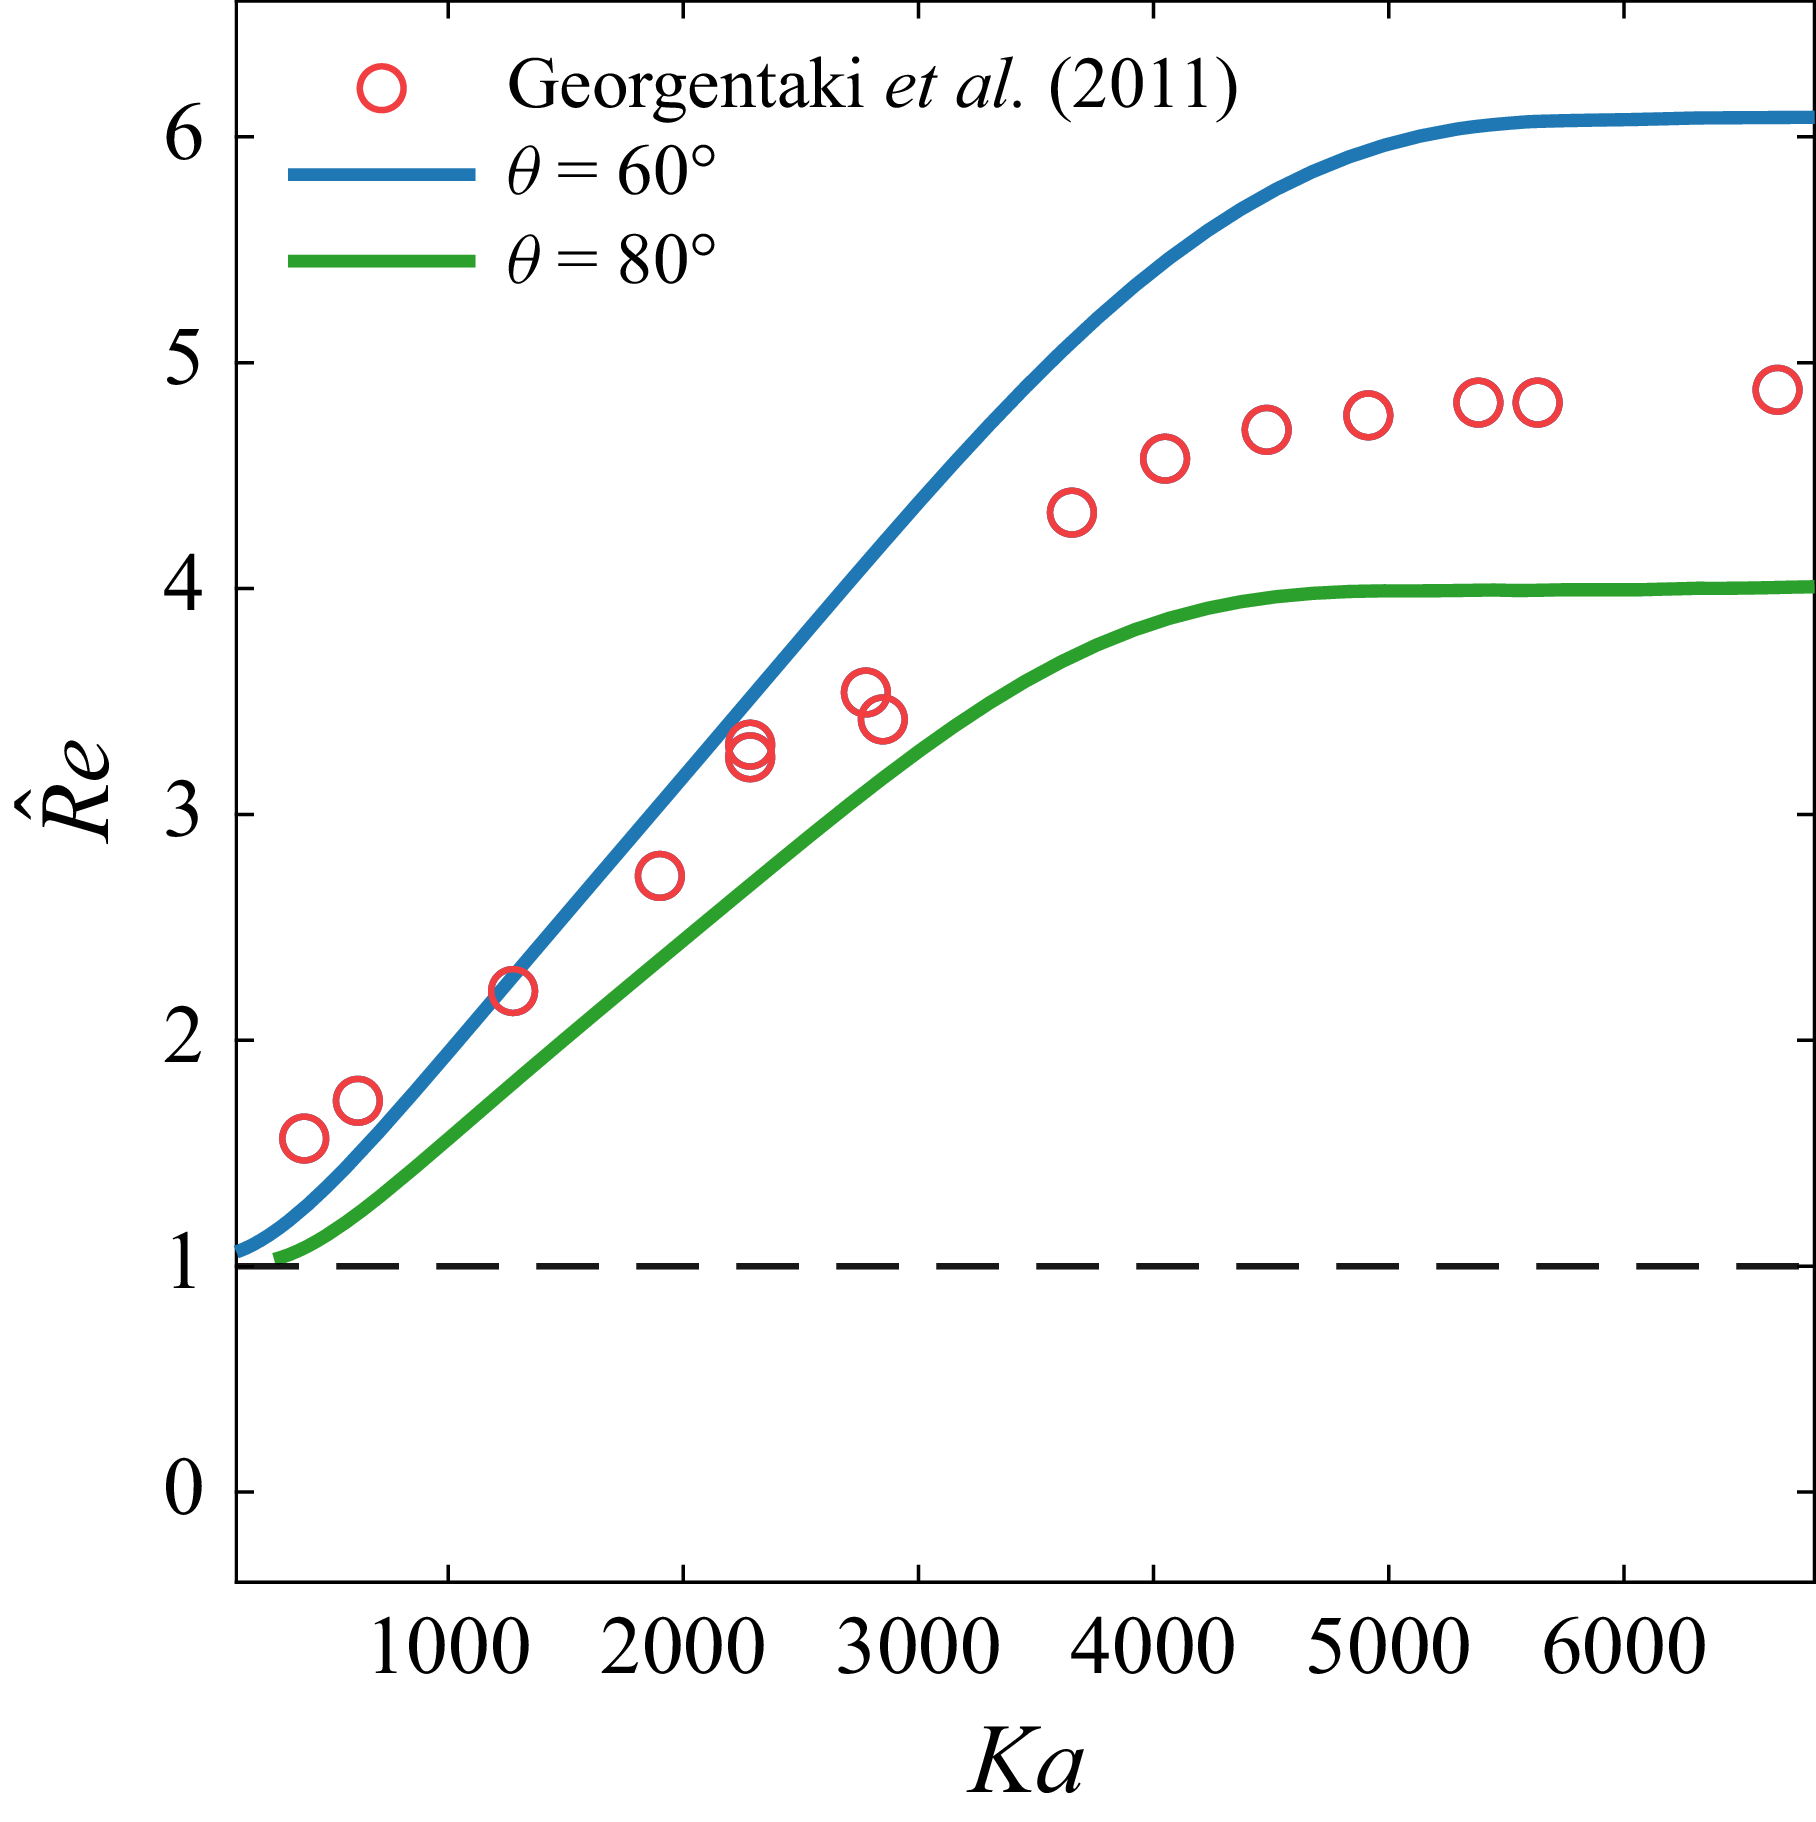


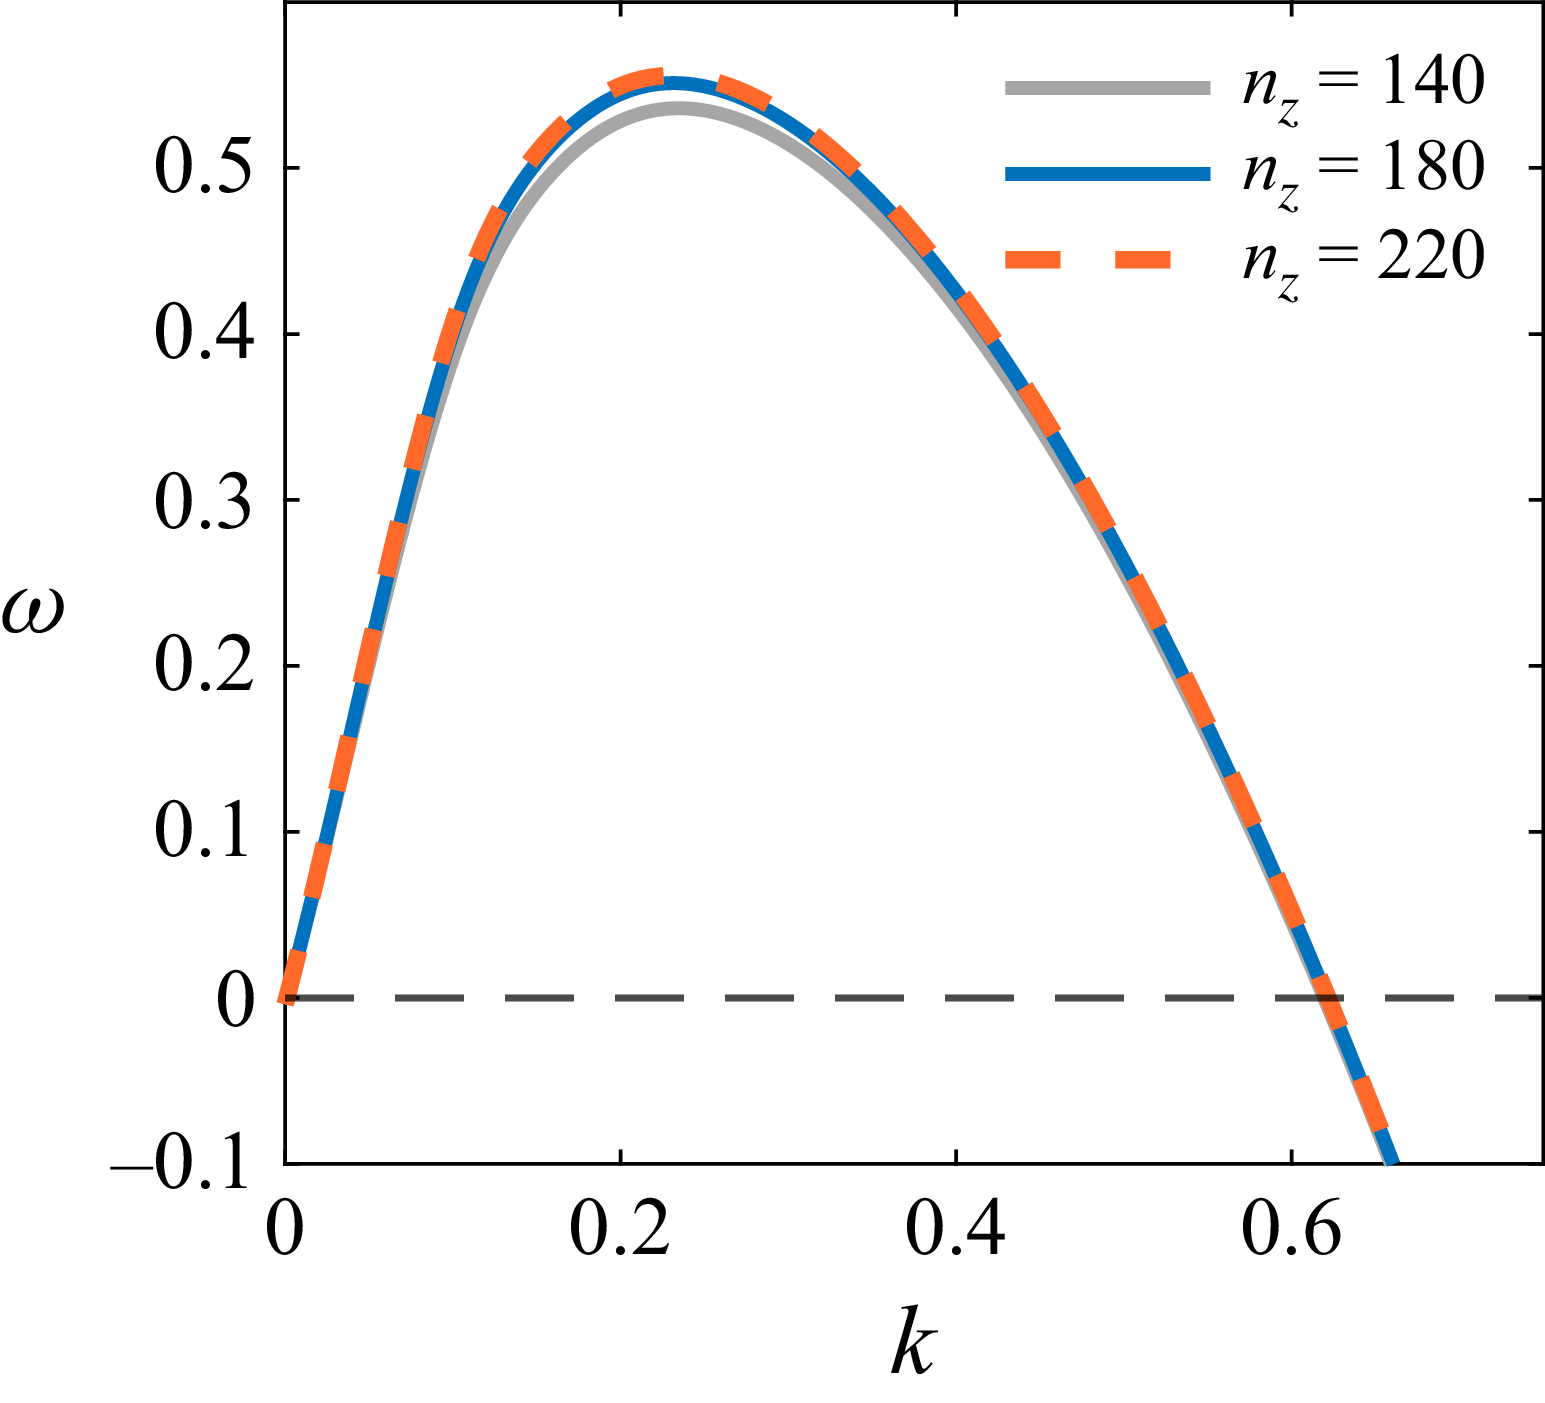


 Open access