

Maternal nutrition or exposure to environmental agents may regulate mammary gland metabolism and alter the epigenome in the offspring, this predisposing them to an increased risk of developing breast cancer(Reference Hilakivi-Clarke and de1). In rodents, a maternal low-protein diet has been associated with alterations in fetal health and low birth weight(Reference McArdle, Andersen and Jones2, Reference Chen, Martin-Gronert and Tarry-Adkins3). Additionally, in humans, both high and low birth weight increased the risk of early-onset breast cancer(Reference Mellemkjaer, Olsen and Sorensen4), and the latter could have potentially resulted from protein restriction during the gestational period. Ozanne et al. (Reference Fernandez-Twinn, Ekizoglou and Gusterson5) have shown that in rats, maternal exposure to a low-protein diet increases mammary tumorigenesis in the offspring. However, poor understanding of the molecular mechanisms of mammary carcinogenesis hinders the further determination of the role of maternal nutrition in cancer prevention. Epigenetic modifications, including cytosine methylation of DNA and post-translational modification of chromosomal structural histones, can change gene function and phenotype without altering the DNA sequence. A low-protein diet has been shown to induce epigenetic modifications that regulate gene expression. Maternal protein restriction elevated cholesterol in adult rat offspring by inducing repressive histone modifications within the promoter of a cholesterol homeostasis-related gene(Reference Sohi, Marchand and Revesz6). A perinatal low-protein diet was shown to affect the methylation and expression of the leptin gene in mouse offspring(Reference Jousse, Parry and Lambert-Langlais7). Additionally, a maternal low-protein diet during the pre-implantation period in rodents induced a transient reduction in maternal serum essential amino acids, which was associated with a reduction in embryo cell numbers and phenotypic differences in adulthood, despite the fact that the offspring were fed a normal diet postnatally(Reference Kwong, Wild and Roberts8).
p21WAF1/Cip1 belongs to the Cip/Kip family of cyclin-dependent kinase inhibitors (including p21Waf1/Cip1, p27Kip1 and p57Kip1). As a potent tumour suppressor gene in mammary gland development, cyclin-dependent kinase inhibitor 1 (p21) is a key factor responsible for tumour suppressor tumour protein 53 (p53)-dependent cell cycle arrest, and may contribute to the regulation of cell proliferation, differentiation and tumorigenesis. p21 has been accepted as a prognostic marker of breast cancer, and the loss of expression of two G1-checkpoint cyclin-dependent kinase (CDK) inhibitors, p21 and p27, has been implicated in the initiation or progression of many human malignancies(Reference Cariou, Donovan and Flanagan9). Given the crucial function of cell cycle control to cancer development, any change in the regulation of a potent cell cycle regulator such as p21 may become a contributing factor for the unrestrained proliferation typically observed in cancer cells. A recent long-term study indicates that p21 knockout mice developed spontaneous tumours at an average age of 16 months, as compared to 20 months for wild-type animals, revealing the importance of p21 in tumour suppression(Reference Martin-Caballero, Flores and Garcia-Palencia10). Additionally, low levels of p21 expression have been identified, both in patients with early- and later-stage breast cancer(Reference van de Vijver, He and van't Veer11–Reference Somlo, Chu and Frankel13).
The contribution of diet to the regulation of the p21 gene is relatively under-studied. A recent publication reported that isoflavone-deprived soya peptide can induce expression of p21 and suppress mammary tumorigenesis in female rats(Reference Park, Choi and Kim12); and increased p21 expression has been reported in the pancreas of maternal low protein-exposed offspring after catch-up growth(Reference Tarry-Adkins, Chen and Smith14). The objective of the present study was to identify whether and how maternal protein restriction regulates the expression of the p21 gene in the mammary gland of offspring through an epigenetic modification-associated mechanism at its transcriptional regulatory regions.
Materials and methods
Animals and treatment
Timed-mated Sprague–Dawley rats (age 75 d, weight 190 g; Charles River Laboratories) were obtained on day 2 of gestation and fed one of two isoenergetic diets, control (C; 180 g/kg casein) or low protein (LP; 90 g/kg casein). The diets were in the form of pre-made pellets, which were adapted according to an established formula (Table 1)(Reference Lillycrop, Phillips and Jackson15). Both groups had free access to food and drinking water. The animals were individually housed in standard polycarbonate cages and were maintained in a temperature- and humidity-controlled colony room on a 12 h light–12 h dark cycle. At 24 h after birth, litter sizes were reduced to six (three female pups and three male pups) to minimise variation in pups' nutritional status during suckling. Pups' body weights were measured weekly. Dams from both dietary treatment groups were switched to the control diet throughout lactation. On postnatal day 24, all pups were weaned from the mother to the control diet. Female pups were killed when they were 38 d old, and the fourth abdominal mammary gland was collected, snap-frozen in liquid N2 and stored at − 70°C. Additionally, other tissues, including pancreas, kidney, liver, brain (hypothalamus), heart, muscle (gastrocnemius), adipose (visceral), colon and blood were also collected from female offspring. Mammary glands of five to six female pups from each dietary treatment group and representing offspring from all dams were randomly chosen for all subsequent experiments. Institutional and national guidelines for the care and use of animals were followed. All experimental procedures involving animals were approved by the International Animal Care and Use Committee at the University of Illinois.
Composition of the two isoenergetic diets
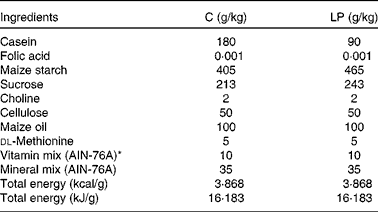
AIN, American Institute of Nutrition.
* Vitamin mix (AIN-76A) is folic acid-free.
RNA isolation and complementary DNA synthesis
Frozen tissue samples from six offspring from each group were individually ground using a mortar and pestle in liquid N2 (around 100 mg of mammary tissue per animal), and total RNA was isolated from each sample with TRI reagent (Sigma). Following isopropanol (Fisher Scientific) precipitation, RNA was re-suspended and quantified by spectrophotometry (Bio-Rad Smart Spec Plus; Bio-Rad Laboratories, Inc.). A high-capacity complementary DNA Reverse Transcription Kit (Applied Biosystems) was used for reverse transcription of 2 μg of total RNA. All samples were reverse-transcribed at the same time using a master mix; and a template tube without RNA was used as the negative control. The entire procedure was performed in a DNA 2720 Thermal Cycler (Applied Biosystems). The samples, in a 20 μl reaction volume, were heated at 37°C for 2 h for reverse transcription, then heated to 85°C for 5 s to inactive RT and terminate the reaction. The final 20 μl of complementary DNA was diluted to 400 μl by nuclease-free water and stored at − 20°C.
Real-time quantitative RT-PCR
In order to measure the relative amount of mRNA, complementary DNA samples were loaded in duplicate into a ninety-six-well plate and analysed using the 7300 Real-Time PCR Systems (Applied Biosystems) and SYBR Green Supermix (Bio-Rad) with ROX, a passive reference dye. The reaction was activated at 95°C for 10 min, followed by thirty-five cycles of 95°C for 15 s and 60°C for 1 min. Complementary DNA from all samples was mixed and serially diluted, 2-fold, in nuclease-free water. The serial dilution was used as a real-time PCR standard included for each gene. Ribosomal protein L7a mRNA was measured at the same time and was used as an internal control for normalisation. Other housekeeping genes were also tested, including 18S, Actin and Tbp; and L7a was chosen as an internal control due to its relatively constant expression in our study. Following PCR, a dissociation curve was generated through a stepwise increase of the temperature from 55 to 95°C to ensure that a unique product was amplified. Primers for quantitative PCR were designed using Vector NTI software (Invitrogen; Table 2).
p21 primer sequence

ID, identity document.
Protein isolation and Western blotting
Protein samples were isolated from 25 mg of each frozen mammary gland tissue, which was ground in liquid N2 and diluted with 500 μl of protein sample buffer (0·125 m-2-amino-2-hydroxymethyl-propane-1,3-diol (Tris)–HCl pH 6·8, 5 % 2-mercaptoethanol, 1 % SDS, 20 % glycerol, 0·4 % bromophenol blue, protease inhibitor). Protein was sonicated (Fisher Scientific model 100 Sonic Dismembrator; Fisher Scientific) on ice with twenty-five pulses at power setting 2. The Lowry assay was used to determine the protein content, and samples containing 20 μg of protein were resolved by SDS-PAGE. An electrotransfer of the protein to a polyvinylidene fluoride membrane (0·2 μm; Bio-Rad Laboratories, Inc.) was performed using a wet transfer protocol. The membrane was blocked with 5 % milk in TBS/T (30 mm-Tris base pH 7·6, 200 mm-NaCl and 0·1 % Tween 20) for 1 h at room temperature, and then incubated with rabbit polyclonal antibody against p21 (Table 3) in 5 % BSA at a 1:1000 dilution at 4°C overnight. The following day, the membrane was washed five times, for 5 min each time, with TBS/T on a shaker and then incubated with peroxidase-conjugated goat anti-rabbit secondary antibody (Kirkegaard & Perry Laboratories) in 1 % milk at a 1:10 000 dilution for 1 h at room temperature. The membrane was washed again five times, for 5 min each time. The bound secondary antibody was detected using a SuperSignal West Dura Extended Duration Substrate kit (Thermo Scientific) and Western blot images were captured and analysed by a Chemi Doc system (Bio-Rad Laboratories, Inc.).
Antibodies used in Western blot and chromatin immunoprecipitation assay
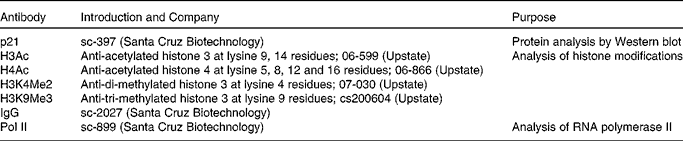
H3Ac, acetylated histone 3; H4Ac, acetylated histone 4; H3K4Me2, di-methylated histone 3 at lysine 4 residues; H3K9Me3, tri-methylated histone 3 at lysine 9 residues; Pol II, RNA polymerase II.
Genomic DNA extraction from mammary gland
Frozen mammary gland tissues from six offspring from each group were individually cut into pieces on ice (about 100 mg of mammary tissue per animal). Proteinase K (100 μl of 10 mg/ml) and 240 μl of 10 % SDS were then added to the samples and incubated in a 45°C water bath overnight. The next day, 2·4 ml of phenol was added to the system, shaken completely for 10 min, and spun at 3000 rpm for 5 min at 10°C. The supernatant was collected, and 1·2 ml phenol and 1·2 ml chloroform–isoamyl alcohol (24:1) were added. This mixture was shaken by hand for 5 min, spun at 3000 rpm for 5 min at 10°C, and then the supernatant was transferred into a fresh tube. Both 25 μl of 3 m-sodium acetate (pH 5·2) and 5 ml of ethanol were added to the supernatant, shaken gently for DNA precipitation, and spun at 16 000 g for 20 min at 4°C. After discarding the supernatant, the DNA pellet was washed with 70 % ethanol. The pellet was air-dried, resuspended in 300 μl of Tris-EDTA and stored at − 20°C.
Bisulphite sequencing
Genomic DNA (1 μg) was utilised for bisulphite conversion with the EZ DNA Methylation-Gold kit (ZYMO) following the manufacturer's instructions. Briefly, DNA samples were treated with sodium bisulphite at 64°C for 2·5 h. They were then desalted, desulphonated and eluted into 40 μl of TE. Bisulphite-modified DNA (25 ng) was then subjected to PCR amplification of the p21 CpG islands using the bisulphite primer sets, designed online by the tool Methprimer (http://www.urogene.org/methprimer/index.html). The PCR products obtained were cloned into pCR4.0 TOPO vectors (Invitrogen). A total of six animals from each group were tested and ten colonies from each animal were sequenced for each specimen in order to obtain a sufficient sampling of allele-specific methylation patterns.
Chromatin immunoprecipitation
Chromatin immunoprecipitation (ChIP) analysis was performed according to a modified protocol(Reference Chen, Pan and Dudenhausen16). Briefly, 200 mg of frozen tissue was ground in liquid N2, re-suspended in PBS and cross-linked in 1 % formaldehyde for 10 min at room temperature. The tissue pellet was re-suspended in nuclei swelling buffer (5 mm-Pipes (NaOH) pH 8·0, 85 mm-KCl, 0·5 % NP40) containing protease inhibitor. The separated nuclei were lysed in SDS lysis buffer (50 m-Tris–HCl pH 8·1, 10 mm-EDTA, 1 % SDS) containing protease inhibitors. The resultant chromatin was sonicated (Fisher Scientific model 100 Sonic Dismembrator; Fisher Scientific) on ice with eight bursts for 40 s at power setting 5, with a 2 min cooling interval between each burst. The average length of sonicated chromatin was determined by resolving it on a 1·6 % agarose gel, and was found to be around 200–500 bp. The sample was then centrifuged at 13 000 rpm for 10 min at 4°C to remove cell debris from the crude chromatin lysate. Following this, 1 ml of sheared chromatin was diluted in 10 ml of ChIP dilution buffer. Then, 10 % of the diluted lysate was subsequently incubated overnight on a haematology mixer (model 346; Fisher Scientific) with 2 μg of primary antibodies (Table 3) at 4°C. Normal rabbit IgG antibody was used as the negative control to demonstrate non-specific binding. Antibodies were considered negative for binding if the resulting value was equal to or less than the IgG value (ratio to input). Pre-blocked salmon sperm DNA/protein A agarose beads (60 μl, 50 % slurry; Upstate Biotechnology) were then added to the chromatin for 2 h, followed by centrifugation at 2000 rpm for 1 min at 4°C. The supernatant of normal rabbit IgG was saved as the input control for PCR after clean-up. The pellets containing immunoprecipitated complexes were washed sequentially with 1 ml of a low-salt solution (0·1 % SDS, 1 % triton X-100, 2 mm-EDTA, 20 mm pH 8·0 Tris–HCl, 150 mm-NaCl), a high-salt solution (0·1 % SDS, 1 % triton X-100, 2 mm-EDTA, 20 mm pH 8·0 Tris–HCl, 500 mm-NaCl), LiCl solution (0·25 m-LiCl, 1 % NP40, 1 % sodium deoxycholate, 1 mm-EDTA, 10 mm pH 8·0 Tris–HCl) and twice with TE (pH 8·0). Antibody–protein–DNA complexes were eluted from Protein A agarose beads by adding 250 μl of the elution buffer (50 mm-NaHCO3 and 1 % SDS) two times, followed by 15 min of shaking at 300 rpm at 37°C and finally by flash spinning the samples down at room temperature. The combined supernatants were incubated at 65°C for 4–5 h, after the addition of 20 μl of 5 m-NaCl and 1 μg of RNase A to reverse the formaldehyde cross-linking and release the DNA fragments. The samples were then treated with proteinase K at 37°C for 1 h to remove any protein, and DNA was purified with a Wizard SV Gel and PCR Clean-up System (Promega). Each real-time PCR reaction used 5 % of immunoprecipitated DNA. The binding of RNA polymerase II (Pol II) and modified histones were expressed as ratios to the input. The standards and the samples were simultaneously amplified using the same reaction master mixture in a 25 μl reaction volume. Primers were used to amplify genomic sequences at the p21 promoter region (see Table 2).
Statistical analysis
Results are expressed as means with their standard errors. Weight gain and food intake were analysed using the Repeated-Measures ANOVA with diet and time as the main factors. For all remaining data, the main effect of diet was determined using one-way ANOVA (SAS software; SAS Institute Inc.). Sample size was calculated by statistical power analysis based on a 95 % CI using SAS.
Results
Maternal and offspring observations
Pregnant dams were monitored beginning at day 2 of gestation. Table 4 shows maternal daily food intake and body weight during gestation. Gestational body weights of the LP dams were reduced by 13 % both at day 16 and at day 21 (P < 0·05), and there were no differences in the daily food intake between the C and LP dams (P>0·05). At birth, control pups weighed 6·32 (sem 0·19) g, which was similar to the weight of the LP pups at 5·92 (sem 0·09) g. By postnatal day 15, the average body weight of the LP pups was significantly lower than that of the control pups (P < 0·02). Table 5 provides the average body weight of offspring at birth and at postnatal days 7, 15, 22 and 35. The average weight of the LP offspring was reduced by 12 % at day 15, 16 % at day 22 and 13 % at day 35 (Table 5; P < 0·05), compared to the control pups. All C dams delivered their pups after 12.00 hours, while the percentages of pups delivered by the LP dams before noon and after noon were 43 and 57 %, respectively (Table 4), suggesting a preterm risk, which has been known for frequent occurring in low birth weight infant(Reference Sluncheva17). There were no differences in litter size or litter sex distribution between the C and LP groups (Table 5).
(Mean values with their standard errors)

* Body weight and food intake are shown as the average value at the specific day.
(Mean values with their standard errors)

* Body weight is shown as the average value at the specific day.
A maternal low-protein diet repressed p21 gene expression in offspring mammary glands
The effect of a maternal LP diet on offspring gene expression was examined through real-time quantitative PCR. Fig. 1(a) shows the tissue distribution of p21 mRNA expression in female offspring rats. The mRNA expression of the p21 gene in the mammary gland of the LP pups was significantly decreased by 38 % relative to the control pups (P < 0·05), but was not affected by maternal diet in any other tissue. Therefore, we concentrated our study of the mechanisms regulating the p21 gene in only the mammary glands of female offspring. Expression of p53 was not affected by maternal low protein (data not shown).
p21 mRNA tissue distribution in female offspring. (a, b) mRNA expression of p21 in the pancreas, kidney, liver, blood, mammary gland, brain, heart, muscle, adipose tissue and colon in female offspring of control (□) mothers v. low protein (![]() ) mothers (n 6). mRNA levels are shown as the ratio to the L7a housekeeping gene, which acts as an internal control to normalise total RNA variation. Values are means, with their standard errors represented by vertical bars. * Mean value was significantly different when compared to control (P < 0·05).
) mothers (n 6). mRNA levels are shown as the ratio to the L7a housekeeping gene, which acts as an internal control to normalise total RNA variation. Values are means, with their standard errors represented by vertical bars. * Mean value was significantly different when compared to control (P < 0·05).

A maternal low-protein diet repressed p21 protein in offspring mammary glands
To determine whether altered p21 mRNA content contributes to a change in protein content in offspring mammary gland, we performed Western blot analysis using an anti-p21 antibody. p21 protein was reduced by 60 % (P < 0·05) by a maternal LP diet in female offspring mammary glands (Fig. 2). Significantly lower p21 protein content in the LP pups' mammary gland tissue was consistent with its mRNA expression, which was also significantly decreased in the LP offspring. An anti-actin antibody was used as an internal control to ensure that equal amounts of protein were loaded for all samples.
p21 protein content in the mammary glands of female offspring. Expression of p21 protein in the mammary glands of female offspring from control (C, □) mothers v. low protein (LP, ![]() ) mothers (n 6). Data were normalised to control. Values are means, with their standard errors represented by vertical bars. * Mean value was significantly different when compared to control (P < 0·05).
) mothers (n 6). Data were normalised to control. Values are means, with their standard errors represented by vertical bars. * Mean value was significantly different when compared to control (P < 0·05).

A maternal low-protein diet did not affect p21 gene methylation patterns in offspring mammary glands
To determine whether CpG islands at the p21 promoter exhibited DNA methylation corresponding to the gene's mRNA expression, two pairs of bisulphite primer sets were designed for the p21 promoter region. These primer sets span from − 481 to 7 bp and − 16 to 386 bp, and contain 26 and 30 CpG sites, respectively (Fig. 3). Fig. 3(a) represents the positions of the p21 gene promoter and its CpG islands on the intact genomic sequence. The p21 methylation status was assessed by bisulphite sequencing (Fig. 3(b) and (c)). CpG methylation levels were similar between the offspring of both C and LP dams. Therefore, the reduced p21 mRNA expression in mammary glands of offspring in response to a maternal LP diet was at least not affected by DNA methylation within the p21 gene promoter region.
DNA methylation within the p21 promoter in the mammary glands of female offspring. (a) Rat p21 gene promoter includes two major CpG islands, which were amplified by two sets of bisulphite sequencing primers. (b) Bisulphite sequencing results amplified by the primers, which cover − 481 to 7 of the p21 promoter. (c) Bisulphite sequencing results amplified by the primers, which cover − 16 to 386 of the p21 promoter. In (b) and (c), each solid bar on the top line represents a CpG site at the p21 promoter. A total of ten clones were picked from each animal and six animals were included from each group. Overall, sixty clones from each condition, control (c) and low protein (LP), were included for each primer set tested. Each set of ten circles represents the average percentage of DNA methylation corresponding to the specific CpG site shown on top. ●, Methylation; ○, lack of methylation.

A maternal low-protein diet was associated with chromatin modifications within the p21 promoter in offspring mammary glands
Changes in chromatin structure caused by chemical modifications of histones, such as methylation and acetylation, regulate gene transcription by affecting the dynamic association of eukaryotic Pol II at the gene promoter required to transcribe DNA(Reference Roeder and Rutter18, Reference Conaway and Conaway19). The ChIP assay was performed to investigate associations of modified histones and Pol II at the p21 promoter in offspring mammary glands. Normal rabbit IgG antibody was used as the negative control, indicating non-specific binding. Antibodies were considered negative for binding if the resulting value was equal to or less than the IgG value ( ≤ 0·002 ratio to input). Female offspring liver, in which the p21 expression was not affected by maternal diet, was used as a negative control to test the changes of the same set of modified histones at the p21 promoter, which was used to support the specificity of modifications in the mammary glands (Fig. 4(a)). Recruitment of total Pol II to the p21 promoter was decreased in the LP pup mammary glands when compared to C (Fig. 4(b); P < 0·05), suggesting a potential decrease of transcription activity within the p21 promoter by a gestational LP diet.
RNA polymerase II (Pol II) binding and histone modifications within the p21 promoter in the mammary glands of female offspring. (a) Chromatin immunoprecipitation (ChIP) assay demonstrating histone modifications at the p21 promoter region in female offspring liver (n 5). (b) ChIP assay demonstrating the binding of Pol II at the p21 promoter region in female offspring mammary gland (n 5). Normal rabbit IgG antibody was used as a negative control to show non-specific binding. Data are shown as a ratio to the input DNA, which acts as an internal control to eliminate DNA quantity variation. (c) ChIP assay demonstrating histone modifications at the p21 promoter region in female offspring mammary gland (n 5). Data are shown as a ratio to the input DNA. H4Ac: acetylated histone 4; H3Ac: acetylated histone 3; H3K4Me2: di-methylated histone 3 at lysine 4 residues; H3K9Me3: tri-methylated histone 3 at lysine 9 residues. Values are means, with their standard errors represented by vertical bars. * Mean values were significantly different when compared to control (□, P < 0·05). ![]() , Low protein.
, Low protein.

To further determine whether the altered p21 gene expression was regulated by the changes of chromatin structure at the p21 promoter, antibodies to either methylated or acetylated histones were utilised in the ChIP assay. Fig. 4(c) shows histone modifications at the p21 promoter in the mammary gland of offspring rats. A 33 % decrease in acetylated histone H3 (P < 0·05) and a 34 % decrease of dimethylation at histone H3 lysine 4 (P < 0·05) were detected in the LP pups when compared to C, correlating to the 38 % transcriptional repression in the LP pups when compared to C (Fig. 1(b)). No differences were detected in histone H4 acetylation or histone H3 methylation at lysine 9 residues (H3K9Me3). These data suggest that the altered p21 gene transcription in response to a gestational LP diet might be regulated by the changes in histone modifications at its promoter region, specifically histone H3 acetylation as well as histone H3 methylation at lysine 4 (Fig. 5).
A summary schematic showing the changes of acetylation (Ac) of histone H3 and methylation (Me) of histone H3K4 within the p21 promoter in offspring mammary glands, comparing the control (C) and low-protein (LP) groups.

Discussion
Determining the mechanism of p21 regulation during mammary gland development, specifically in response to maternal diet, may provide new approaches to reducing breast cancer risk. In the present study, we used a gestational LP diet with 9 % protein to investigate a model of moderate maternal protein restriction that highly likely occurs in teen mothers. Between 2005 and 2006, about 13 % of US births involved teen mothers(Reference Martin, Hamilton and Sutton20), and it has been shown that teenage girls have diets inadequate in energy or protein, which if consumed during pregnancy, will lead to low birth weights(Reference Derbyshire21, Reference Oumachigui22). A similar animal model has been used by many researchers to study the effect of maternal protein restriction on offspring gene regulation(Reference Jousse, Parry and Lambert-Langlais7, Reference Lillycrop, Phillips and Jackson15), while some other groups used a more restricted protein diet to trigger more severe consequences(Reference Buffat, Mondon and Rigourd23). According to Acceptable Macronutrient Distribution Ranges, 10–35 % of daily energy should come from protein, and according to these standards, the 9 % protein diet used in the present study is only very moderately deficient. Our results demonstrate that a maternal LP diet can down-regulate p21 expression in offspring mammary glands in a rat model. We also revealed that the suppression of p21 is caused by altered histone modifications, but not DNA methylation, within the p21 promoter region.
p21 alone represents an important tumour suppressor gene. As a prognostic marker for cancer, p21 has been extensively investigated. When the susceptibility of p21-deficient mice to the colon carcinogen azoxymethane was investigated, p21-deficient mice had increased formation of aberrant crypt foci, suggesting a tumour-suppressing role of p21 in the colon(Reference Poole, Heap and Carroll24). Similarly, loss of p21 allowed for the proliferation of cells with DNA damage and resulted in cancer development in the liver and kidneys of fumarylacetoacetate hydrolase-deficient mice(Reference Willenbring, Sharma and Vogel25). Ozanne et al. have shown, in rats, that maternal exposure to a LP diet increases mammary tumourigenesis in the offspring(Reference Sohi, Marchand and Revesz6); and increases in p21 expression have also been reported in the pancreas of gestational LP-exposed offspring(Reference Tarry-Adkins, Chen and Smith14). Additionally, clinical data suggest that loss of p21 expression in patients marks the switch from hepatocyte dysplasia to hetapocellular carcinoma (HCC)(Reference Plentz, Park and Lechel26). These results suggest that p21 may represent an important tumour suppressor that is inactivated in liver and renal cancer. However, little is known about the role of repressed p21 in the growth and development of the mammary gland.
Mammary gland development occurs throughout the life cycle. They exist during the embryonic stage, but form only a rudimentary duct tree at birth. At this stage, mammary gland development is systemic and hormone-independent(Reference Watson and Khaled27). Under the regulation of paracrine communication between neighbouring epithelial and mesenchymal cells, a primary duct tree is formed before puberty. Extensive proliferation of mammary tissue occurs in females in response to circulating ovarian hormones from puberty(Reference Wysolmerski, Philbrick and Dunbar28). The Sprague–Dawley rats that were used in the present study undergo puberty within 6 to 8 weeks after birth, but the abdominal mammary glands have a dramatic increase in growth between day 35 and day 40(Reference Sinha and Tucker29). In order to avoid the impact of extensive mammary gland development during puberty, but still have enough tissue to perform a variety of experiments, we chose day-38 offspring to investigate the changes and regulation of the p21 gene within the mammary gland. Additionally, there is accumulating evidence that maternal diet can alter the timing of puberty, which is generally defined by vaginal opening in female rats(Reference van Weissenbruch, Engelbregt and Veening30). At the onset of puberty, intra-uterine growth-restricted rats had a lower body weight compared to controls and the onset of puberty was delayed(Reference Iwasa, Matsuzaki and Murakami31); and a recent study showed that intra-uterine undernutrition induced a delayed onset of puberty in Wistar rats. However, female offspring of rats fed a protein-restricted diet during pregnancy followed by a control diet after delivery (RC group) showed a similar onset of puberty as those in the control group that were fed a control diet during pregnancy and during lactation (CC group)(Reference Guzmán, Cabrera and Cárdenas32). In order to further our understanding of the mechanisms behind the programming of p21, future studies with additional experimental time points in adult rats will be needed to further investigate the effects of maternal protein restriction on offspring mammary gland development during and after puberty, as well as on the timing of puberty onset. In the present study, the rats we used were aged before the puberty. The altered p21 gene expression could be comfortably considered as a result of the maternal protein restriction.
The p21 promoter is GC-rich. We predicted CpG islands within the p21 promoter region by the online tool Methprimer (see Methods section); and ten CpG islands were determined on the p21 whole genome. Here, eight out of the total ten extend from around − 500 to 400 within the p21 gene proximal promoter. Previous studies have shown that the GC-rich DNA elements of the proximal promoter are critical for the regulation of p21 transcription(Reference Bai and Merchant33), since it includes the binding sites for the transcription factors of p21 (Reference Sowa, Orita and Hiranabe-Minamikawa34–Reference Ocker and Schneider-Stock36). With regard to the other two CpG islands on the p21 gene, one is located at around − 3000 bp and the other is at the 5000 bp region. It is possible that these two distal regions might be methylated in response to diet, but the regulatory role of these islands has never been reported. Therefore, we could conclude in the present study that DNA methylation status within the CpG islands around the p21 proximal promoter was not affected by a maternal LP diet.
Histone acetylation is associated with increased gene transcription, and therefore, with transcriptionally active chromatin domains. As a post-translational modification, histone acetylation is maintained by a dynamic balance between the activities of histone acetyltransferases and histone deacetylases. The acetylation of lysine residues on histones H3 and H4 represents the active or open state of chromatin, which allows various transcription factors access to the promoters of target genes. In contrast, shifting the promoter occupancy from histone acetyltransferases to histone deacetylases to deacetylate lysine residues will result in chromatin compaction and transcriptional repression. Recruitment of histone deacetylases by specificity protein 1/specificity protein 3 (Sp1/Sp3) sites at the p21 promoter, which in turn represses p21 transcription, is a potential model for p21 down-regulation by a maternal diet. We observed a decrease in acetylated histone H3 (P < 0·05), which may indicate increased binding of histone deacetylases to the p21 promoter. Histone H3 hypoacetylation has been reported to be associated with reduced p21 expression in gastric carcinoma, but no association has been previously reported between p21 expression and histone H4 acetylation within the p21 promoter(Reference Mitani, Oue and Hamai37), which was consistent with what was observed in our study, since only histone H3 hypoacetylation was associated with reduced p21 expression in offspring mammary glands in response to maternal protein restriction. Distinct roles for the acetylation of histones H3 and H4 have been reported in yeast(Reference Wan, Mann and Grunstein38), and although a number of proteins have been shown to be recruited to regulate specific histone modifications, further studies in mammals will be needed to definitively reveal the functional significance of histones H3 and H4 modifications.
With regard to histone methylation, we found reduced di-methylation of H3K4 (P < 0·05), but unchanged tri-methylation of H3K9, at the p21 promoter in the LP offspring mammary glands when compared to the control offspring. Histone methylation appears to have multiple effects on chromatin function in a system- and site-specific manner. Methylation of H3 on K4 is implicated in the activation of transcription. In budding yeast, H3K4Me3 localises to the 5′ end of the target gene and is found to be associated with the initiation of RNA Pol II(Reference Kouzarides39). Methylation of H3 on K9, on the other hand, is largely associated with silencing and repression in many species(Reference Bartova, Krejci and Harnicarova40). Our results indicate that methylation of H3K9 within the p21 promoter region is not an absolute requirement for p21 repression.
The regulation of p21 gene transcription is controlled by both p53-dependent and -independent mechanisms. For instance, p53 mutant mice (p53R172P) lost their ability to induce apoptosis, but retained their capacity to induce p21. When these mice were crossed with a p21-null strain, loss of p21 entirely eliminated the cell cycle arrest characteristic of p53R172P (Reference Barboza, Liu and Ju41). Notably, intra-uterine growth retardation through bilateral uterine artery ligation of the pregnant rat altered p53 gene methylation patterns in kidney and increased renal apoptosis(Reference Pham, MacLennan and Chiu42). Other p53-independent pathways of regulating p21 have also been reported. Myelocytomatosis viral oncogene (MYC) represses p21 transcription by binding to and inhibiting SP1(Reference Gartel and Shchors43). This can be alleviated through the binding of the ligand-independent nuclear receptor hepatocyte nuclear factor 4α1 to SP1(Reference Hwang-Verslues and Sladek44). In response to DNA damage, MYC is recruited to the p21 promoter by Myc-interacting zinc finger protein 1 (MIZ1), and forms a ternary complex with the DNA methyltransferase DNA-methyltransferase 3a (DNMT3a), which represses p21 transcription(Reference Brenner, Deplus and Didelot45). Additionally, AP4, a basic helix–loop–helix protein and a transcriptional target of MYC, represses the p21 promoter by binding to four proximal E-box motifs independently of MIZ1, SP1 or SP3(Reference Jung, Menssen and Mayr46). Taken together, these mechanisms could potentially provide several lines of evidence for the need for further investigation of the altered p21 expression by a maternal LP diet.
In summary, we present evidence that maternal dietary low protein modulates p21 gene expression and histone modifications within its promoter in the mammary gland of offspring rats (Fig. 5). These findings suggest that a maternal protein-restricted diet during pregnancy may potentially alter cell cycle control regulation, thereby predisposing offspring rats to the risk of developing breast cancer later in life.
Acknowledgements
This project was supported, in whole or in part, by the USDA Cooperative State Research, Education and Extension Service, Hatch project no. ILLU-698-374, and by National Institutes of Health Grants CA-139557 (to Y.-X. P.). The experiments were performed in the laboratory of Y.-X. P. at University of Illinois at Urbana-Champaign. Y.-X. P. and S. Z. are responsible for the conception and design of the experiments. S. Z., M. R. and K. Y. conducted the experiments and collected the data. S. Z. analysed the data and drafted the manuscript. Y.-X. P. and S. Z. have primary responsibility for the final content. All authors read and approved the final manuscript. The authors thank Hong Chen (University of Illinois) for sharing her expertise and experiences in epigenome analysis. The authors declare that there is no conflict of interest that could be perceived as prejudicing the impartiality of the research reported.


