


Introduction
Task performance is often an overlooked marker of performance monitoring in neurophysiological studies, even though it has proven a valuable integrative component when understanding the interplay between the brain and behavior (Sandre et al., Reference Sandre, Banica, Riesel, Flake, Klawohn and Weinberg2020; Schroder & Moser, Reference Schroder and Moser2014). Performance monitoring, which includes error and conflict monitoring, is a higher-order cognitive function ensuring the ability to reflect on one’s actions, detect errors and initiate behavior adjustment (Gehring et al., Reference Gehring, Goss, Coles, Meyer and Donchin1993). According to conflict monitoring theory (Botvinick et al., Reference Botvinick, Braver, Barch, Carter and Cohen2001), conflict monitoring is defined as dealing with incongruent information and allows the effective detection of competing or interfering response options when planning/executing a goal-directed action. Error monitoring refers to the cognitive process that allows the detection and evaluation of errors during goal-directed action (Yeung & Summerfield, Reference Yeung and Summerfield2012). Like many cognitive abilities, conflict and error monitoring change throughout development (Luna et al., Reference Luna, Marek, Larsen, Tervo-Clemmens and Chahal2015). Differences in the ability to monitor performance have been linked to psychopathology during childhood and adulthood (Meyer, & Hajcak, Reference Meyer and Hajcak2019; Olvet & Hajcak, Reference Olvet and Hajcak2008). However, most studies investigating performance monitoring are cross-sectional, making it impossible to study developmental aspects. In addition, it is unclear how changes in flanker performance growth can be related to the development of behavioral and emotional problems in childhood. Therefore, the current study has two goals: 1) investigate the development of child performance on a modified flanker task and 2) test whether the development of flanker performance is associated with the development of behavioral and emotional problems in a sample of 7- to 12-years old children attending mainstream elementary schools.
Both conflict and error monitoring can be measured through several cognitive paradigms, with the Eriksen flanker task being one of the most used in the field (Eriksen & Eriksen, Reference Eriksen and Eriksen1974). The task is simple in its design and instruction, and the cues are non-verbal and easily adaptable to accommodate participants’ age or experimental manipulation. It is a forced-choice paradigm in which participants are presented with a string of stimuli and instructed to locate the target symbol accurately and as fast as possible, ignoring the other irrelevant (non-target) symbols (flankers). There are two trial types, congruent and incongruent, where the congruent trial has the same flankers (e.g., > > > > >), whereas the incongruent contains conflicting flankers (e.g., > > < > >). This conflicting information requires more complex cognitive processing and is quantified by longer response times on incongruent trials accompanied by more commission errors (Shenhav et al., Reference Shenhav, Botvinick and Cohen2013).
Addressing this conflict monitoring system directs attention to current behavior (identification and evaluation of errors) and motivates the adjustment of future behavior (correcting), ultimately reinforcing learning. Conflict monitoring theory is well suited to explain the development of performance monitoring and how behavior and neural maturation are related to cognitive control development (Lo, Reference Lo2018). Tasks that evoke conflict and error monitoring, such as the flanker task, are associated with specific activation of the anterior cingulate cortex (ACC; Richard Ridderinkhof et al., Reference Ridderinkhof, Ullsperger, Crone and Nieuwenhuis2004; van Veen & Carter, Reference Van Veen and Carter2002). Indeed, there is a link between level of anterior cingulate cortex activity and ongoing task behavior (e.g., Ordaz et al., Reference Ordaz, Foran, Velanova and Luna2013; Sheth et al., Reference Sheth, Mian, Patel, Asaad, Williams, Dougherty, Bush and Eskandar2012). Although conflict monitoring theory explains behavior in performance monitoring tasks (see Ullsperger et al., Reference Ullsperger, Danielmeier and Jocham2014), conflict and error monitoring processes are simultaneously active during task performance, especially in the brain. This is why other theories, such as the reinforcement learning theory (Holroyd & Coles, Reference Holroyd and Coles2002) or the adaptive orienting theory of error processing (Wessel, Reference Wessel2018), also provide valid theoretical frameworks to explain adaptation behavior following performance monitoring.
The behavioral indices of the flanker task allow for the investigation of performance monitoring on a behavioral level. Raw flanker outcomes are the response times and accuracy per trial type (congruent vs. incongruent). Here, we refer to the congruency effect when response times and accuracy differ depending on the congruency of the trial, which can be an index of conflict monitoring (Botvinick et al., Reference Botvinick, Braver, Barch, Carter and Cohen2001). Post-error slowing (PES) is a behavioral index of error monitoring, defined as the slowing of response time on a post-error trial. While different accounts explain the post-error slowing phenomenon (Danielmeier & Ullsperger, Reference Danielmeier and Ullsperger2011; Dutilh et al., Reference Dutilh, Vandekerckhove, Forstmann, Keuleers, Brysbaert and Wagenmakers2012; Rueppel et al., Reference Rueppel, Mannella, Fitzgerald and Schroder2022), post-error slowing generally reflects the behavior adjustment mechanism following error-making and serves as a measure of cognitive control. Another measure that is related to performance monitoring is the speed-accuracy trade-off (SAT; Rabbitt, Reference Rabbitt1966). Speed-accuracy trade-off (SAT) is the inverse relationship between the speed of response and response accuracy, where an increase in the pace of responding is often at the expense of correctness (Heitz, Reference Heitz2014; Ranger et al., Reference Ranger, Kuhn and Pohl2021). According to the most reported speed-accuracy trade-off score (the inverse efficiency score, Townsend & Ashby, Reference Townsend and Ashby1983), a larger speed-accuracy trade-off is observed when an individual is slower in response time while making few errors. A small speed-accuracy reflects the focus on faster response time while making more errors (Liesefeld & Janczyk, Reference Liesefeld and Janczyk2019). Both speed-accuracy trade-off and post-error slowing capture individuals’ “strategy” during task performance. Changes in these parameters are the result of adequate performance monitoring, as they are needed to optimize overall performance and the avoidance of future errors. In turn, this ability to adapt behavior after wrongful decision-making is a crucial mechanism for behavior.
Normative performance monitoring development during childhood facilitates the fine-tuning of the abilities to focus attention on relevant stimuli, evaluate wrong decision-making and self-regulate behavior (Denervaud et al., Reference Denervaud, Hess, Sander and Pourtois2021; Lo, Reference Lo2018). This is driven by unique changes in the maturation of performance-monitoring brain regions such as anterior cingulate cortex (Tamnes et al., Reference Tamnes, Walhovd, Torstveit, Sells and Fjell2013) and contributing neurotransmitter systems, that change throughout development (Luna et al., Reference Luna, Marek, Larsen, Tervo-Clemmens and Chahal2015). This is why we expect that performance monitoring improves during childhood. Indeed, flanker task performance has been associated with children’s age. Cross-sectional studies indicate that older children are in general, more accurate and faster than younger children (Buzzell et al., Reference Buzzell, Richards, White, Barker, Pine and Fox2017; Checa et al., Reference Checa, Castellanos, Abundis-Gutiérrez and Rueda2014; Davies et al., Reference Davies, Segalowitz and Gavin2004; Gavin et al., Reference Gavin, Lin and Davies2019; Gorday & Meyer, Reference Gorday and Meyer2018; Overbye et al., Reference Overbye, Walhovd, Paus, Fjell, Huster and Tamnes2019). Also, children are slower and commit more errors compared to adults (e.g., Santesso et al., Reference Santesso, Segalowitz and Schmidt2006; for a review, see Hämmerer et al., Reference Hämmerer, Müller and Li2014). There are mixed findings considering post-error slowing in childhood (Rueppel et al., Reference Rueppel, Mannella, Fitzgerald and Schroder2022). Some studies find no age-related changes in post-error slowing (Denervaud et al., Reference Denervaud, Hess, Sander and Pourtois2021; Ladouceur et al., Reference Ladouceur, Dahl and Carter2007; Taylor et al., Reference Taylor, Visser, Fueggle, Bellgrove and Fox2018), some studies report a developmental decrease in post-error slowing (Meyer et al., Reference Meyer, Weinberg, Klein and Hajcak2012; Smulders et al., Reference Smulders, Soetens and van der Molen2016) and others find a developmental increase in PES (Hogan et al., Reference Hogan, Vargha-Khadem, Kirkham and Baldeweg2005; Overbye et al., Reference Overbye, Walhovd, Paus, Fjell, Huster and Tamnes2019). These discrepancies could be caused by different forms of calculating post-error slowing or experimental designs, yet the true meaning of this inconsistency is unknown. Considering speed-accuracy trade-off, the study of Ladouceur et al. (Reference Ladouceur, Dahl and Carter2007) reports that 12-year-old children equally valued speed and accuracy during the flanker task performance. Taken together, the above-mentioned studies suggest that children improve in response times and accuracy over time. We expect similar task performance improvement over time in the current study and will explore post-error slowing and speed-accuracy trade-off across 7- to 12-year-olds in the current sample.
Children are vulnerable to developing psychological problems during elementary school (Boer et al., Reference Boer, van Dorsselaer, de Looze, de Roos, Brons, van den Eijnden, Monshouwer, Huijnk, Ter Bogt, Vollebergh and Stevens2021). Although there are other developmental markers that play a role in the etiology of a disorder, performance monitoring markers have been put forth as important neuro-cognitive markers that play a role in the development of emotional and behavioral disorders (Research Domain Criteria: RDoC; National Institute of Mental Health, NIMH, 2008; Cuthbert, Reference Cuthbert2014; HiTOP). On a mechanistic level, the anterior cingulate cortex and the prefrontal cortex are responsible for regulating behavior, serving as the neural hub for processing information and driving task behavior (e.g. dealing with errors). Fluctuations in the activity of these brain regions, due to maturation or psychopathology, have been related to improved or reduced performance monitoring. Therefore, performance monitoring metrics are measures of one’s ability to regulate behavior but serve as proxy of maladaptive behavior in real-life situations. Well-defined hypotheses that explains the mechanism of these performance monitoring fluctuations could explain maladaptive behavior (specifically emotional and behavioral problems) are lacking. Research, often involving the neurophysiological indices of performance monitoring, relies on theorical hypotheses to explain the differential links between performance monitoring and internalizing or externalizing mental health problems. For example, according to the defense reactivity trait hypotheses (Weinberg et al., Reference Weinberg, Riesel and Hacjak2012), an error can be considered as a threat to an individual’s safety, and therefore errors are considered “bad” and should be avoided (Hajcak & Foti, Reference Hajcak and Foti2008). Yet, results finding an association between anxiety and behavioral indices of performance monitoring are mixed (Rueppel et al., Reference Rueppel, Mannella, Fitzgerald and Schroder2022; Weinberg et al., Reference Weinberg, Riesel and Hacjak2012). For instance, Meyer et al. (Reference Meyer, Weinberg, Klein and Hajcak2012) found that larger post-error slowing and more post-errors were more prevalent in children with higher anxiety scores. This was not the case in other studies, where there was no link between cognitive control and anxiety (Ladouceur et al., Reference Ladouceur, Dahl, Birmaher, Axelson and Ryan2006; Meyer et al., Reference Meyer, Hajcak, Torpey, Kujawa, Kim, Bufferd, Klein, Carlson and Klein2013). In youth with major depression disorder diagnosis, no clear association between the response times or accuracy rates and depression scores was observed (Ladouceur et al., Reference Ladouceur, Slifka, Dahl, Birmaher, Axelson and Ryan2012). However, young adults who report high levels of depressive symptoms show worse behavioral indices in performance tasks (Compton et al., Reference Compton, Lin, Vargas, Carp, Fineman and Quandt2008; Holmes & Pizzagalli, Reference Holmes and Pizzagalli2007). Several studies show associations between behavioral problems and conflict and error monitoring (Balogh & Czobor, Reference Balogh and Czobor2016; Meyer et al., Reference Meyer, Weinberg, Klein and Hajcak2012; Woltering et al., Reference Woltering, Granic, Lamm and Lewis2011) in children. Meta-analytic reviews reveal that individuals (predominantly children) with an attention deficit hyperactivity disorder (ADHD) show a diminished post-error slowing, slower response times, and higher error rate than healthy controls (Balogh & Czobor, Reference Balogh and Czobor2016; Geburek et al., Reference Geburek, Rist, Gediga, Stroux and Pedersen2013). In children with conduct or oppositional problem behavior during childhood, studies relating performance monitoring with problem behavior are, to our knowledge, scarce. An exception is the study by Stieben et al. (Reference Stieben, Lewis, Granic, Zelazo, Sealowirz and Pepler2007), which showed that 10-year-old children with externalizing problems did not show post-error slowing. In the study by Woltering et al. (Reference Woltering, Granic, Lamm and Lewis2011), children with high levels of externalizing behavioral problems (based on Child Behavioral Checklist scores) were slower in response times than the comparison group of typically developing children. In short, there is initial evidence that performance monitoring deficits are transdiagnostic across psychopathology and it is possible that the association between performance monitoring and internalizing problems is positive, while for externalizing problems, the association is negative. The initial research described here rely on relatively small sample sizes and utilized cross-sectional study designs. Therefore, the second aim of the current study is to contribute to this body of literature, by exploring whether the level and development of flanker task performance is related to of the level and development of anxiety-, depression- related behavior and behavioral problems in a large sample of elementary school children followed throughout elementary school. This study is one of the first longitudinal investigations examining associated changes between behavioral indices of performance monitoring and behavioral and emotional problems throughout childhood.
A few studies found gender differences in flanker task performance in children (Burton et al., Reference Burton, Petersen, Eichele, Hemager, Spang, Ellersgaard, Christiani, Greve, Gantriis, Jepsen, Mors, Nordentoft, Thorup, Plessen and Vangkilde2022; Gavin et al., Reference Gavin, Lin and Davies2019; Torpey et al., Reference Torpey, Hajcak, Kim, Kujawa and Klein2012). When controlling for age, boys had a higher error rate and faster response time than girls (Burton et al., Reference Burton, Petersen, Eichele, Hemager, Spang, Ellersgaard, Christiani, Greve, Gantriis, Jepsen, Mors, Nordentoft, Thorup, Plessen and Vangkilde2022; Gavin et al., Reference Gavin, Lin and Davies2019). In 7-year-old boys, a smaller PES was observed when compared to girls in a large scale Danish sample (Burton et al., Reference Burton, Petersen, Eichele, Hemager, Spang, Ellersgaard, Christiani, Greve, Gantriis, Jepsen, Mors, Nordentoft, Thorup, Plessen and Vangkilde2022). Studies applying other performance monitoring tasks in young children (e.g., go/nogo tasks) found that gender was associated with response time (Torpey et al., Reference Torpey, Hajcak, Kim, Kujawa and Klein2012), where girls were slower than boys. In this study, we explore gender differences in flanker task performance, as there might be subtle differences in the initiation level and growth trajectory due to general sex differences in brain morphology and pre-puberal and hormonal changes (Gorday & Meyer, Reference Gorday and Meyer2018; Ordaz et al., Reference Ordaz, Foran, Velanova and Luna2013).
Current study
In the current longitudinal study, we modeled five years of flanker performance drawn from a large sample of mainstream elementary school children followed from age 7 to 12 with the intent to describe flanker performance throughout the elementary school years. This unique sample of repeated measures allows us to explore the development of response time across childhood. Based on previous research on performance monitoring, we expect that children show faster response time as they grow older. Second, we investigate the associated change between the level and development of response times with the level and development of anxiety and depressive related behavior and behavioral (ADHD-symptoms, oppositional defiant and conduct-related) problems. Lastly, we present age-related flanker performance measures (accuracy, congruency effects, post-error slowing and speed-accuracy trade-offs) in this large sample of 7- to 12-year-olds and explore if there are possible gender differences in flanker task performance during these five years as well as gender-specific associations between response times and emotional and behavioral-related problems.
Method
Participants
The data were drawn from the project “Happy Children, Happy adolescents?,” a longitudinal elementary school-based study focusing on the interplay between the social–emotional, behavioral, (neuro)cognitive, and bio-psychological development of children in the Netherlands (Asscheman et al., Reference Asscheman, He, Koot, Buil, Krabbendam and van Lier2020; Behnsen et al., Reference Behnsen, Buil, Koot, Huizink and van Lier2018; Tieskens et al., Reference Tieskens, Buil, Koot and van Lier2021). Participants were recruited from mainstream elementary schools in urban areas in the central part of the Netherlands (e.g. Amsterdam) and rural areas in the Eastern region (e.g. Nijmegen). For a detailed description of the inclusion of schools, see de Wilde et al. (Reference de Wilde, Koot and van Lier2016). Written informed consent from parents was requested for their child(ren) to participate. Each year, we informed the parents, children and teachers about the study and the upcoming data collection. Also, at each assessment year, children, parents, teachers and schools were free to refrain from participating at any time of the study, resulting into different N’s for each year. The project and its procedures were approved by the Medical Ethics Committee of the Vrije Universiteit Medical Centre (protocol number NL37788.029.11).
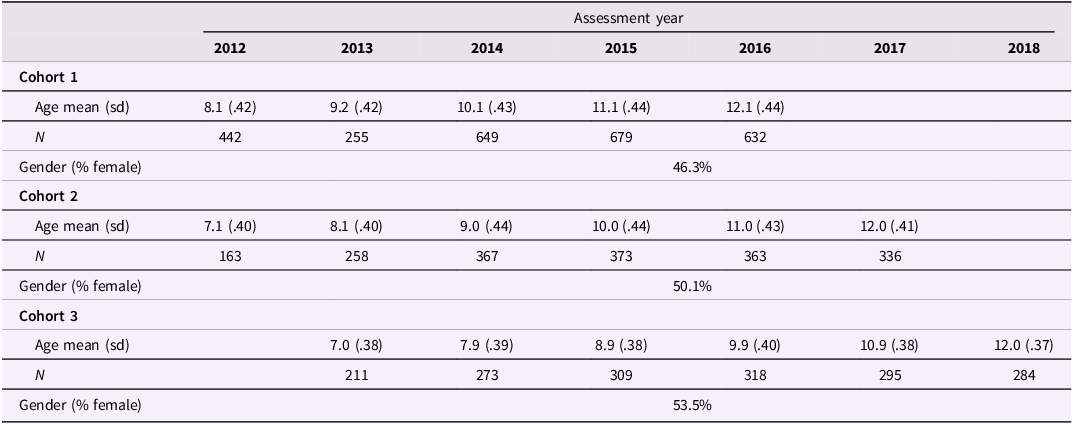
The data used in this study originated from three consecutive age cohorts within the participating schools. Table 1 shows the data structure of the cohorts and descriptive information of the sample extracted from the larger study for data analysis. For cohort 1, data collection started in Grade 1 and continued until the end of elementary school. For cohort 2, data collection began in the second year of kindergarten (please note that the Netherlands has two years of kindergarten) until the end of elementary school. For cohort 3, data collection started in the first year of kindergarten and continued until the end of elementary school. Children’s data was included when at least three time points or waves of flanker data were available and when data on age was complete. Half of the schools did not participate in the cognitive tasks in cohort 1 at timepoint 2 (the assessment year 2013) due to logistical complications. We restructured the data according to age so that all children of the same age were included in one measurement wave (i.e., age 7, age 8, etc.). The final sample contained a total of 1424 children (51% boys, nested in 25 schools). Almost all children were living with both their parents. Most of the children (73%) had a Dutch ethnic background, others were from Suriname, Dutch Antilles, Moroccan, Turkish or other decent. The children were from a household with a medium to high social economic status (SES), determined by a classification of profession of the parents (Statistics Netherlands, SBC, 2010).
Available sample size, age and gender for each year and cohort

Procedure
Data were collected annually, usually during spring or summer, and during one or two school days. Children completed a modified flanker task in the afternoon of the testing day, supervised by trained research assistants in a quiet place at the children’s schools to ensure privacy and focus. Within the same month, teachers completed an online questionnaire on children’s behavior related to mental health.
Measures
Flanker task
The source code for the flanker task can be found on https://osf.io/hmek5/ (van der Jagt & Stoof, Reference Van der Jagt and Stoof2023). An Eriksen flanker task was modified to accommodate the current sample of children and study design. The flanker task was performed on a tablet computer. The task had four practice items followed by 60 trials. Four different arrow strings (> > < > >, > > > > >, < < > < <, < < < < <) were presented randomly on the tablet screen for a duration of minimum 1 to maximum 2 s. Participants were instructed to press the left button with the left index finger if the central arrow pointed to the left and the right button with the right index finger if the central arrow pointed to the right. Participants were instructed to press as fast as possible on the correct side. We recorded accuracy and response time from the stimuli onset to button press for congruent (< < < < <, > > > > > 50%) and incongruent (< < > < <, > > < > > 50%) trials. Trials started with a 100 ms cue sign (+), where the central arrow of the string would appear. For cohorts 1 and 2 in 2012, the task contained 56 rather than 60 trials due to a technical error, which is the reason why we report proportion correct instead of number of correct trials as accuracy. A trial was considered invalid when there was no-response within a window of 2000ms or when the response time was outside 200 and 2000ms. Also, if children finished less than 40 trials, they were excluded from the analysis. This resulted in the exclusion of 33 participants when they were 7 years old, 27 participants that were 8 years old, 35 9-year-old participants, 1 11-year-old and 2 12-year-olds. Tapping the left and right buttons together was considered an error. Participants who had at least 50% of the trials correct were considered for analyses (excluding 32, 18, 14, 4, 2, and 2 cases for year 7 to 12 respectively).
We summarize means and standard deviations for each trial type’s response time and proportion correct (accuracy). In general, faster response times and high accuracy indicate better performance monitoring (Luo & Proctor, Reference Luo and Proctor2022). Incorrect incongruent response times were subtracted from incorrect congruent response times is here referred to the response time congruency effect, based on a typical flanker effect. Similarly, the number of incorrect incongruent trials were subtracted from number of incorrect congruent trials to reflect the congruency effect of accuracy. Both are considered behavioral measures of conflict monitoring. We derive post-error and post-correct response times from previous trial response and response times. For post-error slowing, we used the formula for traditional post-error slowing (PESt), which is the reduction in response time following an error, quantified by the following formula: mRT traditional = mRT post-error – mRT post-correct , where the mean response time (mRT) post-error is subtracted from post-correct (Schroder et al., Reference Schroder, Nickels, Cardenas, Breiger, Perlo and Pizzagalli2020).
Next, to establish a measure of speed-accuracy trade-off (SAT), we calculated a balanced integration score (BIS; Liesefeld & Janczyk, Reference Liesefeld and Janczyk2019). The BIS (Liesefeld & Janczyk, Equation 4) includes the standardized response time (ZRT) of correct trials and the proportion correct (Z
PC): BIS = Z
pc- Z $\overline{RT_{i,j}}$
. We standardized the response time of correct trials and the proportion correct for each age group, incorporating any variance within this age group. A positive BIS indicates that performance was focused on accuracy rather than speed, in contrast to a negative BIS, which suggests that speed was favored over accuracy. Therefore, a value of 0 indicates that the individual equally valued the speed and choice during the task. We display response times, post-error slowing and Balanced Integration Score across ages in Table 2.
$\overline{RT_{i,j}}$
. We standardized the response time of correct trials and the proportion correct for each age group, incorporating any variance within this age group. A positive BIS indicates that performance was focused on accuracy rather than speed, in contrast to a negative BIS, which suggests that speed was favored over accuracy. Therefore, a value of 0 indicates that the individual equally valued the speed and choice during the task. We display response times, post-error slowing and Balanced Integration Score across ages in Table 2.
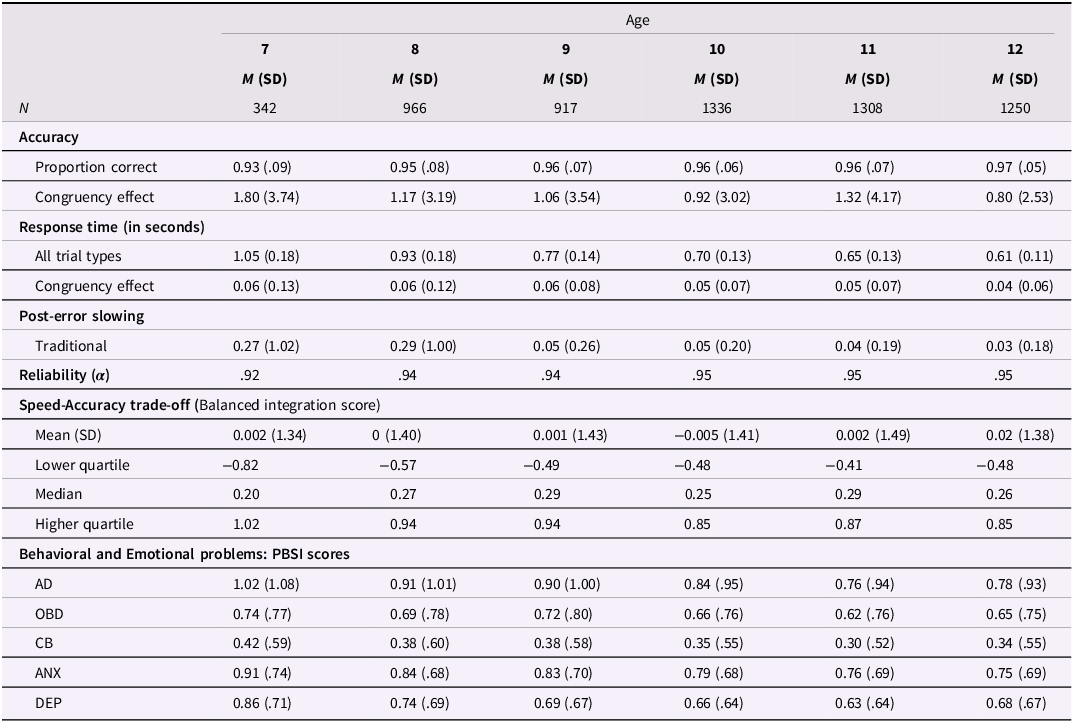
Means and standard deviations for accuracy, response times, post-error slowing, speed-accuracy trade-offs and PBSI scales in 7- to 12-year-old children

Note. AD = Attention-Deficit/Hyperactivity Disorder related behavior; OBD = oppositional defiant-related behavior; CB = conduct-related behavior; ANX = anxiety; DEP = depression symptoms.
Emotional and behavioral problem behavior
Emotional and Behavioral Problem Behavior Emotional and behavioral problems were assessed using the Problem Behavior at School Interview, teacher report (short version; PBSI, Erasmus Medical Center, 2000; Van Lier et al., Reference Van Lier, Muthén, van der Sar and Crijnen2004). This scale is designed to capture behaviors observed by teachers that may indicate underlying mental health concerns or neurodevelopmental differences (e.g. ADHD symptoms). In this 30-item questionnaire, teachers rated children’s’ behavioral and emotional characteristics on five scales: Attention-Deficit/Hyperactivity Disorder-related behavior (AD), oppositional defiant -related behavior (ODB), conduct-related behavior (CB), anxiety- (ANX) and depression related behavior (DEP). The teacher rated behavior on a five-point Likert scale, from 0 (never applicable) to 4 (always applicable). AD behavior was measured through 5 items (range sum scores 0–20; e.g., the child cannot sit still, is hyperactive), where the Cronbach’s alphas (α) for all years ranged between .93 to .94. ODB was covered by 6 items (range sum scores 0–24; e.g., child contradicts a lot; range α = .88 to .95). CB was measured through 8 items (range sum scores 0–32; e.g., child threatens other children; range α = .90 to .96). ANX was measured using 5 items (range sum scores 0–20; e.g., the child is scared at school; range α = .80 to .93) and DEP was measured through 6 items (range sum scores 0–24; e.g., child cries or is sad at school; range α = .77 to .88). Higher mean scores indicate more problems. Table 2 presents the means and standard deviation of the PBSI scales.
Statistical analysis
For descriptive statistics, IBM SPSS 28 was used. We used t-tests or Mann Whitney U Tests to examine gender differences for each age group. To investigate the development of flanker response time, we employed latent growth curve models (LGMs), using the response time of all trial types (congruent and incongruent) as indicators of continuous latent growth factors in Mplus version 8.2 (Muthén & Muthén, Reference Muthén and Muthén2018). In our LGMs, the latent intercepts represent the initial mean response times at age 7, and the latent slope represents the mean rate of change across the ages. A positive slope indicates an increase in response time (slower response as children grow older), and a negative slope indicates a decrease in response time (faster responses as children grow older). Standard errors were adjusted using a sandwich estimator to account for clustering of children in schools (Williams, Reference Williams2000). A robust maximum likelihood estimator (MLR) was employed to deal with (potential) non-normal distributions of the measures.
Full information maximum likelihood (FIML) was used to handle the random missing data. FIML is appropriate for LGM and was therefore chosen to make maximal use of data points, avoiding imputation. Little’s MCAR test was significant for the response times (χ2 = 311.88, p < .01), suggesting that data were not missing completely at random. Yet, response time data were not imputed for several reasons. First, response times are highly variable both between and within individuals, especially in children, due to a range of external (e.g., motivation, attention) and internal (e.g., cognitive processing) factors. We lacked auxiliary variables that would allow for realistic imputation. Additionally, the response time distributions were skewed, and imputations could distort this characteristic. Although we could not formally test for MAR or NMAR mechanisms, missingness was likely due to external factors such as absence due to absence of the child, lack of consent, or technical/practical issues rather than the performance monitoring of the child.
We fitted separate growth models for all constructs (flanker response time and the PBSI scales: ANX, DEP, ODB, AD, CB) to establish the shape of the growth curve: linear, quadratic, or cubic. Models were evaluated when they were most parsimonious and with three model fit indices: the Comparative Fit Index (CFI), Tucker Lewis Index (TLI, Bentler, & Bonnett, Reference Bentler and Bonnett1980) and the Root Mean Square Error of Approximation (RMSEA; Marsh et al., Reference Marsh, Hau and Wen2004). Critical values for CFI ≥ .90, TLI ≥ .95, and RMSEA ≤ .06 were used to determine model fit (Hu & Bentler, Reference Hu and Bentler1999). We explored gender differences by estimating the paths of response time freely across gender and then comparing the model fit to the models where regression paths were equal for boys and girls. To identify which model (the freed or constrained model) best fit the data, we applied the Satorra–Bentler chi-square difference test for nested models (Satorra & Bentler, Reference Satorra and Bentler2001).
Figure S1 in Section 1 of supplementary materials 2 shows a graphical representation of the parallel LGM model. Five parallel-process LGM’s allowed for testing whether level and change in response time were associated with the level and change in behavioral and emotional problems. To this end, the growth parameters of the PBSI scales were regressed on the growth parameters of flanker response times. Possible gender differences in the association between response time and PBSI scales were tested by forcing the parameters to be free across gender and comparing the free model to the model where the growth parameters were constrained (unless otherwise specified). To account for a potential effect of co-occurring mental health problems on the associations, another set of parallel LGM models were conducted as a sensitivity analysis. Results of this analysis, together with the unstandardized regression coefficients for the associations between the growth parameters of response time and the behavioral and emotional problem scales are to be found in table S3, in Section 4 in the supplementary materials S2.
Results
Descriptive statistics
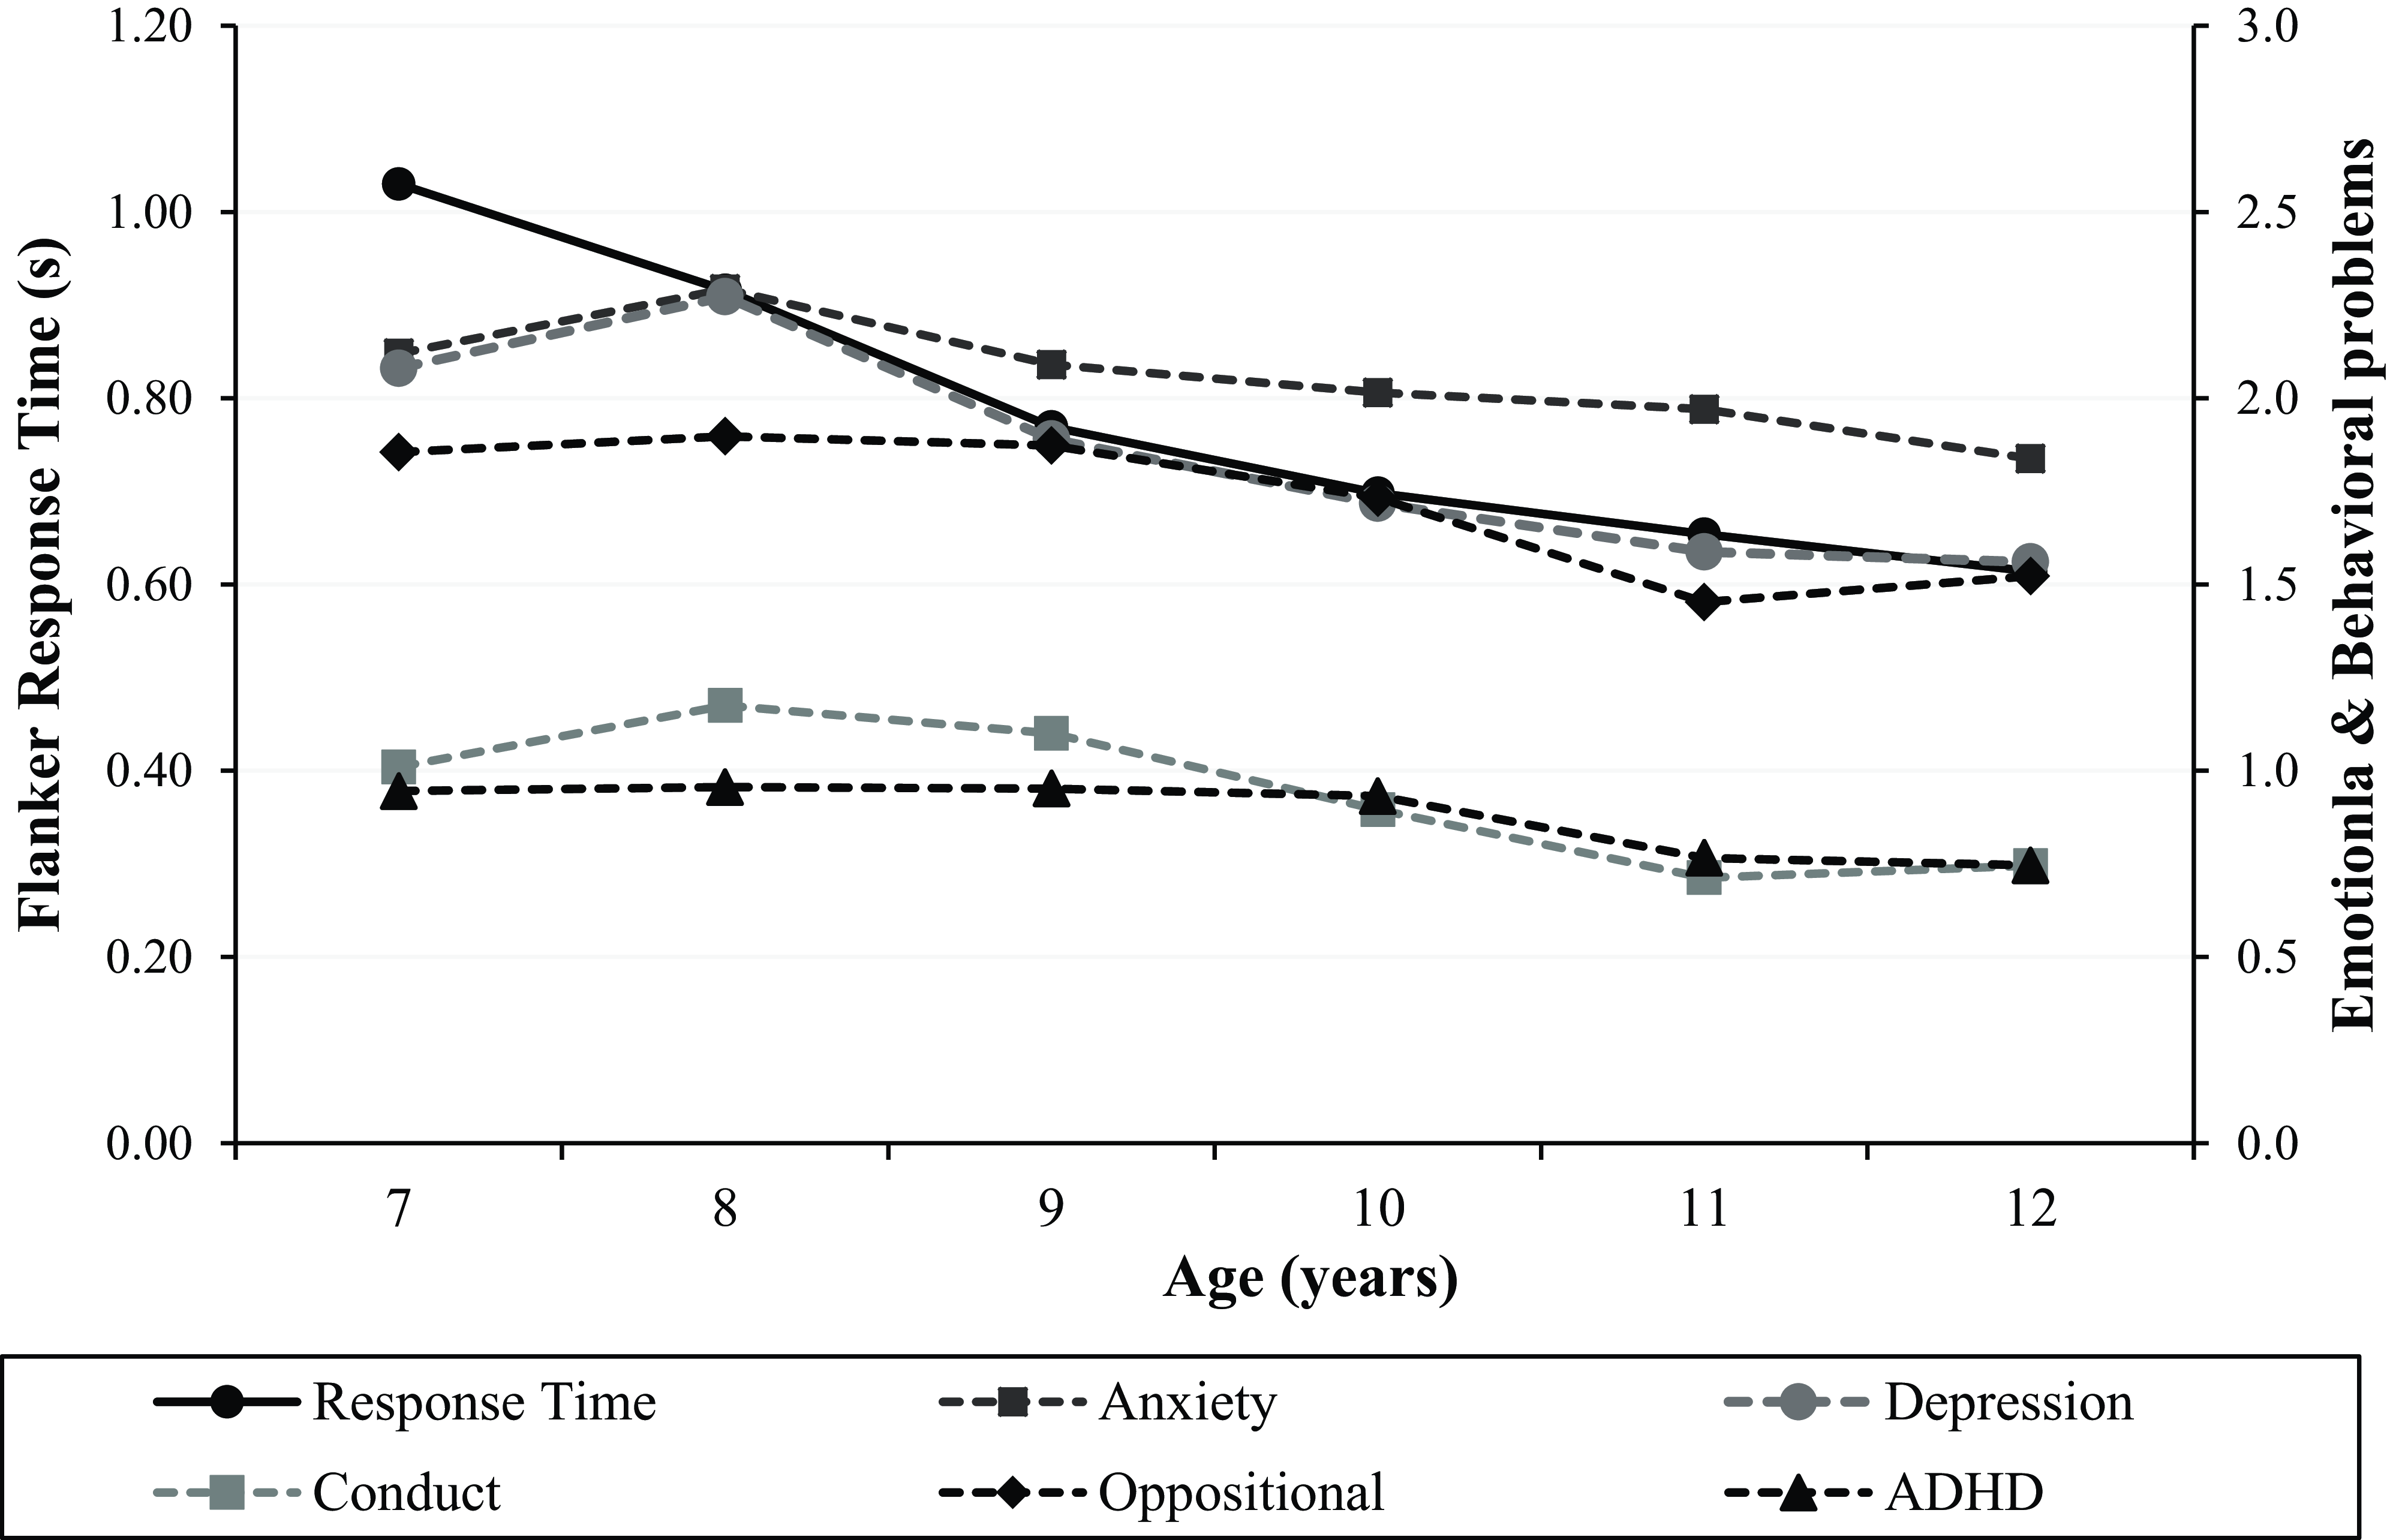
In Table 2, we present the means and standard deviations of different behavioral measures of the flanker task and emotional and behavioral problem behavior between 7 and 12 years old and speed-accuracy trade-offs. Figure 1 displays the flanker reaction time of all trial types and the PBSI scores across 7 to 12 year olds. See supplementary material S1, tab 1 for gender differences tests in all measures and supplementary material S1 tab 2 for a correlation matrix between the response time and PBSI scales. Overall, all children scored low on all emotional and behavioral problem scales during all assessment years, indicating low levels of problems. Also, the emotional and behavioral problem scores decreased linearly across the 5 years (Figure 1). The correlations varied in direction and magnitude across time points and variables, without a consistent pattern.
Response time (in seconds) of all trial types and PBSI scores from age 7 to 12-years.
Performance monitoring indices
We performed LGM’s of proportion correct, response times per trial type and PES to explore the change in these variables over time, since the descriptive information suggests improvement over time. However, all these models had very poor model fit indices and the variances of the slopes were not significant (p > .112), suggesting lack of growth (see Table S1 in supplementary materials S2, Section 2). Almost all the flanker metrics correlated significantly with each other, supporting our choice to only model response time for all trials. For each year, a typical congruency effect in accuracy and response time was observed: there were more errors made on incongruent trials and longer response times for incongruent trials. This means that the typical flanker effect is found at all ages in this sample. T-tests revealed several gender differences at different time points, they can all be viewed in supplementary material S1, tab 1. Briefly, at age 8, 9, 11, and 12, the overall percentage correct was larger for girls than boys. At age 8, boys performed faster on all trial types than girls. At other ages, boys and girls performed similarly. Regarding post-error slowing, overall, children showed longer response time after error trials than after correct trials each year. No gender differences between post-error slowing and most age groups were observed, except at age 11. We encountered large kurtosis (ranging from 0.31 to 17.25) for the speed-accuracy trade-off BIS, driven by a few participants who had poor performance (large range in proportion correct). This is why Table 2 shows the means as well as quartiles for BIS. Most participants in each year had a positive BIS, indicating that most children focused on accuracy rather than on speed. The BIS was mostly driven by the reduction of correct trial response time and high accuracy. Independent-sample Mann–Whitney U test revealed a gender difference in BIS only at 12 years of age, where boys had a larger BIS than girls.
Longitudinal trajectory of flanker response time
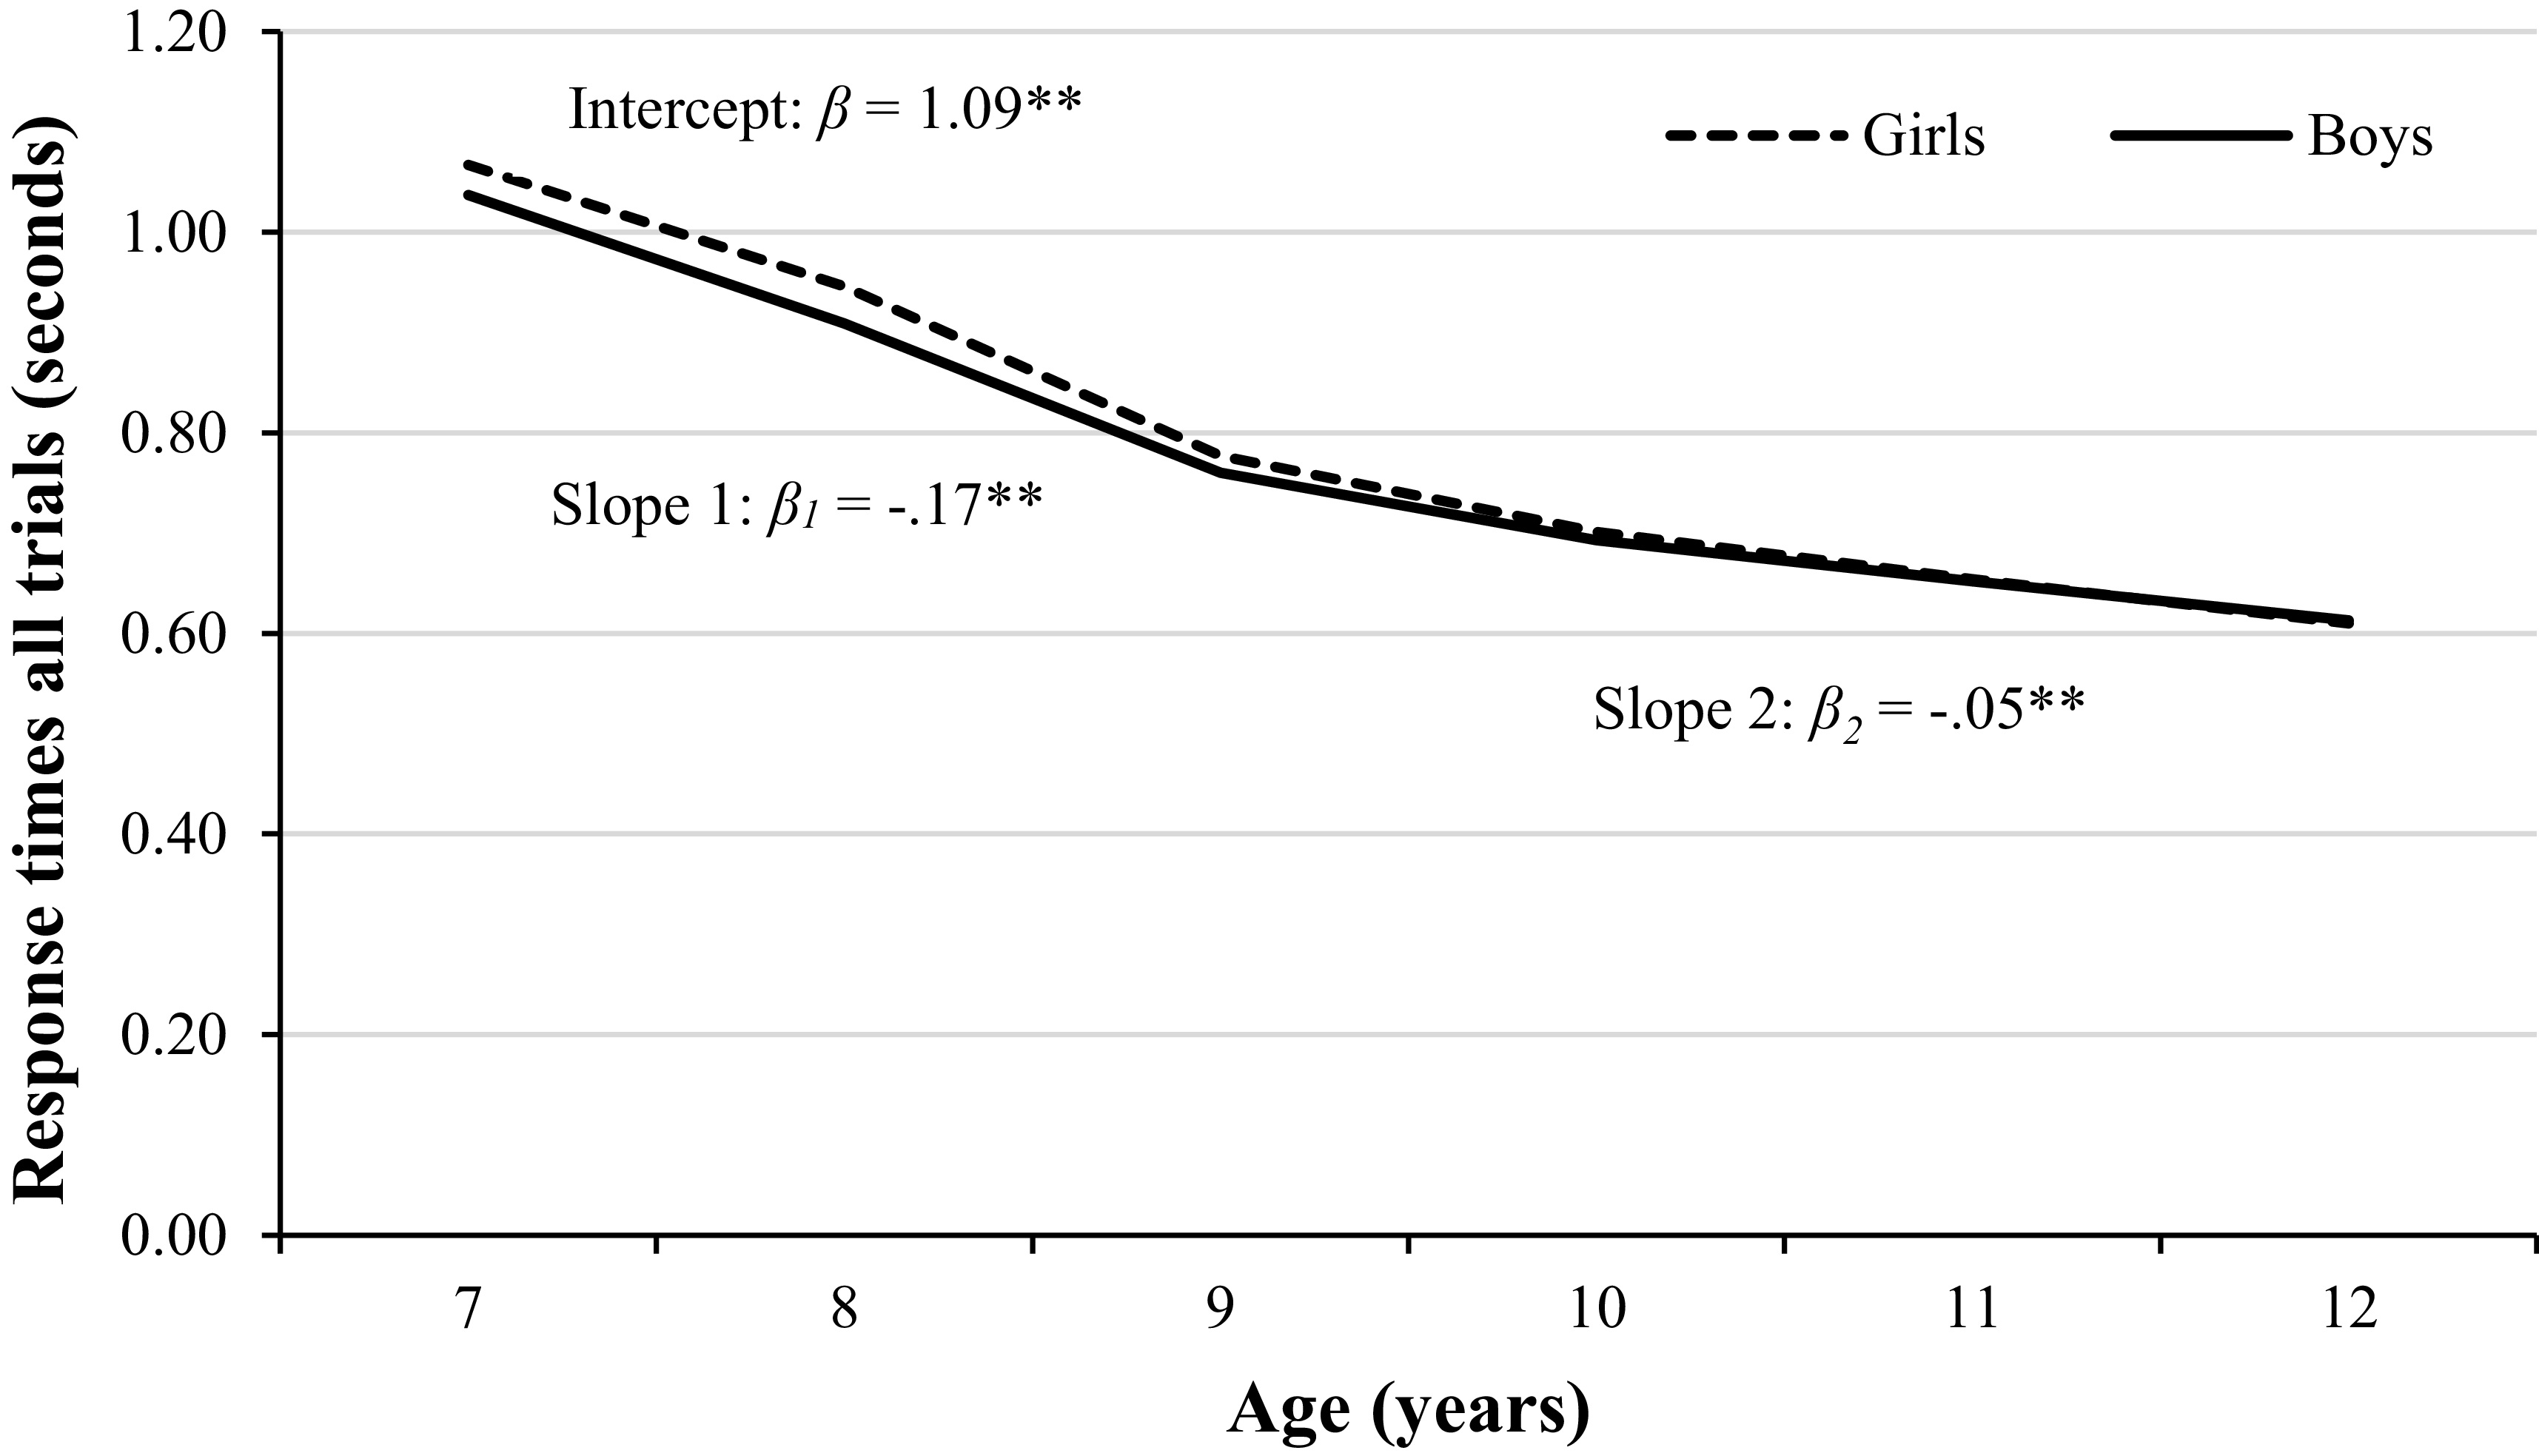
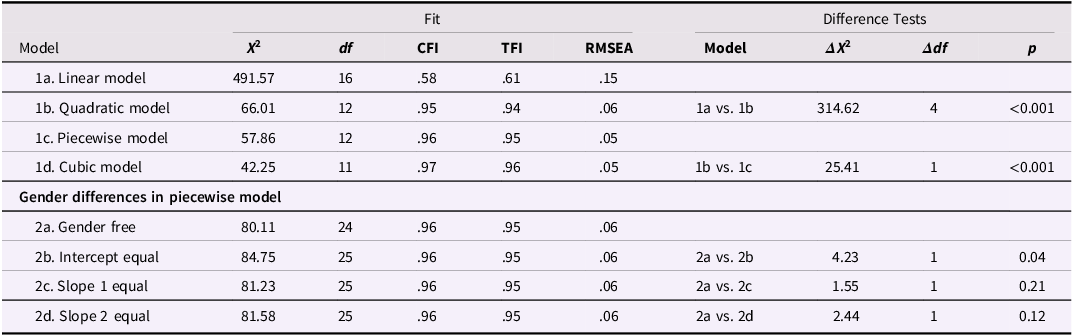
Table 3 presents the model fit indices for the shape of the trajectories and model comparisons testing for gender differences in response times. For flanker response time, a quadratic model improved incremental fit over a linear model and was the most parsimonious model over a cubic model. The quadratic model had good fit measures (Table 3) where overall, children responded a little over one second at age 7 on flanker trials (Mean Intercept β = 1.09, SE = .019, p < 0.001) and response time decreased over time (Mean Slope β linear = −0.18, SE = .011, p < 0.001; Mean Slope β quadratric = −.02, SE = .002, p < 0.001). To allow for a better interpretation of the quadratic slope, we segmented the quadratic slopes into two linear slopes (piecewise analyses), which was ultimately more parsimonious over the quadratic slope. Figure 2 shows the final flanker response times trajectory: the piecewise growth models showed that children’s response times decreased at a faster rate between ages 7 and 9 compared to ages 10 and 12 (Mean Slope age 7 to 9 years old β 1 = −.17, SE = .01, p < 0.001, Mean Slope age 10 to 12 years old β 2 = −.05, SE = .002, p < 0.001). Next, the role of gender in the piecewise flanker response time model was investigated (Table 3). Freeing the intercept across gender significantly improved the model compared to constraining them to be equal for gender (Figure 2), indicating that boys had faster response time at age 7 (M = 1.04, SD = 0.19) than girls (M = 1.07, SD = 0.16). Yet, both slopes were insignificant. In other words, the similar for boys and girls, suggesting that the rate of decline in response times over time was similar across gender.
Response time (in seconds) trajectory of all trial types from age 7 to 12-years. ** p < 0.001.
Model fit and model comparison for response time, gender included

Note. CFI = comparative fit index; TFI = Tucker Lewis Index; RMSEA = root mean square error of approximation.
Associations of flanker response time and problem behavior
Model fit and model comparisons testing for gender differences in behavioral and emotional problems initial level (intercept) and development (slope) are shown in Table S2 in the supplementary materials S2, Section 3. The unstandardized regression coefficients for the associations between the growth parameters of response time and the behavioral and emotional problem scales, including the sensitivity analysis to account for co-occurrence effects, are presented in Table S3, in the supplementary materials S2, Section 4. Figures 3a to 3d show the simplified graphical representations of the associations between the flanker response times and the PBSI scores, including the standardized regression coefficients. Note that parameter constraints based on gender differences at testing level and growth rate in unconditional models for all constructs were retained in the parallel process LGMs.
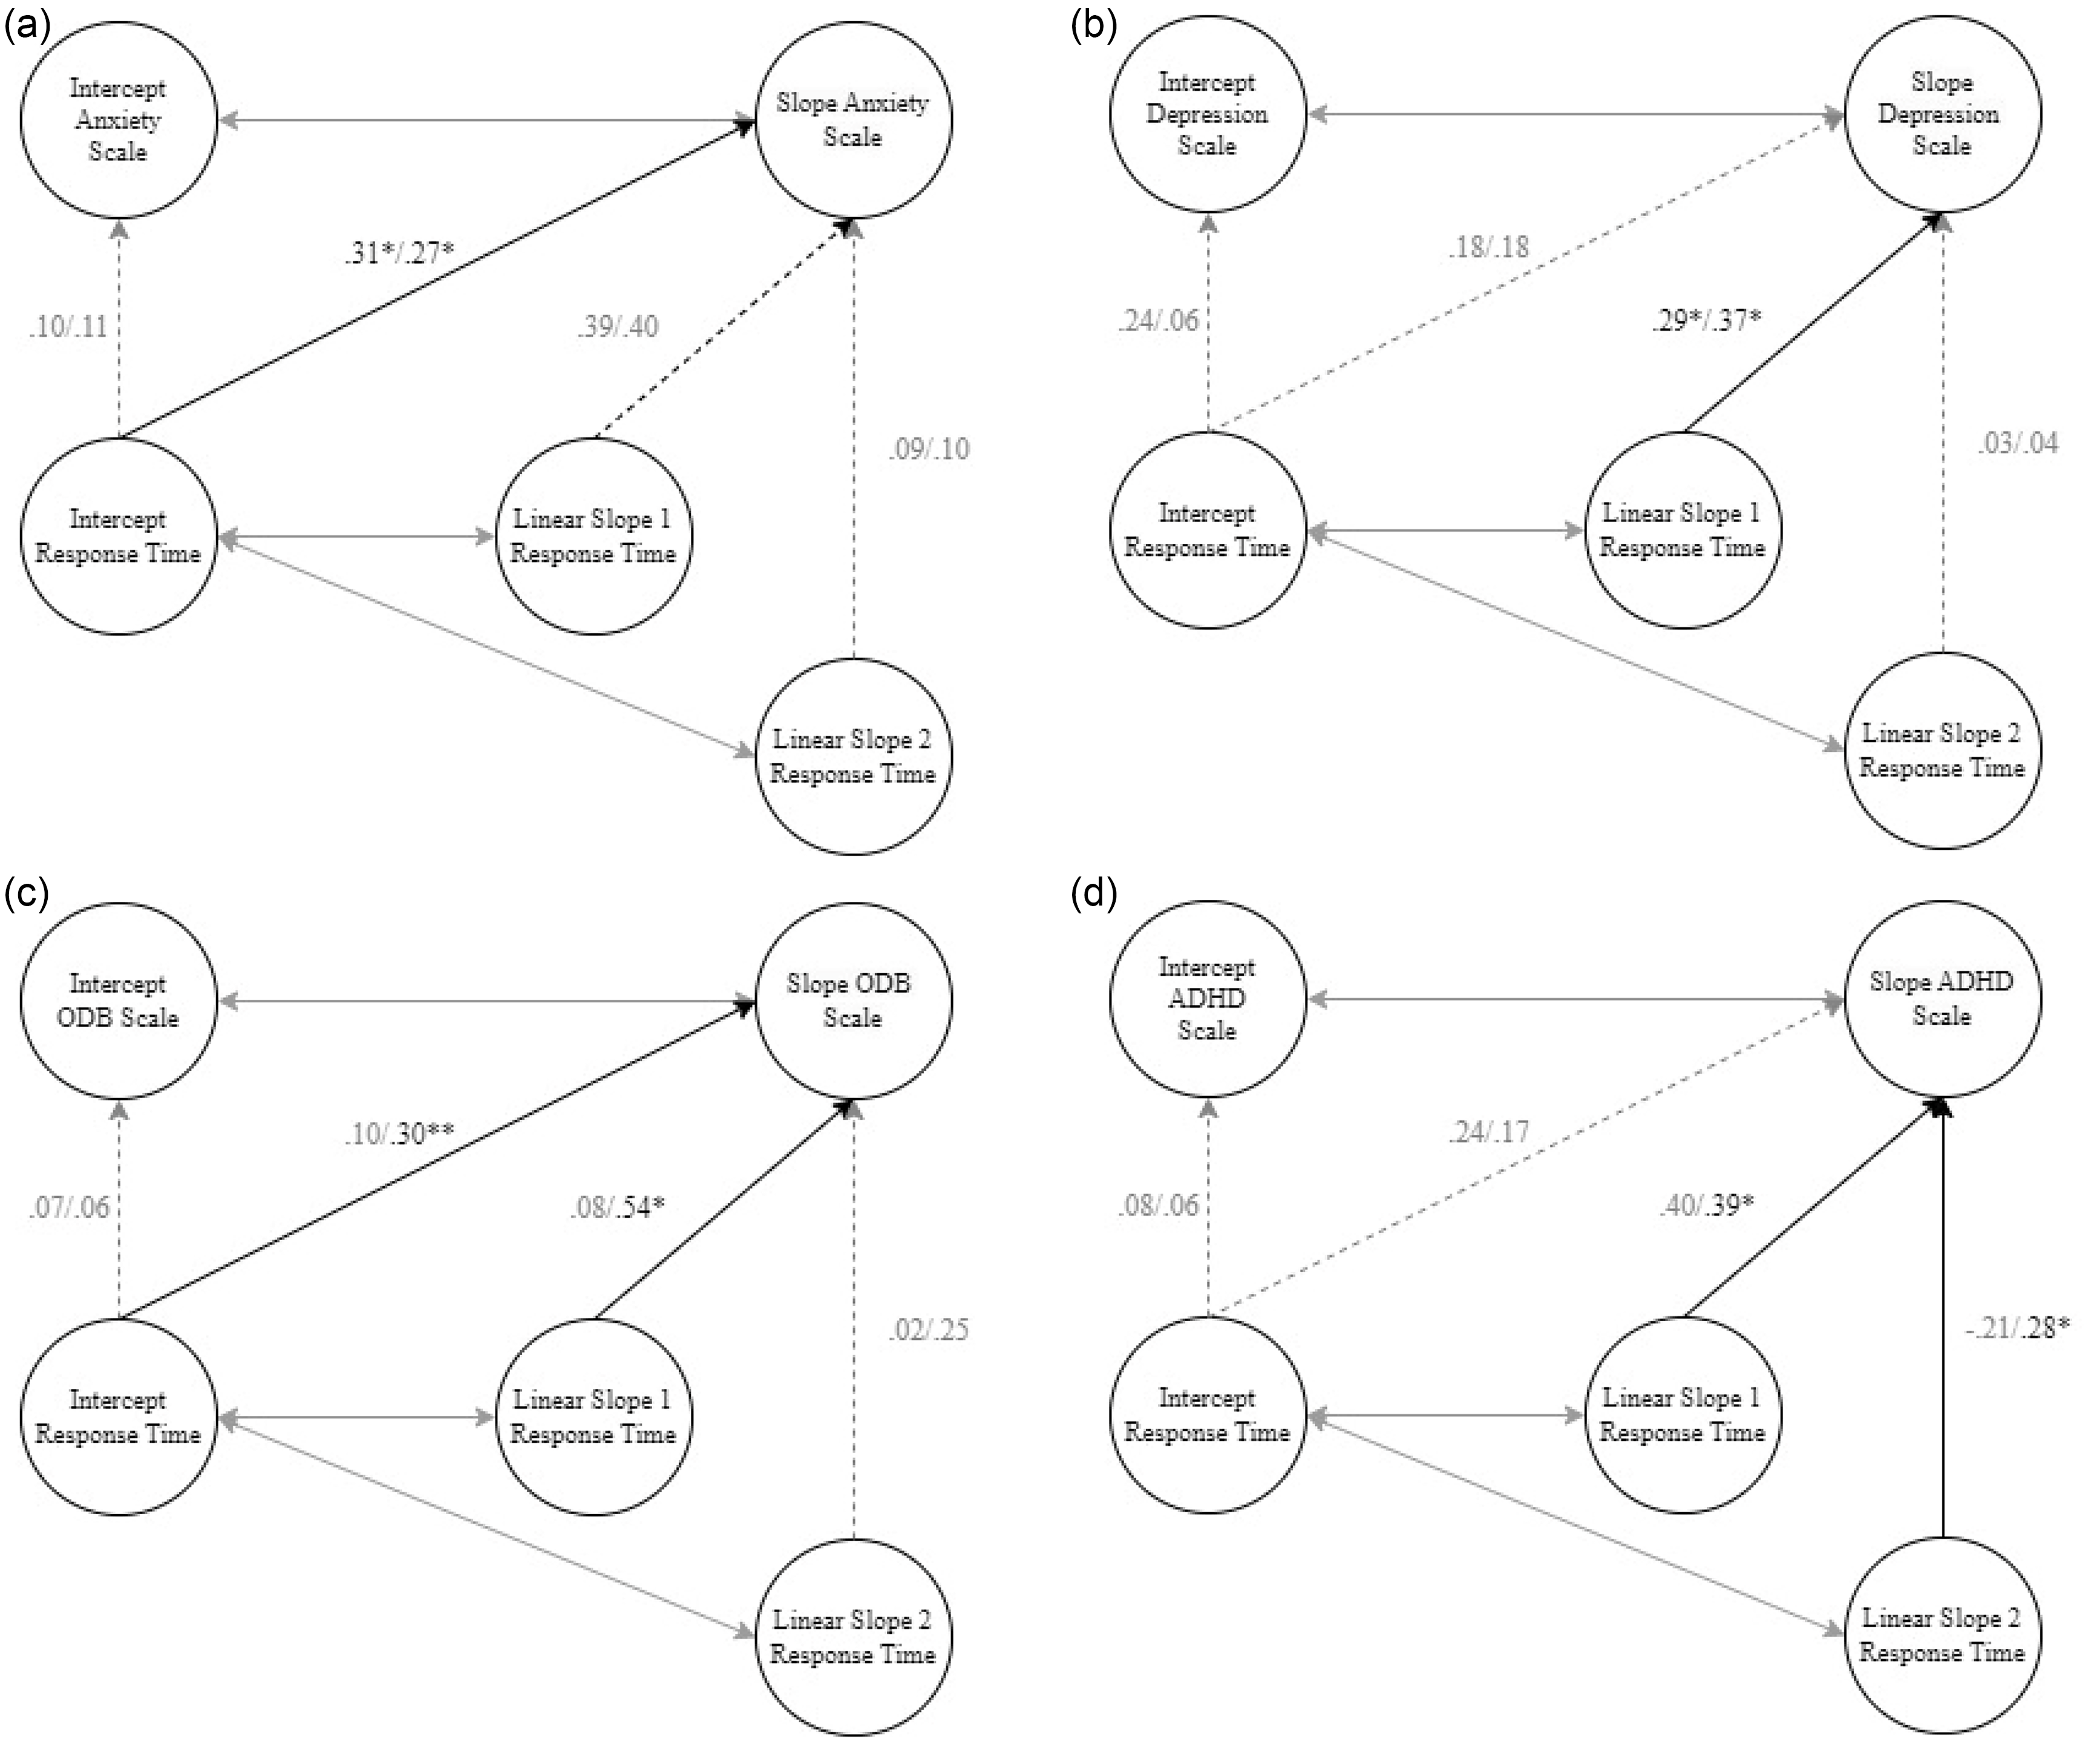
Simplified graphical representation of the associations (including standardized regression coefficients) between flanker response times and (a) PBSI anxiety score. (b) PBSI depression score. (c) PBSI oppositional defiant behavior score. (d) PBSI ADHD score.
Note. Path estimates are standardized regression coefficients. Solid arrow = significant at * p < 0.05 or ** p < 0.001, dashed arrow = insignificant. Gender-specific associations were represented as girls/boys (e.g. .31*/.27*).
Flanker response time and anxiety scale
For anxiety symptoms, there was a positive association between the initial level of response time at age 7 and the slope of anxiety (B = .20, SE = .07, p = .03, 95% CI of B = .07 – .39, β =.31). This suggests that a slower response time at age 7 was associated with a steeper decrease in anxiety scores from age 7 to 12, regardless of gender.
Flanker response time and depression scale
For depression symptoms, there was a positive association between slope of response time at age 7 to 9 years old and the slope of depression scores (B = .51, SE = .23, p = 0.02, 95% CI of B = .07 – .95, β =.37). This indicates that a faster decrease in response time during age 7 to 9 years was linked to a faster decrease in depression scores between 7 and 12 years for boys and girls.
Flanker response time and ADHD scale
For ADHD symptoms, the association between the slope of response time at age 7 to 9 and the slope of ADHD was significant and positive for boys (B = .63, SE = .24, p = .01, 95% CI of B = .16 – 1.11, β = .39), but not significant for girls (p = .27). Similarly, the association between the slope of response time and the slope of ADHD between 10 and 12 years old was significant and positive for boys (B = 1.44, SE = .71, p = .04, 95% CI of B = .05 – 2.83, β =.28), but not significant for girls (p = .49). In other words, a faster decrease in flanker response time was associated with a faster decrease in ADHD symptoms in boys.
Flanker response time and oppositional defiant behavior scale
For OBD symptoms, there was a positive association between the intercept of response time for boys and the slope of OBD scores (B = .17, SE = .08 p = 0.04, 95% CI of B = .01 – .33, β =.30), but not for girls (p = .46). This suggests that for boys, a slower response time at age 7 was linked to a steeper decline of OBD scores between 7 to 12 years. Also, there was a positive association between the slope of response time between 7 and 9 years and the slope of ODB in boys (B = .67, SE = .17, p < 0.001, 95% CI of B = .34 – 1.00, β =.54), but not in girls (p = .85). In other words, 7- to 9-year-olds boys who showed a faster decline of response time tended to show a faster decline in overall OBD scores for boys.
For conduct problems, none of the parameters were significantly (p’s > .20) linked to each other (table S3, supplementary material 2, Section 4). This means that the initiation level and slopes of response time were not related the level and development of conduct problem symptoms.
Discussion
The objective of this study was to explore the development of flanker performance and its association with the development of mental-health-related problems in children attending mainstream elementary schools. The performance monitoring in children improved over time, evidenced by a decrease in response time on all trial types of a flanker task, where the decrease in response time was most noticeable during age 7 to 9 compared to age 10 to 12. Boys initially had lower response times than girls at age 7, but the pattern of response time development was similar for boys and girls. We found associations between initial level response times and anxiety and opposition deviant behavior. We also found associations between the slope of response time between 7 to 9 and slope of problems relating to ADHD, ODB and depression. Finally, there was an association between the slope of response time between 10 and 12 years and the slope of ADHD.
Although this was not a key aim of this study, this study provides a description of flanker performance measures across childhood. Even when we could not model the shape of growth of the other behavioral indices of the flanker performance, the absolute values at each assessment year suggest improved accuracy and a stable speed-accuracy trade-off. These results, together with the reduction of congruency effects in accuracy and response time, illustrate improved conflict monitoring across age 7 to 12 years old. Post-error slowing was larger at age 7 and 8, indicating larger response times after error trials. Yet as the children grew older, children had smaller response times after error-making, suggesting improved error monitoring.
The decline in response time and improved accuracy of the children, is in line with other performance monitoring studies across childhood (Davies et al., Reference Davies, Segalowitz and Gavin2004; Gavin et al., Reference Gavin, Lin and Davies2019; Overbye et al., Reference Overbye, Walhovd, Paus, Fjell, Huster and Tamnes2019). This supports the notion of cognitive control mechanisms become more efficient with age (Luna et al., Reference Luna, Marek, Larsen, Tervo-Clemmens and Chahal2015). Also, our results can be explained the diffusion-drift model (DDM; Dutilh et al., Reference Dutilh, Forstmann, Vandekerckhove and Wagenmakers2013; Hall et al., Reference Hall, Schreiber, Allen and Hallquist2021; Ratcliff & McKoon, Reference Ratcliff and McKoon2008). Briefly, the DDM allows for the translation of task behavior into the components of cognitive processing. In other words: the DDM represents the response time, accuracy and distribution of response times during the decision-making process of two-choice tasks, incorporating the processing of stimuli, noise, and the accumulation of information (Ratcliff & McKoon, Reference Ratcliff and McKoon2008). The non-linear trend of response time can be explained by the typical brain maturation during this age group and into adolescence (e.g., Fuhrmann et al., Reference Fuhrmann, Madsen, Johansen, Baaré and Kievit2022; Ordaz et al., Reference Ordaz, Foran, Velanova and Luna2013) and by the development of brain areas (such as the anterior cingulate cortex) involved in performance monitoring observed through electrophysiological reports (Boen et al., Reference Boen, Quintana, Ladouceur and Tamnes2022; Davies et al., Reference Davies, Segalowitz and Gavin2004; Lo, Reference Lo2018; Overbye et al., Reference Overbye, Walhovd, Paus, Fjell, Huster and Tamnes2019). The observed congruency effect (response time and accuracy) across the ages in the current sample aligns with the conflict monitoring theory (Botvinick et al., Reference Botvinick, Braver, Barch, Carter and Cohen2001). This result corresponds with that of studies that previously investigated conflict adaption in children (Larson et al., Reference Larson, Clawson, Clayson and South2012; Liu et al., Reference Liu, Liu, Shangguan, Sørensen, Liu and Shi2018; Mullane et al., Reference Mullane, Corkum, Klein and McLaughlin2009; van Meel et al., Reference Van Meel, Heslenfeld, Rommelse, Oosterlaan and Sergeant2012). For instance, the response times and accuracy rates of the flanker task performed by the 10-year-olds sample in Liu et al., (Reference Liu, Liu, Shangguan, Sørensen, Liu and Shi2018) and the samples of 6 to 9 years and 10 to 12 years in Van Meel et al. (Reference Van Meel, Heslenfeld, Rommelse, Oosterlaan and Sergeant2012) are similar values to the observed values in the current study. Considering the behavioral measure of error monitoring, the change in post-error slowing around 9 years (and the stable BIS) suggests improved error monitoring at a behavioral level. Although there are various explanations for post-error slowing (Danielmeier & Ullsperger, Reference Danielmeier and Ullsperger2011; Dutilh et al., Reference Dutilh, Vandekerckhove, Forstmann, Keuleers, Brysbaert and Wagenmakers2012), it is likely that children in this sample improved at processing the errors (reduction in error response times), improved focus on task performance and increased in error caution. Overall, results of this large-scale study have an important implication for researchers studying performance monitoring in specific age ranges cross-sectionally: there is more variability in middle childhood (7-10, and most likely already present before 7-year-olds) and we observe age-related changes. These findings have important implications for future research on the development of performance monitoring. Researchers should account for the nonlinear developmental trajectories and the variability during childhood. Therefore, they should be cautious when using broad age groupings, as this can obscure meaningful effects. Additionally, task design (e.g. modified to avoid ceiling effects), sample selection (i.e. considering the age range) and analytic strategies (i.e. using variability as an outcome) should be adapted to accommodate the variability and age-related changes in performance monitoring.
This study identified the same trajectory for boys and girls and cross-sectional gender differences in flanker performance across childhood, similarly to Burton et al. (Reference Burton, Petersen, Eichele, Hemager, Spang, Ellersgaard, Christiani, Greve, Gantriis, Jepsen, Mors, Nordentoft, Thorup, Plessen and Vangkilde2022) and Gavin et al. (Reference Gavin, Lin and Davies2019). However, gender differences in performance monitoring research have not been found consistently (e.g. Gaillard et al., Reference Gaillard, Fehring and Rossell2021), and there is no consensus on their significance. Among adults, females have been found to be more distracted by the congruency effect, as reflected by post-error slowing (Fischer et al., Reference Fischer, Danielmeier, Villiringer, Klein and Ullsperger2016). Neurobiologically, gender differences may be driven by sex-specific changes in the brain development, such as myelination (Giedd & Rapoport, Reference Giedd and Rapoport2010) or connectivity patterns (Hämmerer et al., Reference Hämmerer, Müller and Li2014), particularly in the anterior cingulate cortex (Tamnes et al., Reference Tamnes, Walhovd, Torstveit, Sells and Fjell2013). These results highlight the need for a developmentally sensitive and nuanced approach to gender in performance monitoring research. For now, researchers should continue investigating gender effects, consider gender-specific mechanisms and neurodevelopmental contexts for performance monitoring.
Reports on the emotional and behavioral problems in the current sample decreased as children got older. Although the possibility remains that problems in these domains appear and increase over time for children, the absence of mental health problems observed in this sample reflects what is to be expected from healthy development in children in mainstream schools (Boer et al., Reference Boer, van Dorsselaer, de Looze, de Roos, Brons, van den Eijnden, Monshouwer, Huijnk, Ter Bogt, Vollebergh and Stevens2021). This is likely to be the result of the current recruitment strategy for this study focused on a non-clinical sample of children in mainstream elementary schools. We have observed several associations between the trajectory of response time and scores on four of the five problem behavior scales. The results indicate that if a child has lower response times at age 7 (that is: better task performance compared to a child with higher response times), then the child shows a steeper decline in anxiety and oppositional defiant behavior scores. Thus, faster task response times in younger children can be linked to the reduction in problem behavior during childhood. Also, a steeper decline in response time across 7 to 12 years was associated with a steeper decline in ADHD related behavior, particularly for boys. In addition, early (age 7 to 9) fast decline of response time was related to a faster decline in depressive (both genders) and behavioral problems (ADHD and ODB for boys only), suggesting that the rate of improved task performance is linked to fast decline in problem behavior. It is noteworthy to mention that several associations were not gender specific, suggesting that the link between task performance and depressive and anxiety problems in children is equally important for both genders during childhood. The lack of gender differences in this link is informative for the use of cognitive control measures when investigating psychopathology.
The associations between task performance and emotional and behavioral problems) has implications for psychopathology research and for when these tasks are used in clinical settings. Some clinical test batteries use performance monitoring tasks (e.g., in the Netherlands: Amsterdamse Neurologische taken; ANT, de Sonneville, Reference de Sonneville1996) as supportive evidence during diagnosis (e.g. ADHD). Results of this study suggest that age and gender are important matters when considering possible cut-offs. Furthermore, more evidence is needed to evaluate whether performance monitoring tasks are of predictive and additive value during the diagnostic process. By linking age-related improvements in performance monitoring to emotional and behavioral symptoms, this study provides a hypothesis-generating foundation for understanding how trajectories of cognitive control contribute to the emergence and remission of psychopathology across development. To our knowledge, there are no studies yet that investigate the link between changes in task performance and the change of problem symptoms during childhood. However, differences in task behavior (cross-sectionally) between children with and without anxiety and ADHD-related behavior have been frequently reported (e.g., Mullane et al., Reference Mullane, Corkum, Klein and McLaughlin2009). On a final note, the sensitivity analysis in which we controlled for in the possibility of co-occurring mental health problems, revealed that there are shared and unique effects of mental health in the associations. Future research should further explore these effects by disentangling the mechanisms through which co-occurring symptoms interact with performance monitoring and by investigating potential underlying factors that drive these associations over time.
The current study has several limitations. First, a possible limitation regards the current sample, which included primarily Caucasian children from mainstream elementary schools. The included schools were a convenience sample, introducing a possible bias not including unrepresented samples. Our sample primarily consists of children with middle to high SES, which limits the generalizability of our results to children from lower SES contexts. Prior research have demonstrated an association between lower SES and an increased risk for both executive functioning difficulties (Lawson et al., Reference Lawson, Hook and Farah2018) and mental health problems in children (Reiss, Reference Reiss2013). Therefore, future studies should examine whether similar developmental patterns are observed in more socioeconomically diverse samples. Also, we do not have records on whether children in these schools had any diagnosed learning or psychological disorders. It is possible that children diagnosed with psychological problems, of which it is known that performance monitoring can be affected, are included in this sample. Second, the current study used the PBSI, a teacher informed measure on problem behavior observed in the school context. Although scores PBSI could be an accurate substrate of daily maladaptive behavior (especially for ADHD related behavior in schools) and a good substitute for behavioral reports for young children (who might have a reduced ability to self-reflect on their behavior), adding self-report or multi-informant measures can give a more comprehensive view of psychological problems. The absence of self-reported mental health data limits our ability to capture children’s internal, subjective experiences, particularly for internalizing symptoms that may not be evident to external observers. Last, while there were associations between response time and problem behavior, we cannot draw any conclusions about the directionality of these associations. Our primary goal was to model intra-individual change across development and test for associations as an initial step. We based the directionality of the effects on theoretical assumptions; however, bidirectional or reverse directions of the associations are possible. Future research should refine theoretical frameworks and to gather empirical evidence to inform hypotheses about the temporal ordering of the effects between performance monitoring and psychopathology. These directionality hypotheses can then be tested using (random intercept) cross-lagged panel models. Also, the current study investigated performance monitoring on a behavioral level. With the addition of electrophysiological measures, examining the underlying brain processing of the conflict and error monitoring, insight can be given in the complex relation between task behavior and the processes that drive daily maladaptive functioning.
The results of the current study help to pinpoint several future research avenues. Task-related variables of influence, such as response-to-stimulus intervals (Smulders et al., Reference Smulders, Soetens and van der Molen2016) or trial type expectancy (Gratton et al., Reference Gratton, Coles and Donchin1992) were not investigated here. Also, individual behavioral change or conflict adaptation within the task (between trials), task difficulty and the order of trial types (which determine the level of accumulated conflict) are known to influence the performance in subsequent trials (Larson et al., Reference Larson, Clawson, Clayson and South2012; Liu et al., Reference Liu, Liu, Shangguan, Sørensen, Liu and Shi2018). Investigating these behavioral adaptation phenomena over time in children can inform research on the development of cognitive control abilities and emerging psychopathology. Person-centered (e.g. latent class growth analysis) and transdiagnostic (symptom dimensions) approaches may further our understanding on how performance monitoring contribute to the etiology of disorders. With the current knowledge on performance monitoring through behavioral studies and other neurophysiological studies, it is time to investigate how individual differences in task performance are related to brain changes (e.g., Tamnes et al., Reference Tamnes, Fjell, Westlye, Østby and Walhovd2012), contribute to symptomatology (e.g., Clayson et al., Reference Clayson, Rocha, Baldwin, Rast and Larson2022) and maladaptive behavior in longitudinal designs.
Conclusion
Our study is a unique investigation of the developmental trajectory of flanker performance and has explored the associations with problem behavior in elementary school children. Improvement of flanker performance over time was observed, which illustrates the normative development of performance monitoring in 7- to 12-year-old children. We found that flanker performance is associated with problems in anxiety, depression, and ADHD- and oppositional-related behavior during childhood and that there are specific gender differences in these associations. The current study illustrates the significance of behavioral indices of cognitive control development and pinpoints an important link with psychological problems in children.
Supplementary material
The supplementary material for this article can be found at https://doi.org/10.1017/S0954579425100692.
Data availability statement
There is no preregistration for this project. Data is available through request through MCL or MJB. Data analysis scripts are available through https://osf.io/xqg86/.
Acknowledgments
Thank you Alex van der Jagt for your assistance in data coordination and management and Yolijn Aarts for data cleaning. We are grateful to all the students and research assistants, schools, parents, teachers and children who aided or participated in the “Happy Children, Happy Adolescents?” study.
Funding statement
-
Erasmus Initiatives for Vital Cities and Citizens, Erasmus University Rotterdam, the Netherlands (MCL);
-
European Research Council under the European Union’s Horizon 2020 research and innovation program [grant numbers 646594, 648082];
-
Netherlands Organization for Scientific Research, program medium sized investments [grant number 480-13-006];
-
ZonMW subsidy: Netherlands Organization for Health Research and Development, program Youth [grant number 157004001].
Competing interests
The authors declare that they have no conflict of interest.


 Open access