

1. Introduction
For over a decade, Nigeria has been contending with violent clashes between nomadic pastoralists and sedentary communities, especially farmers engaged in crop cultivation. Although such conflicts are common across Africa, particularly in the Sahel region, Nigeria stands out because a disproportionate number of them happen there. Data from the Armed Conflict Location and Events Data Project (ACLED) (Raleigh et al., Reference Raleigh, Linke, Hegre and Karlsen2010) show that between 1997 and 2022, there were over 7,500 conflicts in Africa in which at least one of the parties was a pastoralist. These incidents spanned 38 countries, and Nigeria alone accounted for 31 per cent of them. However, the incidents are unevenly distributed across Nigeria, with some states disproportionately affected. For example, Plateau, Benue and Kaduna – only three of Nigeria's 36 states – account for 44 per cent of the more than 2,000 incidents recorded in the country during this period (see Table A7 in the online appendix).Footnote 1
Research on pastoral conflicts frequently identifies resource competition as a central driver (Issifu et al., Reference Issifu, Darko and Paalo2022; Eberle et al., Reference Eberle, Rohner and Thoenig2025; McGuirk and Nunn, Reference McGuirk and Nunn2025). The adverse effects of a changing climate, such as droughts and rising temperatures, have depleted arable land and reduced water availability, thereby intensifying competition between farmers and pastoralists. Since both groups depend on these vital resources for their livelihoods, scarcity increases the likelihood of violent clashes (Homer-Dixon, Reference Homer-Dixon1994; Koubi, Reference Koubi2019; Eberle et al., Reference Eberle, Rohner and Thoenig2025). Farmers rely on land for crop cultivation and on water for irrigation, particularly during dry seasons when rainfall is scarce. Similarly, pastoralists depend on pastureland for grazing and water sources to sustain their livestock. An extension of this argument emphasizes mobility: as climate change diminishes traditional grazing areas, pastoralists are increasingly forced to migrate to new locations. These movements often bring them into closer contact with settled farming communities, further escalating competition and fuelling conflict over already limited resources (Lenshie et al., Reference Lenshie, Okengwu, Ogbonna and Ezeibe2021; Issifu et al., Reference Issifu, Darko and Paalo2022; McGuirk and Nunn, Reference McGuirk and Nunn2025).
A recent body of research has highlighted the ethnoreligious dimension of pastoral conflicts. For example, using representative survey data from Nigeria, Tuki (Reference Tuki2025a) found that pastoralist conflicts were more likely to occur in districts where the population was predominantly Christian than in those where it was mainly Muslim. He argued that, because pastoralists were Muslims, the shared religion of Islam created a baseline of mutual trust that made it easier to resolve disputes over land and water resources when they came into contact with Muslim farmers.Footnote 2 In contrast, the risk of conflict was heightened when pastoralists interacted with Christian farmers, because the two groups adhered to different religions. Similarly, in a qualitative study conducted in Nigeria's Benue Valley region, which also records a high incidence of pastoralist conflicts, Nwankwo (Reference Nwankwo2024a, Reference Nwankwo2024b) found that the local populations – who are mainly Christian – interpreted the conflicts through a religious lens. Christian farmers, in particular, viewed them as an attempt by Muslim herders to take over their land and convert the population to Islam.
Furthermore, pastoral conflicts have deepened existing religious cleavages across the country. Even without these conflicts, Nigeria has a history of violent clashes between Muslims and Christians – its two major religious groups – often driven by competition for political and economic dominance (Angerbrandt, Reference Angerbrandt2011, Reference Angerbrandt2018; Suberu, Reference Suberu2013; Vinson, Reference Vinson2017; Scacco and Warren, Reference Scacco, Warren, Cammett and Jones2021).Footnote 3 It is thus not surprising that reports by the Christian Association of Nigeria portray pastoral conflicts as attacks on Christians by Muslims, owing to the Muslim identity of nomadic pastoralists (Christian Association of Nigeria, 2018a, 2018b). Moreover, the Nigerian news media often report on pastoral conflicts in ways that primarily ascribe blame to pastoralists and highlight both their Fulani ethnicity and Muslim affiliation (Chiluwa and Chiluwa, Reference Chiluwa and Chiluwa2022).
Several studies have been conducted on pastoral conflicts in Nigeria, some of which focus on how sedentary communities perceive nomadic Fulani pastoralists (e.g., Higazi, Reference Higazi2016; Chukwuma, Reference Chukwuma2020; Eke, Reference Eke2020; Ejiofor, Reference Ejiofor2022). Yet, a notable gap remains in large-N empirical research examining how exposure to these conflicts influences distrust towards members of the Fulani ethnic group and the broader Muslim population, or how this effect varies between Muslims and Christians. This study seeks to address these gaps using novel survey data collected in the Northern Nigerian state of Kaduna as part of the Transnational Perspectives on Migration and Integration (TRANSMIT) research project (TRANSMIT, 2025). Notably, Kaduna has the third-highest incidence of pastoral conflicts among Nigeria's 36 states. In this study, we focus specifically on how sedentary communities perceive members of the Fulani ethnic group and the larger Muslim population for two reasons. First, the available survey data are centred on sedentary populations. Second, the measure of exposure to pastoral conflict links respondents’ geolocations to nearby conflict incidents. Applying this method to pastoralists would be difficult because of their nomadic lifestyle.
This study finds that among the population in Kaduna, exposure to pastoral conflict leads to distrust in both members of the Fulani ethnic group and the broader Muslim population. This suggests a contagion effect whereby people conflate the Fulani with the broader Muslim community because of their shared religion, Islam.Footnote 4 Disaggregating the data by religious affiliation reveals a pattern: among Muslims, exposure to pastoral conflict also has a positive effect on distrust in both the Fulani and Muslims. Among Christians, however, pastoral conflict is statistically insignificant. The positive effect among Muslims indicates that exposure to pastoral conflict weakens in-group cohesion, leading to distrust in both the Fulani and Muslims. The null finding among Christians may be because, even in the absence of pastoral conflicts, Christians in Kaduna already exhibit high levels of distrust towards Muslims, given the long history of animosity between the two religious groups (Ibrahim, Reference Ibrahim1989; Suberu, Reference Suberu2013; Angerbrandt, Reference Angerbrandt2018). In this way, pastoral conflicts appear to fit into pre-existing religious cleavages.
The rest of this study is organized as follows. Section 2 reviews the relevant literature and outlines the hypotheses. Section 3 introduces the data, operationalizes the variables used in the regression models, and discusses the empirical strategy. Section 4 presents the regression results, Section 5 discusses the findings and Section 6 summarizes the study and concludes.
2. Theoretical considerations
The negative effects of conflict extend beyond material losses; they also erode the bonds that hold individuals within a society together. These bonds, commonly referred to as social cohesion, are defined as ‘the vertical and horizontal relations among members of society and the state that hold society together. Social cohesion is characterised by a set of attitudes and behavioural manifestations that includes trust, an inclusive identity and cooperation for the common good’ (Leininger et al., Reference Leininger, Burchi, Fiedler, Mross, Nowack, Von Schiller, Sommer, Strupat and Ziaja2021, p. 3). While the present study focuses primarily on the trust dimension of social cohesion and how it is shaped by conflict, it also considers the role of identity, examining how religion influences levels of trust.
Existing research provides evidence for the strong relationship between conflict and trust. For example, Rohner et al. (Reference Rohner, Thoenig and Zilibotti2013b) developed a theory which posits that conflict erodes trust, which in turn fuels further conflict. As they concisely put it, ‘a war today carries the seed of distrust and future conflict’ (Rohner et al., Reference Rohner, Thoenig and Zilibotti2013b, p. 1,115). They recommended inter-ethnic trade and policies that emphasize shared national identity over narrow ethnic identities as ways of fostering empathy, tolerance, cooperation and ultimately social cohesion. In a follow-up study, Rohner et al. (Reference Rohner, Thoenig and Zilibotti2013a) tested these ideas using survey data from Uganda. Their analysis showed that increases in violence and fatalities significantly reduced trust in fellow Ugandans, made ethnic divisions salient and increased the risk of renewed conflict.
In a study conducted in Sri Lanka, Greiner and Filsinger (Reference Greiner and Filsinger2022) found that, among members of the Tamil ethnic group, individuals exposed to war-related sexual violence displayed higher levels of distrust towards members of the dominant Sinhalese ethnic group. Likewise, in a study spanning 14 African countries, Lewis and Topal (Reference Lewis and Topal2023) showed that an increase in the incidence of conflict around individuals’ geolocations was associated with lower levels of intergroup trust. Using representative survey data for the Nigerian population, Tuki (Reference Tuki2025d) found that exposure to violent conflict made Nigerians hesitant to accept people of a different ethnicity or religion as neighbours. He explained this finding on the grounds that the threat posed by violent conflict strengthened cohesion among in-group members while eroding trust in out-group members – a mechanism that was especially strong when the opposing party to the conflict constituted a distinct cultural group. The negative correlation between conflict and trust has also been corroborated by studies in Tajikistan (Cassar et al., Reference Cassar, Grosjean and Whitt2013), Kosovo (Kijewski and Freitag, Reference Kijewski and Freitag2018), Kenya (Schutte et al., Reference Schutte, Ruhe and Linke2022) and Nepal (De Juan and Pierskalla, Reference De Juan and Pierskalla2016).Footnote 5
Returning to the Nigerian case, it is important to note that nomadic pastoralists represent only a small proportion of the broader Fulani population, and the Fulani themselves constitute only a fraction of Nigeria's larger Muslim community. Nonetheless, we expect that individuals exposed to pastoral conflicts will display lower levels of trust not only towards members of the Fulani ethnic group but also towards Muslims more broadly, because of the ethnic and religious identity of the nomadic pastoralists.Footnote 6 This expectation draws on the concept of vicarious retribution, which occurs when members of a group retaliate against an out-group not for direct harm done to them personally, but for harm inflicted on fellow in-group members (Lickel et al., Reference Lickel, Miller, Stenstrom, Denson and Schmader2006, pp. 372–373). In such cases, out-group members are targeted not because they were involved in the initial provocation but because they are perceived as belonging to the same group as the perpetrators. Central to this process is the concept of entitativity – the degree to which a group is viewed as a unified and homogeneous entity. When an out-group is perceived as highly cohesive, its members are more likely to be collectively blamed and subjected to retribution for the actions of a few (Lickel et al., Reference Lickel, Miller, Stenstrom, Denson and Schmader2006, p. 379).
Empirical evidence supports this logic. Hanes and Machin (Reference Hanes and Machin2014), for instance, found that hate crimes against Asians and Arabs (predominantly Muslims) in the United Kingdom surged in the aftermath of both the 11 September 2001 (9/11) attacks in the United States and the 7 July 2005, terrorist attack in London. They argued that negative media portrayals of Muslims following these events shaped public attitudes, which subsequently translated into direct hostilities towards Muslims. Moreover, they observed that even a year later, the incidence of hate crimes against Muslims remained high. In another UK-based study, Ahmed (Reference Ahmed2019) found that the 9/11 attacks prompted the British government to shift its emphasis from the Asian identity of British Muslims to their religious identity. Similar findings of heightened prejudice against Muslims and Sikhs in the wake of the 9/11 attacks have been reported in the Netherlands (González et al., Reference González, Verkuyten, Weesie and Poppe2008), the United States (Ahluwalia, Reference Ahluwalia2011; Disha et al., Reference Disha, Cavendish and King2011; Singh, Reference Singh2013) and Australia (Goel, Reference Goel2010).
The discussion thus far leads to the first hypothesis this study seeks to test:
H1: Among the population in the Nigerian state of Kaduna, exposure to pastoral conflict has a positive effect on distrust towards members of the Fulani ethnic group and Muslims.
To better understand how this effect might operate, it is important to consider the mechanisms through which exposure to pastoral conflict shapes trust among both Muslims and Christians. Mirroring the broader Nigerian population, Kaduna's population is also almost evenly divided between the two groups, with Muslims slightly more numerous.Footnote 7 Moreover, Muslims dominate the northern region of the state while Christians are dominant in the south. Because both Muslim and Christian sedentary communities have been affected by pastoralist conflict, we expect that exposure to such conflict would increase distrust in the Fulani and Muslims among both groups.Footnote 8
However, despite this similar expectation, the mechanisms leading to the outcome may differ. Among Muslims, exposure to pastoral conflict is likely to influence distrust through the erosion of in-group trust. Because of their shared religion, attacks on Muslim communities by pastoralists may foster a sense of betrayal, thereby lowering trust in both the Fulani and Muslims more generally. This dynamic reflects the unifying role of religion in the Nigerian context, where religious identity often overrides ethnic or national identification. A study by Tuki (Reference Tuki2024a, p. 8) underscores this salience: 74 per cent of Kaduna residents identified religion as the most important aspect of their identity, compared to only 5 per cent for ethnicity and 4 per cent for nationality. The remaining 16 per cent reported that their ethnicity, religion and nationality were equally important.Footnote 9
In contrast, among Christians, the pathway through which exposure to pastoral conflict erodes trust in the Fulani and Muslims is likely tied to the increased salience of ethnic and religious fault lines. In other words, the difference in religious affiliation between Christian communities and nomadic pastoralists makes it easier for Christians to establish in-group out-group distinctions. It is important to note that even in the absence of pastoral conflicts, Kaduna's population was already polarized along religious lines.Footnote 10 This polarization, underpinned by the struggle for political and economic dominance, has often resulted in violent clashes between Muslims and Christians. Examples include the Sharia crisis of 2000 (Human Rights Watch, 2003; Angerbrandt, Reference Angerbrandt2011), the 2011 post-election crisis that erupted when a Christian won the presidential election (Human Rights Watch, 2011), the Kafanchan crisis of March 1987, and the Zangon Katab riots of February and May 1992 (Suberu, Reference Suberu2013, pp. 42–44), among others.
The discussion so far leads to the following hypotheses:
H2a: Among Muslims in Kaduna, exposure to pastoral conflict has a positive effect on distrust in both members of the Fulani ethnic group and Muslims.
H2b: Among Christians in Kaduna, exposure to pastoral conflict has a positive effect on distrust in both the Fulani and Muslims.
3. Data and methods
3.1. Sampling strategy
As part of the TRANSMIT research project (TRANSMIT, 2025), the WZB Berlin Social Science Center in Germany conducted a survey in the northern Nigerian state of Kaduna in 2021.Footnote 11 A total of 1,353 respondents were interviewed. Sampling followed a multi-stage clustered random approach. Four of the 23 local government areas (LGAs; i.e., municipalities) in Kaduna (i.e., Giwa, Birnin Gwari, Kauru and Zangon Kataf) were unsafe for the enumerators to conduct interviews in due to the high risk of intercommunal conflict and banditry, hence they were excluded from the sampling frame.
To implement the sampling, 5 × 5 km grid cells (referred to as precincts) were created using QGIS software and overlaid on administrative boundary shapefiles. Each precinct was further divided into 0.5 × 0.5 km cells. Precincts were randomly selected with replacement, with probabilities proportional to population size. Within each precinct, smaller grid cells were then drawn without replacement, again proportional to population. In each selected grid cell, enumerators interviewed an average of 12 households. Households were chosen through a random walk, and one respondent per household was selected by simple random draw.
Respondents were required to be at least 15 years old. For minors under 18, consent was obtained first from the household head and then from the minor directly. All respondents were informed of the survey's purpose, the nature of the questions and the intended use of the data. Enumerators proceeded with the interviews only once consent was granted, and participants were reminded that they could withdraw at any time.
To ensure that the exclusion of the four LGAs did not skew the sample, the sample was stratified according to the population size in the senatorial district. Each Nigerian state is divided into three senatorial districts, themselves subdivided into LGAs. Samples were drawn within each of the senatorial districts in relation to their respective population shares. Because Nigeria's last official census was conducted in 2006, population data were drawn from the 2020 WorldPop gridded dataset (Bondarenko et al., Reference Bondarenko, Kerr, Sorichetta and Tatem2020).
3.2. Measures
3.2.1. Dependent variables
Distrust Fulani. This variable was derived from the question, ‘How much do you trust people of the Fulani ethnic group?’ with responses measured on a scale with five ordinal categories ranging from ‘0 = trust completely’ to ‘4 = do not trust at all’. ‘Don't know’ and ‘refused to answer’ responses were treated as missing. This rule was applied to all variables derived from the survey data.
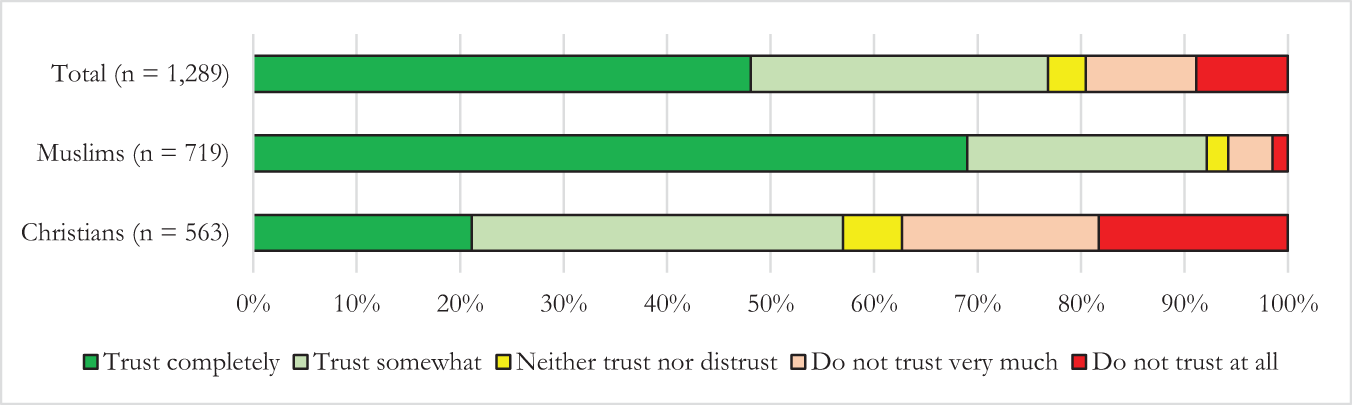
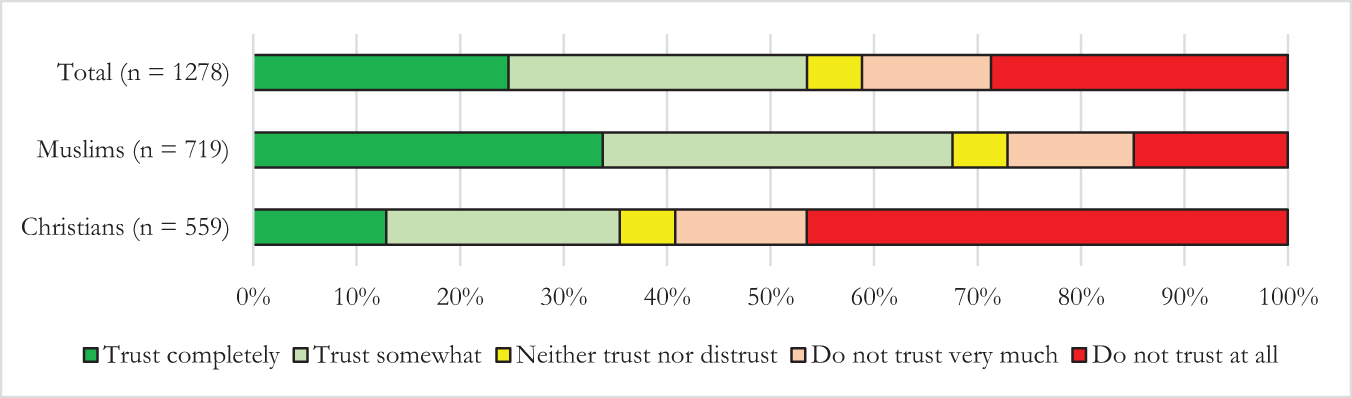
As shown in Figure 1, 41 per cent of the population chose either the ‘do not trust at all’ or the ‘do not trust very much’ response categories. Disaggregating the data based on religious affiliation revealed that Christians are more distrustful of the Fulani than Muslims. Sixty per cent of Christians chose either the ‘do not trust at all’ or ‘do not trust very much’ response categories, compared to 27 per cent among Muslims. The lower level of distrust among Muslims is likely because of the common religion of Islam shared with the Fulani, who are predominantly Muslims. The 53 respondents in the dataset who belonged to the Fulani ethnic group were all Muslims. Eighty-one per cent of the Muslim subsample belonged to the Hausa ethnic group, and all members of the Hausa ethnic group were Muslims. The Hausa have lived alongside the Fulani for centuries and have intermarried to a great extent, which makes the two ethnic groups culturally proximate (Diamond, Reference Diamond1988, p. 21).Footnote 12
Distrust in Fulani.

Distrust Muslims. This variable was derived from the question, ‘How much do you trust Muslims?’ with responses measured on an ordinal scale with five categories ranging from ‘0 = trust completely’ to ‘4 = do not trust at all’.
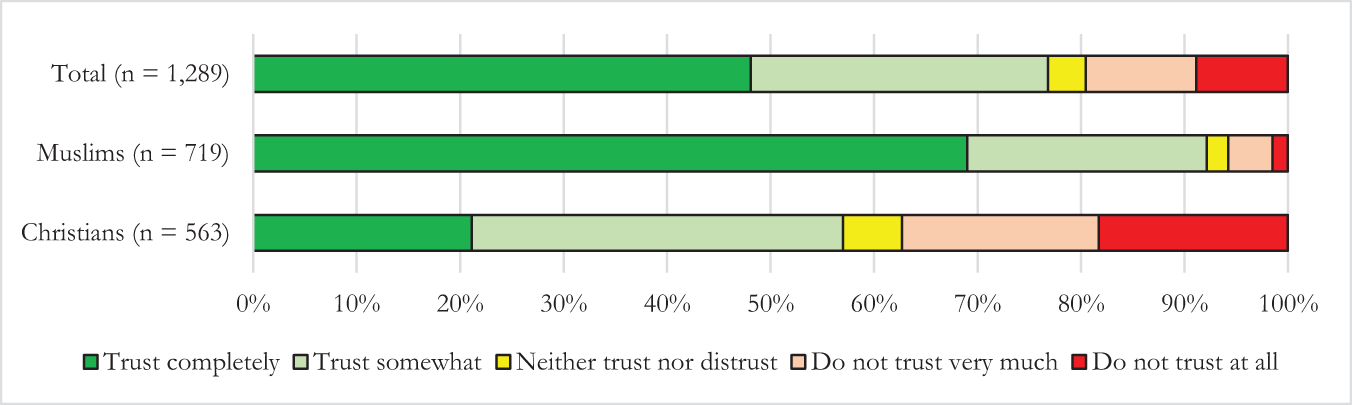
As shown in Figure 2, 20 per cent of the population chose either the ‘do not trust at all’ or ‘do not trust very much’ response categories, which is 21 percentage points lower than the estimate for distrust in the Fulani. This suggests that the population in Kaduna has more trust in the larger Muslim population than in members of the Fulani ethnic group. Disaggregating the data by religious affiliation shows that only 6 per cent of Muslims chose the ‘do not trust at all’ or ‘do not trust very much’ response categories, which is also 21 percentage points lower than the estimate for distrust in the Fulani. This is not surprising because people generally have more trust in members of their in-group (Allport, Reference Allport1954; Brewer, Reference Brewer1999). The estimate for Christians was 37 per cent, which is 23 percentage points lower than the estimate for distrust in the Fulani. This indicates that Christians also have more trust in the larger Muslim population than in members of the Fulani ethnic group. Suffice it to add that the correlation between the measures of distrust in the Fulani and Muslims was 0.55.
Distrust in Muslims.
3.2.2. Explanatory variable
Pastoral conflict. This variable measures the extent to which respondents are exposed to pastoral conflicts. Using data from the ACLED (Raleigh et al., Reference Raleigh, Linke, Hegre and Karlsen2010), we define a pastoral conflict as any incident in which at least one of the actors or associated actors is a pastoralist or belongs to the Fulani ethnic group.Footnote 13 We were able to employ this operationalization because the ACLED dataset contains information about the ethnicity and occupation of the actors involved in the conflict. Most conflict actors identified as ‘pastoralists’ were also ‘Fulani’, making the two categories identical. It is important to stress that this operationalization captures both events perpetrated by pastoralists against sedentary communities and those in which pastoralists were victimized.
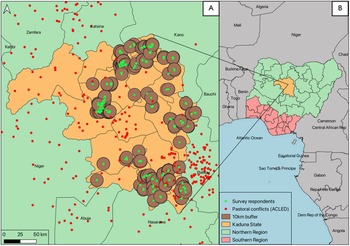
To develop the measure for exposure to pastoral conflict, QGIS software was used to draw buffers with a radius of 10 km around the respondents’ dwellings, and count the number of conflict incidents within the buffers (see Figure 3). This was possible because we relied on the TRANSMIT and ACLED datasets, both of which are georeferenced.Footnote 14 All incidents that occurred within the buffer from 1997 to 2020 were considered. The start date of 1997 was chosen because the ACLED data begins in that year. Incidents after 2020 were excluded because the dependent variable is measured in 2021, ensuring that the explanatory variable precedes the dependent variable and mitigating potential reverse causation. We considered conflict exposure over a long period because we are particularly interested in the cumulative effect of conflict on distrust. Research has shown that the memory of past conflicts often persists and influences actions in the present (e.g., Tint, Reference Tint2010; Odak and Benčić, Reference Odak and Benčić2016; Tuki, Reference Tuki2024b, Reference Tuki2025b).
Measuring exposure to pastoral conflict.
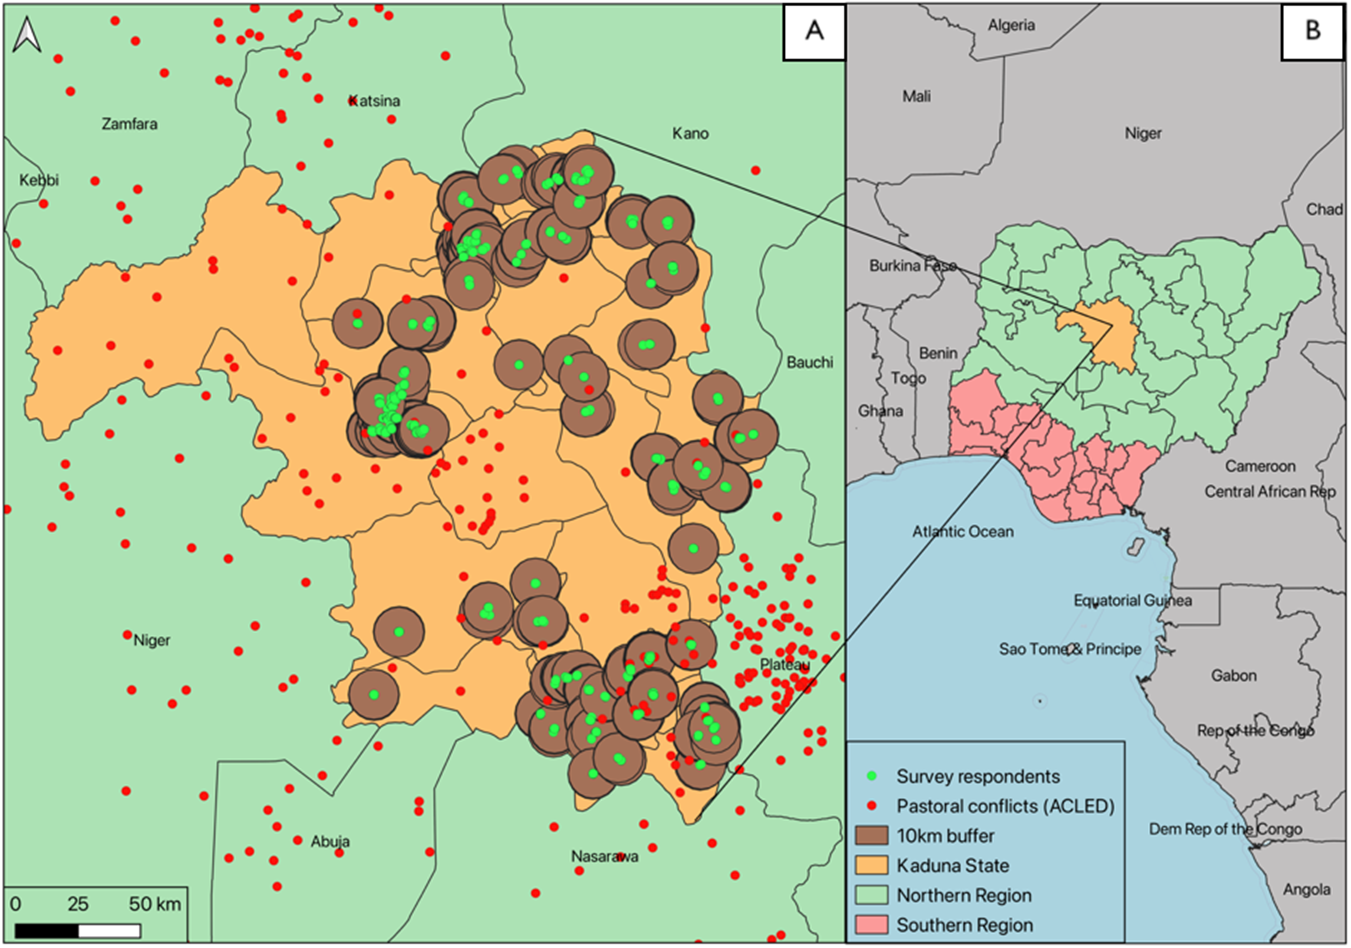
Using buffers is a more efficient way of measuring exposure to pastoral conflict than relying on administrative boundaries such as LGAs. Administrative boundaries limit the variation in the conflict exposure variable, since all respondents within the same LGA are assigned the total number of incidents there. This assumes that they are equally exposed to pastoral conflict, which is not necessarily the case. Moreover, respondents residing near the border of their own LGA might be more exposed to incidents in a neighbouring LGA than to those in their own, as such incidents may be closer to their dwellings. Buffers, which are unique to each respondent and independent of administrative boundaries, mitigate these issues. Sixty per cent of the 1,353 respondents had at least one incident within the 10 km buffer around their dwelling.
3.2.3. Control variables
Victimization. This is a dummy variable that takes a value of 1 if the respondent or a household member has experienced any form of violence during the past decade and 0 otherwise. It was derived from the question, ‘During the last 10 years, have you or your close family members been affected by violence? By “affected” we mean (a) You or your close family were threatened by violence, (b) You or one of your close family members was injured or killed, or (c) Your home or property was destroyed by an attacker’. Of the 1,298 respondents who were asked this question, 232 had been victimized, which translates into one in six respondents.
Household income. This variable measures the capacity of the total income of the household to meet the needs of its members. It was derived from the question, ‘Which of the following statements best describes the current economic situation of your household?’ with the responses measured on an ordinal scale with five categories ranging from ‘0 = money is not enough for food’ to ‘4 = we can afford to buy almost anything’. Some studies have shown that poverty increases the risk of conflict (Do and Iyer, Reference Do and Iyer2010) and erodes trust (Gereke et al., Reference Gereke, Schaub and Baldassarri2018).
Demographic attributes. This includes respondents’ religious affiliation, gender and age. Gender takes the value of 1 if the respondent is female and 0 if male. Religious affiliation takes the value of 1 if the respondent is Muslim and 0 if Christian. All the respondents were either Muslims or Christians, with both groups represented in the sample in the ratio 56:44, respectively. Age is measured in years.
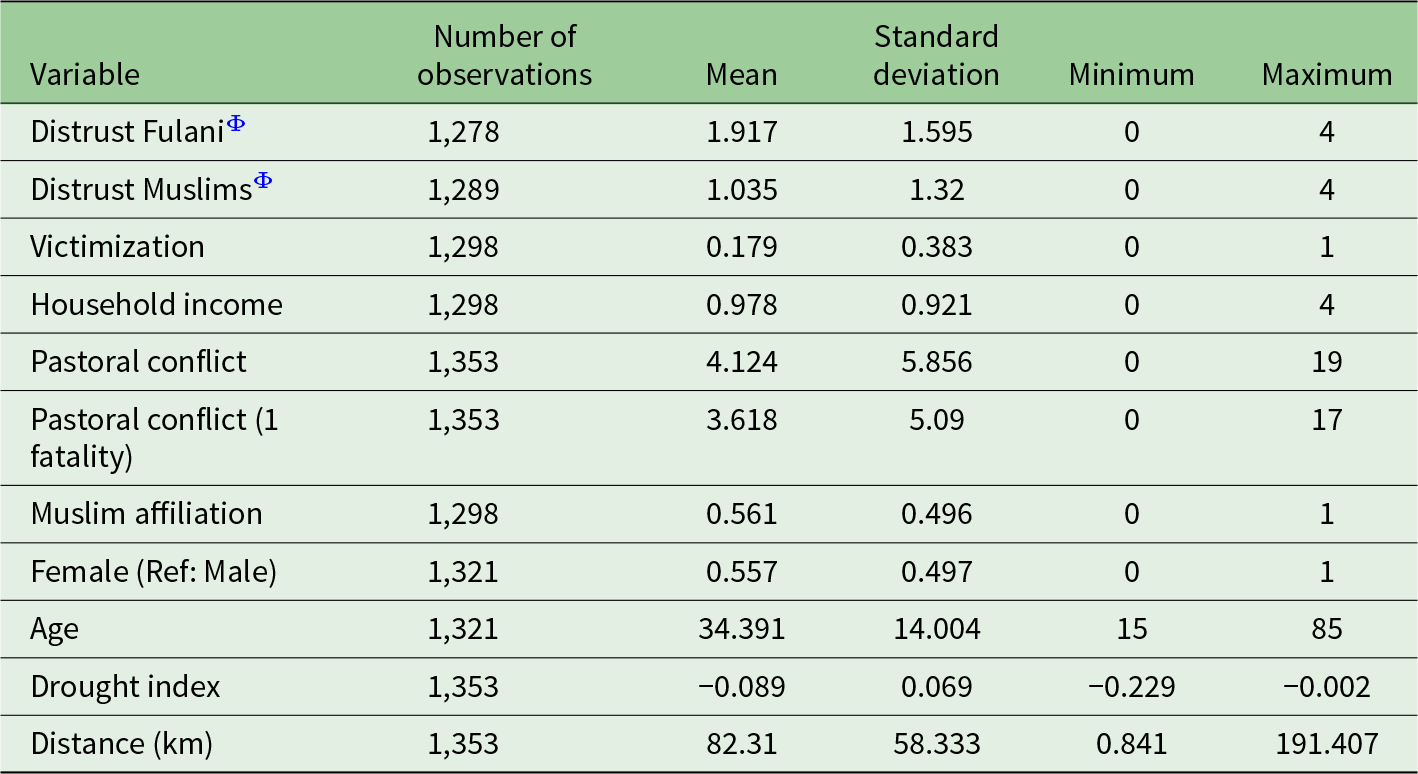
Table 1 presents the summary statistics of the variables used to estimate the regression model.
Summary statistics
Notes:
Φ denotes the dependent variable. ‘Ref’ denotes the reference category.
3.3. Empirical strategy
To examine the effect of exposure to pastoral conflicts on distrust, we consider a model of the following general form:
 \begin{equation}Pastoral\,conflict_i=\alpha_0+\alpha_1Drought_i+\alpha_2Distance_i+\alpha_3\varphi'_i+\,\mu_i\end{equation}
 \begin{equation}\quad\quad\quad Distrus{t_i} = \,{\beta _0} + \,{\beta _1}Pastoral\,conflict_i^* + {\beta _2}\varphi {'_i} + \,{e_i}.\end{equation}
 In equation (1),  $Pastoral\,conflic{t_i}$ measures the total number of pastoral conflict incidents that occurred within the 10 km radius of $Respondent\,i's$ dwelling; $Drough{t_i}$ is the first instrumental variable (IV), which measures the incidence of drought around respondents’ dwellings;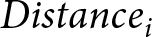 $Distanc{e_i}$ is the second IV, which measures the distance from respondents’ dwellings to the state governor's residence; $\varphi {'_i}$ is a vector of control variables; $\alpha_0$ denotes the intercept; $\alpha_1$ and $\alpha_2$ denote the coefficients of the two IVs; $\alpha_3$ denote the coefficients of the control variables; while ${\mu _i}$ is the error term.
In equation (2), 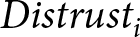 $Distrus{t_i}$ is the dependent variable of interest, which could measure either the degree to which $Respondent\,i$ distrusts members of the Fulani ethnic group or Muslims; $Pastoral\,conflict_i^*$measures the predicted values of exposure to pastoral conflict derived from equation (1); $\varphi {'_i}$ is the same as in the first equation; ${\beta _0}$ is the constant term; ${\beta _1}$ and ${\beta _2}$ are the coefficients of the explanatory and control variables, respectively; while ${e_i}$ is the error term.
Although this study examines the effect of pastoral conflict on distrust, the possibility of endogeneity remains, particularly due to reverse causation and omitted variable bias. For example, individuals with low levels of trust in out-group members may themselves be more predisposed to violence. Perceiving the out-group as untrustworthy can intensify feelings of threat and make pre-emptive violence appear more justifiable. To mitigate the problem of reverse causation, the explanatory variable was lagged by considering only conflict incidents that occurred before 2021, the year in which the survey was conducted. This is because present levels of distrust are unlikely to affect past exposure to conflict.
Although some control variables have been included in the regression model, omitted variable bias might still pose a challenge, as it is impossible to account for all potential factors that could confound the relationship between the dependent and explanatory variables. To address this issue, we adopt an IV approach and estimate the model using an IV-Ordered Probit regression, which is based on maximum likelihood estimation. Specifically, we instrument exposure to pastoral conflict with the incidence of drought around respondents’ dwellings and the distance from their dwellings to the state governor's residence. An advantage of the IV-Ordered Probit model is that it respects the ordinal nature of the dependent variable, allowing us to assess the effect of the treatment across each category of the dependent variable. To test the robustness of the results, two-stage least squares (2SLS) regression was also employed as an alternative estimation method.
The IV model rests on the assumption that drought and distance to the governor's residence do not directly influence distrust, but rather operate through the mechanism of pastoral conflicts. Several studies have identified drought as a root cause of such conflicts. A report by the International Crisis Group (2017) notes that drought and desertification have degraded pasturelands in Nigeria and dried up water sources, forcing pastoralists to migrate southward in search of these. Nigeria's northernmost region lies close to the Sahara Desert, while its southernmost region borders the Atlantic Ocean. Rainfall and vegetation cover increase gradually from north to south. This southward movement of pastoralists often brings them into conflict with sedentary farming communities, particularly when cattle stray into farmlands and destroy crops. For instance, using representative data for Africa, Eberle et al. (Reference Eberle, Rohner and Thoenig2025) show that rising temperatures increase the risk of conflict between sedentary farmers and nomadic pastoralists. Similarly, McGuirk and Nunn (Reference McGuirk and Nunn2025), also using Africa-wide data, find that adverse rainfall shocks heighten the likelihood of farmer–herder conflict.
Some studies have examined the effect of natural disasters such as earthquakes and floods on trust (e.g., Fleming et al., Reference Fleming, Chong and Bejarano2014; Toya and Skidmore, Reference Toya and Skidmore2014). One might therefore argue that droughts, which are also disasters, could bypass the conflict mechanism and exert a direct effect on trust. However, most of these studies conflate cooperative behaviour with trust, which are distinct concepts. Trust is an attitudinal measure, whereas cooperative behaviour is a behavioural one (Greiner and Filsinger, Reference Greiner and Filsinger2022). Drought also differs from the aforementioned types of natural disasters in that it is often subtle and has a slow onset. Moreover, during the period under consideration in this study (1997–2021), Kaduna did not experience any severe droughts that would qualify as natural disasters – unlike in Somalia, for example (Hujale, Reference Hujale2022; Maruf, Reference Maruf2023).
The rationale for using the distance to the state governor's residence as an IV is based on the argument that a government's ability to exert control over its territory diminishes with distance from the administrative centre (Le Billon, Reference Le Billon2001). Based on this premise, we expect the incidence of pastoral conflicts to increase the farther one moves from the governor's residence. However, the reverse is also plausible: pastoralists may be concerned about insecurity and cattle theft in remote or rural areas, prompting them to graze their livestock closer to the administrative centre. This could heighten competition for land and water resources in areas near the centre, thereby increasing the risk of conflict. Indeed, one in three pastoralists in Kaduna has been a victim of cattle theft in the past five years.Footnote 15 The plausibility of both mechanisms makes it difficult to form an a priori expectation about the sign of the distance variable in the first-stage regression.
One could argue that the distance to the state governor's residence does not adequately proxy state capacity, especially if the provision of public services such as security is determined by ethnic considerations. For example, some studies have shown that politicians may treat districts with a higher proportion of their co-ethnics or co-religionists preferentially in the provision of public goods (e.g., Betancourt and Gleason, Reference Betancourt and Gleason2000; Das et al., Reference Das, Kar and Kayal2011; Beiser-McGrath et al., Reference Beiser-McGrath, Müller-Crepon and Pengl2021). Conversely, other studies have found that politicians do not necessarily favour their co-ethnics or co-religionists. They may even treat districts with a lower share of their co-ethnics or co-religionists preferentially as a strategy to win support during elections (Bhalotra et al., Reference Bhalotra, Clots-Figueras, Cassan and Iyer2014). However, in the case of Kaduna, this might not apply, as society is highly polarized along religious lines and people tend to vote strictly along ethnoreligious lines – irrespective of the credentials of political aspirants (Ostien, Reference Ostien2012). Given this context, political benefits are unlikely to accrue to a governor for favouring districts where the majority of the population does not share his or her ethnicity or religion.
To further justify the IV, it is also imperative to provide some background information about the case study. Between 1997 and 1999, when Nigeria was under military rule, the state of Kaduna had two military administrators, both of whom were Muslims. Since Nigeria's transition to civilian rule in 1999, seven gubernatorial elections have been held in Kaduna. Despite the significant Christian population in the state, a Christian has been elected to office only once. In 2010, the elected governor, who was a Muslim, was appointed Nigeria's vice president, allowing his deputy, a Christian, to become governor. Although the Christian governor narrowly won the 2011 gubernatorial election, his victory was strongly challenged by some Muslims. He died in a plane crash a year into office, and his deputy, a Muslim, took over (The Nation, 2012). Executive power at the centre of the state has, for most of Kaduna's history, resided with Muslims.
If politicians in Kaduna do indeed favour their co-religionists in the provision of security, then LGAs with a predominantly Muslim population should experience a lower incidence of violent conflict.Footnote 16 However, this is not the case. A review of all violent conflicts in Kaduna between 1997 and 2021 – regardless of the ethnicity or occupation of the actors – shows that the three LGAs with the highest incidence of conflict (Chikun, Kaduna North and Igabi) have predominantly Muslim populations.Footnote 17 This suggests that the state government may not necessarily be preferential in the provision of security across LGAs. However, this does not preclude the possibility that the government is preferential in the provision of other public goods, such as infrastructure or social amenities.
3.4. The IVs used are discussed below
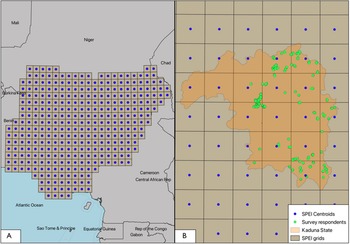
Drought index. The Standardized Precipitation-Evapotranspiration Index (SPEI) (Vicente-Serrano et al., Reference Vicente-Serrano, Beguería, López-Moreno, Angulo and El Kenawy2010) was used as a measure of drought. The SPEI index is a gridded dataset that measures the incidence and severity of drought in a place over time. Both precipitation and temperature are considered in its computation. Although its theoretical limits range from −∞ to +∞, it typically varies between −2.5 and +2.5, with higher values denoting wetter conditions. Since the average value of the SPEI index is 0, it captures the degree to which climatic conditions deviate from the normal average. The raw data are provided at a 0.5 × 0.5-degree spatial resolution, with each grid cell associated with a unique SPEI value. The data are available on a monthly basis from 1900 to 2020. We computed the average SPEI drought index at the centroid of each grid cell within Nigeria's administrative boundary from 1997 to 2020 (see panel A of Figure 4 for a visualization). We summed the values at each centroid and then took the average. The period from 1997 to 2020 corresponds to the time frame during which pastoral conflicts were considered.Footnote 18
Determining the SPEI drought index around the respondents’ dwellings.
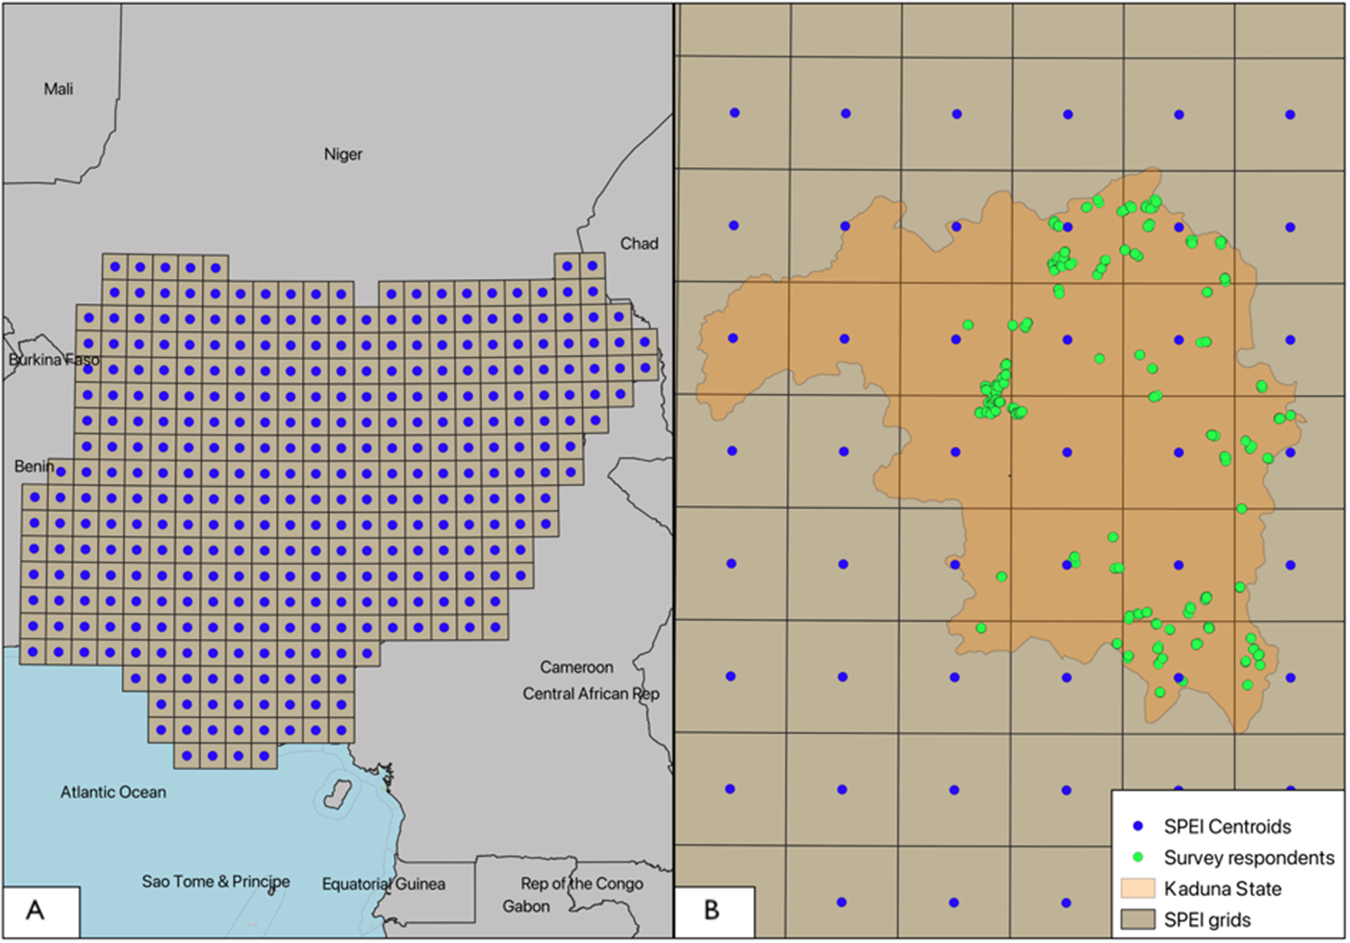
To determine the SPEI index values around the respondents’ dwellings, their geolocations were matched to the nearest SPEI centroid. The matching was performed using QGIS software. Since the centroids are equidistant from each other, it follows that the respondents’ dwellings are located within the grid cell of the nearest SPEI centroid (see panel B of Figure 4). The raw SPEI dataset was in netCDF format, and the index values at the centroids were extracted using RStudio. Version 2.7 of the SPEI index was employed.
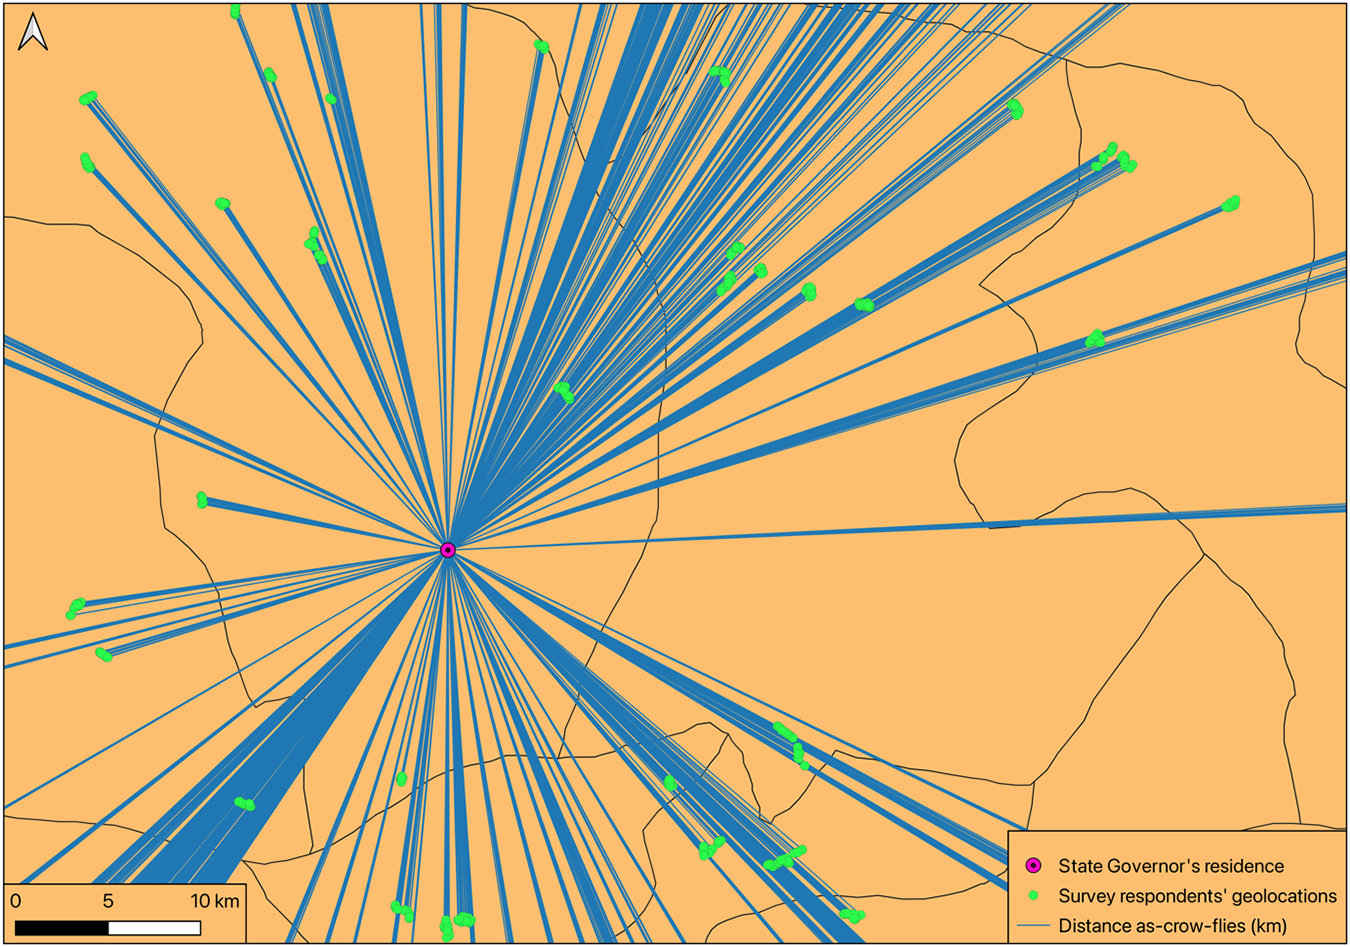
Distance to governor's house. To compute the distance to the governor's residence, QGIS software was used to calculate the straight-line (as-the-crow-flies) distance from each respondent's dwelling to the state governor's residence in kilometres (see Figure 5 for a visualization).
Measuring distance to the state governor's house.
4. Results
4.1. First-stage regressions
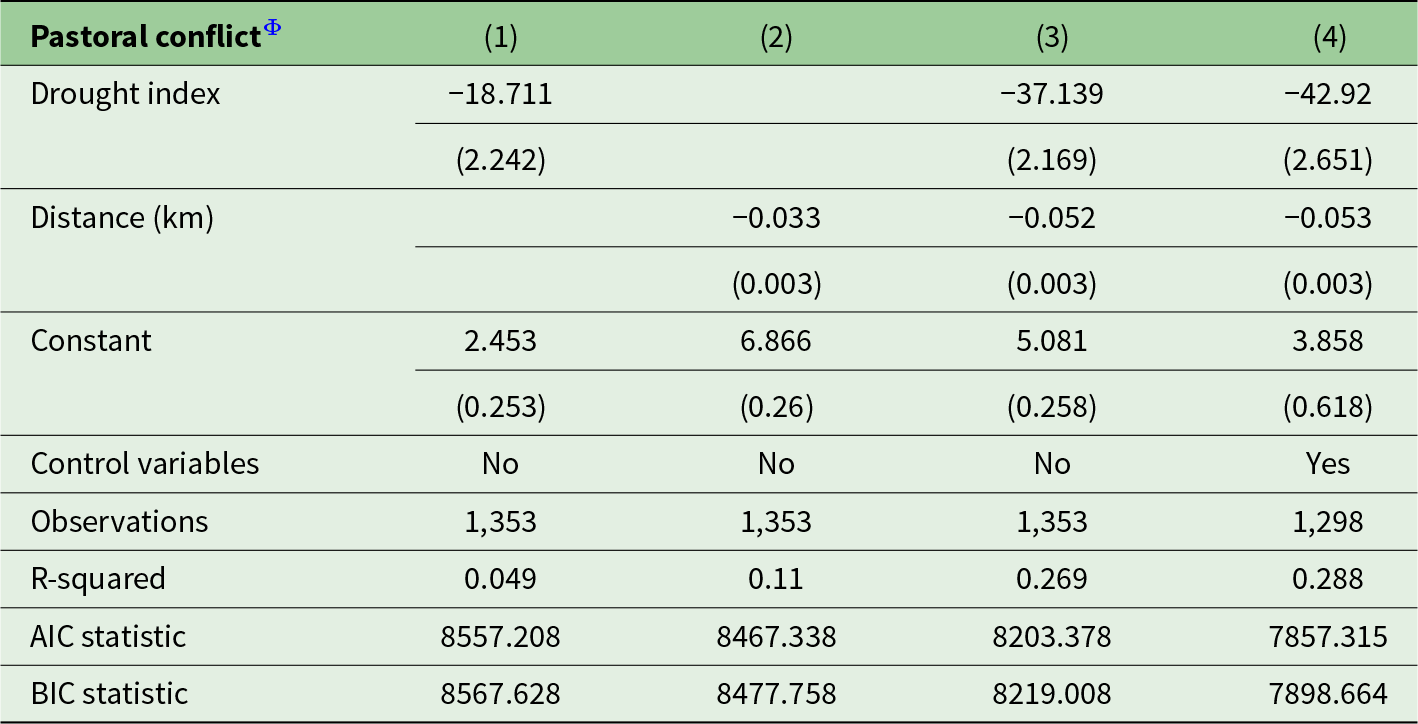
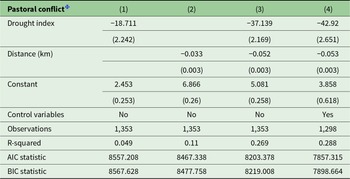
Table 2 reports the results of ordinary least squares (OLS) regression models examining the association between the IVs (i.e., drought and distance to the state governor's residence) and pastoral conflict. An OLS model is appropriate because exposure to pastoral conflict is a continuous variable. The values of the SPEI drought index for Kaduna range from −0.229 to −0.002. Since the values fall below the normal average of 0, the results can be interpreted such that higher values denote wetter conditions, while lower values denote drier conditions.
Association between the explanatory and instrumental variables
Notes: Standard errors are in parentheses.
Φ denotes the dependent variable. All models are estimated using OLS regression.
In Model 1, where only the SPEI drought index was considered, the variable had the expected negative coefficient and was statistically significant at the 1 per cent level, indicating that wetter conditions are associated with a lower incidence of pastoral conflict. In other words, dry spells are positively correlated with a higher incidence of pastoral conflict. In Model 2, where the distance to the state governor's residence was considered, the variable also had a negative coefficient, suggesting that the incidence of pastoral conflict decreases with greater distance from the administrative centre. This is consistent with the argument that pastoralists prefer to graze their livestock on lands closer to the administrative centre due to security concerns. In Model 3, where both IVs were included in the same model, the results were consistent with those in the preceding baseline models. Model 4 shows that the main results are also robust to the inclusion of control variables.
4.2. Second-stage regressions
4.2.1. Distrust in the Fulani
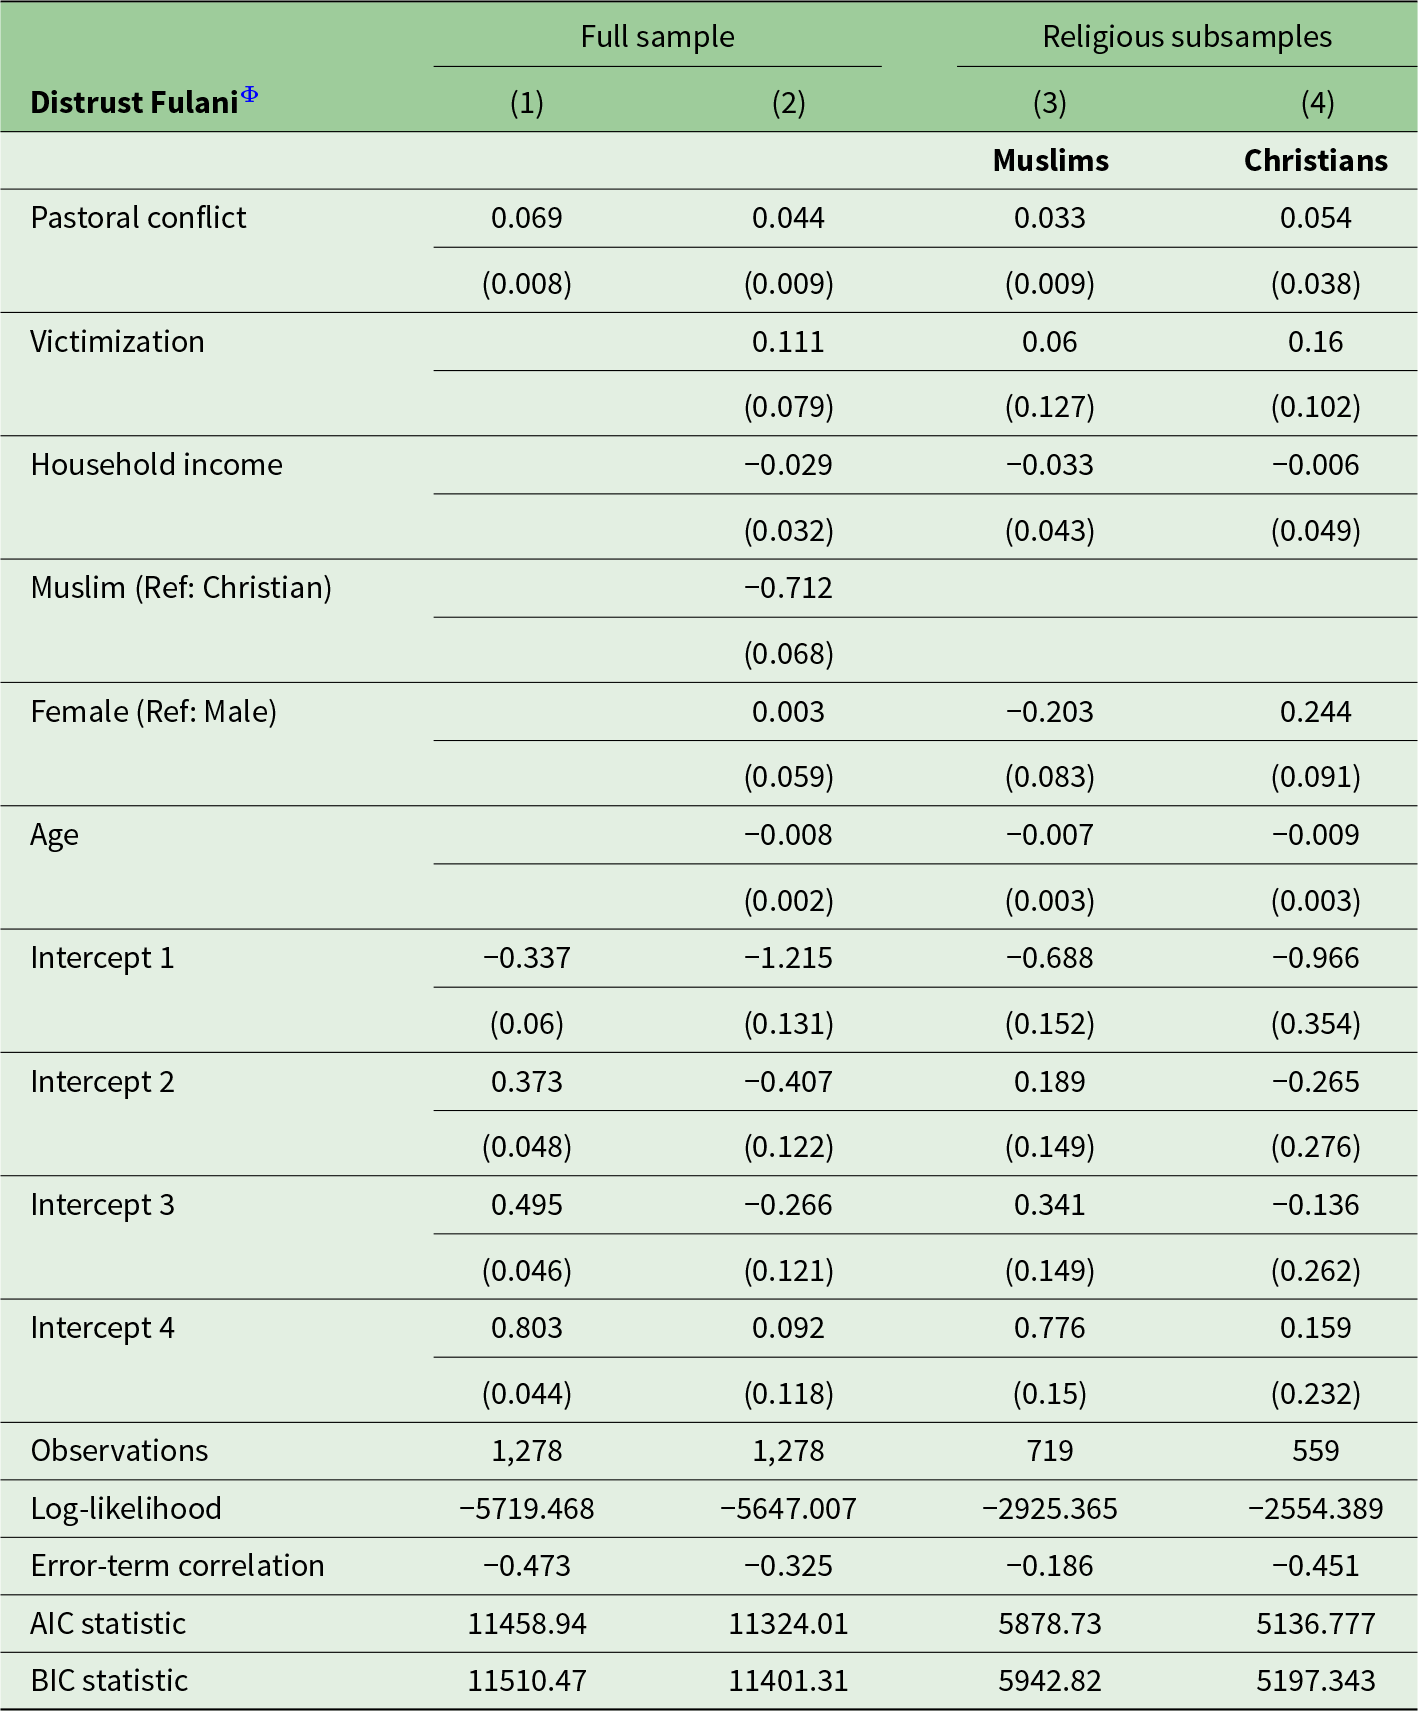
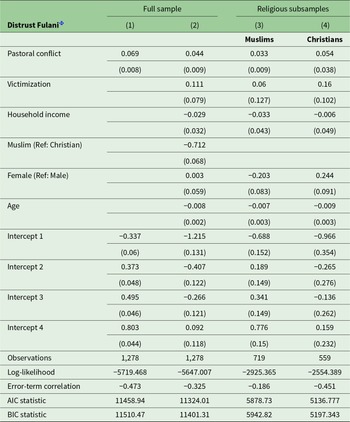
Table 3 reports the results of the second-stage regressions examining the effect of pastoral conflict on distrust in members of the Fulani ethnic group. In Model 1, which includes only pastoral conflict, the variable has a positive coefficient and is statistically significant at the 1 per cent level. This supports Hypothesis 1, which posits that among the population in Kaduna, exposure to pastoral conflict increases distrust in members of the Fulani ethnic group. The correlation between the error terms of the first- and second-stage regression models is also statistically significant at the 1 per cent level, suggesting that endogeneity was present and that the use of an IV approach is appropriate.
Effect of pastoral conflict on distrust in members of the Fulani ethnic group
Notes: Standard errors are in parentheses. ‘Ref’ denotes the reference category.
Φ denotes the dependent variable which measures distrust in members of the Fulani ethnic group on a scale with five ordinal categories ranging from ‘trust completely’ to ‘do not trust at all’. All models are estimated using IV-Ordered Probit regression. Only the second stage regression results have been reported.
In Model 2, which includes control variables, the Akaike Information Criterion (AIC) statistic drops to 11,324, suggesting that this model provides a better fit than the baseline model. In this specification, pastoral conflict retains its positive coefficient and remains significant at the 1 per cent level; however, the size of the coefficient decreases from 0.069 to 0.044. Among the control variables, only Muslim affiliation and age are significant. Muslim affiliation has a negative coefficient, suggesting that Muslims are less likely than Christians to distrust the Fulani. In other words, Christians are more distrustful of the Fulani than Muslims. Similarly, age has a negative coefficient, indicating that the older people are, the less distrustful they become towards the Fulani.
To examine whether the effect of pastoral conflict on distrust in the Fulani differs between Muslims and Christians, the data were disaggregated by religious affiliation and separate models were estimated for each subsample of respondents. In Model 3, based on the Muslim subsample, pastoral conflict has the expected positive coefficient, suggesting that among Muslims, exposure to pastoral conflict reduces trust in members of the Fulani ethnic group. This result provides support for Hypothesis 2a. In Model 4, based on the Christian subsample, pastoral conflict also has a positive coefficient; however, it does not reach statistical significance, with a p-value of 0.12. This result is inconsistent with Hypothesis 2b, which predicts that exposure to pastoral conflict increases distrust in the Fulani among Christians.
Finally, it is worth noting that the results reported in Table 3 are robust to an alternative measure of pastoral conflict, in which only incidents that caused at least one fatality are considered (see Table A2 in the appendix). The results are also robust to the use of 2SLS regression as an alternative estimation method (see Table A4 in the appendix).
To aid interpretation of the IV-Ordered Probit results, the average marginal effects were plotted in Figure 6. A glance at the three panels in the figure reveals that the effect of pastoral conflict on distrust in the Fulani is strongest at the extreme categories of the dependent variable – i.e., ‘trust completely’ and ‘do not trust at all’. Panel A, based on the full sample (Model 2 in Table 3), indicates that a 1-unit increase in the predicted value of pastoral conflict within a 10 km radius of respondents’ dwellings raises their probability of choosing the ‘do not trust at all’ response category by 1.4 percentage points when asked how much they trust members of the Fulani ethnic group. In contrast, it reduces the probability of choosing the ‘trust completely’ response by 1.3 percentage points.
Average marginal effect of pastoral conflict on distrust in members of the Fulani ethnic group.
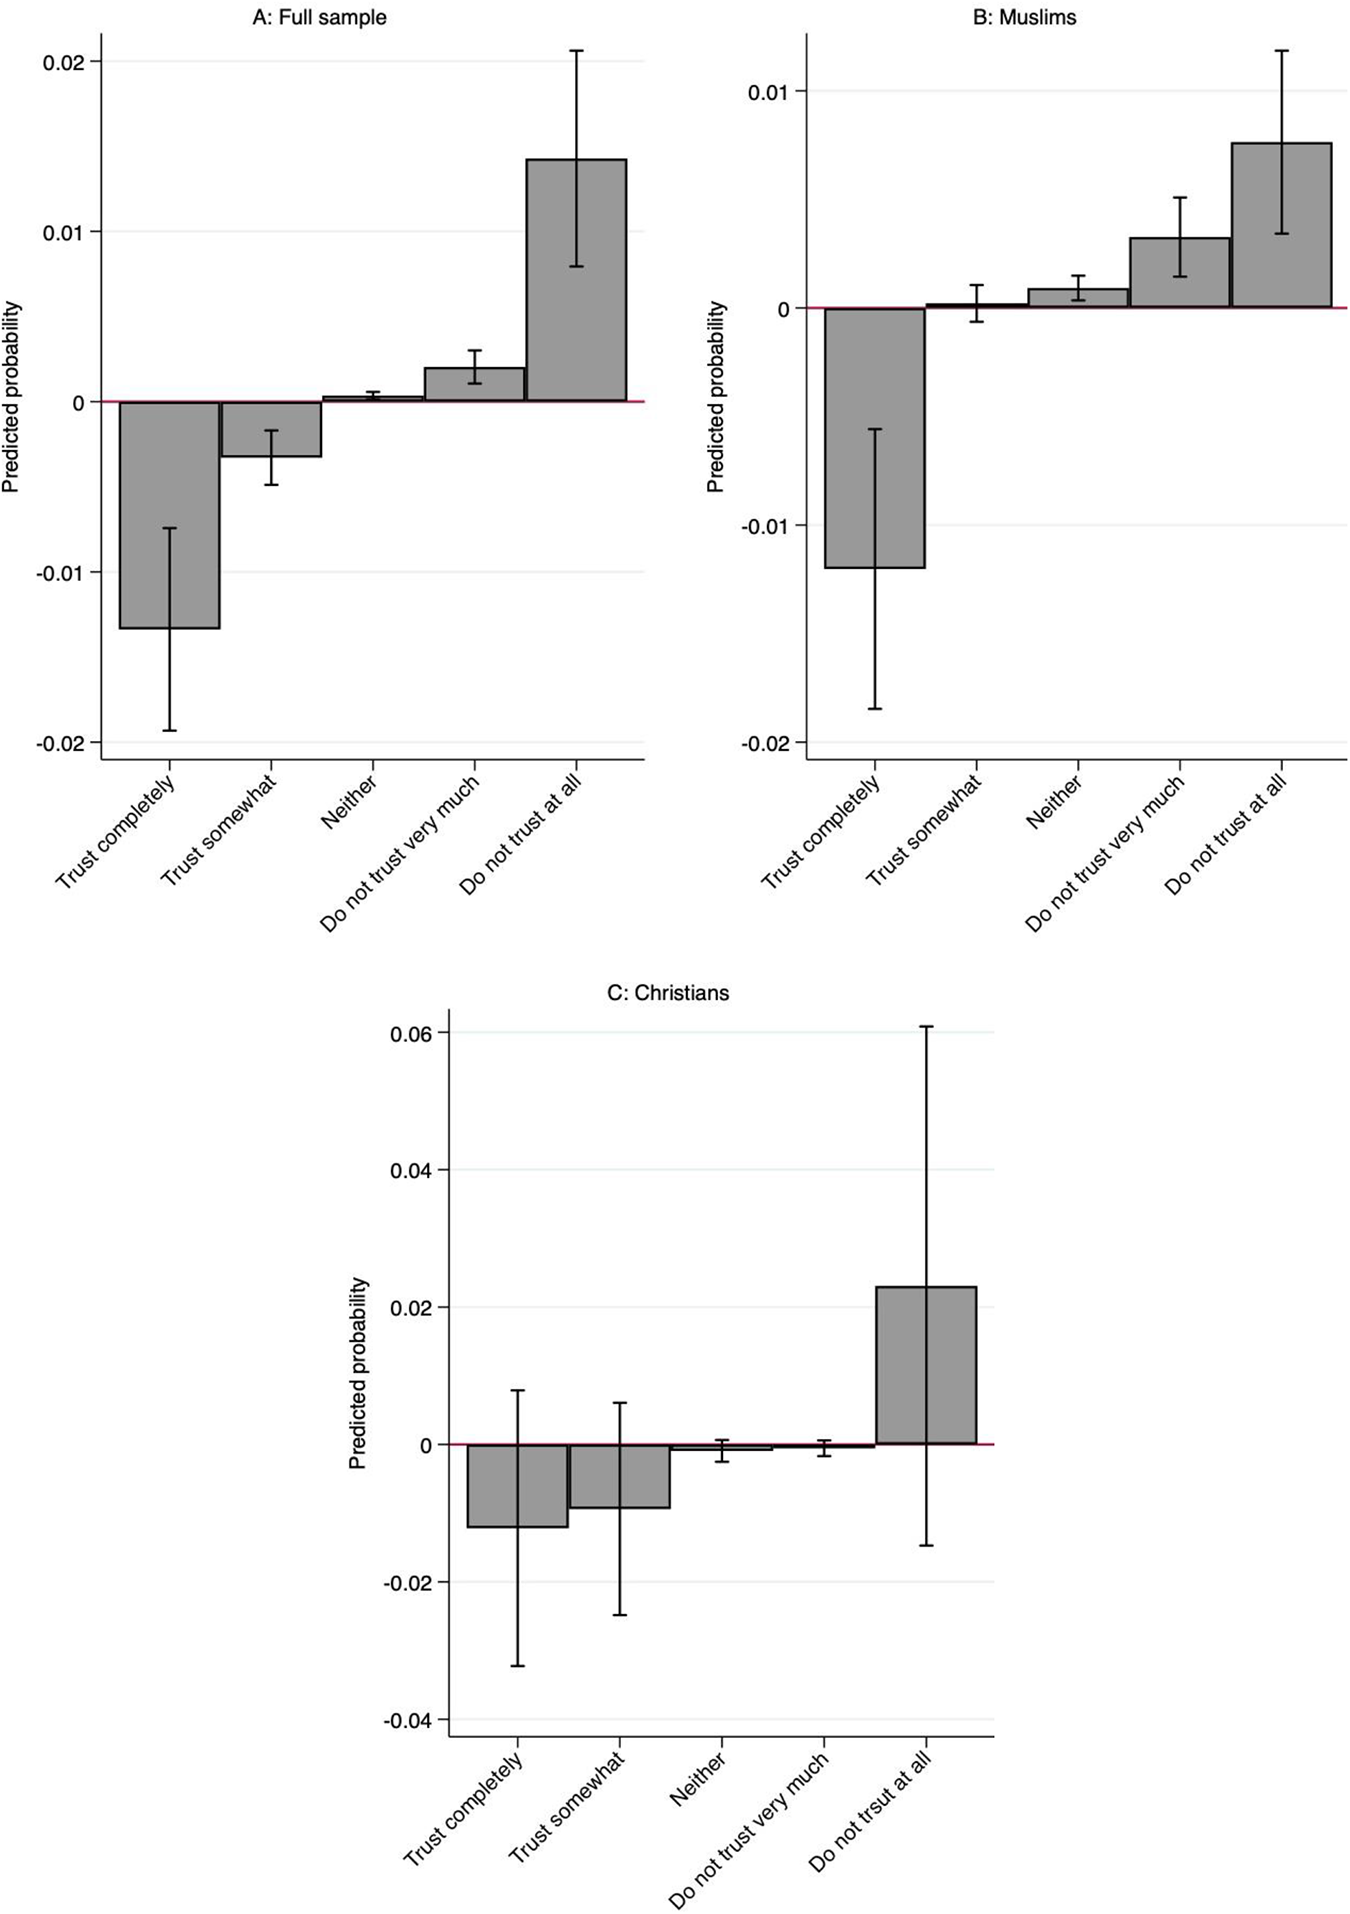
Similarly, panel B, based on the Muslim subsample of respondents (Model 3 in Table 3), shows that a 1-unit increase in the predicted value of pastoral conflict increases the probability of choosing the ‘do not trust at all’ category by 0.8 percentage points and reduces the probability of choosing the ‘trust completely’ category by 1.2 percentage points. In contrast, panel C, based on the Christian subsample of respondents (Model 4 in Table 3), shows that all confidence intervals cross the horizontal line at 0, suggesting the absence of a statistically significant effect of pastoral conflict on any of the five categories of the dependent variable.
4.2.2. Distrust in Muslims
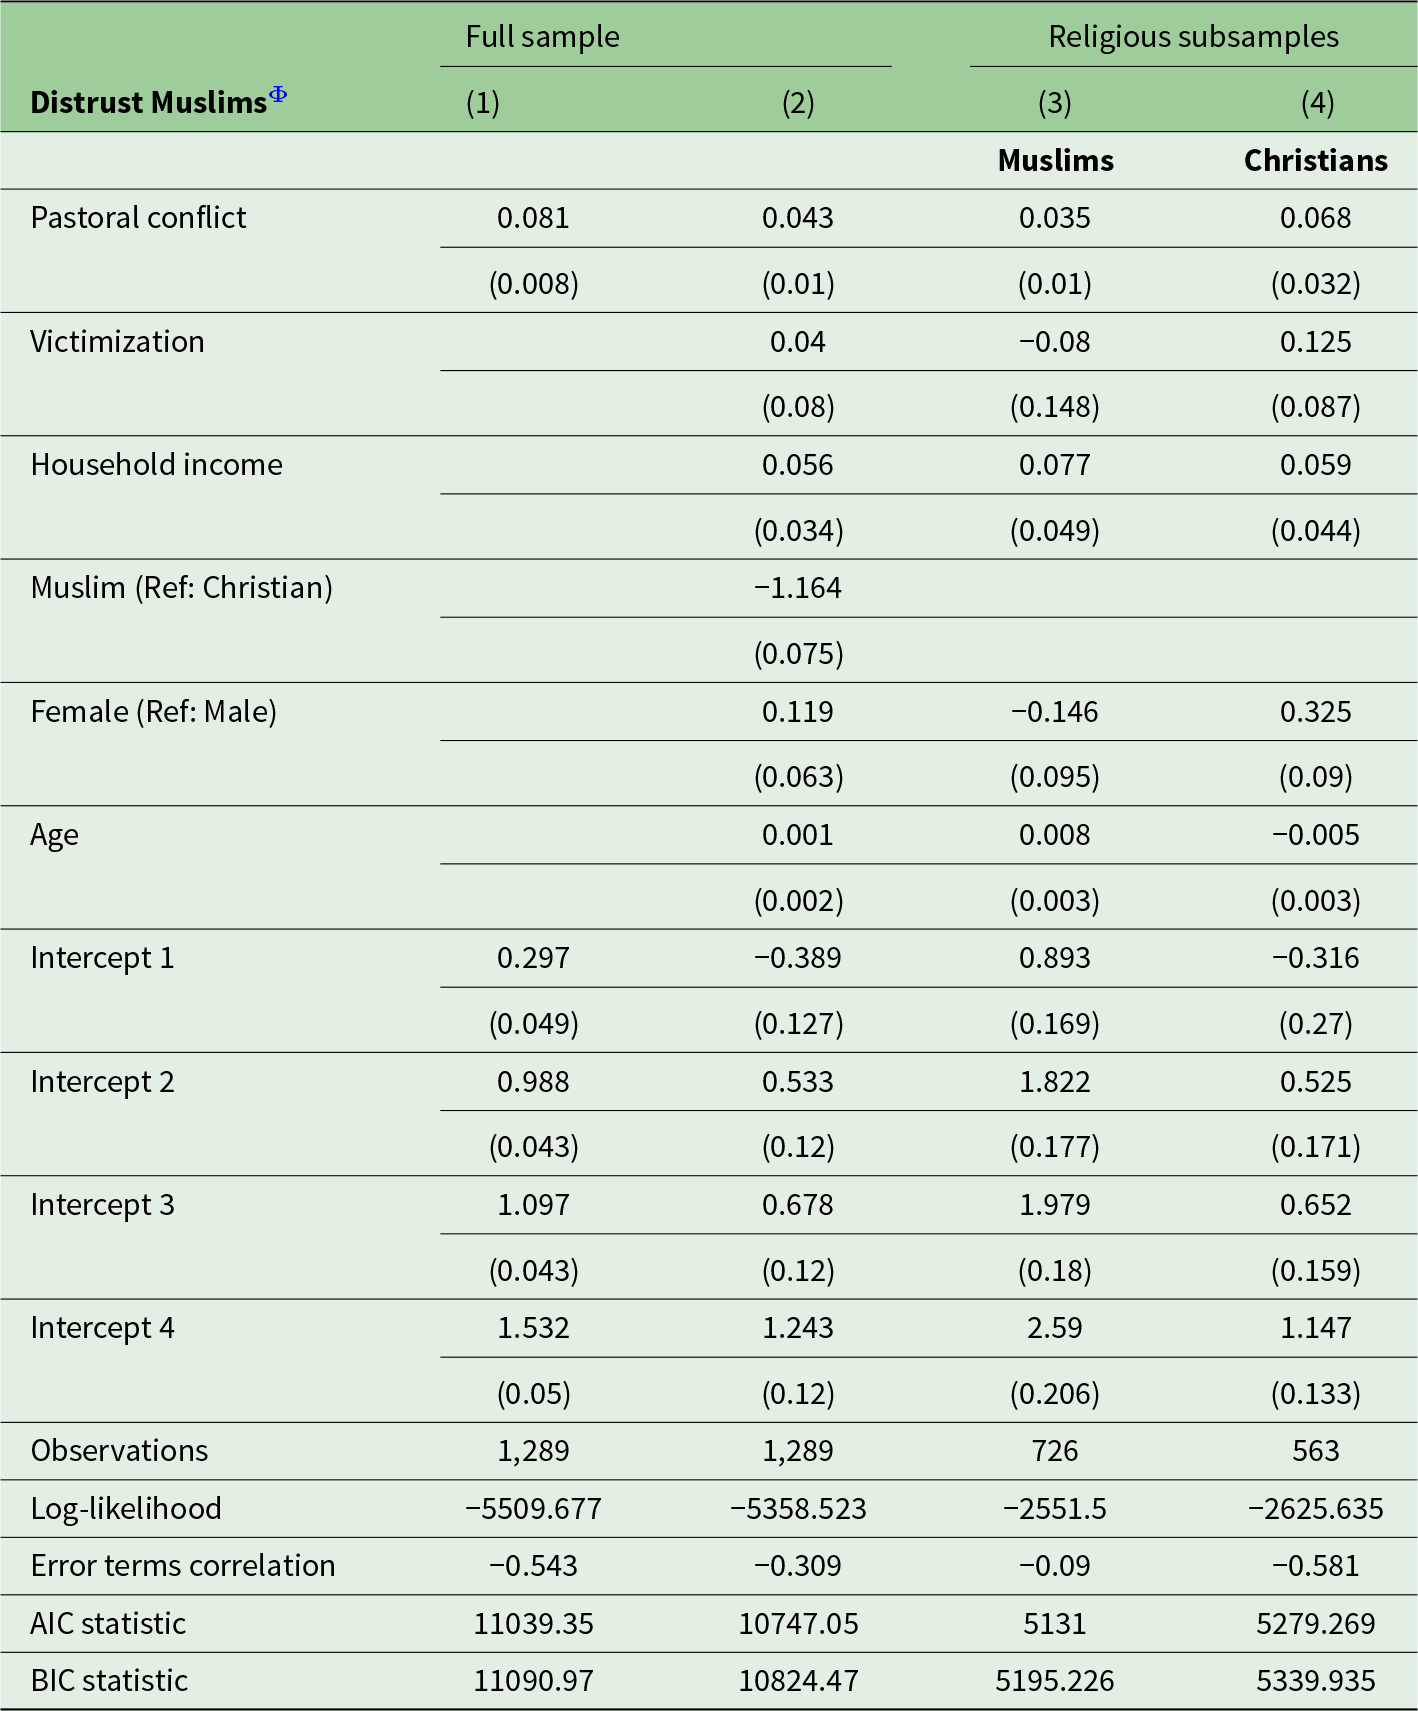
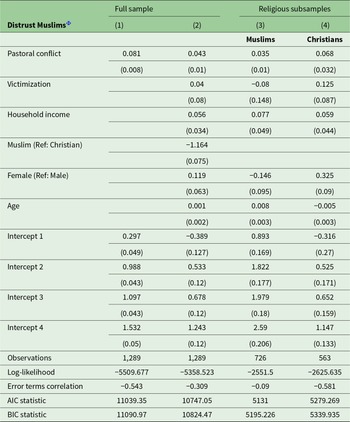
Next, the focus of the analysis is shifted to examining the effect of pastoral conflict on distrust in Muslims. Table 4 reports the regression results. In Model 1, which includes only pastoral conflict, the variable has a positive coefficient that is statistically significant at the 1 per cent level. This result provides further support for Hypothesis 1 and suggests that, among the population in Kaduna, exposure to pastoral conflict leads to distrust in Muslims. In other words, the more individuals are exposed to pastoral conflict, the lower their trust in Muslims.
Effect of pastoral conflict on distrust in Muslims
Notes: Standard errors are in parentheses. ‘Ref’ denotes the reference category.
Φ denotes the dependent variable, which measures distrust in Muslims on a scale with five ordinal categories ranging from ‘trust completely’ to ‘do not trust at all’. All models are estimated using IV-Ordered Probit regression. Only the second stage regression results have been reported.
Including control variables in Model 2 confirms the robustness of this effect. Moreover, Model 2 has an AIC statistic of 10,747, which is lower than that of the baseline model, suggesting that it provides a better fit. Among the control variables, only Muslim affiliation and household income are statistically significant. As in the earlier case (i.e., Model 2 in Table 3), Muslim affiliation has a negative coefficient, suggesting that Muslims are less likely than Christians to distrust fellow Muslims. In other words, Christians are more likely to distrust Muslims than Muslims themselves. Household income has a positive coefficient, suggesting that improvements in socioeconomic conditions are associated with increased distrust in Muslims.
To check for heterogeneous effects based on religious affiliation, we disaggregated the data accordingly and estimated models using the Muslim and Christian subsamples. In Model 3, based on the Muslim subsample, pastoral conflict carries a positive coefficient that is statistically significant at the 1 per cent level. This result provides further support for Hypothesis 2a and suggests that, among Muslims, exposure to pastoral conflict erodes trust in members of their religious in-group. In Model 4, based on the Christian subsample, pastoral conflict also carries a positive coefficient and is statistically significant at the 5 per cent level, indicating that among Christians, exposure to pastoral conflict similarly leads to distrust in Muslims. Notably, this result supports Hypothesis 2b.
Finally, the results in Table 4 were subjected to a series of robustness checks. Table A3 in the appendix shows that the results hold when the models were re-estimated using a measure of pastoral conflicts that includes only incidents causing at least one fatality. Table A5 in the appendix shows that the results also hold when 2SLS is used as an alternative estimation method.
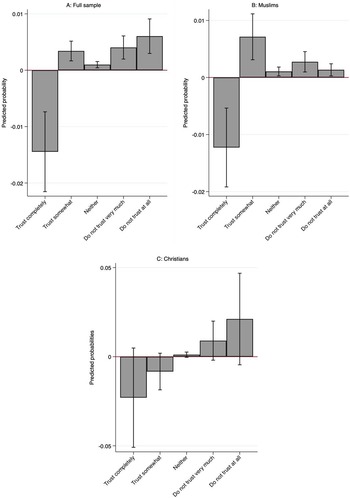
As in the previous case, the average marginal effects for the IV-Ordered Probit models were plotted in Figure 7. A glance at the three panels shows that the effect of pastoral conflict on distrust in Muslims is largest in the ‘trust completely’ response category. Panel A, based on the full sample, shows that a 1-unit increase in the number of conflicts within a 10 km radius of respondents’ dwellings increases their probability of choosing the ‘do not trust at all’ response by 0.6 percentage points when asked about the extent to which they trust Muslims. This effect size is much smaller than that for distrust in the Fulani (1.4 percentage points). By contrast, a 1-unit increase in pastoral conflict reduces the probability of choosing the ‘trust completely’ category by 1.4 percentage points – a slightly larger effect than in the case of the Fulani (1.3 percentage points).
Average marginal effect of pastoral conflict on distrust in Muslims.
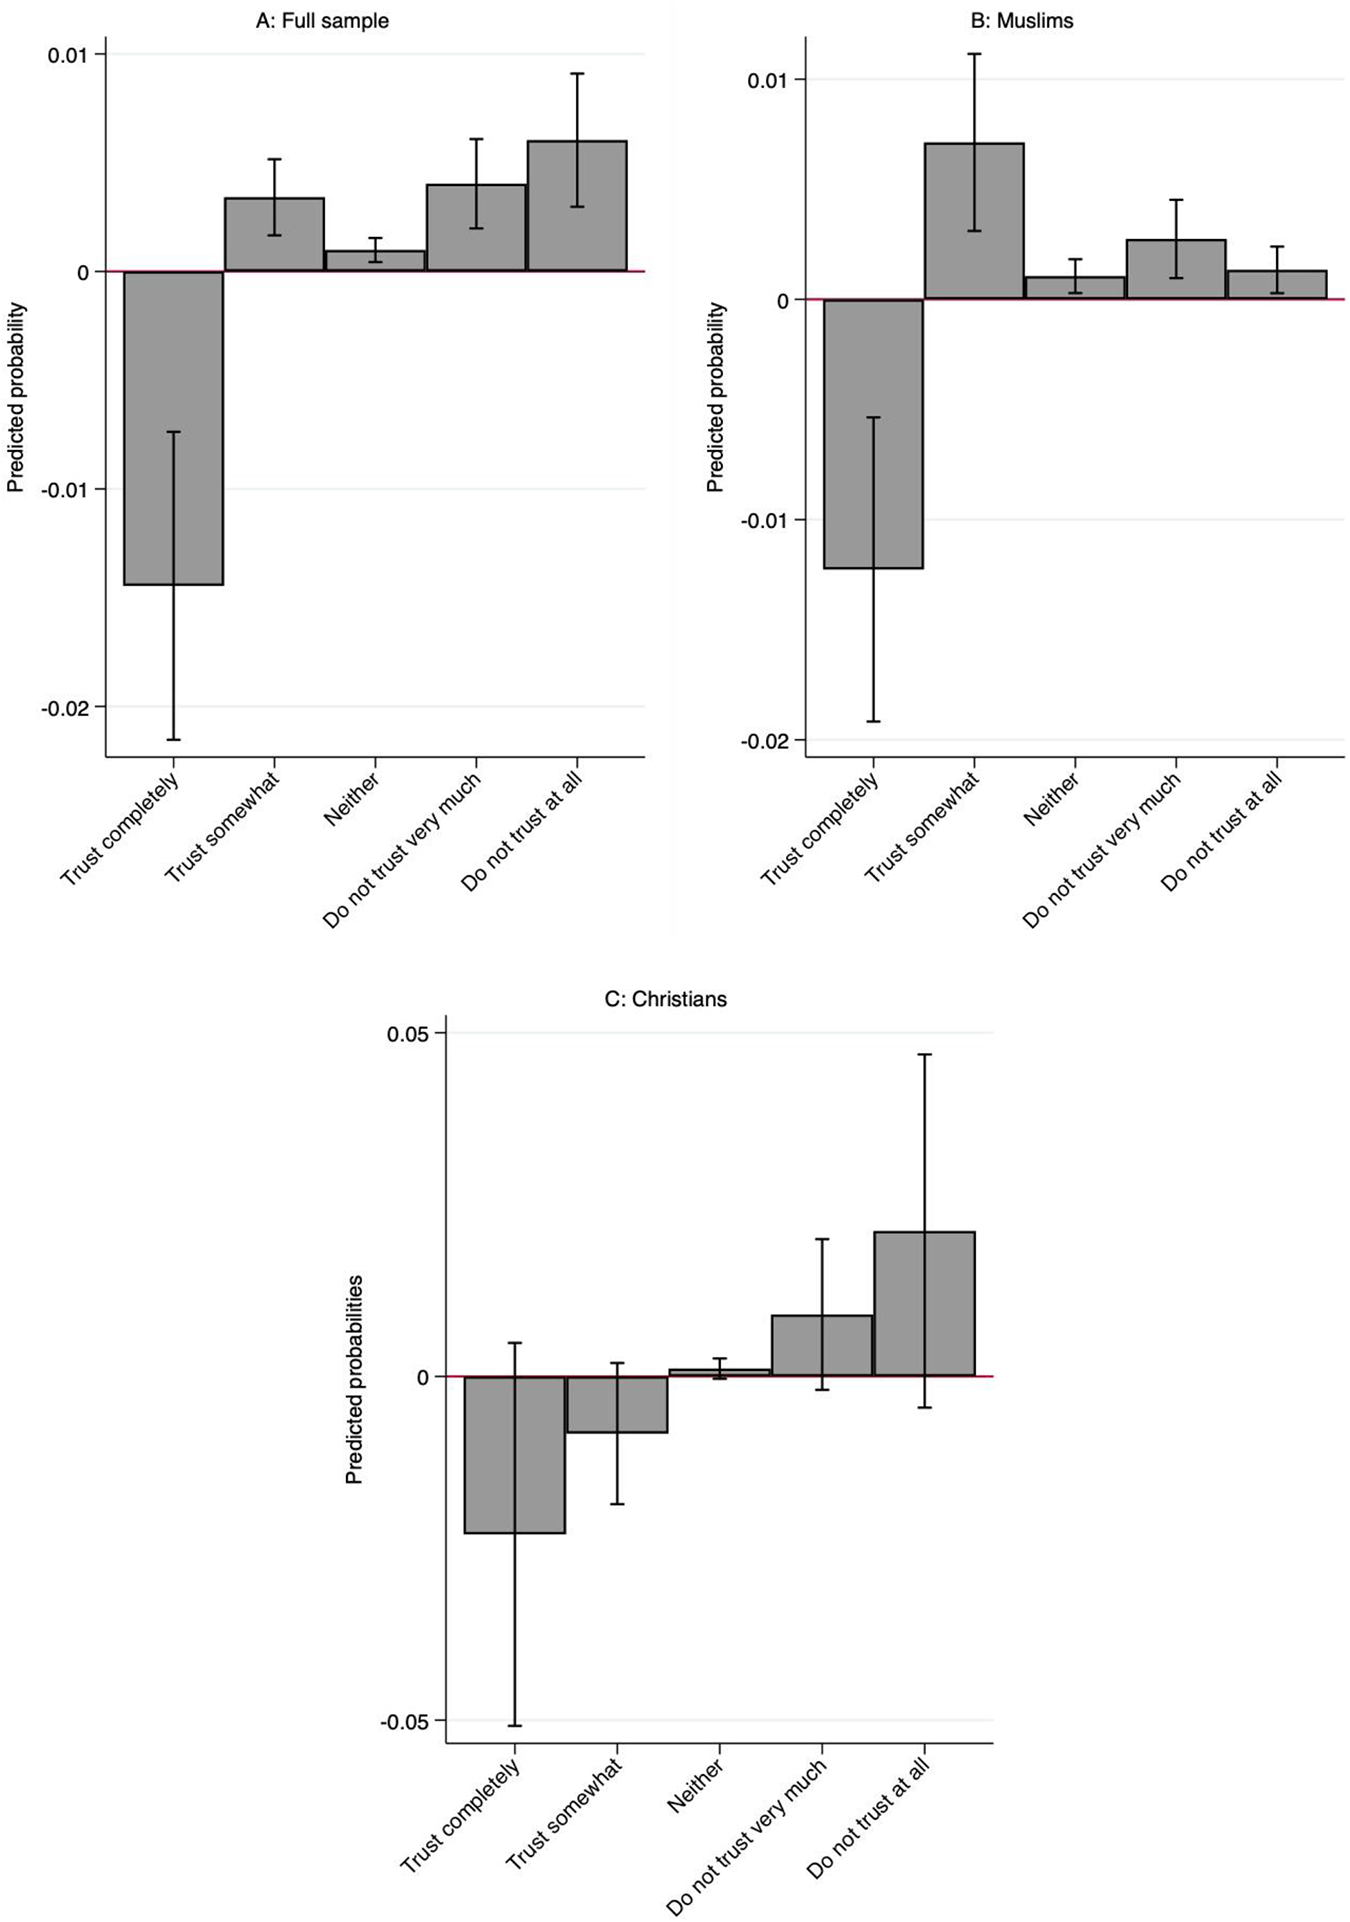
Panel B, based on the Muslim subsample, shows that a 1-unit increase in pastoral conflict increases the probability of selecting ‘do not trust at all’ by 0.1 percentage points. This is smaller than the corresponding effect for distrust in the Fulani (0.8 percentage points). Conversely, a 1-unit increase in pastoral conflict reduces the probability of choosing ‘trust completely’ by 1.2 percentage points, an effect similar to that found for distrust in the Fulani. Finally, panel C, based on the Christian subsample, shows that all confidence intervals cross the horizontal line at zero, suggesting no statistically significant effect of pastoral conflict on any of the five trust categories. Notably, all p-values exceed 0.10, meaning that even at the 90 per cent confidence level, the intervals would still include zero. This result, consistent with that found when focusing on distrust in the Fulani, is particularly striking because the coefficient for pastoral conflict in Model 4 (Table 4) is statistically significant at the 5 per cent level.
5. Discussion
The regression results indicate that, among the population in Kaduna, exposure to pastoral conflict leads to distrust in both members of the Fulani ethnic group and the broader Muslim population (Hypothesis 1). One plausible explanation for this finding is a contagion effect, whereby nomadic pastoralists are associated with the broader Fulani population and the larger Muslim community, even though they constitute only a fraction of these groups’ membership. Given this context, it is not surprising that conflicts involving nomadic pastoralists are often interpreted through a religious lens. Qualitative evidence supports this association. In a study conducted in Benue State, which has also witnessed a high incidence of pastoral conflict (see Table A7 in the appendix), Nwankwo (Reference Nwankwo2024b) found that sedentary farmers often interpret pastoral conflicts as a continuation of the jihad of the early 19th century, aimed at converting their communities to Islam and dispossessing them of their lands.
Consistent with the population-level results, the analysis shows that among Muslims, exposure to pastoral conflicts erodes trust in both the Fulani community and the broader Muslim population (Hypothesis 2a). In contrast, a null effect is observed among Christians. This result is inconsistent with Hypothesis 2b, which predicts that such exposure would increase distrust in both the Fulani and Muslims among Christians. The negative effect observed among Muslims likely operates through the erosion of in-group trust. Because of their shared religion, which positions them in the same in-group, Muslims may interpret attacks involving nomadic pastoralists on their communities as betrayals, which in turn diminishes their trust in both the Fulani and Muslims. This sense of betrayal may stem from the higher levels of trust Muslims exhibit towards the Fulani, as evidenced in Figure 1.
Survey evidence further supports this pattern. The TRANSMIT survey asked respondents about the extent to which they believed pastoral conflicts were caused by religion and by adverse effects of climate change, such as drought. Thirty-four per cent of the population in Kaduna agreed that religion was a cause of pastoral conflicts, while 22 per cent attributed them to droughts. Disaggregating the data by religious affiliation revealed a clear pattern: one in two Christians (52 per cent) agreed that religion was a driver of the conflict, compared to less than one in five Muslims (17 per cent). The hesitance among Muslims to associate the conflict with religion may reflect their shared in-group membership with pastoralists, which makes in-group–out-group distinctions more difficult to establish.
Religion in Nigeria has often served as an umbrella that unites people of different ethnicities, reflecting its primacy over ethnic identification (Tuki, Reference Tuki2024a, p. 8).Footnote 19 Research has also shown that exposure to violent conflict is more likely to diminish in-group trust in ethnically homogeneous enclaves (Lewis and Topal, Reference Lewis and Topal2023). This pattern mirrors the case of Kaduna, where persistent interreligious violence has led to residential segregation along religious lines (Hoffmann, Reference Hoffmann2017; Scacco and Warren, Reference Scacco, Warren, Cammett and Jones2021).
The null effect observed among Christians, though surprising, may be rooted in the fact that religious divisions between Muslims and Christians long predate the more recent outbreak of violent pastoral conflicts. In other words, even in the absence of such conflicts, religious divides were already salient, meaning these newer conflicts merely fit into the mould of pre-existing cleavages rather than creating new ones. Violent pastoral conflicts are, in fact, quite a recent phenomenon, rarely occurring before 2009 (Tuki, Reference Tuki2025a, pp. 3–4). To understand why they do not significantly influence Christian attitudes today, it is necessary to situate them within the broader history of ethnoreligious division in Kaduna.
Until its capture by the British in 1903, most of Nigeria's Northern Region was part of an Islamic caliphate consisting of several emirates. The northern part of present-day Kaduna belonged to the Zaria Emirate, while the predominantly Christian southern region was inhabited by tribes practising indigenous religions. Slavery was central to the functioning of the emirates, especially for the cultivation of crops and for trade in durable goods. Since Muslims were forbidden from enslaving fellow Muslims due to the brotherhood they shared under a common religion, followers of indigenous religions who had not embraced Islam (i.e., unbelievers) were frequently raided and captured as slaves by jihadists (Van Beek, Reference Van Beek and WEA1988; Suberu, Reference Suberu2013). These southern groups resented enslavement and often resisted jihadist incursions. Some migrated to the Jos Plateau, a highland that proved difficult for the jihadists to capture due to its strategic military advantages and the skill that the tribes who lived there possessed in warfare (Morrison, Reference Morrison and Isichei1982). With the advent of colonialism and Christian missionary activity, many of these indigenous peoples embraced Christianity as a form of resistance against domination by the Muslim emirates (Vaughan, Reference Vaughan2016). As scholars have shown, historical experiences often continue to shape present-day outcomes (Nunn, Reference Nunn2007; Nunn and Wantchekon, Reference Nunn and Wantchekon2011; Besley and Reynal-Querol, Reference Besley and Reynal-Querol2014). This long history of conflict and conversion laid the groundwork for today's entrenched Christian–Muslim divide in Kaduna.
These deep roots are evident in more recent political and social mobilization. The Southern Kaduna People's Union, for example, has long agitated for the creation of a new state in the south, framing its claims in ethnoreligious terms. As Angerbrandt (Reference Angerbrandt2015, p. 236) notes, ‘Southern Kaduna is less a geographical entity than an identity concept referring to those ethnic groups in Kaduna State that share the Christian religion and are unified against what they identify as Hausa–Fulani [Muslim] dominance’. This tense relationship has repeatedly led to violent confrontations. In 2000, the introduction of Shariah law by the Muslim governor of the state led to violent Muslim–Christian clashes that left over two thousand people dead (Human Rights Watch, 2003; Angerbrandt, Reference Angerbrandt2011). Similar patterns emerged during the 2011 post-election violence, when disputes over the presidential result spiralled into sectarian attacks in which both Christians and Muslims killed each other and destroyed mosques and churches (Human Rights Watch, 2011). These episodes demonstrate how historical cleavages continue to manifest in modern politics and intergroup relations, reinforcing rather than reshaping religious divides.
While this history helps explain the null effect, another plausible factor is that Christians may be able to distinguish Fulani pastoralists from the broader Fulani and Muslim populations, having coexisted with these groups for generations. In other words, the violent actions of nomadic pastoralists do not necessarily spill over into Christians’ perceptions of Fulani or Muslims in general. Studies conducted in Kaduna show that, in times of peace, interactions between Muslims and Christians (such as in marketplaces) are generally cordial (Scacco and Warren, Reference Scacco, Warren, Cammett and Jones2021). Nonetheless, it is important to note that, compared to Muslims, Christians are, on average, more distrustful of both the Fulani and Muslims, as indicated by the negative coefficient associated with Muslim affiliation in the regression results. Figure A1 in the appendix plots the average marginal effects of religious affiliation on distrust in the Fulani and Muslims.
6. Conclusion
This study examined the effect of pastoral conflicts on distrust towards members of the Fulani ethnic group and Muslims in the Northern Nigerian state of Kaduna. Regression analyses show that exposure to pastoral conflict increases distrust in both groups. This suggests a contagion effect, where members of the Fulani ethnic group are conflated with the broader Muslim population because nomadic Fulani pastoralists are Muslim. Disaggregating the data by religious affiliation reveals that, among Muslims, conflict exposure also diminishes trust in both the Fulani and Muslims. Among Christians, however, exposure to pastoral conflict has no statistically significant effect. The negative effect observed among Muslims indicates that pastoral conflicts erode in-group trust, despite shared religious identity. In contrast, the null effect among Christians may reflect the fact that religious polarization in Kaduna is already very salient, so these conflicts reinforce pre-existing fault lines without generating new ones.
These results have some policy implications. Since pastoral conflict erodes trust in both Muslims and the Fulani, even among Muslims, shared religious affiliation is not sufficient to ensure solidarity; grievances also matter. The Nigerian government should therefore pursue policy initiatives that foster dialogue and reconciliation not only between Muslims and Christians but also within the Muslim community. The null effect among Christians highlights that policymakers should not assume conflict automatically produces higher distrust, especially where religious divisions are already entrenched. Instead, efforts should focus on addressing deep-rooted grievances. The absence of trust weakens social networks, undermines cooperation and impedes collective action, all of which are crucial for the functioning of societies. Policies should thus prioritize trust-building mechanisms, such as joint community projects and intergroup dialogues, which have been shown to increase intergroup trust even in the Nigerian context (Eke, Reference Eke2022; Grady et al., Reference Grady, Wolfe, Dawop and Inks2023).
Finally, a limitation of this study is its exclusive reliance on large-N quantitative data. While such data capture broad patterns, they cannot fully highlight the nuances of individual experiences that shape the mechanisms behind statistical relationships. Future research should therefore investigate the determinants of distrust in Kaduna using qualitative approaches, such as in-depth interviews and focus group discussions.
Supplementary material
The supplementary material for this article can be found at https://doi.org/10.1017/S1355770X26100424.
Data availability statement
The data and do-files underlying the regression models are available in the Harvard Dataverse: https://doi.org/10.7910/DVN/R0Z3ND.
Acknowledgements
The author thanks the co-editor, Prof. Jeff Vincent, two anonymous reviewers, and Hussaini Kwari and Alex Scacco for their helpful comments. Earlier versions of this paper were presented to members of the Transnational Perspectives on Migration and Integration (TRANSMIT) research consortium, at the 2023 German Development Economists Conference in Dresden and at a colloquium organized by the Migration, Integration and Transnationalization Research Unit at the WZB Berlin Social Science Center, Germany. Thanks are given to the participants for their feedback and Roisin Cronin for editorial assistance.
Funding
Financial support from the German Federal Ministry for Family Affairs, Senior Citizens, Women and Youth (BMFSFJ) is gratefully acknowledged. This research was conducted while the author was employed as a researcher at the WZB Berlin Social Science Center, Germany. Funding for open access was provided by the same institution.
Conflict of interest
None.
Ethical approval
Ethical approval for the survey conducted in Nigeria was granted by the WZB Berlin Social Science Center Ethics Review Committee (Application No.: 2020/3/101) and the National Health Research Ethics Committee of Nigeria (NHREC).





 Open access

