


1 Introduction
Relaxation of a magnetized plasma is a fundamental problem in laboratory and space plasma physics (Woltier Reference Woltier1958; Taylor Reference Taylor1974; Priest & Forbes Reference Priest and Forbes2000). In this work we are particularly interested in the relaxation processes in highly magnetized astrophysical plasmas, where the magnetic field controls the overall dynamics of the plasma, and the dissipation of magnetic energy may power the observed high-energy emission. The most relevant astrophysical settings include magnetars (strongly magnetized neutron stars possessing super-strong magnetic fields Thompson & Duncan Reference Thompson and Duncan2001; Kaspi & Beloborodov Reference Kaspi and Beloborodov2017), pulsars and pulsar wind nebulae (Gaensler & Slane Reference Gaensler and Slane2006), jets of active galactic nuclei and  $\gamma$-ray bursters (Lyutikov Reference Lyutikov2006). All these objects are efficient emitters of X-rays and $\gamma$-rays, and in the past two decades they have been subjects of intensive observational study via a number of successful high-energy satellites. These objects seem to share one important property – they include relativistic magnetized plasmas, and often the plasma is magnetically dominated, i.e. the energy density of this plasma is mostly contributed not by the rest mass energy of matter, but by the energy of the magnetic field. This is dramatically different from laboratory plasmas, magnetospheres of planets and interplanetary plasma. This extreme regime can only be probed (although, indirectly) via observations of relativistic astrophysical sources, by unveiling the imprint left by the magnetic field dissipation on the observed emission.
In addition to high (relativistic) magnetization, astrophysical plasmas differ from laboratory ones by the absence of pre-arranged conducting walls. This has important implications for stability and the applicability of the Taylor relaxation principle as we discuss below.
2 Spheromaks and magnetohydrodynamic relaxation
Particularly important are static equilibria when magnetohydrodynamic (MHD) equations demand
 \begin{equation} \boldsymbol{\nabla} p = \boldsymbol{J} \times \boldsymbol{B}, \end{equation}
where  $p$ is plasma pressure, and $\boldsymbol {J}$ and $\boldsymbol {B}$ are the current density and magnetic field. For magnetically dominated regimes, the pressure gradient is negligible, and plasma equilibrium becomes a force-free equilibrium (Chandrasekhar & Kendall Reference Chandrasekhar and Kendall1957)
 \begin{equation} \boldsymbol{J} \times \boldsymbol{B} \approx 0. \end{equation}
Of particular importance is the Taylor state, where  $\boldsymbol {J} \propto \boldsymbol {\nabla } \times \boldsymbol {B} = \lambda \boldsymbol {B}$ with spatially constant $\lambda$. An initially turbulent plasma is expected to spontaneously relax (or self-organize) to a simple, well-defined Taylor state. In a finite volume the system reaches a state with the smallest possible $\lambda$ (largest scale configurations). In a cylindrical geometry the corresponding configurations – Lundquist states (Lundquist Reference Lundquist1951) – are indeed the endpoints of relaxation (Kadomtsev Reference Kadomtsev1987). Importantly, Lundquist states are, in a sense, connected to walls – they extend infinitely along the symmetry axis.
In a spherical geometry the force-free configurations with constant  $\lambda$ are called spheromaks (Rosenbluth & Bussac Reference Rosenbluth and Bussac1979; Bellan Reference Bellan2000). Spheromaks have a number of features that make them useful as basic plasma structures, the building blocks of plasma models. First, spheromaks are not connected to any confining wall such as that of a laboratory vessel or to coils and hence represent a ‘pure’ kind of plasma configuration that could be achieved by internal plasma relaxation. Internally, spheromaks are simply connected (not topological tori). Second, they represent a relaxed (Taylor) state – one might expect that a turbulent plasma would spontaneously relax (or self-organize) to a simple state resembling a spheromak.
Astrophysical plasmas like those found in magnetar magnetospheres (Thompson & Duncan Reference Thompson and Duncan2001; Lyutikov Reference Lyutikov2003; Komissarov, Barkov & Lyutikov Reference Komissarov, Barkov and Lyutikov2006; Masada et al. Reference Masada, Nagataki, Shibata and Terasawa2010) are likely to evolve into a force-free configuration, effectively confined through the creation of a system of nested poloidal flux surfaces. Given the appropriate initial conditions, spheromaks can form spontaneously due to plasma instabilities and hence can be hypothesized to form in an astrophysical environment. For example, it was suggested that spontaneous instabilities arising in plasmas can lead to a spheromak configuration, which suggests that such configurations should occur in nature. Indeed, the magnetically confined fireball picture has been invoked to explain coronal mass ejections arising in solar flares (Ivanov & Kharshiladze Reference Ivanov and Kharshiladze1985; Masada et al. Reference Masada, Nagataki, Shibata and Terasawa2010; Lyutikov & Gourgouliatos Reference Lyutikov and Gourgouliatos2011) and high-energy flaring/bursting activity of magnetars (Thompson & Duncan Reference Thompson and Duncan2001; Lyutikov Reference Lyutikov2003; Mastrano & Melatos Reference Mastrano and Melatos2008).
In this paper we are mostly interested in astrophysical applications, particularly in the high magnetization regime. First, in that case the effects of a finite gyroradius are not important. For example, in the magnetospheres of magnetars the magnetic field is of the order of the quantum field, so that even at relativistic temperatures the gyro-radius is only  ${\sim }10^{-11}$ cm, many orders of magnitude smaller than the expected overall size of ${\sim }10^6$ cm. Thus, astrophysical configurations we are interested in are well in the MHD regime. Secondly, stability of spheromaks and field-reversed configurations (FRC) in laboratory setting depends on the arrangement of confining conducting walls (Rosenbluth & Bussac Reference Rosenbluth and Bussac1979; Sato & Hayashi Reference Sato and Hayashi1983; Belova et al. Reference Belova, Jardin, Ji, Yamada and Kulsrud2000, Reference Belova, Davidson, Ji and Yamada2006). In contrast, astrophysical configurations are generally expected to be less affected by the presence of conducting walls. Spheromaks also present a simple analytically tractable configuration, as opposed to FRC configurations where the initial state has to be calculated numerically.
In contrast to the cylindrical Lundquist case, the three-dimensional (3-D) magnetically confined basic spheromaks are unstable in the absence of conducting walls (Rosenbluth & Bussac Reference Rosenbluth and Bussac1979; Sato & Hayashi Reference Sato and Hayashi1983). The basic reason for instability is that the magnetic dipole moment of a trapped spheromak is anti-aligned with an external magnetic field. As a result, a magnetically confined spheromak is intrinsically unstable and would prefer to tilt to lower its magnetic potential energy. A number of authors considered the stabilizing effects of conducting magnets on the evolution of the spheromak (Bondeson et al. Reference Bondeson, Marklin, An, Chen, Lee and Liu1981; Finn, Manheimer & Ott Reference Finn, Manheimer and Ott1981; Belova et al. Reference Belova, Jardin, Ji, Yamada and Kulsrud2001); see Jarboe (Reference Jarboe1994) for review of spheromak research.
In this paper, we reanalyse the structure and time evolution of magnetically confined spheromaks using 3-D MHD and particle-in-cell (PIC) simulations with an application to astrophysical plasmas occurring in magnetar magnetospheres. Previously, reconnection and particle acceleration due to current-driven instabilities in Newtonian, initially force-free plasmas in 2.5-D and 3-D scenarios using high-resolution simulations both with a fixed grid and with adaptive mesh refinement were studied extensively in Ripperda et al. (Reference Ripperda, Porth, Xia and Keppens2017). In 2.5-dimensions, the two parallel repelling current channels in an initially force-free equilibrium are first subject to a linear instability consisting of an antiparallel displacement and thereafter undergo a rotation and twisting motion. They quantify the growth rate of this tilting instability by a linear growth phase in the bulk kinetic energy during which reconnection of magnetic field lines causes the formation of nearly singular current sheets and secondary islands, leading to particle acceleration. Our 3-D MHD simulation (§ 3.3 and figures 1 and 2) of the force-free spheromak clearly displays the onset of a similar tilt instability and twisting motion which leads to magnetic reconnection at the boundaries between the spheromak and the external field, causing the spheromak to eventually dissipate.
Slice in the  $xz$ plane of MHD simulation of the lowest-energy Taylor state. Times indicated in the panels are in units of the Alfvénic crossing time $t_A=r_0/v_A$. Colours indicate plasma density while vectors depict $\boldsymbol {B3D}$.

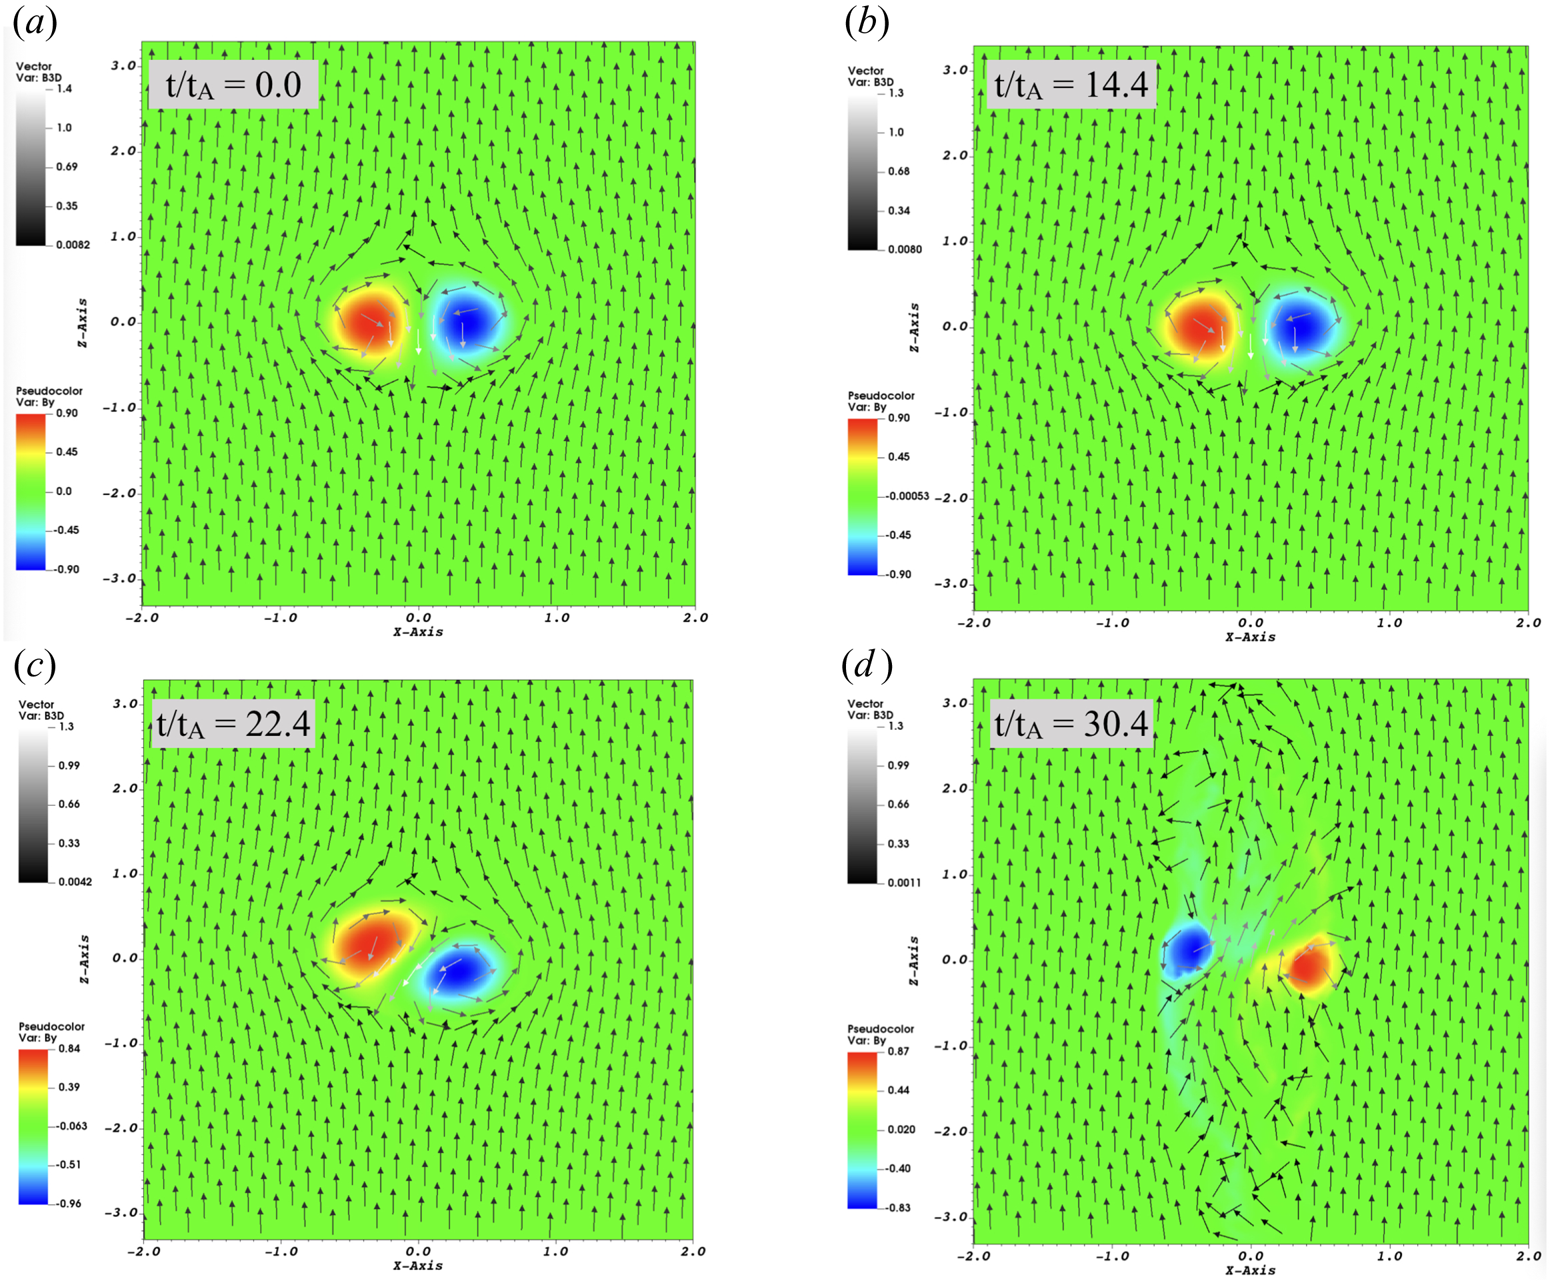
Same as figure 1 but showing the value of toroidal magnetic field  $B_y$ (colour scheme); vectors depict $\boldsymbol {B3D}$.
3 Spheromak in external magnetic field
3.1 Basic spheromak
Let us first briefly recall the structure of magnetically confined spheromaks. In the Grad–Shafranov formalism (Shafranov Reference Shafranov1966; Grad Reference Grad1967) the magnetic field can be represented by a scalar flux function  $\psi$ in spherical coordinates
 \begin{equation} \boldsymbol{B}=\boldsymbol{\nabla}\psi\times\boldsymbol{\nabla}\phi+\lambda\psi\boldsymbol{\nabla}\phi, \end{equation}
where  $\phi$ is the toroidal coordinate. An axisymmetric solution of (3.1) within a sphere of radius $r_0$ and constant $\lambda$ is a spheromak (Rosenbluth & Bussac Reference Rosenbluth and Bussac1979; Bellan Reference Bellan2000).
Using (3.1) and the condition for the Taylor state, the Grad–Shafranov equation of axisymmetric force-free toroidal plasma equilibrium can be represented in spherical coordinates (Tsui Reference Tsui2008)
 \begin{equation} r^2\frac{\partial^2\psi}{\partial r^2}+\sin\theta \frac{\partial}{\partial\theta}\left(\frac{1}{\sin\theta}\frac{\partial\psi}{\partial\theta}\right)+(\lambda r)^2\psi=0 \end{equation}
Equation (3.2) can be solved using separation of variables inside and outside the spheromak.
Inside the spheromak, the magnetic field components are
 \begin{align} \left.\begin{array}{c@{}} \displaystyle {B}_{r} = 2A_0\dfrac{\lambda}{r}j_1(\lambda r)\cos\theta,\\ \displaystyle {B}_{\theta} = -A_0\dfrac{\lambda}{r}\dfrac{\partial}{\partial r}(r j_1(\lambda r))\sin\theta,\\ \displaystyle {B}_{\phi} = A_0{\lambda}^2j_1(\lambda r)\sin\theta, \end{array}\right\} \end{align}
where,  $j_1(\lambda r)$ is spherical Bessel function of the first kind.
The radial and toroidal components of magnetic field vanish on the surface of the spheromak which corresponds to  $j_1(\lambda r) = 0$ at $r=r_0$. This gives the smallest allowed $\lambda$ corresponding to the lowest-energy Taylor state
 \begin{equation} \lambda \approx 4.493/{r_0}. \end{equation}
Outside the spheromak, the magnetic field is
 \begin{equation} \boldsymbol{B_\textrm{ex}} = \left(B_0\cos\theta - B_0\cos\theta \frac{r_0^3}{r^3},-B_0\sin\theta - B_0\sin\theta\frac{r_0^3}{2r^3},0\right), \end{equation}
where the magnetic field at very large distances asymptotes to a uniform field  $B_0 \hat {z}$. Since, the magnetic field at the surface of the spheromak is continuous, the constant $A_0$ can be related to the external magnetic field $B_0$
$B_0$
 \begin{equation} A_0 \approx -0.342B_0r_0^2. \end{equation}
3.2 Tilt instability of a spheromak in an external magnetic field
The basic magnetically confined spheromak is unstable. The easiest way to see this is to note that a spheromak can be approximated as a magnetic dipole  $\boldsymbol {\mu }$ embedded in an external magnetic field
 \begin{equation} \boldsymbol{\mu} = \frac{-B_0r_0^3}{2}\hat{z}. \end{equation}
Equation (3.7) shows that the magnetic moment of a spheromak is anti-aligned with the external magnetic field and hence subject to tilt. Tilt instability of a spheromak has been explored extensively by Bellan (Reference Bellan2000) and Jardin (Reference Jardin1986), both of which serve to validate the arguments made in this paper.
In Bellan (Reference Bellan2000) the spheromak is described as a small magnet between two large magnets oriented anti-parallel to large external magnets, hence being unstable to tilting. The flipping of a spheromak by 180 $^{\circ }$ to lower its potential energy, however, causes the external field to be such as to enhance rather than balance the spheromak hoop force. Equilibrium is quickly lost and the spheromak will explode outwards at Alfvén velocity. Our 3-D MHD simulations of § 3.3 show this dissipation of the spheromak after undergoing tilt instability and aid us in estimating the dissipation time scale in units of the Alfvénic crossing time.
In Jardin (Reference Jardin1986), a spheromak is described simply as a rigid current carrying ring and its various rigid instabilities like tilting, shifting and vertical motions are discussed as modes which get activated depending on the value of the magnetic field index  $n=-(r/B_0)(\partial {B_0}/\partial {r})$ where $B_0$ is the magnitude of the external vertical magnetic field. The tilting mode is unstable for $n<1$. For laboratory spheromak experiments, the growth rate of these instabilities, which would eventually cause the spheromak to dissipate, is estimated to be $1\text {--}10\ \mathrm {\mu }$s. We estimate such a time scale for astrophysical plasmas using results of our 3-D MHD simulations.
3.3 Three-dimensional MHD simulations of tilting instability
3.3.1 Numerical set-up
We perform 3-D MHD simulations of the lowest-energy Taylor state as described by (3.3) and (3.4) as well as the 2-root spheromak with constant-density uniformly magnetized plasma to explore their time evolution and test their stability. The simulations were performed using a 3-D geometry in Cartesian coordinates using the PLUTO codeFootnote 1 (Mignone et al. Reference Mignone, Bodo, Massaglia, Matsakos, Tesileanu, Zanni and Ferrari2007). PLUTO is a modular Godunov-type code entirely written in C, intended mainly for astrophysical applications and high Mach number flows in multiple spatial dimensions and designed to integrate a general system of conservation laws
 \begin{equation} \frac{\partial \boldsymbol{U}}{\partial t} = -\boldsymbol{\nabla}.\boldsymbol{T}(\boldsymbol{U}) + \boldsymbol{S}(\boldsymbol{U}), \end{equation}
where  $\boldsymbol {U}$ is the vector of conservative variables and $\boldsymbol {T}(\boldsymbol {U})$ is the matrix of fluxes associated with those variables. For our ideal MHD set-up, no source terms are used and $\boldsymbol {U}$ and $\boldsymbol {T}$ are
 \begin{equation} \boldsymbol{U} = \begin{pmatrix} \rho\\ \boldsymbol{m}\\ \boldsymbol{B}\\ E \end{pmatrix},\quad \boldsymbol{T}(\boldsymbol{U}) = \begin{bmatrix} \rho \boldsymbol{v} \\ \boldsymbol{mv} - \boldsymbol{BB} + p_t \boldsymbol{I} \\ \boldsymbol{vB - Bv} \\ (E + p_t)\boldsymbol{v} - \boldsymbol{(v.B)B} \end{bmatrix}^{\textrm{T}}, \end{equation}
where  $\rho , \boldsymbol {v}$ and $p$ are density, velocity and thermal pressure. $\boldsymbol {m} = \rho \boldsymbol {v}$, $\boldsymbol {B}$ is the magnetic field and $p_t = p + |{\boldsymbol {B}}|^{2}/2$ is the total (thermal $+$ magnetic) pressure, respectively. Magnetic field evolution is complemented by the additional constraint $\boldsymbol {\nabla }\boldsymbol {\cdot }\boldsymbol {B}=0$. Total energy density $E$
$E$
 \begin{equation} E = \frac{p}{\varGamma - 1} + \frac{1}{2}\left(\frac{|\boldsymbol{m}|^{2}}{\rho} + |{\boldsymbol{B}}|^{2}\right), \end{equation}
along with an isothermal equation of state  $p = c_s^2 \rho$ provides the closure; $\varGamma$ and $c_s$ are the polytropic index and isothermal sound speed, respectively. MP5_FD interpolation, a third-order Runge–Kutta approximation in time, and an Harten–Lax–Van Leer Riemann solver are used to solve the above ideal MHD equations.
The plasma has been approximated as an ideal, non-relativistic adiabatic gas, one particle species with a polytropic index of 5/3. The size of the domain is  $x \in [-2, 2]$ and $y \in [-2, 2]$, $z \in [-3.3, 3.3]$. To better resolve the evolution of the spheromak, non-uniform resolution is used in the computational domain with total a number of cells $N_\textrm {X}=N_\textrm {Y} = 312$ and $N_\textrm {Z} = 520$. We also check that decreasing the resolution by a factor of two, that is, $N_\textrm {X}=N_\textrm {Y} = 156$ and $N_\textrm {Z} = 260$, does not affect the simulation results. Convergence will be evident later in figures 4 and 5. Outflow boundary conditions are applied in all three directions.
In the simulation, values for constant external magnetic field  $B_0$, radius of spheromak $r_0$ and plasma density $\rho$ were set to 0.3, 0.75 and 1 respectively. With a magnetization $\sigma =B_0^2/\rho =0.09$, the Alfvén speed $v_A$ is only mildly relativistic and given by $v_A=B_0/\sqrt {\rho }=0.3$. Our motive here is to place more stress on astrophysical applications, in particular magnetar magnetospheres, where the Alfvén velocity is expected to be relativistic; $B_0$, $r_0$ and $\rho$ are used to estimate a time scale of propagation of magnetic oscillations within the spheromak in terms of the Alfvénic crossing time $t_{A}=r_0/v_A = 2.5$. The time scale over which the spheromak disrupts is estimated later in units of $t_A$. Projections of total magnetic field and current density in the $xz$ plane are denoted by $\boldsymbol {B3D}$ and $\boldsymbol {J}$ respectively. All quantities are given in code units which are normalized cgs values
 \begin{equation} \rho = \frac{\rho_{cgs}}{\rho_n},\quad v = \frac{v_{cgs}}{v_n},\quad p = \frac{p_{cgs}}{\rho_n v_n^2},\quad B = \frac{B_{cgs}}{\sqrt{4 {\rm \pi}\rho_n v_n^2}} ,\end{equation}
where  $\rho$, $v$,
$v$,  $p$ and $B$ are density, velocity, pressure and magnetic field. Time is given in units of $t_n=L_n/v_n$. The normalization values used are $\rho _n = 1.67 \times 10^{-23}\ \textrm {gr}\ \textrm {cm}^{-3}$, $L_n = 3.1 \times 10^{18}$ cm and $v_n = 10^5$ cm s $^{-1}$.
3.3.2 Tilting instability of basic spheromak
We perform two types of simulations: one with resolution  $312\times 312\times 520$ (I) and another with resolution
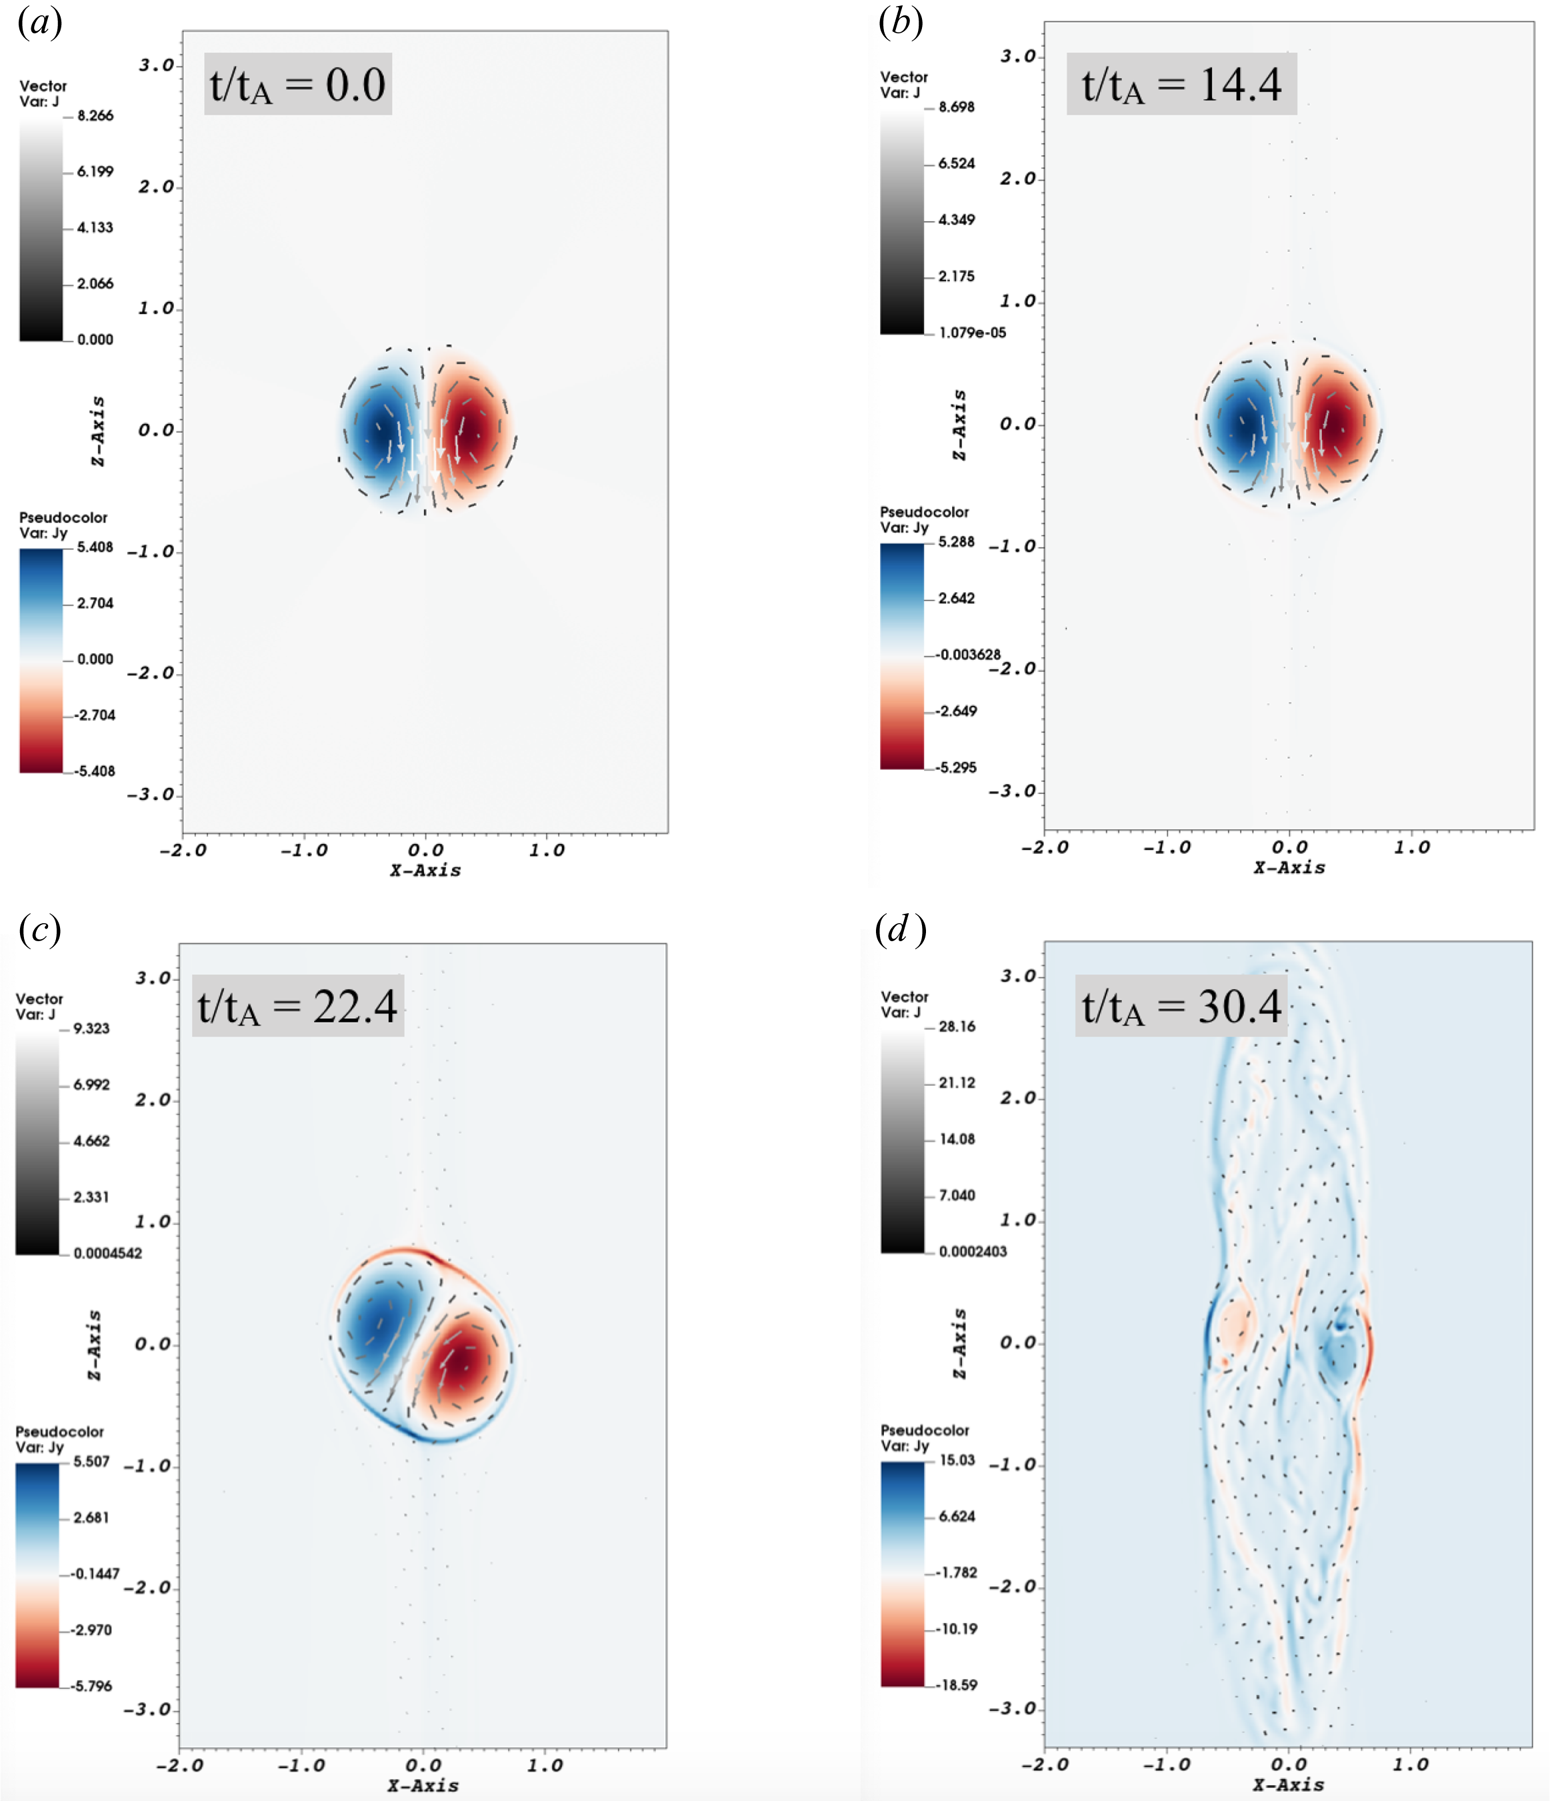
  $156\times 156\times 260$ (II). The following discussion describes results for simulation (I). Figures 1, 2 and 3 display the time evolution of a basic magnetically confined spheromak. Shown are the 2-D ( $xz$ plane) slices of a 3-D simulation. Vectors in figures 1 and 2 denote the total magnetic field projected in the $xz$ plane and those in figure 3 depict total current density projected in the $xz$ plane. Colour bars in figure 1 show plasma density, those in figure 2 show toroidal magnetic field $B_y$ and those in figure 3 show toroidal current density $J_y$. Starting from $t=0$, the spheromak is captured at subsequent time instants where significant changes to its morphology can be observed.
Same as figure 1 showing the value of the toroidal current density  $J_y$ (colour) and vectors $\boldsymbol {J}$. Panel (c) clearly shows the formation of a surface current sheet as the spheromak rotates.
Initially, at  $t=0$, the constant density plasma is in the relaxed lowest-energy state – a spheromak composed of magnetic islands shown by red and blue blobs in figure 2 symmetrical on either side of the $x=0$ ( $z$) axis, depicting poloidal and toroidal components of magnetic field. Magnetic field at the centre of spheromak is $-B_0\hat {z}$, that is, the spheromak's magnetic moment is anti-aligned with the external magnetic field. A basic spheromak is thus unstable against tilt.
Spheromak begins to tilt immediately after  $t=0$. At $t\sim 14.4t_A$, the plasma density inside the spheromak decreases slightly. This is because once dissipation starts, some of the trapped magnetic energy is converted into heat and at the same time magnetic tension within the spheromak decreases. As a result, the spheromak expands and plasma density decreases. At $t\sim 22.4t_A$, tilting is clearly visible; spheromak starts to rotate about the centre and tries to align its magnetic moment with the external field to lower its energy. As the spheromak tilts, the matching of internal and external magnetic fields no longer holds, resulting in a current sheet formation on its surface and the onset of magnetic reconnection. The current density plot in figure 3(c) clearly shows the formation of this current sheet on the surface of spheromak. It should be noted that while there is no resistivity in ideal MHD, the process responsible for dissipation, current sheet formation and magnetic reconnection is numerical resistivity arising due to errors introduced by spatial and temporal discretization.
The simulation terminates at  $t\sim 30.4t_A$, when plasma hits the walls of the simulation domain. In this quasi-final state, which marks the partial disruption of the spheromak, plasma becomes less dense, magnetic islands rotate fully and magnetic field lines near the centre are aligned with the $z$-axis. In figure 1, smaller magnetic islands are still seen about the centre and the magnetic field at their edges is opposite to the external field. Current sheets are still visible around these residual magnetic islands, as seen in figure 3(d). If the simulation is made to run longer, these magnetic islands will also reconnect at the edges and dissipate. The three-dimensional MHD simulation of the lowest-energy Taylor state is concurrent with the argument made in § 3.2 that a spheromak confined in an external magnetic field is intrinsically unstable; it first tries to tilt to lower its energy and eventually dissipates.
3.3.3 Tilt instability growth rate and magnetic energy dissipation
Figure 4 depicts the time evolution of  $\theta$, $\langle E_{\textrm {tot}}^2\rangle /\langle E_{m}^2\rangle$ and $E_{\textrm {tot}}$ for the two different resolutions (I) and (II) and also show convergence. Here, $\theta$ is the tilt angle defined as the angle between the total magnetic field at the origin and the $z$-axis, $\langle E_{\textrm {tot}}^2\rangle$ is the box-averaged squared of total electric field, $\langle E_{m}^2\rangle$ is the maximum value of $\langle E_{\textrm {tot}}^2\rangle$ and $E_{\textrm {tot}}$ is the total electric field at the centre of the spheromak. We choose to normalize the box-averaged squared total electric field by its maximum value in the box assuming the maximum value to remain constant for the duration of the simulation. This helps to visualize the behaviour of the electric field for both resolutions simultaneously. We also checked the behaviour of the $y$ component of the electric field $E_y$ at the spheromak's centre and box-averaged $\langle E_{y}^2\rangle$ and they show the same trend as $E_{\textrm {tot}}$ at the centre and box-averaged $\langle E_{\textrm {tot}}^2\rangle$ respectively.
(a) Time evolution of the tilt angle  $\theta$ in log–linear scale. (b) Time evolution of $\langle E_{\textrm {tot}}^2\rangle /\langle E_{m}^2\rangle$ in log–linear scale. (c) Time evolution of $E_{\textrm {tot}}$ at the centre of spheromak in log–linear scale. In all three, a clear phase of exponential growth can be seen (green dotted line). From the plots, $({\rm \pi} - \theta )\propto \exp {(0.64v_A t/r_0)}$, $\langle E_{\textrm {tot}}^2\rangle /\langle E_{m}^2\rangle \propto \exp {(0.8v_A t/r_0)}$ and $E_{\textrm {tot}} \propto \exp {(0.6v_A t/r_0)}$. The spheromak dissipates in ${\sim }20t_A$ over which instability grows linearly with a growth rate of $0.64/t_A$. Vertical dashed lines indicate the time snapshots used for figures 1 and 2.

Panel (a) shows an initially anti-aligned spheromak with  $\theta \approx {\rm \pi}$ radians. For simulation (I), a straight line fit to the linear phase of the plot clearly depicts an exponential growth of instability within the spheromak from $t \simeq 5t_A$ to $t \simeq 24t_A$ where $\theta ^{'} = ({\rm \pi} - \theta )\propto \exp {(0.64v_A t/r_0)}$. We can quantify the growth rate of tilting through an angle $\theta ^{'}$ by
 \begin{equation} \gamma_t = \frac{1}{\theta^{'}} \frac{\textrm{d}\theta^{'}}{\textrm{d} t} \end{equation}
giving  $\gamma _t = 0.64/t_A$.
The time scale of dissipation of the spheromak is  ${\sim }20t_A$. Similar fits to the linear phase of (b,c) give $\langle E_{\textrm {tot}}^2\rangle /\langle E_{m}^2\rangle \propto \exp {(0.8v_A t/r_0)}$ and $E_{\textrm {tot}} \propto \exp {(0.6v_A t/r_0)}$. Here, we use three distinct measures to estimate the instability growth rate and it is seen that they are slightly different but consistent with each other. These results are also in good agreement with the analysis using PIC simulation, which will be shown in § 3.6.
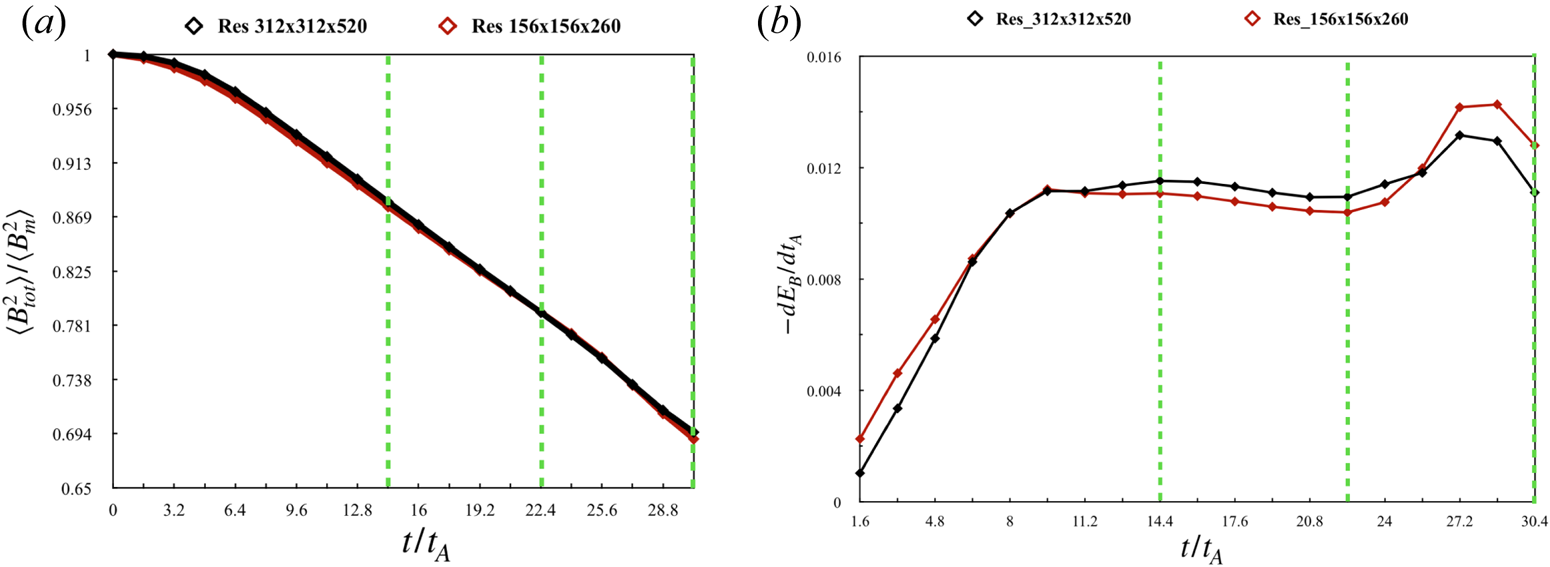
We also plot the time evolution of box-averaged total magnetic energy in terms of  ${\langle B_{\textrm {tot}}^2\rangle }/{\langle B_m^2\rangle }$ and time evolution of rate of magnetic energy release for the two different resolutions. Here, ${\langle B_{\textrm {tot}}^2\rangle }$ is the box-averaged squared total magnetic field, ${\langle B_{m}^2\rangle }$ is the maximum value of ${\langle B_{\textrm {tot}}^2\rangle }$ and $E_B$ is the magnetic energy in the box. Figure 5 shows that the results are independent of resolution. Panel (a) shows that approximately $30\,\%$ of the total magnetic energy is dissipated from the box during the entire evolution of the spheromak from $t=0$ to $t=30.4t_A$. Interestingly, as shown in panel (b), the rate of magnetic energy release stays almost constant during the exponential growth of instability.
(a) Time evolution of box-averaged total magnetic energy for the two different resolutions. Total magnetic energy is plotted in terms of  ${\langle B_{\textrm {tot}}^2\rangle }/{\langle B_m^2\rangle }$. Approximately $30\,\%$ of the initial magnetic energy in the simulation box is dissipated when the spheromak tilts and starts dissipating, eventually hitting the walls. (b) Time evolution of rate of magnetic energy release. Initially, there is a steady increase in the rate until ${\simeq } 8t_A$ after which magnetic energy is released at a constant rate throughout the duration of tilt instability growth. Green dashed lines indicate the time snapshots used for figures 1 and 2.
For simulation (I), we can also estimate an initial magnetic flux in the  $xy$ plane by summing the value of the $z$ component of magnetic field over an $xy$ slice at $t=0$; we find that it is smaller than the value of $B_0 \times N_x \times N_y$, the total magnetic flux in the box without an embedded spheromak. This is due to the fact that magnetic field lines effectively get pushed out of the simulation box once a spheromak is introduced. Thus, it is not very physical to track the time evolution of excess energy in the box (e.g. the difference between the total magnetic energy within the box in the presence of spheromak and energy in the constant magnetic field).
3.4 Qualitative picture of spheromak instability
The time evolution of lowest-energy Taylor state described in § 3.3.2 by 3-D MHD simulations can be described qualitatively, see figure 6. Approximately, the spheromak first flips by  $180^{\circ }$, and then reconnects the part of the magnetic flux counter to the external magnetic field.
Qualitative evolution of tilting instability. Plotted are poloidal magnetic field lines in the  $xz$ plane. Initial spheromak (a) is unstable to tilting, so that the spheromak flips over (b), creating current sheets on the surfaces (highlighted in red-dashed lines). At the core the field inside the spheromak is aligned with the external field (grey circle at the centre). Reconnection at the surface connects the internal field lines to the external field (c) – newly reconnected field lines are highlighted in red. At the same time the external field connects to the fields close to the centre. At this stage there is a donut-shaped toroidal configuration with still counter-aligned fields – this is clearly seen in simulations, panel (d) in figures 1 and 2.
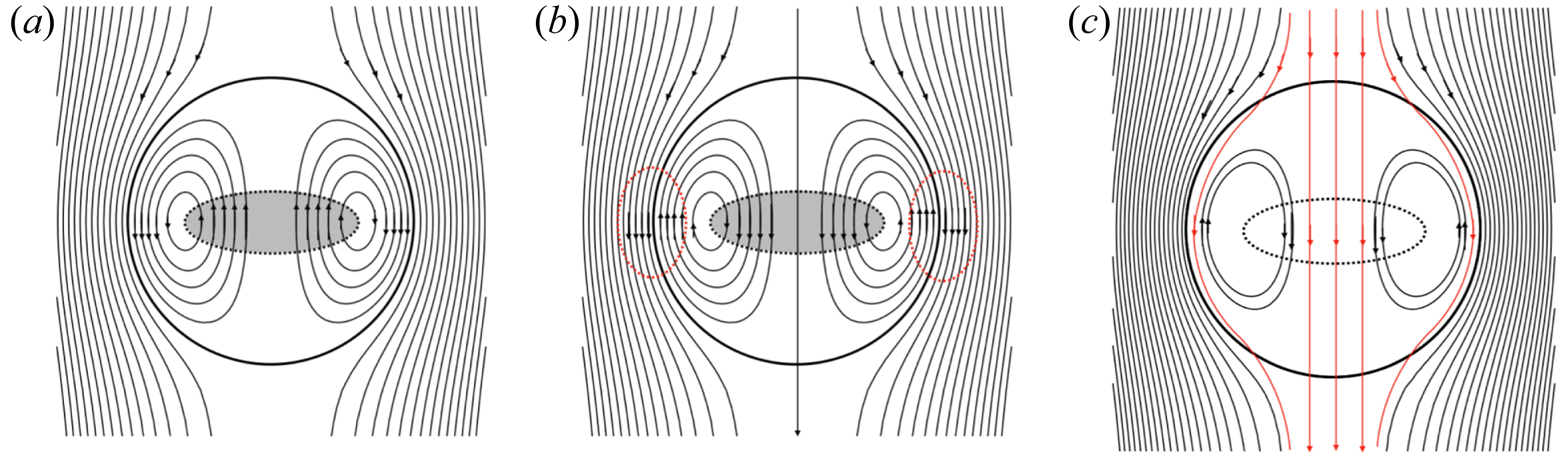
Let us discuss the properties of the configuration after the spheromak flips but before any substantial dissipation sets in. In the equatorial plane  $\theta ={\rm \pi} /2$ there exists a disk of radius $r_*=2.74/\lambda$, defined by the condition $B_\theta =0$ (it is depicted by the grey circle at the centre of panels a,b in figure 6) within which all field lines point along the external field and whose boundary separates it from the region where the field lines are opposite to the external field. This poloidal magnetic field which is directed opposite to the external field constitutes a poloidal flux $\psi _{\textrm {opp}}$ in the equatorial plane that would eventually reconnect with the external field. We estimate this flux using (3.3) in the following discussion.
The total poloidal flux through the spheromak is zero,  $\int _{0}^{r_0}B_\theta 2{\rm \pi} r \,\textrm {d} r = 0$, composed of two counter-aligned contributions at $r< r^*$ and $r> r^*$, each of value
 \begin{equation} \psi_{\textrm{opp}} = \int_{0}^{r_*}B_\theta 2{\rm \pi} r \,\textrm{d} r =2.26 B_0r_0^2. \end{equation}
This is the amount of poloidal flux in the equatorial plane that reconnects and eventually dissipates. Panel (c) in figure 6 shows partial dissipation of the spheromak where newly connected field lines are highlighted in red. At the same time external field connects to the fields close to the centre. At this stage there is a donut-shaped toroidal configuration with still counter-aligned fields. This is clearly seen in the last panels of 3-D MHD simulations of figures 1 and 2.
3.5 Evolution of the second-order spheromak
In addition to the lowest-energy Taylor state, we also simulated the second-order spheromak, corresponding to the second zero of the spherical Bessel function,  $\lambda \approx 7.725/{r_0}$, see figure 7. This case can be thought of as an example of a twisted magnetic configuration (the inner core), confined by another twisted configuration (the outer shell).
Slice in the  $xz$ plane of MHD simulation of 2-root spheromak with $\lambda \approx 7.725/{r_0}$. Times are indicated in the panels in units of the Alfvénic crossing time $t_A=r_0/v_A$. Colours indicate plasma density while vectors depict $\boldsymbol {B3D}$. The 2-root spheromak goes from being symmetrical to the inner spheromak almost totally detaching from the outer one in ${\sim }9.6t_A$.

In these simulations the size of the domain is  $x \in [-2, 2]$, $y \in [-2, 2]$ and $z \in [-2, 2]$. Uniform resolution is used in the computational domain with total number of cells $N_\textrm {X}=N_\textrm {Y}=N_\textrm {Z} = 520$. At time ${\sim }7t_A$, the inner spheromak starts to get expelled from the outer one. By the time ${\sim }9.6 t_A$, the smaller inner spheromak almost totally disconnects from the outer spheromak; the density within it decreases considerably due to magnetic dissipation. After the expulsion of the inner core the two spheromaks evolve nearly independently, similar to the basic spheromak case considered in § 3.3.3.
Similar to the basic spheromak, we show the time evolution of box-averaged total magnetic energy in terms of  ${\langle B_{\textrm {tot}}^2\rangle }/{\langle B_m^2\rangle }$ and time evolution of rate magnetic energy release in figure 8. Panel (a) shows that approximately $23\,\%$ of the total magnetic energy is dissipated from the box during the entire evolution of the 2-root spheromak from $t=0$ to $t=9.6t_A$. Panel (b) depicts that magnetic energy is released at an increasing rate throughout the evolution, unlike the basic spheromak where there was a nearly flat phase during the instability growth.
(a) Time evolution of box-averaged total magnetic energy in terms of  ${\langle B_{\textrm {tot}}^2\rangle }/{\langle B_m^2\rangle }$. Approximately $23\,\%$ of the initial magnetic energy in the simulation box is dissipated when the 2-root spheromak goes from being symmetrical to the inner spheromak almost totally separating from the outer one. (b) Time evolution of rate of magnetic energy release. There is a gradual increase in the rate throughout the entire evolution. Green dashed lines indicate the time snapshots used for figure 7.

3.6 PIC simulation of basic spheromak
We have supplemented our MHD simulations with PIC simulations performed with the 3-D electromagnetic PIC code TRISTAN-MP (Buneman Reference Buneman1993; Spitkovsky Reference Spitkovsky, Bulik, Rudak and Madejski2005). We employ a 3-D cube with 1440 cells on each side, and periodic boundary conditions in all directions. The domain is initialized with a uniform density of cold electron–positron plasma, with 2 computational particles per cell. The skin depth  $c/\omega _\textrm {p}$ is resolved with 2.5 cells. The radius $r_0$ of the spheromak is $50\,c/\omega _\textrm {p}=125$ cells. The strength of the magnetic field $B_0$ is calibrated such that the magnetization $\sigma =B_0^2/(4{\rm \pi} n_0 m c^2)=10$, where $n_0$ is the total particle density, $m$ the electron (or positron) mass and $c$ the speed of light. This implies that the Alfvén speed $v_A=c\sqrt {\sigma /(1+\sigma )}\simeq 0.95c$.
Figure 9 shows the evolution of the magnetic field  $B_y/B_0$ in the $xz$ plane passing through the centre of the spheromak. Arrows represent the $B_x$ and $B_z$ components in that plane. The top left panel presents the initial state of the system. At early times (panel b), the configuration is still close to the initial conditions, while at later times (panel c) the spheromak starts to tilt, in analogy with the MHD simulations presented above. The final state of the system (panel d) is also similar to the MHD results.
PIC simulation of the time evolution of the lowest-order Taylor state. Times are indicated in the panels in units of the Alfvènic crossing time  $t_A=r_0/v_A$. Colours indicate the value of $B_y/B_0$ in the $xz$ plane going through the centre of the spheromak, while arrows indicate the $B_x$ and $B_z$ components.

Further insight into the growth of the tilt instability is presented in figure 10, where we show the evolution of box-averaged  $\langle E_y^2\rangle /B_0^2$, where $E_y$ is the $y$-component of electric field. Vertical dashed lines indicate the time snapshots used for figure 9. A clear phase of exponential growth can be seen from $t/t_A\simeq 3$ to $t/t_A\simeq 6$, with an $\langle E_y^2\rangle$ growth rate ${\simeq } v_A/r_0$ (dotted line). We have checked that the growth rate scales as $r_0^{-1}$ by performing a similar simulation with $r_0=75\,c/\omega _\textrm {p}$. The measured growth rate of the instability is in agreement with that estimated from MHD simulations.
From the PIC simulation of the lowest-order Taylor state, we show the time evolution of box-averaged  $\langle E_y^2\rangle /B_0^2$ in log–linear scale, where $E_y$ is the $y$-component of electric field. Vertical dashed lines indicate the time snapshots used for figure 9. A clear phase of exponential growth can be seen from $t/t_A\simeq 3$ to $t/t_A\simeq 6$, with $\langle E_y^2\rangle \propto \exp {(v_A t/r_0)}$ (dotted line).

4 Discussion and conclusions
In this paper we consider the tilting instability of magnetically confined spheromaks using 3-D MHD and PIC simulations. We consider the astrophysically important mildly relativistic regime, when the Alfvén velocity approaches the velocity of light. In addition to the basic spheromak (Ripperda et al. Reference Ripperda, Porth, Xia and Keppens2017) we also consider a second-order spheromak, as an example of a magnetically twisted configuration (the inner core) confined by the magnetically twisted shell.
We find that in all cases confined spheromaks are highly unstable to tilting instabilities. The instability is driven by the fact that, initially, the magnetic moment of the spheromak is counter-aligned with the confining magnetic field. As a result, the spheromak flips, indicative of a tilt instability. This creates current layers at the boundary. The resulting reconnection between the internal and confining magnetic fields leads to partial annihilation of the spheromak's poloidal magnetic flux with the external magnetic field. At the same time, the toroidal magnetic field and the associated helicity (or relative helicity Jarboe Reference Jarboe1994; Bellan Reference Bellan2018) of the initial configuration are carried away by torsional Alfvén waves (in the sense that the initial configuration has finite helicity, while the eventual final configuration – just straight magnetic field lines – has zero helicity).
The evolution of the basic spheromak is generally consistent with previous results. The tilting instability of a spheromak in a cylindrical geometry has been explored by Bondeson et al. (Reference Bondeson, Marklin, An, Chen, Lee and Liu1981) and Finn et al. (Reference Finn, Manheimer and Ott1981) where they analyse the growth rate of tilting as a function of elongation  $L/R$ (see figure 4 in both) and derive a threshold value $L/R \approx 1.67$. For our case, $L/R = 2$ and the growth rate of $0.64/t_A$ is consistent with the growth rates implied from their figure 4, namely ${\sim }0.1/t_A$ (Bondeson et al. Reference Bondeson, Marklin, An, Chen, Lee and Liu1981) and ${\sim }10/t_A$ (Finn et al. Reference Finn, Manheimer and Ott1981). An experimental identification of the tilting mode of a spheromak plasma and its control is discussed in Munson et al. (Reference Munson, Janos, Wysocki and Yamada1985). A clear exponential growth rate of tilting is visible in their figure 1 and is strikingly similar to our figure 4(a).
A characteristic time scale of the tilting instability is  ${\simeq }20{t_A}$, during which the spheromak dissipates after losing a significant fraction of its energy, which is in good agreement with Sato & Hayashi (Reference Sato and Hayashi1983) where they study spheromak dynamics for a force-free plasma by a 3-D MHD code and estimate a growth rate of the order of $10t_A$. Interestingly, their results also show that the tilting angle saturates at $90^{\circ }$ unlike our results where the spheromak almost entirely undergoes a $180^{\circ }$ rotation – it flips. The $90^{\circ }$ tilt stabilization of Sato & Hayashi (Reference Sato and Hayashi1983) is facilitated by a cylindrical vacuum vessel – a toroidal flux core having a small enough aspect ratio so that further tilting is energetically unfavourable (Bellan Reference Bellan2018). A similar characteristic growth time of tilt around the magnetic axis and use of a flux conserver to stabilize the tilt mode is suggested in Jarboe (Reference Jarboe1994), which also provides an excellent review on formation and stability of spheromaks.
We have also studied the evolution of a second-order magnetically confined spheromak as an example of a configuration (the inner core) confined by the twisted magnetic field (the outer shell). Very quickly ( ${\sim }10t_A$) the inner core separates from the outer shell and completely detaches. As a result two nearly independent dissipative structures are formed. No stabilization occurs.
Our results disfavour models of magnetically confined structures for the origin of tail oscillations in magnetar flares (Lyutikov Reference Lyutikov2003; Mastrano & Melatos Reference Mastrano and Melatos2008), as we discuss next. Magnetars are young ( ${\sim }10^3\text {--}10^4$ years) and highly magnetized (surface magnetic fields ${\sim }10^{14}\text {--}10^{15}$ G) neutron stars exhibiting X-ray and $\gamma$-ray activity. The most dramatic giant flare to date was exhibited by SGR 1806-20 on December 27, 2004 (Mereghetti et al. Reference Mereghetti, Götz, von Kienlin, Rau, Lichti, Weidenspointner and Jean2005; Palmer Reference Palmer2005) in which the main spike that lasted ${\sim }0.5$ seconds was followed by a ${\sim }380$ s pulsating tail. This is ${\sim }50$ cycles of high-amplitude pulsations at the SGR's known rotation period of 7.56 s. The long pulsating tails of giant flares originate in a ‘trapped fireball’ that remains confined to the star's closed magnetic field lines.
In magnetar magnetospheres, the Alfvén speed through a plasma of density  $\rho$ is nearly relativistic (Gedalin Reference Gedalin1993)
 \begin{equation} \frac{v_A}{c} = \left(\frac{B^2/4{\rm \pi}}{\epsilon+P+B^2/4{\rm \pi}}\right) ^{1/2} \approx 1, \end{equation}
where  $c$ is the speed of light, $\epsilon =\rho c^2$ is the total energy density of plasma particles and $P$ is the total plasma pressure. For a magnetically dominated plasma, $P, \epsilon << B^2/4{\rm \pi}$. Thus, the Alfvén time within the magnetar's magnetosphere
 \begin{equation} t_{A}=\frac{R_{\textrm{NS}}}{v_{A}} \approx 3 \times 10^{-5}\ \text{s}, \end{equation}
where  $R_{\textrm {NS}}=10$ km is the radius of a neutron star. Our results demonstrate that stabilization even of higher-order spheromaks does not occur, so that the time scale over which a spheromak confined in the magnetar's magnetosphere would dissipate is too short to explain the tail duration
 \begin{equation} t_{\textrm{diss}} \sim 20t_{A} \approx \times 10^{-3}\ \text{s}. \end{equation}
Finally, let us comment on the applicability of the Taylor relaxation principle to astrophysical plasmas. It was suggested in Bellan (Reference Bellan2000) that a spheromak is a Taylor state, so that the evolution of the system will lead to the largest possible spheromak. The Taylor relaxation principle assumes that the plasma is surrounded by a wall impenetrable to helicity escape. This can be achieved in a laboratory, with arrangements of conducting walls. This is not possible in astrophysical surroundings, as we argue next.
First, according to Shafranov's virial theorem (e.g. Bellan Reference Bellan2006) it is not possible to have an isolated self-contained MHD equilibrium – there must always be some external confining structure. It is possible to have purely unmagnetized external confining structures – one can construct spheromak-type configurations confined by external pressure (Gourgouliatos, Braithwaite & Lyutikov Reference Gourgouliatos, Braithwaite and Lyutikov2010). The configurations considered by Gourgouliatos et al. (Reference Gourgouliatos, Braithwaite and Lyutikov2010) are not force free, but they look very similar to spheromaks. They are stable to current-driven instabilities. It seems the case considered by Gourgouliatos et al. (Reference Gourgouliatos, Braithwaite and Lyutikov2010) is the only case where the Taylor relaxation principle would be applicable to astrophysical plasmas – if there is non-zero  $B$-field in the confining medium the spheromak will try to flip and will reconnect. This will generally happen very fast, on a few Alfvén time scales. The helicity will then be emitted as Alfvén shear waves; this then violates the Taylor principle of conserved helicity.
Thus, astrophysical magnetic configurations belong more naturally to a class called ‘driven magnetic configurations’ by Bellan (Reference Bellan2018) – they are generally magnetically connected to some outside medium. As a result of this connection helicity will leave the system in the form of torsional Alfvén waves. This will violate the assumptions of the Taylor relaxation scheme.
We explore a possible astrophysical application of our numerical results. Using the energetics of SGR 1806-20, the estimated dissipation time scale of a magnetically confined spheromak is of the order of a millisecond, whereas the quasi-periodic oscillations in the SGR's giant flare release energy for  ${\sim }400$ s. The formation and spontaneous dissipation of a spheromak in a magnetar's magnetosphere do not allow for such prolonged energy release. It would be worthwhile to explore coalescence instability in turbulent plasmas. It has been suggested in Reiman (Reference Reiman1982) that, by Taylor's theory, repeated coalescence of $n$ spheromaks of equal size increases the radius of the spheromak by a factor of $n^{1/4}$ whereas the total magnetic energy of the final spheromak will be $n^{-1/4}$ times the sum of the energies of the initial spheromaks. We speculate that such a mechanism might stabilize the spheromak over longer time scales. Another important investigation would be to look for effects of plasma rotation on the tilt mode stability in the context of a spheromak using arguments similar to those made in Mohri (Reference Mohri1980), Ishida, Momota & Steinhauer (Reference Ishida, Momota and Steinhauer1988) and Ji et al. (Reference Ji, Yamada, Kulsrud, Pomphrey and Himuraa1998) in which it is shown that plasma rotation in the $\theta$ direction can help stabilize the tilt mode, but in FRCs. Finally, it would be useful to explore if both coalescence and rotation together could have stabilizing effects to sustain a spheromak over longer time scales.
Acknowledgements
We thank the anonymous referee for their constructive comments which greatly improved the manuscript. The numerical simulations were carried out in the CFCA cluster of National Astronomical Observatory of Japan. We thank the PLUTO team for the possibility to use the PLUTO code and for technical support. The visualization of the results was performed in the VisIt package. We would like to thank P. Bellan, E. Blackman and O. Porth for discussions and comments on the manuscript. This work had been supported by NASA grant 80NSSC17K0757 and NSF grants 1903332 and 1908590. L.S. acknowledges support from the Sloan Fellowship, the Cottrell Scholars Award, and NSF PHY-1903412.
Editor Dmitri Uzdensky thanks the referees for their advice in evaluating this article.
Declaration of interests
The authors report no conflict of interest.


