


Iodine is one of the crucial trace elements for humans. It is generally understood that two-thirds of the iodine is in the thyroid gland, but organs other than the thyroid, such as the heart, kidneys and liver, are found to have iodine(Reference Tran, Erskine and Kiefe1). Although iodine is essential for human growth, development and function, inappropriate levels of iodine have harmful effects on the human body. Overwhelming evidence shows that both iodine deficiency and iodine excess can result in thyroid disorders such as hyperthyroidism, hypothyroidism, goitre, thyroid cancer and even an increased risk of miscarriage and infant death(Reference Teng, Shan and Teng2–Reference Kang, Hwang and Chung5).
Research has proven that iodine plays an important role in thyroid hormone synthesis, which influences cardiovascular function and metabolism (e.g. cardiac contractility, vascular tone, blood pressure (BP) and lipid metabolism)(Reference McAninch and Bianco6,Reference Kahaly and Dillmann7) , making iodine a critical factor in maintaining cardiovascular health. However, most studies on iodine have focused on the thyroid gland, and its effect on CVD has not yet been fully investigated. Coronary artery disease (CAD) is a CVD that is recognised as the major cause of mortality worldwide(Reference Naghavi, Wang and Lozano8), manifesting itself as stable or unstable angina, myocardial infarction or sudden cardiac death(Reference Álvarez-Álvarez, Zanetti and Carreras-Torres9). Current evidence suggests that iodine is associated with several important risk factors for CAD, such as BP, blood glucose and lipid metabolism(Reference Cornier, Dabelea and Hernandez10–Reference Lee, Shin and Song14). However, the independent relationship between iodine and CAD has rarely been studied. Based on the above facts, we hypothesise that there is a strong correlation between iodine and CAD, which, if proven in the future by a large sample size of prospective trials, would have significant implications for public health. Moreover, to gain insight into the mechanisms underlying the association between iodine and CAD and to help identify high-risk groups that may benefit from targeted interventions, we propose to conduct a subgroup analysis of common high-risk factors for CAD (e.g. hypertension, diabetes, age, sex, BMI, smoking, etc.) to examine the effect of iodine status on CAD risk.
Urinary iodine concentration (UIC) analysis is the most recommended and commonly used biochemical method for evaluating iodine status in populations due to its ability to directly reflect body iodine status(Reference Wainwright and Cook15,Reference Zhang, Cheng and Yu16) . In this study, we extracted data from the representative National Health and Nutrition Examination Survey (NHANES) from 2003 to 2018 to investigate the correlation between UIC and CAD among adults in the USA and to explore the potential modifiers of the relationship between UIC and CAD.
Methods
Data source and population
NHANES is a nationally representative survey of the United States general population using a complex, multi-stage, probability sample design that gathers demographic, socio-economic, dietary and health-related data about the American public in a two-year cycle (www.cdc.gov/nchs/nhanes/index.htm). In this study, we planned to investigate the relationship between UIC and CAD among American adults by extracting data from eight cycles of NHANES (2003–2018). The National Center for Health Statistics ethics review board supported the NHANES research plan. All participants provided written informed consent. There were 80 312 participants in the NHANES from 2003 to 2018. After the exclusion of participants less than 18 years old (n 32 549), participants with missing CAD history data (n 2975), urinary iodine data (n 27 361) and participants with cancer (n 1634), the data from 15 793 participants were included in our analysis (online Supplementary Fig. 1).
Coronary artery disease
Akin to the previously conducted NHANES research, in the NHANES questionnaire, participants were asked if they had ever been told by a doctor or other health professional that they had angina, CAD or myocardial infarction. If participants said ‘yes’ to the above questions, they were identified as having CHD(Reference Hui, Koch and Calara17,Reference Skipina, Patel and Upadhya18) . Questionnaires are administered to NHANES participants both at home and in mobile examination centres. Selected persons are invited to take part in the survey by being interviewed. Interviews are conducted by highly trained health professionals, and each question is standardised.
Urinary iodine and other measurements
There was no fasting or special diet prior to urine collection. Professionally trained researchers used sterile collectors with multiple urine screens to obtain adequate urine samples (optimal 1·8 ml, minimum 1·0 ml). The total urine iodine concentration was measured by inductively coupled plasma kinetic reaction cell mass spectrometry at the Laboratory Sciences of the National Center for Environmental Health, Radiation Analytical Toxicology Division. The UIC was divided into two groups according to the inflection point. Furthermore, we also collected the following potential covariates: demographic records including age, sex, race, marital status, education levels and poverty income ratio; body measurements including weight, height, BMI (the calculation method is weight divided by height squared) and waist circumference; disease and personal history, including smokers, drinkers, hypertension, thyroid dysfunction and diabetes. Standard biochemical tests include HbA1c, fasting plasma glucose (FPG), total cholesterol, TAG, HDL-cholesterol, serum creatinine, uric acid and the estimated glomerular filtration rate (eGFR, we calculated by the modification of diet in renal disease equation). Three BP readings were obtained after 5 min of participants resting quietly with their feet on the floor and back propped up. Based on these recorded readings, the average systolic and diastolic BP was calculated, that is, the participants’ BP. Thyroid dysfunction was defined as self-reported thyroid dysfunction, and hypertension was defined as self-reported hypertension or systolic BP ≥ 140 mmHg and/or diastolic BP ≥ 90 mmHg(Reference Huang, Liu and Lo19). Diabetes was described as a self-reported diagnosis by a physician or FPG ≥ 7·0 mmol/l or HbA1c ≥ 6·5 %(20).
Statistical analysis
UIC was a skewed distribution in our study. Therefore, we conducted Log10 transition (Lg UIC) in the data analysis. The mean values and standard deviations or median (Q1, Q3) are used to describe continuous data, and numbers (%) to describe categorical data, respectively. In comparing differences in data characteristics with and without CAD, Student’s t test was used for normally distributed data, the nonparametric Mann-Whitney test for abnormally distributed data and the χ 2 test for categorical data. Confounders were included in the final models if they were correlated with the CAD or an effect change estimate of more than 10 %(Reference Jaddoe, de Jonge and Hofman21). Online Supplementary Tables S1–S4 show the associations of each confounder with CAD. Multivariable logistic regression analysis evaluated the correlation between UIC (continuous and categorical variables) and CAD. We conducted three regression analysis models: model 1 was unadjusted. Model 2 was adjusted for sex, age and race. In model 3, in addition to the adjustment in model 2, education levels, marital status, poverty income ratio, BMI, waist circumference, hypertension, diabetes, thyroid dysfunction, smokers, drinkers, FPG, total cholesterol, TAG, uric acid, serum creatinine, eGFR, HbA1c and HDL-cholesterol were considered. In addition, given that NHANES uses a complex, multi-stage sampling design, and therefore each individual’s contribution to the population is biased. To eliminate this bias, we also weighted sample data using weights to provide a final unbiased and accurate estimate of effects for the population.
As far as we know, many factors in biomedical research do not have a simple linear relationship with the outcome variable; most independent variables have no effect or a positive effect on the outcome variable within a certain range, beyond which the magnitude or/and direction of the effect changes. To clearly reflect the dose–response relationship and threshold effects between UIC and CAD, we first use a generalised additive model and smooth curve fitting to examine whether the UIC is partitioned into intervals. We apply segmented regression (also known as piece-wise regression) that is using a separate line segment to fit each interval. Log-likelihood ratio test comparing a one-line (non-segmented) model to segmented regression model was used to determine whether threshold exists. The inflection point that connecting the segments was based on the model gives maximum likelihood, and it was determined using two steps recursive method.
Analysis of interactions and stratification was performed based on age (< 60 or ≥ 60, years), sex (male or female), race (Mexican American, other Hispanic, non-Hispanic White, non-Hispanic black, or other race), BMI (< 25, ≥ 25 and < 30, ≥ 30, kg/m2), eGFR (< 60 or ≥ 60, ml/min/1·73 m2), hypertension (yes or no), diabetes (yes or no), thyroid dysfunction (yes or no), smokers (yes or no), drinkers (yes, no, or unknown) and LDL-cholesterol (known or unknown). Statistical analyses were performed on the R Pack (http://www.R-project.org) and EmpowerStats (http://www.Empowerstats.Com, X&Y Solutions, Inc.). A two-sided P < 0·05 was considered statistically significant.
For the numerous missing data, dummy variables were used to indicate missing covariate values, and sensitivity analyses were conducted to evaluate differences in demographic and clinical characteristics, the UIC and the incidence of CAD. Specifically, 55·39 % (n 8748) of the data were missing for LDL-cholesterol. For the minor missing data, we used multiple imputations, based on five replications and a chained equation approach method in the R MI procedure, to account for missing data. Specifically, 8·66 % (n 1368) of the data were missing for the poverty income ratio, 0·98 % (n 154) were missing for weight, 0·97 % (n 151) were missing for height, 1·11 % (n 175) were missing for BMI, 4·32 % (n 683) were missing for waist circumference, 5·04 % (n 796) were missing for FPG, 3·82 % (n 603) were missing for HbA1C, 4·77 % (n 754) were missing for total cholesterol, 5·10 % (n 805) were missing for TAG, 13·97 % (n 2206) were missing for HDL, 5·08 % (n 801) were missing for uric acid and 5·05 % (n 797) were missing for Scr and eGFR.
Results
Baseline participant characteristics
As shown in Table 1, the data from 15 793 participants were statistically analysed; 48·04 % were male, and 975 (6·17 %) had CAD. Among participants with CAD, the mean values and standard deviation for age and Lg UIC were 65·42 (sd 12·59) and 2·27 (sd 0·50), respectively. The CAD and non-CAD groups were statistically differentiated in baseline characteristics, except for the height and proportion of LDL-cholesterol missed. CAD individuals were likely to be older, male, White, have hypertension, diabetes, thyroid dysfunction, be smokers and drinkers; have lower values for education level, poverty income ratio, HDL-cholesterol and eGFR; and have higher levels of weight, BMI, waist circumference, FPG, HbA1c, uric acid, serum creatinine and UIC than those without CAD. Participants’ weighted baseline characteristics were largely similar compared with previous results, except in terms of race and educational attainment. In the weighted results, the proportion of non-Hispanic Whites is greater, and the educational attainment is higher, which is consistent with the national context of the USA (online Supplementary Table S5).
Baseline characteristics of study participants
(Mean values and standard deviations; numbers and percentages)

FPG, fasting plasma glucose; TC, total cholesterol; UA, uric acid; SCR, serum creatinine; eGFR, estimated glomerular filtration rate; UIC, urinary iodine concentration.
* Data are presented as mean ± standard deviation or median (Q1–Q3) and numbers (%) as appropriate.
† UIC value was log10-transformed.
The relationships between urinary iodine concentration and coronary artery disease
The logistic regression analysis results are given in Table 2. In general, UIC was significantly positively associated with CAD in all participants, regardless of whether adjusted for confounding factors. Within the unadjusted model, a positive trend was observed for UIC and CAD (per natural log [UIC] increment: OR, 2·02; 95 % CI 1·74, 2·35). After adjustment for the existence of confounding elements, the trend remained in model 2 (OR, 1·35; 95 % CI 1·15, 1·58) and model 3 (OR, 1·22; 95 % CI 1·00, 1·49). Consistently, the fitted smoothing curve (Fig. 1) showed a nonlinear positive correlation and an apparent threshold effect for UIC and CAD, with the inflection point calculated by the recursive algorithm as 2·65 μg/l (Table 3). In Lg UIC < 2·65 μg/l, UIC had little to no relation to CAD (OR 0·89; 95 % CI 0·68, 1·16). In contrast, for participants with Lg UIC ≥ 2·65 μg/l, the per natural Lg [UI] increment was as follows: OR 2·29; 95 % CI 1·53, 3·43. When converting Lg UIC to a binary variable, the adjusted OR for participants with higher levels of UIC compared with lower levels of UIC (LG UI < 2·65 μg/l) was 1·24 (95 % CI 0·97, 1·59) (Table 2). Table 2 also shows the difference in the relationships for UIC and CAD between participants with and without diabetes. For each unit increase in Lg UIC in diabetic patients, the incidence of CAD increased 1·84-fold (OR 1·84, 95 % CI 1·32, 2·58). However, in non-diabetic patients, UIC did not correlate with CAD (OR 0·98; 95 % CI 0·77, 1·25). There was an interaction between diabetes and UIC (P for interaction = 0·014) (Fig. 2). The results of the weighted multiple regression also showed that UIC remained significantly and positively associated with CAD in the diabetic population (OR 1·93, 95 % CI 1·15, 3·24), but not in the non-diabetic population (OR 0·84, 95 % CI 0·59, 1·22). Although this relationship may also exist in the total population, there was insufficient statistical evidence to support it (OR 1·11, 95 % CI 0·79, 1·55) (online Supplementary Table S6). The above findings were also consistent with the results of the stratified curve fit (Fig. 3).
Relative odds of CAD according to UIC in different models among American adults
(Odds rations and 95 % confidence intervals)
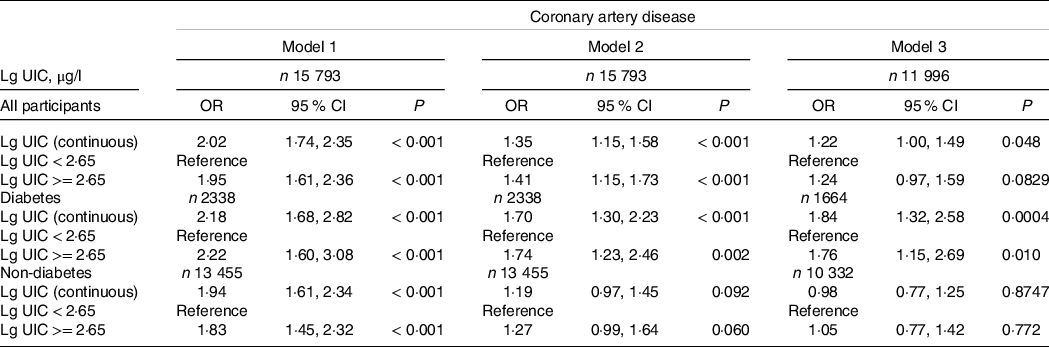
UIC, urinary iodine concentration; Lg UIC, value was log10-transformed. Model 1 adjusts for none; model 2 adjusts for sex, age and race; model 3 adjusts for sex, age, race, education levels, marital status, poverty income ratio, BMI, waist circumference, hypertension, smokers, drinkers, thyroid dysfunction, fasting plasma glucose, total cholesterol, TAG, uric acid, serum creatinine, estimated glomerular filtration rate, HbA1c and HDL-cholesterol.
Threshold effect analysis of UIC on CAD in US adults
(95 % confidence intervals)
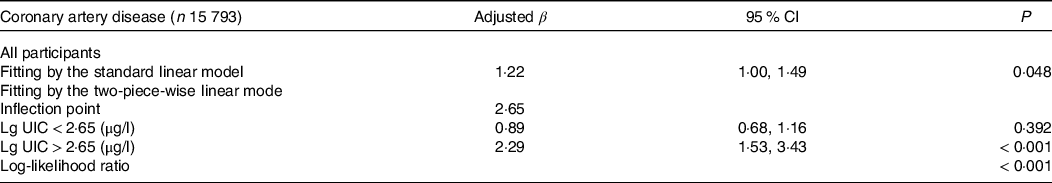
UIC, urinary iodine concentration; CAD, coronary artery disease; Lg UIC, value was log10-transformed; adjusted for sex, age, race, education levels, marital status, poverty income ratio, BMI, waist circumference, hypertension, smokers, drinkers, thyroid dysfunction, fasting plasma glucose, total cholesterol, TAG, uric acid, serum creatinine, estimated glomerular filtration rate, HbA1c and HDL-cholesterol.
Association between urinary iodine concentration and the prevalence of coronary artery disease. The solid red and blue dotted lines represent the estimated values and their corresponding 95 % CI. Adjustment factors included sex, age, race, education levels, marital status, poverty income ratio, BMI, waist circumference, hypertension, thyroid dysfunction, diabetes, smokers, drinkers, fasting plasma glucose, total cholesterol, TAG, uric acid, serum creatinine, estimated glomerular filtration rate, HbA1c and HDL-cholesterol.

Stratifying analyses by potential modifiers of the association between urinary iodine concentration and coronary artery disease. Each subgroup analysis adjusted for sex, age, race, education levels, marital status, poverty income ratio, BMI, waist circumference, hypertension, thyroid dysfunction, diabetes, smokers, drinkers, fasting plasma glucose, total cholesterol, TAG, uric acid, serum creatinine, estimated glomerular filtration rate, HbA1c and HDL-cholesterol except for the stratifying variable.

The association between urinary iodine concentration and the prevalence of coronary artery disease is stratified by diabetes. Adjustment factors included sex, age, race, education levels, marital status, poverty income ratio, BMI, waist circumference, hypertension, thyroid dysfunction, smokers, drinkers, fasting plasma glucose, total cholesterol, TAG, uric acid, serum creatinine, estimated glomerular filtration rate, HbA1c and HDL-cholesterol.

Sensitivity analysis
In the interaction and stratification analyses, apart from diabetes, no other confounding elements had a meaningful effect on the association between UIC and CAD, including age, sex, race, BMI, hypertension, thyroid dysfunction, smoking status and drinking status (P for all interactions > 0·05) (Fig. 2).
The LDL-cholesterol data for this study were largely missing, and we divided them into two groups by whether they were missing or not to see the distribution of the other variables. We found that the distribution of important demographic characteristics such as age, sex, race, educational attainment and poverty income ratio was generally similar, which could be considered randomly missing (online Supplementary Table S7). For small amounts of missing variables, we used multiple imputations. All variables with missing data have the same distribution in the imputed dataset and the observed complete case data (online Supplementary Table S8). The results from the regression analysis and threshold effects analysis that used only participants with complete data were similar to those conducted on the multiple imputed datasets given here (online Supplementary Table S9–S11).
Discussion
Findings from this study indicated a significant positive trend between UIC and CAD, an effect that was evident after careful adjustment and in most of the subgroups considered. Further, the generalised additive model and fitted smoothing curves visualised a nonlinear relationship between UIC and CAD. There is a clear threshold effect between them with an inflection point at 2·65 μg/l. In addition, we found that diabetes might modify the association between UIC and CAD in the stratification and interaction analyses. The results showed a significant positive correlation between UIC and CAD in diabetic patients, but not in non-diabetic patients. The above findings were also consistent in the sensitivity analysis but are somewhat different in the weighted regression analysis. The weighted regression analysis showed that although a positive association between UIC and CAD still existed in diabetic patients, the relationship was not significant in the total population and there was insufficient statistical evidence to support whether the association was real, and therefore a larger sample size or more reliable data would be needed to test the relationship in the future.
Iodine is a necessary trace element in the body. Disturbance in iodine status is a major pathogenic factor in thyroid disorders and has been associated with various diseases, such as high BP, disorders of lipid metabolism and insulin resistance(Reference Teng, Shan and Teng2,Reference Kang, Hwang and Chung5,Reference Zhao, Ye and Sun11–Reference Lee, Shin and Song14) . Iodine deficiency has been a major public health issue worldwide for several decades. Over two billion individuals worldwide remain at risk of iodine deficiency(Reference Andersson, de Benoist and Rogers22). Therefore, in almost all countries, iodine deficiency has been controlled by adding iodine to salt. Although progress has been made in combating iodine deficiency, with the increasing popularity of iodised salt programmes, a number of people are beginning to have excessive iodine intake(Reference Guo, Zynat and Xu23). The UIC directly reflects dietary iodine intake, as over 90 % of dietary iodine is excreted in the urine. Therefore, UIC is recommended for assessing the iodine status of the body(Reference Wainwright and Cook15,Reference Hollowell, Staehling and Hannon24) . An increased UIC was linked to a higher incidence of CAD in our representative US population. Given this correlation, UIC might be a biomarker for a potential predictor of CAD. Furthermore, UIC could be a screening tool for CAD and provide guidance for treatment to avoid overcorrection in iodine-deficient patients.
To date, there have been limited and controversial studies on the association between UIC and the incidence of CAD. In a previous study, Hasanen et al. found the highest association with CVD to be iodine status (r = −0·83), in which the maximum iodine concentration has been linked to the minimum incidence of CVD(Reference Häsänen25). Conversely, the incidence of all-cause mortality was higher in patients with excess iodine exposure than in those with moderate iodine exposure in a prospective design (hazard ratio 1·19; 95 % CI 1·04, 1·37)(Reference Inoue, Leung and Sugiyama26). In addition, studies have shown a neutral correlation between iodine status and CAD(Reference Cabral, Kuxhaus and Eichelmann27). Differences in study design, sample size, ethnic distribution and control of confounding factors may explain the controversial results among these studies.
In this study, we enrolled a representative US population, and the sample size was large while controlling for common cardiovascular risk factors that included thyroid function. We found several critical new insights. First, we identified a J-shaped correlation between UIC and CAD. We deduce that this could be explained by the fact that iodine is beneficial to humans at appropriate levels. Nevertheless, this benefit disappears or even becomes harmful when iodine is excessive. In numerous animal and human studies, iodine has been linked to several pathogenic mechanisms of CAD: (i) Iodine is known to be an essential micronutrient in the synthesis of thyroid hormone, and thyroid hormone is a necessary regulator of cardiovascular activity that acts on cardiomyocytes, endothelial cells and vascular smooth muscle(Reference Biondi and Klein28). However, both iodine deficiency and iodine excess could result in thyroid dysfunction(Reference Teng, Shan and Teng2,Reference Zimmermann3,Reference Kang, Hwang and Chung5) , and thyroid dysfunction could induce cardiac and endothelial dysfunction, thereby increasing the risk of CVD(Reference Gencer, Collet and Virgini29). (ii) Iodine has both antioxidant and oxidative effects, depending on its concentration, chemical type and oxidative state in the body(Reference Jin, Zhang and Li30). (iii) Animal studies from as early as the 1930s demonstrated that iodine compounds could prevent the formation of atherosclerosis(Reference Turner31). However, studies have shown that excess iodine can affect BP, blood sugar and lipid metabolism (Reference Cornier, Dabelea and Hernandez10–Reference Lee, Shin and Song14), which are critical factors in atherosclerosis.
Second, we noted that in the multivariable logistic regression, generalised additive model and fitted smoothing curves, an interaction might exist between the UIC and diabetes. Diabetic patients had a significant positive correlation between UIC and CAD, while non-diabetic patients did not correlate. Two possible biological mechanisms might underpin this phenomenon. The first interpretation was the direct influence of iodine on insulin resistance and glucose metabolism. Although very little biological research supports this theory, studies have indicated that excess iodine can affect glucose metabolism and increase the risk of diabetes(Reference Liu, Liu and Jia32,Reference Mancini, Rajaobelina and Dow33) . A similar view was expressed in another study, which showed that excess iodine would reduce the survival of islet β-cells and insulin secretion in mice(Reference Sun, Wang and Chen34). A further interpretation is that such interaction is facilitated by undiagnosed thyroid dysfunction. According to a previous survey, the estimated mean incidence of undiagnosed hypothyroidism or hyperthyroidism in Europe was 4·94 % and 1·72 %, respectively, while approximately 50 % of hypo- or hyperthyroidism remains undiagnosed(Reference Garmendia, Santos and Guillén-Grima35). Excessive iodine is known to cause thyroid dysfunction, particularly hyperthyroidism, associated with insulin resistance and altered glucose metabolism(Reference Maratou, Hadjidakis and Peppa36). The above interpretations are inferences based on the results of the current study and need to be supported by large, well-designed prospective studies in the future.
The above findings have important clinical implications for guiding iodine intake and nutritional management of diabetic patients. Firstly, given that there is a J-shaped positive correlation between UIC and the prevalence of CAD with an inflection point at 2·65 μg/l (i.e. 447 μg/l without Lg-transform), which means that the prevalence of CAD increases with increasing UIC when the value is greater than 2·65 μg/l. Therefore, iodine intake should be reduced to decrease the risk of CAD when the UIC exceeds this threshold, particularly in people at high risk for CAD. Secondly, diabetics are at high risk for CAD, and our findings show that excessive UIC significantly increase the incidence of CAD in diabetics. Therefore, when developing a nutritional treatment plan for diabetic patients, appropriate iodine intake needs to be determined on a case-by-case basis to reduce the risk of CAD. In conclusion, nutrition managers and healthcare providers can develop reasonable nutrition programmes based on individual circumstances to avoid health problems caused by iodine deficiency or overdose.
It is important to note that some disease states (e.g. thyroid dysfunction, renal insufficiency, intestinal disorders, etc.)(Reference Rhee, Brent and Kovesdy37,Reference Zimmermann, Jooste and Pandav38) and the use of related medications (e.g. thiourea, amiodarone, etc.)(Reference De Leo, Lee and Braverman39,Reference Padmanabhan40) could affect the absorption, utilisation and metabolism of iodine. In this study, we used thyroid dysfunction and renal functional status for subgroup analysis and interaction analysis and there were consistent findings in all subgroups, so the results of this study apply to the above population. However, we did not collect other data that may affect iodine status, so if extrapolation to specific populations is required caution needs to be exercised in interpretation.
We used data from a representative US population, with a large sample size, and used weighted regression analysis to cope with the complex multi-stage probability sampling of the NHANES data, which allowed our findings to be strongly correlated with the whole US population. Nevertheless, we must also acknowledge important limitations in this research. First, although our best efforts have been made to adjust for confounders, confounding by unknown or unmeasurable factors cannot be completely ruled out. In addition, to minimise the effect of confounding factors on the results, we adjusted for many biological risk factors, including potential mediators (e.g. thyroid function), which may introduce over-adjustment problems. Therefore, it is recommended that in future studies, the relationship between iodine levels and CAD should be investigated by controlling mediating factors reasonably and using simpler models, in order to avoid over-adjustment. Meanwhile, underlying mechanistic research and prospective studies with large samples are also necessary. Second, we, unfortunately, missed a lot of LDL-cholesterol data. However, the fact that almost all-important demographic characteristics were similar in individuals with and without LDL-cholesterol data, and therefore considering LDL-cholesterol to be missing at random, has no impact on our findings. In addition, the relationship between UIC and CAD was consistent in a carefully adjusted subgroup analysis. Third, in this study, only a single-point urine test was performed to estimate iodine status. Repeated sampling may be needed to overcome the daily variability of individuals, but this process would become very complex and expensive. Fourth, self-reporting by participants might be subject to bias. However, questionnaires are an essential part of national health and nutrition surveys, and many studies are published based on questionnaire data. Fifth, the results extrapolated to other countries need to be interpreted with caution because of the differences between countries.
Conclusion
In conclusion, we found a J-shaped association between UIC and CAD in the US adult population, with an inflection point of 2·65. Meanwhile, this effect was found to be potentially modifiable by diabetes. Future large studies using a longitudinal design with continuous measurements of UIC could further test our main research hypothesis that excess iodine is associated with an increased risk of various risk factors for CHD (e.g., dyslipidaemia, abnormal glucose metabolism, oxidative stress, etc.).
Acknowledgements
We would like to give special thanks to the investigators, workers and participants of NHANES 2003–2018 for their contributions to the realisation of this research and to the people who worked quietly behind the scenes. We thank the Jiangxi Provincial Key R&D Program (Grant Numbers: 20212BBG71004) for supporting this research.
This research was funded by grants from Jiangxi Provincial Key R&D Program, Grant/Award Numbers: 20212BBG71004.
Z. J. W. and Y. Q. W. conceived and designed this research; Z. J. W. drafted the manuscript and participated in the literature search, data analysis and interpretation. Z. J. W., M. L., J. D. L. and F. X. collected data and contributed to statistical analysis. All authors contributed to reviewing/editing the key intellectual content of the manuscript. Y. Q. W. provided critical revision. All authors read and approved the final manuscript.
The authors declare no conflict of interest.
Supplementary material
For supplementary material/s referred to in this article, please visit https://doi.org/10.1017/S0007114523001277


 Open access