Body composition assessment is crucial in a variety of physiological and pathological circumstances. Clinical uses include the identification of sarcopenia(Reference Cruz-Jentoft, Bahat and Bauer1) and excess adiposity, which are responsible for increasing the risk of several chronic diseases(Reference Vazquez, Duval and Jacobs2,Reference Wormser, Kaptoge and Di Angelantonio3) . Moreover, assessing body composition is valuable for evaluating the impact of specific exercise or nutritional interventions.
While the majority of current research has been on estimating overall body composition, there is limited literature regarding the validity of regional body composition estimates(Reference Fosbøl and Zerahn4). Currently, recognised techniques for determining regional body composition include computed tomography, MRI and dual-energy X-ray absorptiometry (DXA)(Reference Ackland, Lohman and Sundgot-Borgen5). However, these technologies can be cost-prohibitive and logistically challenging to access(Reference Ackland, Lohman and Sundgot-Borgen5). Therefore, developing more accessible methods for estimating regional estimates is crucial. Historically, bioelectrical impedance analysis (BIA) devices provided only whole-body estimates, but advancements have led to tetrapolar BIA analysers with eight-point electrodes on hands and feet, enabling regional body composition assessment(Reference Kyle, Bosaeus and De Lorenzo6). The principles of BIA for body composition assessment have been thoroughly described elsewhere(Reference Kyle, Bosaeus and De Lorenzo6,Reference Lukaski7) .
Choosing appropriate prediction equations is crucial for accurately determining body composition with BIA(Reference Kyle, Bosaeus and De Lorenzo8). However, many BIA devices do not disclose the equations used in their software(Reference Mulasi, Kuchnia and Cole9). Also, some devices do not display the raw data (i.e. resistance [R], reactance [Xc], impedance [Z] and phase angle [PhA]), restricting the ability to calculate body composition components with a suitable equation(Reference Mulasi, Kuchnia and Cole9). This lack of transparent information and data availability hinders accurate and comparable body composition results. Although BIA equations have a lengthy history of development and validation, they have primarily focused on estimating total fat-free mass (FFM)(Reference Campa, Coratella and Cerullo10). Because a significant portion of FFM corresponds to water (i.e. ∼73 % hydration fraction), representing an important molecular component influencing multiple biophysical properties (i.e. R, Z and PhA), there is a strong theoretical rationale sustaining how BIA assessments can provide valuable estimations of FFM. Other studies focused on estimating fat mass (FM) either through indirect calculations (i.e. body mass – FFM) or BIA equation models(Reference Campa, Coratella and Cerullo10). Although the prediction of BIA-derived FM does not offer a strong theoretical basis as FFM, given that Z and other raw BIA variables are more closely dependent on variables enhancing electrical conductivity (e.g. FFM), there are less direct relationships underlying the prediction of FM that must be considered. For example, due to the presence of specific fat-related components within the body, including the lipidic composition of cell membranes and organelles, specific interactions can be expected with Xc and capacitance properties, potentially influencing PhA(Reference Ohki11). Notwithstanding the specific and independent associations between FM and BIA parameters, which differ from those of FFM, further research is needed to strengthen the empirical foundation of these associations.
Moreover, although the estimation of FFM allows an indirect estimation of FM at the whole-body level (e.g. subtraction of FFM to body mass), the regional analysis benefits from a direct assessment of individual body composition components. This need arises from the current challenge of accurately determining the mass of specific body segments. With the advent of tetrapolar BIA analysers, evidence has been focusing on developing models predicting FFM and other muscle indicators (e.g. lean soft tissue) at the regional level using whole-body and regional BIA parameters(Reference Sardinha, Rosa and Hetherington-Rauth12). However, there has been limited research developing models estimating regional FM(Reference Campa, Coratella and Cerullo10), particularly considering that the only available study was conducted in morbidly obese patients(Reference Jiménez, Omaña and Flores13). Since no regional FM assessment models are currently available for healthy populations, we aimed to develop and validate the first BIA-derived equations to predict regional FM against DXA in healthy adults.
Methods
Participants
In this cross-sectional study, 148 healthy individuals were included (52·0 % of whom were female). Exclusion criteria included skin wounds at the electrode implantation sites, active pregnancy, amputated limbs, implanted medical equipment, orthopaedic prostheses, use of medication with impact on water compartments or the presence of clinical disorders that could affect the water compartments.
The Ethics Committee of the Faculty of Human Kinetics, University of Lisbon (Lisbon, Portugal) approved the study (approval number 12/2020), and it was conducted according to the declaration of Helsinki for human studies from the World Medical Association(14).
Body composition measurements
The literature emphasises the critical importance of standardised protocols – encompassing dietary intake, physical activity and participant preparation – in minimising errors and enhancing the precision and reliability of body composition measurements obtained through methods such as BIA(Reference Kyle, Bosaeus and De Lorenzo8) and DXA(Reference Hangartner, Warner and Braillon15). Accordingly, all participants’ body composition was assessed in standardised environmental and physiological conditions – i.e. assessments conducted between 07.00 and 09.00, room temperature set at 23℃, participants with a 12-hour fast, with an empty bladder and without metal accessories (e.g. rings, earrings, necklaces and watches). Before participation, participants were asked to maintain regular dietary habits, avoid vigorous exercise sessions for 24 h before the assessment day and refrain from smoking for 8 h.
Anthropometric measurements
Body mass and height were measured to the nearest 0·01 kg and closest 0·1 cm, respectively, on an electronic scale with an integrated stadiometer (SECA 796 Hamburg, Germany). BMI was calculated as body mass/height2 (kg/m2).
Bioelectrical impedance analysis
The impedance measurements were performed using a phase-sensitive single-frequency BIA (BIA 101 BIVA PRO, Akern S.R.L., Florence, Italy), which applies an alternating current of 245 microamperes at 50 kHz. Achieving valid and reproducible measurements through BIA necessitates protocol standardisation(Reference Kyle, Bosaeus and De Lorenzo8). Following a 5-minute rest period to stabilise body fluids, the subjects were placed in a supine position with a leg opening of 45° compared with the median line of the body and the upper limbs positioned 30° away from the trunk. The dorsal surface of both hands and feet was cleaned with isotropic alcohol (70 %) and used to place four injecting current electrodes in the plane of the head of the third metacarpal and third metatarsal, respectively. The dorsal surface of both wrists and tibia-tarsal joints was used to place the remaining four electrodes in the middle of an imaginary plane between the two malleoli of each hand and foot, respectively.
Raw BIA parameters obtained by this device included the regional R, Xc, PhA, along with the R index, which was calculated by dividing the square of the full height (cm) by the regional R value and the Xc index, which was calculated dividing the square of the full height (cm) by the regional Xc. Additionally, the contribution of the trunk and extremities to overall conductivity was calculated by comparing the ratios of the R and Xc indices of the trunk (mean R and Xc of the right and left trunk) to the extremities(Reference Bosy-Westphal, Schautz and Later16). The CV in our laboratory for measuring PhA, recognised as direct measure of a phase-sensitive device, was calculated from two independent samples assessed on separate days (n 8 and n 7). Under identical fasting, pretest, resting, positioning and assessment conditions as described, the CV was 2·2 % for the first sample (n 8) and 2·8 % for the second sample (n 7). Moreover, the CV values for measuring regional PhA of the first and second samples were, respectively, 4·6 and 4·0 % for the right arm, 4·5 and 4·4 % for the left arm, 4·3 and 4·4 % for the right leg, 3·0 and 2·3 % for the left leg, 2·0 and 1·7 % for the right trunk and 1·7 and 1·9 % for the left trunk.
Dual-energy X-ray absorptiometry
Using a DXA fan-beam densitometer (Hologic Explorer-W, fan-beam densitometer, software QDR for Windows version 12·4, Waltham, MA, USA), total and regional FM (kg) were estimated employing a standardised protocol. Daily calibrations were performed by the same laboratory technician and involved scanning a step phantom with six fields of acrylic and aluminium of varying thickness and known absorptive properties to serve as an external standard for analysing various tissue components. The CV value for measuring total FM, based on two independent samples assessed on separate days, was 0·18 % (n 8) and 0·47 % (n 7). For regional estimates, the CV values of both samples corresponded, respectively, to 0·56 and 0·81 % for the right arm, 0·91 and 0·64 % for the left arm, 0·74 and 0·58 % for the right leg, 0·66 and 0·39 % for the left leg and 0·70 and 0·89 % for the trunk. In both days, the variability measures were taken with the participants under the exact same standardised conditions previously described.
Statistical analysis
IBM SPSS Statistics® (IBM, Chicago, Illinois, USA) version 29·0 for Windows® was used for data analysis. Statistical significance was set at P < 0·05 (two-sided). Descriptive characteristics were presented as means, standard deviations and ranges (minimum-maximum). Normality was assessed using the Kolmogorov–Smirnov test (n ≥ 50) for the development sample and the Shapiro–Wilk test (n < 50) for the validation sample. Differences in the characteristics of development and validation groups were assessed using t tests (for normally distributed variables) and Mann–Whitney U test (for skewed variables).
The prediction equations were developed using a cross-validation method. A random selection process in Excel chose 100 participants (approximately two-thirds of the sample) for the development group, while the remaining forty-nine participants (approximately one-third) were used for validation. A sample size of approximately fifty participants provided sufficient power for the development of sex-specific models and achieved a moderate effect size for the R 2, while considering the inclusion of two independent predictors (i.e. ≥ 2 participants per predictor rule)(Reference Austin and Steyerberg17), a type-1 error of 5 % and a power of 80 %.
Equation development
A multiple linear regression approach with stepwise selection procedures was used for developing the DXA-derived FM models of specific body regions using the development group. Predictor variables tested included age, side dominance, ethnicity, height, height squared, sitting height, body mass, body mass squared, BMI, inverse BMI (i.e. 1/BMI) and regional raw BIA-derived measures (i.e. Xc, R, PhA) and indexes (i.e. R index, Xc index, R index, Xc index, IndexR_Trunk/Extremities, IndexXc_Trunk/Extremities and mean R and Xc of the left and right trunk). The variance inflation factor (threshold of variance inflation factor < 5) and tolerance analysis (threshold of tolerance > 0·20) were employed to assess multicollinearity among independent variables, while diagnostic plot analysis was performed to verify linearity, homoscedasticity and the normality of residuals. The predicting model with the lowest root mean square error (RMSE) and the highest adjusted R2 was selected for cross-validation analysis and applied to the validation sample.
Equation cross-validation
The closeness of fit between the BIA-predicted and DXA-measured FM of each segment was assessed by testing the intercept and slope against the null values of 0 and 1. The overall performance of the new developed equations was tested using (i) the paired sample t test, to compare mean values of BIA-predicted and DXA-measured FM; (ii) Lin’s concordance correlation coefficient test, to verify concordance between BIA-predicted and DXA-measured FM; (iii) non-parametric Passing-Bablok regression, to provide an analytical agreement of both predicted and measured FM; (iv) pure error (PE), which is the square root of the mean of squares of differences between the DXA measured and predicted FM, was calculated to test the performance of the predictive equations; (v) the Bland and Altman analysis(Reference Bland and Altman18), to determine the limits of agreement (LOA) (mean difference (2 sd)) between BIA-predicted and DXA-measured FM of all body regions. The statistical significance was set at P-value < 0·05.
Results
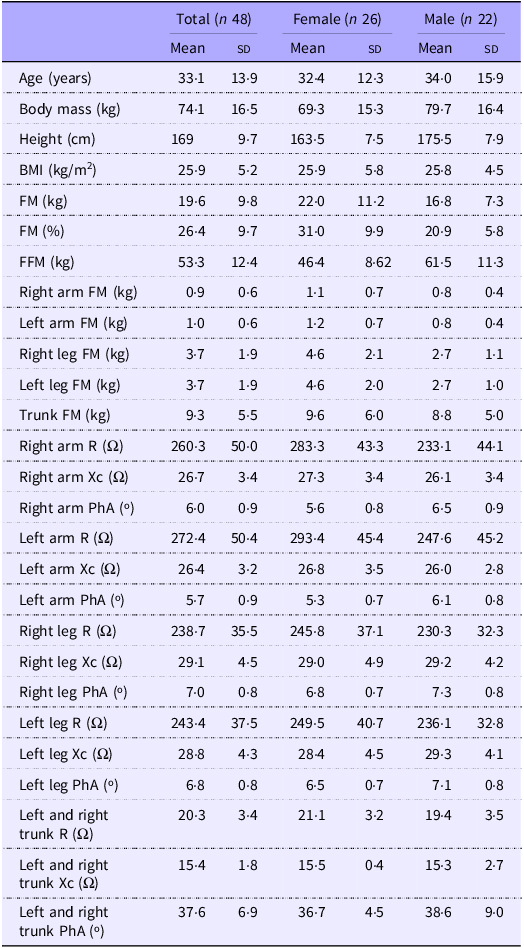
Tables 1 and 2 present the participants’ characteristics and body composition for the development and cross-validation samples. The development sample consisted of fifty-one females and forty-nine males, while the cross-validation sample included twenty-six females and twenty-two males. No differences were observed for all variables between the groups.
Characteristics of the development group (n 100)

FFM, fat-free mass; FM, fat mass; PhA, phase angle; R, resistance; Xc, reactance.
Characteristics of the validation group (n 48)

FM, fat mass; FFM, fat-free mass; PhA, phase angle; R, resistance; Xc, reactance.
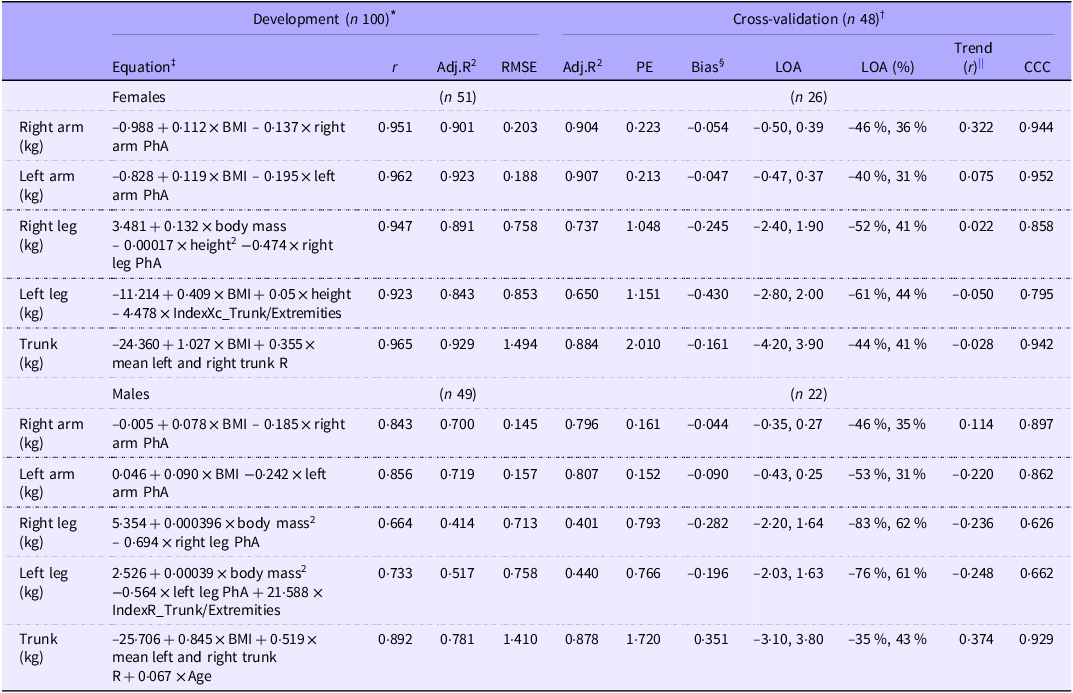
Table 3 shows the developed prediction equations for estimating regional FM. In the regression analysis, for left and right arms and for both sexes, BMI and PhA specific for each segment explained ≃90 % (right arm: Adj.R2 = 0·901, RMSE = 0·203 kg; left arm: Adj.R2 = 0·923, RMSE = 0·188 kg) for females and ≃70 % for males (right arm: Adj.R2 = 0·700, RMSE = 0·145 kg; left arm: Adj.R2 = 0·719, RMSE = 0·157 kg) of the variance in FM determined by DXA, respectively.
Developed prediction equations using the development group (n 100) for estimating DXA-derived FM from BIA and performance analysis of developed prediction equations using the cross-validation group (n 48)

BIA, bioelectrical impedance analysis; DXA, dual-energy X-ray absorptiometry; FM, fat mass; Adj.R2 adjusted coefficient of determination; RMSE, root mean square error; PE, pure error; LOA, limits of agreement at 95 % CI; CCC, Lin’s concordance correlation coefficient; FM, fat mass; PhA, phase angle (º); IndexR_Trunk/Extremities resistance index of the ratio between trunk to extremities, IndexXc_Trunk/Extremities reactance index of the ratio between trunk to extremities.
* Passing and Bablock method did not show models deviating from linearity (P > 0·10).
† Regression lines did not differ from the line of identity (i.e. slope and intercept did not differ from 1 and 0, respectively).
‡ R 2 changed significantly (P < 0·05); no multicollinearity was observed (variance inflation factor < 5 and tolerance > 0·20).
§ Bias, calculated as the mean differences between the DXA region of interest and the new equation.
|| Association between the differences and the mean of the methods.
Regarding females, body mass, height2 and right leg PhA explained 89 % (Adj.R2 = 0·891, RMSE = 0·758 kg) of the variance in DXA-measured right leg FM, while BMI, height and IndexXc_Trunk/Extremities explained 84 % (Adj.R2 = 0·843, RMSE = 0·853 kg) of the variance in DXA-measured left leg FM. The mean R of the right and left trunk and BMI explained 93 % (Adj.R2 = 0·929, RMSE = 1·494 kg) of the variance in trunk FM measured through DXA.
Regarding males, body mass2 and right leg PhA explained 41 % (Adj.R2 = 0·414, RMSE = 0·713 kg) of the variance in DXA-measured right leg FM, while height2, left leg PhA and IndexR_Trunk/Extremities explained 52 % (Adj.R2 = 0·517, RMSE = 0·758 kg) of the variance in DXA-measured left leg FM. The mean R of the right and left trunk, BMI and age explained 78 % (Adj.R2 = 0·781, RMSE = 1·410 kg) of the variance in trunk FM measured through DXA.
Correlations between predictive variables and DXA-derived FM variables, stratified by sex, are presented in online Supplementary Tables 1–11.
Cross-validation of the developed prediction equations for estimating regional fat mass
No significant bias, calculated as the mean differences between the prediction equation and the DXA region of interest, was found for all body regions (Table 3). For all the models, using the Passing & Bablock method, no significant deviation from linearity (P > 0·10) was found. Figure 1 displays the degree of agreement between BIA-predicted FM of the body regions and that measured by DXA with the line of identity.
Relationship between DXA-measured FM and BIA-predicted FM for (a) right arm, (b) left arm, (c) right leg, (d) left leg and (e) trunk. Regression lines of females (empty circles) and males (filled circles) are represented as dashed and solid lines (black), respectively. Lines of identity are represented as solid lines (gray). BIA, bioelectrical impedance analysis; DXA, dual-energy X-ray absorptiometry; FM, fat mass.

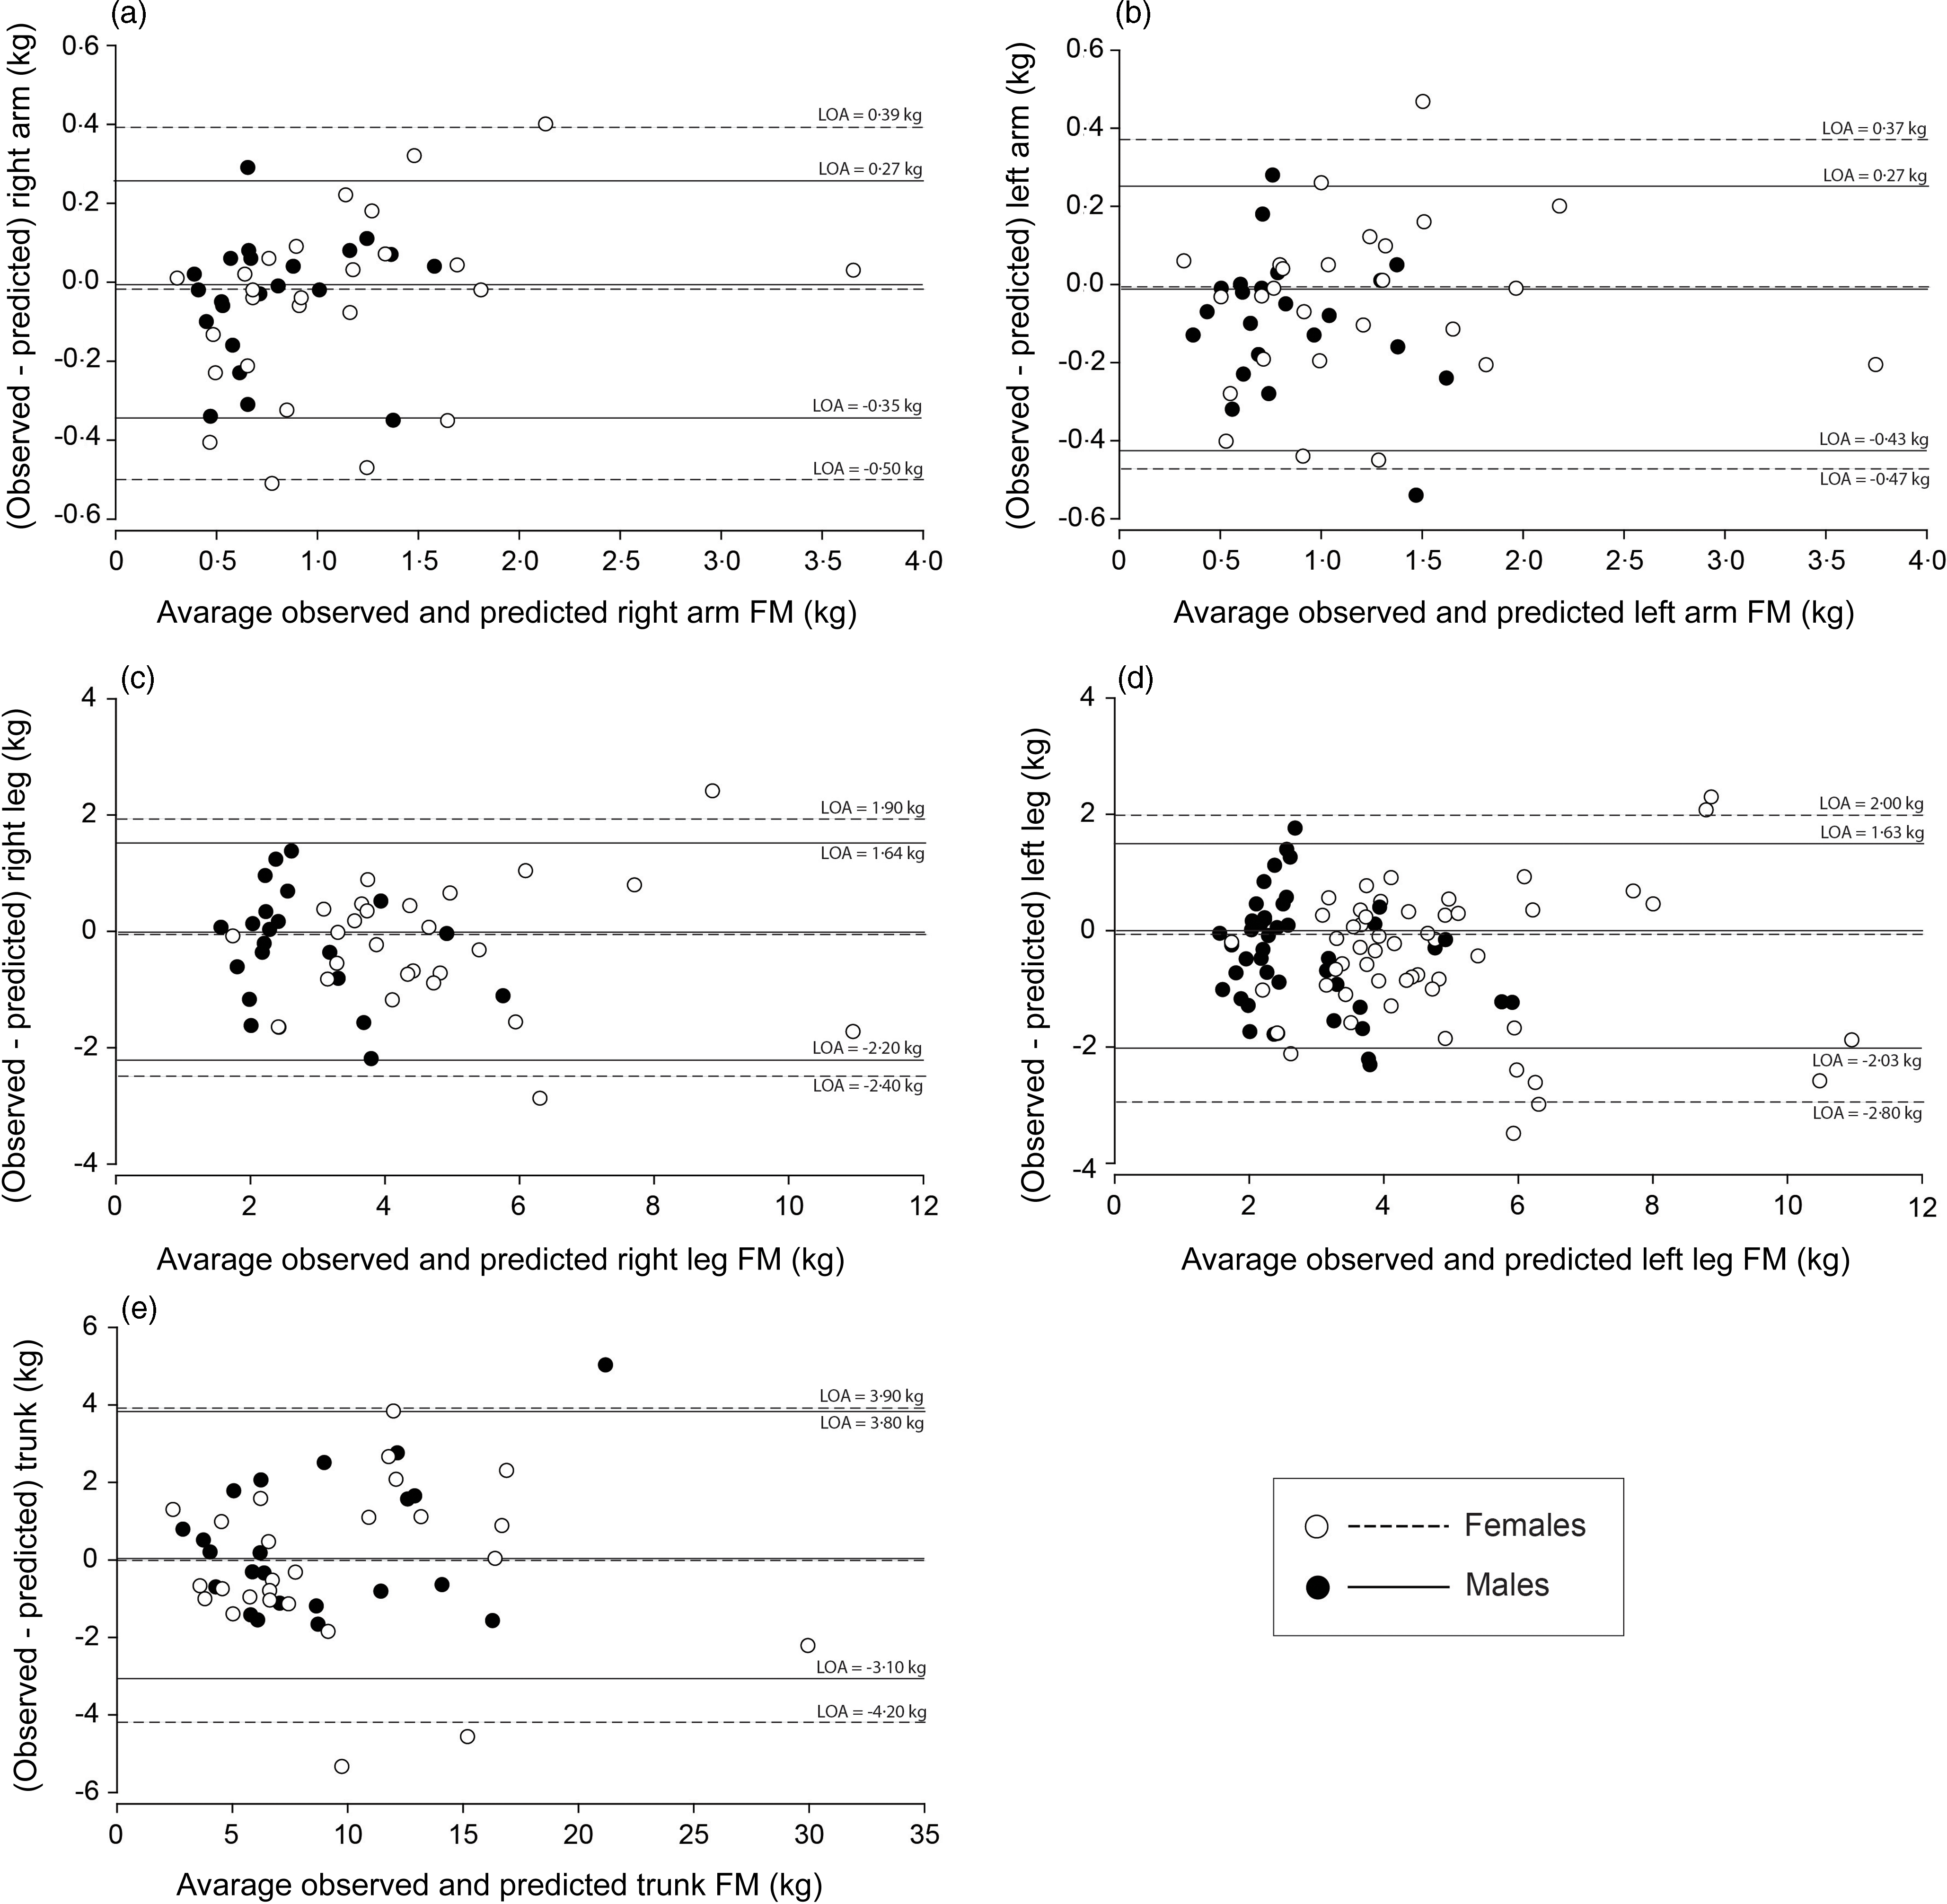
Figure 2 depicts the Bland–Altman analyses. Though no trends between the differences and the means of the BIA predicted and DXA-derived FM were observed, LOA were large, representing individual errors that can reach ∼50 % for females and ∼70 % for males of the actual DXA regional FM (Table 3).
Bland–Altman plot of the difference between DXA-measured FM and BIA-predicted FM with the average DXA-measured FM and BIA-predicted FM for (a) right arm, (b) left arm, (c) right leg, (d) left leg and (e) trunk. 95 % limits of agreement (LOA) of females (empty circles) and males (filled circles) are represented as dashed and solid lines (black), respectively. BIA, bioelectrical impedance analysis; DXA, dual-energy X-ray absorptiometry; FM, fat mass.

Discussion
We propose new BIA-derived equations for predicting regional FM in healthy adults. To our knowledge, no other equations in the literature utilise raw BIA parameters to predict regional FM. Our study addresses this gap by providing several validated equations that provide valid estimations for regional FM, offering a viable alternative to DXA, especially for applications involving large-scale populations.
A recent systematic review by Campa et al. (Reference Campa, Coratella and Cerullo10) identified two equations for total body FM estimation using BIA raw data, one developed for padel players (n 15)(Reference Mauro, Toselli and De Giorgi19) and the other for elderly individuals (n 46)(Reference Svendsen, Haarbo and Heitmann20). In contrast, research on segmental FM estimation is limited, with Jimenez et al. (Reference Jiménez, Omaña and Flores13) being a notable exception, having developed an equation to estimate DXA-derived trunk FM based on anthropometric and impedance parameters. Notably, while some studies use raw BIA formulas to determine total FM directly, FM is more commonly derived indirectly as the difference between body mass and FFM, which is a more commonly estimated component. However, this indirect approach is not feasible for regional estimates, highlighting the need for specific segmental equations. Our study addresses this gap by extending the application of BIA through the development and validation of equations for segmental FM estimation across all body regions in healthy adults.
Total body FM estimation using BIA raw data is well-documented and provides valuable insights, revealing that inbuilt equations often overestimate or underestimate FM(Reference Campa, Coratella and Cerullo10). This study extends the application of BIA by developing and validating equations for segmental FM estimation. Previous investigations have compared several BIA devices to DXA for regional body composition assessment, but they relied on the built-in proprietary equations of the devices(Reference Moore, Benavides and Dellinger21–Reference Wingo, Barry and Ellis24). Wingo et al. (Reference Wingo, Barry and Ellis24) reported significant discrepancies between an RJL Quantum IV device and DXA in segmental FM estimates in thirty healthy adults. Similarly, Raymon et al. (Reference Raymond, Dengel and Bosch23) found that the InBody 770 significantly underestimated arm and leg FM compared with DXA in forty-four male collegiate athletes. Moore et al. (Reference Moore, Benavides and Dellinger21), using an RJL Quantum V in 179 adults, reported that while segmental FM estimates were strongly correlated, BIA generally underestimated segmental FM, except for an overestimation of arm FM in females. Contrary to these findings, all FM estimates in our study did not exhibit significant mean differences in the cross-validation sample. Also, proportional bias was not observed for any FM estimate, unlike Moore et al. (Reference Moore, Benavides and Dellinger21) and Raymond et al. (Reference Raymond, Dengel and Bosch23), who reported proportional bias for arms and legs FM.
Although regional Xc would be expected to emerge as a valid predictor of FM, considering the implication of lipidic structures on capacitive properties, only regional PhA stood out as a significant raw BIA predictor in appendicular FM estimation, with lower PhAs predicting higher adiposity values. This finding may not be surprising as previous studies showed significant negative and positive associations between PhA with FM(Reference Streb, Hansen and Gabiatti25) and FFM(Reference Gonzalez, Barbosa-Silva and Bielemann26), respectively. Since PhA relies on both Xc and R (i.e. PhA = arctan[(Xc/R) × (180/Π)]), its contribution to predicting regional FM may reflect physiological factors directly involved in the associations between other with raw BIA variables and FM. For instance, FM enlargement is related to an altered distribution of body fluids, specifically a higher extracellular to intracellular water (ECW/ICW) ratio, recognised to be inversely related to PhA(Reference Kyle, Bosaeus and De Lorenzo6). In fact, individuals with overweight or obesity may reveal an ECW/ICW ratio > 0·85, i.e. above the average for the normal weight population (∼0·70–0·75)(Reference Fogelholm, Kukkonen-Harjula and Sievänen27,Reference Fogelholm, Sievänen and van Marken Lichtenbelt28) . This condition is partly proven by the fact that the adipose tissue itself has a higher ECW/ICW ratio than skeletal muscle mass(Reference Cancello, Brunani and Brenna29). In fact, while FFM has an average ECW/ICW ratio of about 0·80, adipose tissue can achieve a ratio of up to ∼ 3·7(Reference Wang and Pierson30). Therefore, adiposity is accompanied by a higher extracellular expansion compared to the ICW compartment due to different mechanisms that may include water retention, excess total body water caused by altered hydration regulation, oedema (generally present in the lower limbs), hormonal responses related to adipose tissue, insulin resistance, high triglyceride levels, metabolic syndrome, low HDL cholesterol levels and malnutrition(Reference Mazariegos, Kral and Wang31,Reference Dittmar, Reber and Kahaly32) . Higher PhA values are observed in athletes, while lower values are seen in sarcopenic obese subjects and individuals with impaired quality of life and poor prognosis in various chronic diseases(Reference de Blasio, Santaniello and de Blasio33,Reference Norman, Stobäus and Pirlich34) . Still, it is important to highlight that the RI is the most important predictor of fluid-related volumes, i.e. body water and lean mass, accounting for approximately 80–90 % of the variance in total and regional lean mass estimations(Reference Sardinha, Rosa and Hetherington-Rauth12,Reference De Rui, Veronese and Bolzetta35,Reference Toselli, Campa and Matias36) . Nevertheless, our regional FM models provided similar wide 95 % LOA, aligning with results found for lean mass prediction in athletes(Reference Sardinha, Correia and Magalhães37) and healthy adults(Reference Sardinha, Rosa and Hetherington-Rauth12). While these equations’ accuracy is generally sufficient for population-level studies, using more accurate methods remains essential when individual accuracy is crucial. Nonetheless, despite the wide LOA observed in our study, they are narrower than those reported in the literature for the equations integrated into the BIA devices(Reference Moore, Benavides and Dellinger21,Reference Raymond, Dengel and Bosch23) . Interestingly, Moore et al. also reported a narrower relative LOA in females compared to males when using the RJL Quantum V manufacturer’s software for regional FM estimation against DXA in a sample of 179 adults(Reference Moore, Benavides and Dellinger21).
While DXA offers regional quantification of body composition and exposes subjects to significantly less radiation than computed tomography scans, its routine clinical use is limited by the high cost of the equipment(Reference Ackland, Lohman and Sundgot-Borgen5). In contrast, BIA devices are commonly used within general populations due to their quick procedure, minimal required expertise, portability and cost-effectiveness(Reference Kasper, Langan-Evans and Hudson38). Furthermore, advances in BIA technology, particularly the development of eight-electrode systems with configurations similar to the traditional four-electrode setup, but arranged to target different body segments, have significantly enhanced the accuracy of regional body composition estimation(Reference Bosy-Westphal, Schautz and Later16). This technological approach accounts, for example, for biological variations in body shape, such as differences in body length and trunk-to-extremity proportions, making them a more reliable tool for diverse populations. Therefore, our new equations enable rapid and accurate predictions of regional FM, particularly at the population level, further enhancing the utility of these methods on a large scale.
It is important to highlight the strengths and limitations of this study. This investigation is the first to develop multiple nonproprietary equations for independently estimating regional FM. While these equations offer a cost-effective and time-efficient alternative to DXA for assessing regional FM in adults with distinct body composition profiles (i.e. normal weight, overweight and obese), it is important to acknowledge that the rationale supporting the relationship between FM and the predictive variables, particularly those related to BIA assessment, is less robust than that observed with FFM, requiring further investigation. Despite the underlying mechanisms explaining FM not being fully understood, the developed models were grounded on physiological principles rather than merely capturing spurious correlations or population-specific patterns, which enhances the generalisability of our prediction equations. Another limitation was the use of DXA as the reference method for developing the prediction equations. However, while MRI and computed tomography are recognised as more precise measures of regional body composition, they are cost-prohibitive, logistically challenging to access and require highly trained technicians(Reference Ackland, Lohman and Sundgot-Borgen5). There is also the barrier of high exposure to ionising radiation with computed tomography(Reference Ackland, Lohman and Sundgot-Borgen5).
In conclusion, the developed BIA-derived equations provide a valid estimate of regional FM in healthy adults, demonstrating a cost-effective alternative to DXA. More specifically, the new equations can be regarded as a tool for large-scale application with valuable insights into population health and specific risks related to FM distribution – e.g. identifying regional adiposity patterns at the population level and determining how regional FM impacts mobility and physical function. Nevertheless, caution is advised when using BIA for individual regional FM analysis. Future research should aim to validate these equations in diverse populations and investigate their ability to reliably track changes in regional FM over time, ensuring broader applicability and robustness.
Acknowledgements
The authors express their gratitude to all the participants involved in this study.
This investigation was conducted at the Interdisciplinary Center of the Study of Human Performance (CIPER), Faculdade de Motricidade Humana, Universidade de Lisboa and supported by fellowships from the Portuguese Foundation for Science and Technology (grant to GBR: 2020·07856.BD; grant to IRC: SFRH/BD/149394/2019; grant within the unit I&D 472 -UIDB/00447/2020).
A. M. S. and L. B. S. conceived and planned the experiments. G. B. R., J. P. M., P. B. J. and I. R. C. carried out the experiments and data collection. A. M. S., T. R. S., M. H-R., P. B. J. and A. V. B. did the data analysis. A. M. S. and T. R. S. took the lead in writing the manuscript. All authors provided critical feedback and helped shape the research, analysis and manuscript.
The authors declare that they have no conflict of interest.
Supplementary material
For supplementary material/s referred to in this article, please visit https://doi.org/10.1017/S0007114525000510