


Introduction
Agroforestry, by fostering crop diversity at the plot scale, is recognized for its environmental benefits and contribution to farm economic resilience (Beillouin et al., Reference Beillouin, Ben-Ari, Malézieux, Seufert and Makowski2021). In tropical regions, adoption of agroforestry systems varies according to crop and context. In Indonesia, where oil palm and rubber cover large areas, traditional jungle rubber systems once maintained high plant diversity (Gouyon et al., Reference Gouyon, de Foresta and Levang1993) but were largely replaced by clonal monocultures to increase rubber yields. Oil palm has similarly been cultivated almost exclusively in simplified monocultures. Recent studies, however, highlight the value of plot diversification for both environmental and economic outcomes (Huang et al., Reference Huang, James, Thamthanakoon, Pinitjitsamut, Rattanamanee, Pinitjitsamut, Yamklin and Lowenberg-DeBoer2023; Rival et al., Reference Rival, Ancrenaz, Guizol, Lackman, Burhan, Zemp, Sulaiman and Djama2025; Zemp et al., Reference Zemp, Guerrero-Ramirez, Brambach, Darras, Grass, Potapov, Röll, Arimond, Ballauff, Behling, Berkelmann, Biagioni, Buchori, Craven, Daniel, Gailing, Ellsäßer, Fardiansah, Hennings, Irawan, Khokthong, Krashevska, Krause, Kückes, Li, Lorenz, Maraun, Merk, Moura, Mulyani, Paterno, Pebrianti, Polle, Prameswari, Sachsenmaier, Scheu, Schneider, Setiajiati, Setyaningsih, Sundawati, Tscharntke, Wollni, Hölscher and Kreft2023). Given the strong sensitivity of both crops to global market volatility, agroforestry could offer a strategic buffer for smallholder livelihoods resilience (Kittitornkool et al., Reference Kittitornkool, Kaewwongsri, Tongkam, Bumrungsri and Sawangchote2019; Stroesser et al., Reference Stroesser, Penot, Michel, Tongkaemkaew and Chambon2018). Integrating rubber and oil palm within the same plot is one promising approach that remains uncommon yet, due to the need for tailored designs established at planting. As a result, rubber-oil palm agroforestry systems, despite their potential, are still rarely implemented and are understudied.
Minimizing the adverse effects of management practices on soil health is a central objective of sustainable agriculture. Healthy soils underpin multiple key ecosystem services, including sustaining plant productivity, maintaining water quality, sequestering atmospheric carbon, and supporting human health (Hou, Reference Hou2023; Lehmann et al., Reference Lehmann, Bossio, Kögel-Knabner and Rillig2020). Long-term cultivation of rubber and oil palm in monoculture has been shown to negatively affect soil properties (Panklang et al., Reference Panklang, Thoumazeau, Chiarawipa, Sdoodee, Sebag, Gay, Thaler and Brauman2022). To mitigate these impacts, management strategies that protect and enhance soil health are needed such as avoiding soil disturbance at planting, permanent soil cover, organic inputs, and diversification. In tropical systems, numerous studies have demonstrated the positive effects of agroforestry on soil health (Muchane et al., Reference Muchane, Sileshi, Gripenberg, Jonsson, Pumariño and Barrios2020). Specifically, agroforestry has been shown to improve soil fertility compared to monocropping, including in rubber and oil palm plantations combined with diverse associated species (de Jesus Costa et al., Reference de Jesus Costa, de Matos, Gomes, Kato, Castellani, Guedes and Vasconcelos2023; Gomes et al., Reference Gomes, Oliveira, Costa, Campos, Kato, Castellani and Vasconcelos2024; Reference Gomes, Vasconcelos, Viana-Junior, Costa, Barros, Ryohei Kato and Castellani2021; Zou et al., Reference Zou, Zhu, Zhu, Singh, Zakari, Yang, Chen and Liu2021).
Assessing the spatial heterogeneity of soil health at the plot scale is essential for designing sustainable cropping systems that safeguard soil function. Crop spatial arrangement and the associated functional units differentially affect soil health, and prioritizing soil-friendly configurations can improve the plot’s overall soil condition (Guillot et al., Reference Guillot, Bertrand, Rumpel, Gomez, Arnal, Abadie and Hinsinger2021; Rafflegeau et al., Reference Rafflegeau, Gosme, Barkaoui, Garcia, Allinne, Deheuvels, Grimaldi, Jagoret, Lauri, Merot, Metay, Reyes, Saj, Curry and Justes2023). Existing designs for perennial crop systems have primarily focused on crop performance and adaptation for resource acquisition, with limited consideration of the soil compartment (García-Barrios and Ong, Reference García-Barrios and Ong2004; Leroy et al., Reference Leroy, Sabatier, Wahyuni, Barczi, Dauzat, Laurans and Auclair2009). Previous studies have shown that soil health can vary considerably within agroforestry plots (Guillot et al., Reference Guillot, Bertrand, Rumpel, Gomez, Arnal, Abadie and Hinsinger2021; Mettauer et al., Reference Mettauer, Thoumazeau, Le Gall, Soiron, Rakotondrazafy, Bérard, Brauman and Mézière2022), particularly in perennial–annual systems, underscoring the pivotal role of trees in soil functioning. In tropical conditions, however, research on soil health in diversified perennial systems remains scarce. Yet, the integration of additional species at the plot scale was only studied in Brazil (de Oliveira et al., Reference de Oliveira, Vasconcelos, Teixeira, Viana-Junior, Castellani and Kato2022; Gomes et al., Reference Gomes, Vasconcelos, Viana-Junior, Costa, Barros, Ryohei Kato and Castellani2021) and revealed pronounced spatial heterogeneity in soil carbon and physical properties within oil palm plantations intercropped with diversified strips, including green manure, fruit trees, and timber trees.
This study examines the variability of soil health within a rubber–oil palm agroforestry plot. Building on the approach of Carron et al. (Reference Carron, Auriac, Snoeck, Villenave, Blanchart, Ribeyre, Marichal, Darminto and Caliman2015) and de Oliveira et al. (Reference de Oliveira, Vasconcelos, Teixeira, Viana-Junior, Castellani and Kato2022), our objective was to characterize the heterogeneity within a single diversified plot, identify potential differences, and discuss their implications for the design of agroforestry systems. Such study is of particular importance for proposing agroforestry systems designed to enhance soil health. We applied the Biofunctool® method to evaluate soil health at multiple locations across the plot. We hypothesize that the spatial arrangement of perennial crops – specifically the configuration of oil palm and rubber within an agroforestry system – together with crop-specific management practices, influences soil functioning and leads to heterogeneous soil health at the plot scale.
Material and methods
Experimental site
This study was conducted in a 2-ha plot of rubber-oil palm agroforestry system that is located at the third division of Indonesian Rubber Research Institute Experimental Field, Sembawa, Banyuasin, South Sumatera, Indonesia (2°58′16.6″S; 104°28′58.5″E). Average rainfall and temperature between 2017 and 2024 were around 2415 mm yr−1 and 27.2°C. The soil type is Ultisol (USDA). On average, the soil texture at 0–10 cm depth is 17.24% sand, 41.00% silt, and 41.76% clay; pH is 4.7; and soil organic carbon is 27.5 g kg−1 (laboratory analysis from Socfindo Seed Production and Laboratory, Bangun Bandar, Indonesia).
In this agroforestry site, rubber trees and oil palm were planted at the same time in 2017. The planting materials consisted of rubber tree clone IRR 112 and oil palm variety PPKS 540. Soil preparation for planting involved two rounds of ploughing and two rounds of harrowing, each spaced two weeks apart. The ploughing was done to a depth of 40 cm, with perpendicular directions to ensure proper soil mixing. After ploughing, harrowing was performed two weeks later. Following harrowing, any small wood debris from the field was removed. Rubber was planted in double rows with a distance between row of 2 m and a distance between two trees in the row of 2.5 m. The distance between two rubber double rows was 18 m. In the middle of this inter-row, a row of oil palm was planted with a distance of 8 m between two oil palms in the inter-row (Figure 1a). The final density of rubber was around 400 trees per hectare for rubber and around 62 palms per hectare for oil palm. Rubber trees were tapped once their girth reached 45 cm, typically about 6 years after planting. During the first two years of tapping, it was done every three days. After that, the tapping frequency increased to once every two days. Oil palm bunches were harvested every two weeks.
Design of the rubber oil palm agroforestry system and sampling strategy of the five positions and replicates in the study site. (A) sampling point between two oil palm trees; (B) sampling point within the oil palm tree circle; (C) sampling point between oil palm and rubber rows; (D) sampling point between two rubber trees in the inner rubber row; (E) sampling point between the two rubber tree rows.

Fertilizer was applied in the row of rubber trees at a distance of 1 m from the rubber trees row and also in the circle zone of oil palm trees (Carron et al., Reference Carron, Auriac, Snoeck, Villenave, Blanchart, Ribeyre, Marichal, Darminto and Caliman2015). The rate of the fertilizers for rubber was 500 g tree−1 year−1 of NPK compound fertilizer (16-16-16) and for oil palm, it was 1.25 kg tree−1 year−1 of NPK compound fertilizer (13-6-27). The fertilizer was given once a year in April for rubber and October for oil palm. Furthermore, Mucuna bracteata cover crop was sown in the wide row, between the rubber rows and the oil palm rows. The Mucuna bracteata was still present when the research was conducted (around seven years after plantation).
Experimental design and treatments
Five inner replicates were defined in the plot (Figure 1). In each of these replicate zones, five sampling position were sampled. Figure 1a and 1b shows the positions and the replicates, respectively. Position A was a sampling point between two oil palm trees (8 m distance from oil palm trees). Position B was a sampling point in the oil palm tree circle (0.75 m from oil palm trees). Position C was a sampling point between oil palm and rubber rows (9 m distance from each oil palm and rubber tree rows). Position D was a sampling point between two rubber trees in the inner rubber tree row (1.25 m distance from rubber tree). Position E was a sampling point in the centre diagonally between the narrow rows of rubber trees (1.6 m equidistant between four adjacent rubber trees).
The management practices in the study site focused mainly on zones B and D. In these areas, weeding occurred every six months to apply fertilizer and reduces competition between oil palm or rubber trees and weeds. In zone B, fertilizer was applied around the oil palm circle. Workers frequently stepped on this area for tasks such as pruning oil palm fronds (every four months) and harvesting the oil palm bunches. The oil palm fronds were left to decompose naturally in zone C. Bunches were manually transported to the main road using a wheelbarrow, passing through the area near zones B and A. In zone D, the rubber tree tappers frequently stepped around the trees, walking at least halfway around each tree’s circumference. The area next to the rubber tree rows served as a pathway for tappers (around 80 cm wide) to collect latex and transport it on foot to the collection point at the edge of the field. Fertilizer for rubber trees was applied in zone D. Fertilization in both zones B and D was done manually using hand tools and hoes. Zone C was rarely disturbed, as it was covered by cover crops and oil palm fronds.
Soil health measurements
Soil health measurements were conducted in March 2024 through the Biofunctool® set of indicators. The Biofunctool® method was developed to evaluate the effects of management practices on soil health using a multicriteria approach (Thoumazeau et al., Reference Thoumazeau, Bessou, Renevier, Trap, Marichal, Mareschal, Decaëns, Bottinelli, Jaillard, Chevallier, Suvannang, Sajjaphan, Thaler, Gay and Brauman2019b). By monitoring soil biological functioning through multiple indicators, recent studies have demonstrated its effectiveness in revealing the impacts of diverse management practices across a wide range of contexts (Delmotte et al., Reference Delmotte, Brunel, Castanier, Fevrier, Brauman and Versini2024; Dominguez-Bohorquez et al., Reference Dominguez-Bohorquez, Wittling, Felix-Faure, Brauman and Bouarfa2025; Pheap et al., Reference Pheap, Thoumazeau, Murase, Seng, Sarthou, Sar, Kimbo, Kheam, Chan, Srean, Leang, Hok and Tivet2025), particularly in rubber and oil palm cropping systems (Thoumazeau et al., Reference Thoumazeau, Bessou, Renevier, Panklang, Puttaso, Peerawat, Heepngoen, Polwong, Koonklang, Sdoodee, Chantuma, Lawongsa, Nimkingrat, Thaler, Gay and Brauman2019a, Reference Thoumazeau, Mettauer, Turinah, Baron, Chéron-Bessou and Ollivier2024). The Biofunctool® method has already revealed spatial heterogeneity in agroforestry systems in France (Mettauer et al., Reference Mettauer, Thoumazeau, Le Gall, Soiron, Rakotondrazafy, Bérard, Brauman and Mézière2022), showing that conventional management practices and notably tillage in alley-cropping inter-rows exerted a stronger impact on soil health than the presence of tree rows. The measurement was done at depth of 0–10 cm, which is a common depth to study soil biological activities (Mettauer et al., Reference Mettauer, Thoumazeau, Le Gall, Soiron, Rakotondrazafy, Bérard, Brauman and Mézière2022; Thoumazeau et al., Reference Thoumazeau, Bessou, Renevier, Trap, Marichal, Mareschal, Decaëns, Bottinelli, Jaillard, Chevallier, Suvannang, Sajjaphan, Thaler, Gay and Brauman2019b, Reference Thoumazeau, Mettauer, Turinah, Baron, Chéron-Bessou and Ollivier2024). In this study, eleven Biofunctool® indicators were assessed in each replicate, with all measurements performed for each replicate, in a sequential manner. The indicators were linked to three soil functions, namely: carbon transformation, nutrient cycling, and structure maintenance. For carbon transformation, we measured soil labile carbon (POXC (Weil et al., Reference Weil, Islam, Stine, Gruver and Samson-Liebig2003)), basal soil respiration (SituResp® (Thoumazeau et al., Reference Thoumazeau, Gay, Alonso, Suvannang, Phongjinda, Panklang, Chevallier, Bessou and Brauman2017)), and mesofauna activity (Bait Lamina Test (von Törne, Reference von Törne1990)). For POXC, we could not establish the standard curve of our spectrophotometer for practical reasons and thus we relied on the absorbance values, that are linearly linked to mg C kg−1 soil (Weil et al., Reference Weil, Islam, Stine, Gruver and Samson-Liebig2003). For Lamina, we used a substrate made of cellulose (70%) and wheat flour (30%) soaked in an agar gel. We kept the lamina baits 34 days in the field. For nutrient cycling function, we measured soil available nitrate and ammonium (NO3− and NH4+) and ions adsorbed on anion and cation membrane (AEMNO3 and CEMNH4) (Qian and Schoenau, Reference Qian and Schoenau2002) left in the plot for 34 days. Laboratory analysis of the solutions was made at Socfindo Seed Production and Laboratory, Bangun Bandar, Indonesia. For the structure maintenance function, we measured the soil infiltration rate (Beerkan, adapted from Lassabatère et al. (Reference Lassabatère, Angulo-Jaramillo, Soria Ugalde, Cuenca, Braud and Haverkamp2006)), soil aggregate stability (AggSurf at 0–2 cm depth and AggSoil at 2–10 cm depth (Herrick et al., Reference Herrick, Whitford, Soyza, Van Zee, Havstad, Seybold and Walton2001)), and soil structure (VESS (Guimarães et al., Reference Guimarães, Ball and Tormena2011)).
Data analysis
Statistical analysis was implemented with R program (v.4.3.0). We studied the effects of position on soil health. After highlighting outlying values and checking for the normality and homoscedasticity assumptions, we implemented univariate analysis for each of the eleven Biofunctool® indicators. Depending on the validity of assumptions, we either computed a one-way ANOVA or Kruskall–Wallis test. Then, we aggregated the dataset through PCA (FactoMineR package (Lê et al., Reference Lê, Josse and Husson2008)). We used this PCA to build a soil health index score as proposed by Obriot et al., (Reference Obriot, Stauffer, Goubard, Cheviron, Peres, Eden, Revallier, Vieublé-Gonod and Houot2016) and Thoumazeau et al., (Reference Thoumazeau, Bessou, Renevier, Trap, Marichal, Mareschal, Decaëns, Bottinelli, Jaillard, Chevallier, Suvannang, Sajjaphan, Thaler, Gay and Brauman2019b). In short, the dataset was firstly normalized between 0 and 1 following scoring functions based on the ‘more is better’ response curve, except for the VESS indicator where the ‘less is better’ was used (Thoumazeau et al., Reference Thoumazeau, Bessou, Renevier, Trap, Marichal, Mareschal, Decaëns, Bottinelli, Jaillard, Chevallier, Suvannang, Sajjaphan, Thaler, Gay and Brauman2019b). Then we weighted each value combining the PCA variance of each dimension and the variables contribution (Andrews et al., Reference Andrews, Karlen and Mitchell2002). As the number of indicators was slightly different for each soil function, we artificially weighted variables’ importance to have the same weight for each of the three soil functions. The three Biofunctool® aggregated functions scores (i.e. carbon transformation, nutrient cycling, and structure maintenance) were used as soil health indicators.
Results
Univariate analysis of soil health indicator
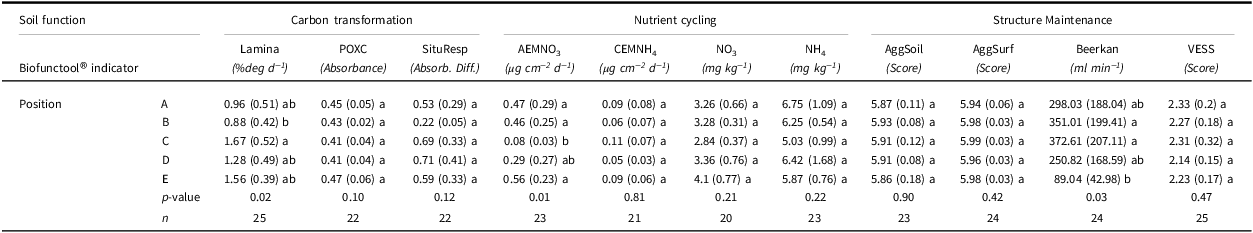
The results of univariate analyses show that among the eleven Biofunctool® indicators, only three indicators are significantly affected by the position in the plot (Table 1). The other eight indicators are not sensitive to the position, despite a clear variability being observed among the values collected (Table 1). Among the three sensitive indicators, the degradation of the substrate in the lamina baits was significantly faster in position C compared to position B (p-value < 0.05), consistent with higher faunal activity in this area of the plot (Table 1). Then, we observed significantly higher nitrate fixed on the ion exchange membrane (AEMNO3) in position A, B, and E compared to C (Table 1, Figure 2b). Finally, the soil infiltration (Beerkan) was lower in the rubber double spacing (position E) compared to other B and C zones around the oil palm (p-value < 0.05, Figure 2c).
Boxplot of the Biofunctool® indicators that are significantly sensitive to the position effect. For positions, (A) sampling point between two oil palm trees; (B) sampling point within the oil palm tree circle; (C) sampling point between oil palm and rubber rows; (D) sampling point between two rubber trees in the inner rubber row; (E) sampling point between the two rubber tree rows. Lamina – Mesofauna activity, AEMNO3 – nitrate adsorbed on anion exchange membranes, Beerkan – soil infiltration rate.

Univariate analysis of the effect of position on Biofunctool® indicators with significance levels of p-value < 0.05. For positions, (a) sampling point between two oil palm trees; (b) sampling point within the oil palm tree circle; (c) sampling point between oil palm and rubber rows; (d) sampling point between two rubber trees in the inner rubber row; (e) sampling point between the two rubber tree rows. POXC – permanganate oxidizable carbon, SituResp – basal soil respiration, Lamina – Mesofauna activity, NO3− – soil available nitrate, NH4+ – soil available ammonium, AEMNO3 – nitrate adsorbed on anion exchange membranes, CEMNH4 – ammonium adsorbed on cation exchange membranes, Beerkan – soil infiltration rate, AggSurf – aggregate stability at 0–2 cm depth, AggSoil – aggregate stability at 2–10 cm depth, VESS – visual evaluation of soil structure

Multivariate analysis of soil health indicator
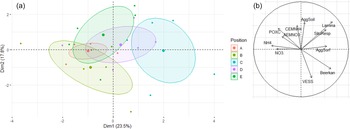
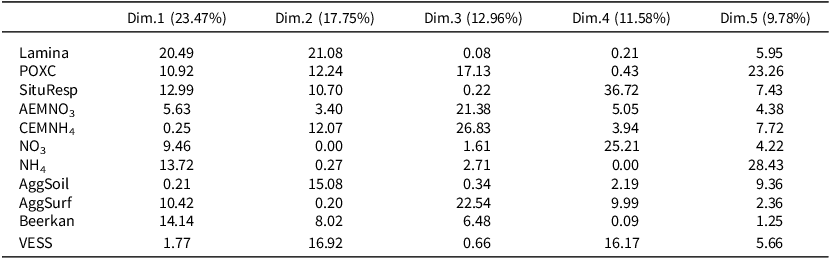
Figure 3 shows the PCA results of the eleven Biofunctool® variables. The two main axes (Dimension 1 and Dimension 2) explain 41.30% of variance. Other axes explained less than 13% of the inertia (Table 2). Lamina contributed the most on Dim1 and Dim2 (Table 2). Beerkan and AEMNO3 were poorly represented in Dim1 and Dim2, only AEMNO3 had a high contribution on Dim3 (Table 2). Figure 3a shows that position A, B, D, and E ellipses are overlapping. Only position C seems to be distinct on the Dim1, especially from positions A, B, and E. This distinction is mainly positively explained by Lamina, SituResp, and Beerkan variables.
Two first dimensions of the principal component analysis of the Biofunctool® data, A. is the graph of individuals and B. is the graph of variable. For positions, (A) sampling point between two oil palm trees; (B) sampling point within the oil palm tree circle; (C) sampling point between oil palm and rubber rows; (D) sampling point between two rubber trees in the inner rubber row; (E) sampling point between the two rubber tree rows. POXC – permanganate oxidizable carbon, SituResp – basal soil respiration, Lamina – Mesofauna activity, NO3− – soil available nitrate, NH4+ – soil available ammonium, AEMNO3 – nitrate adsorbed on anion exchange membranes, CEMNH4 – ammonium adsorbed on cation exchange membranes, Beerkan – soil infiltration rate, AggSurf – aggregate stability at 0–2 cm depth, AggSoil – aggregate stability at 2–10 cm depth, VESS – visual evaluation of soil structure.

Percentage of inertia and contribution of the Biofunctool® indicators to the construction of the five first PCA axis. Dim. = PCA dimension. POXC – permanganate oxidizable carbon, SituResp – basal soil respiration, Lamina – Mesofauna activity, NO3− – soil available nitrate, NH4+ – soil available ammonium, AEMNO3 – nitrate adsorbed on anion exchange membranes, CEMNH4 – ammonium adsorbed on cation exchange membranes, Beerkan – soil infiltration rate, aggSurf – aggregate stability at 0–2 cm depth, aggSoil – aggregate stability at 2–10 cm depth, VESS – visual evaluation of soil structure

Soil health index
The soil health index aggregates the eleven Biofunctool® indicators into a single score (Figure 4). The proportion of each soil function to build the cumulative score is almost similar. Only the soil structure maintenance function shows significant differences, with a higher score for position C compared to E. Soil structure is a composite index of the AggSurf, AggSoil, Beerkan, and VESS indicators. The cumulative score is not different from one position to another.
Soil health index of the Biofunctool® data. Carbon transformation aggregates Lamina, POXC, and SituResp. Nutrient cycling aggregates AEMNO3, CEMNH4, NO3, and NH4. Structure maintenance aggregates AggSurf, AggSoil, Beerkan, and VESS. Letters indicate significant differences at 0.05 level. For positions, (A) sampling point between two oil palm trees; (B) sampling point within the oil palm tree circle; (C) sampling point between oil palm and rubber rows; (D) sampling point between two rubber trees in the inner rubber row; (E) sampling point between the two rubber tree rows.

Discussion
Planting design and management practices affected some soil health indicators
This study indicated that the organization of rubber–oil palm agroforestry systems impacted various aspects of soil health and especially the activity of soil mesofauna (through Lamina), the soil nitrate dynamics (through AEMNO3), and the soil infiltration rate (through Beerkan). Interestingly, those three indicators are part of each of the three soil functions selected in the Biofunctool® approach (carbon transformation, nutrient cycling, and structure maintenance, respectively). This highlights the importance of multi-criteria approach, combining several indicators, to assess the impact of management on soil health. Such variability in the responses of Biofunctool® indicators to management practices has previously been reported in rubber plantations in Thailand, where cover crops mainly influenced structure maintenance indicators in 4-year-old plantations, while their effects were more pronounced on nutrient cycling functions in 9-year-old plantations (Thoumazeau et al., Reference Thoumazeau, Bessou, Renevier, Panklang, Puttaso, Peerawat, Heepngoen, Polwong, Koonklang, Sdoodee, Chantuma, Lawongsa, Nimkingrat, Thaler, Gay and Brauman2019a).
The highest Lamina values were observed in position C, an area with low disturbance and clear development of the legume cover crops. Some studies highlighted the role of cover crops in improving the soil biological activity through the lamina test (Fialho et al., Reference Fialho, Santos, Niva, Ferreira and Paim2022; Reinecke et al., Reference Reinecke, Helling, Louw, Fourie and Reinecke2002). These higher values could be attributed to improved soil structure and better retention of soil moisture provided by the cover crop.
AEMNO3 was primarily influenced by fertilization practices, with higher values observed in positions where fertilizers had been applied. This highlights the usefulness of this tool for monitoring the spatial distribution of fertilization and soil nutrient availability to plants (Littke et al., Reference Littke, Holub, Bremer and Turnblom2024). Our findings are promising for plant nutrition, and further analysis of nutrient content in the biomass of both rubber and oil palm could provide valuable insights, as similar relationships have been observed in other mixed systems in tropical regions (Le Cadre et al., Reference Le Cadre, Kinkondi, Koutika, Epron and Mareschal2018).
Finally, Beerkan infiltration values were significantly lower in the rubber double-line row, indicating reduced infiltration in that section of the plot compare to position B and C. This pattern is also reflected in the low contribution of soil structure maintenance to the overall soil health index in the position E. This is likely linked to the fact that rubber harvesters are walking on this area to tap the rubber tree very frequently. In oil palm agroforestry systems, de Oliveira et al. Reference de Oliveira, Vasconcelos, Teixeira, Viana-Junior, Castellani and Kato(2022) similarly reported reduced soil physical quality along harvesting paths subjected to repeated mechanical disturbance. Positions A and D showed intermediate values, which may be related to their distance from the oil palm (A) and rubber rooting systems (D).
Potential legacy effects of early-stage planting disturbances
A multicriteria approach for soil health assessment enables the integration of multiple indicators to capture their complementarity. In this study, eight out of eleven indicators showed no significant response to position, resulting in multivariate analyses with low explained variance and poorly differentiated soil health indices. This was likely due to the fact that only one indicator per soil function showed significant sensitivity to spatial variation. The level of disturbance associated with spatial heterogeneity within the plot may not have been pronounced enough to reveal stronger contrasts, as it has been observed in other studies in rubber and oil palm plantations with Biofunctool® method (Perron et al., Reference Perron, Kouakou, Simon, Mareschal, Frédéric, Soumahoro, Kouassi, Rakotondrazafy, Rapidel, Laclau and Brauman2021; Thoumazeau et al., Reference Thoumazeau, Bessou, Renevier, Panklang, Puttaso, Peerawat, Heepngoen, Polwong, Koonklang, Sdoodee, Chantuma, Lawongsa, Nimkingrat, Thaler, Gay and Brauman2019a, Reference Thoumazeau, Mettauer, Turinah, Baron, Chéron-Bessou and Ollivier2024). Moreover, management practices typically applied during the establishment of perennial crops – such as subsoiling and tillage – can cause significant soil disturbance (Perron et al., Reference Perron, Kouakou, Simon, Mareschal, Frédéric, Soumahoro, Kouassi, Rakotondrazafy, Rapidel, Laclau and Brauman2021). These intensive interventions may have contributed to a homogenization of soil conditions, obscuring clear spatial differences within the plot even seven years after planting. In contrast, spatial heterogeneity in soil health has been reported in pure oil palm plantations under comparable conditions, but only in much older stands (Carron et al., Reference Carron, Auriac, Snoeck, Villenave, Blanchart, Ribeyre, Marichal, Darminto and Caliman2015). Similarly, Gomes et al. (Reference Gomes, Vasconcelos, Viana-Junior, Costa, Barros, Ryohei Kato and Castellani2021) reported clear differences in POXC among zones in oil palm agroforestry systems, albeit in a different context, where more highly weathered soils (Oxisols) may have resulted in a faster response to management practices.
Towards the optimization of rubber–oil palm agroforestry systems design
Based on our assessment, we identified four key management practices that require careful consideration to enhance soil health in rubber–oil palm agroforestry systems:
-
1. Higher substrate degradation in the lamina tests was observed in the area with a legume cover crop (position C), demonstrating the effectiveness of cover crop establishment during the immature stage in improving soil biology. While the use of legume cover crops is a common practice in large-scale rubber and oil palm plantations, it remains underutilized in smallholder systems (Simon et al., Reference Simon, Thoumazeau, Chambon, Sajjaphan and Metay2024). Promoting this practice in smallholdings – which account for substantial plantation areas – could significantly contribute to improving soil health in these contexts.
-
2. Exchange membrane measurements showed that fertilization increased plant-available nutrients in zones surrounding rubber and oil palm trees. Higher nitrate availability was observed around oil palm and rubber trees where fertilizers were applied, despite relatively low fertilization levels. In this experiment, fertilization inputs were defined at the individual tree level rather than at the whole-plot scale, and fertilization rates were adjusted accordingly. Rubber planting density reached approximately 84% of the standard density for rubber monocultures, and fertilizer application followed common practice on a per-tree basis (500 g of compound fertilizer tree−1 yr−1; Chotiphan et al., (Reference Chotiphan, Vaysse, Lacote, Gohet, Thaler, Sajjaphan, Bottier, Char, Liengprayoon and Gay2019)). For oil palm, plot-level density was 43% of that in monoculture systems, and fertilization was reduced to about five times less than the recommended rate (6–7 kg of compound fertilizer tree−1 yr−1; Oktavian et al., (Reference Oktavian and Sudradjat2025)). Overall, despite higher total plant density, this agroforestry plot tended to receive lower fertilizer inputs at the plot scale than typical rubber or oil palm monocultures, and, more importantly, oil palm trees received substantially less fertilizer on a per-tree basis. This raises important questions regarding the long-term productivity of oil palm, particularly in agroforestry systems as fertilization is a key driver of oil palm performances (Monzon et al., Reference Monzon, Lim, Tenorio, Farrasati, Pradiko, Sugianto, Donough, Rattalino Edreira, Rahutomo, Agus, Slingerland, Zijlstra, Saleh, Nashr, Nurdwiansyah, Ulfaria, Winarni, Zulhakim and Grassini2023; Thoumazeau et al., Reference Thoumazeau, Mettauer, Turinah, Baron, Chéron-Bessou and Ollivier2024). The fertilization frequency was also adapted to this mixed cropping system. In monocultures of oil palm and rubber, fertilizer is typically applied twice per year, mainly to reduce nutrient losses through leaching and runoff. In this experiment, the two annual applications were instead associated with the two different crops, with the expectation that species interactions could help offset these constraints and align with the fundamental principles and objectives of agroforestry systems (Sida et al., Reference Sida, Baudron, Ndoli, Tirfessa and Giller2020).
-
3. Beerkan measurements showed significantly lower soil infiltration rates in the middle of the rubber double row, indicating that the double row created a compacted zone within the plot, most likely due to frequent tapper trampling. This observation should be verified in different soil types, as they may vary in their susceptibility to compaction. Establishing cover crops or maintaining spontaneous understory along the rows is feasible and could help alleviate soil compaction, improve water infiltration, and reduce the risk of severe soil erosion under the rubber canopy (Neyret et al., Reference Neyret, Robain, de Rouw, Janeau, Durand, Kaewthip, Trisophon and Valentin2020; Thoumazeau et al., Reference Thoumazeau, Mettauer, Turinah, Baron, Chéron-Bessou and Ollivier2024). The tapping frequency in this study is relatively high, and adopting lower frequency tapping practices (Sainoi et al., Reference Sainoi, Sdoodee, Lacote and Gohet2017) could help minimize the effects of tapper trampling. Only part of the area could be covered in order to maintain the tappers’ paths, and challenges remain in identifying cover crops adapted to shaded conditions. Improving soil quality in these areas could also mitigate the negative effects of narrow double-row spacing (2 m) on tree girth reported by Montoro et al., Reference Montoro, Alami, Haris, Nababan, Oktavia, Penot, Purwestri, Rahutomo, Kadir, Subandiyah and Syarifa(2025).
-
4. Eight of the eleven indicators showed no significant differences between plot positions. The planting stage of perennial crops such as rubber and oil palm often involves significant soil disturbance, resulting in the loss of many soil properties (Panklang et al., Reference Panklang, Thoumazeau, Chiarawipa, Sdoodee, Sebag, Gay, Thaler and Brauman2022). Consequently, the positive effects of management practices such as plot-scale diversification may take considerable time to manifest due to the initial disruption. Implementing soil-friendly management practices during planting can accelerate soil health recovery (Perron et al., Reference Perron, Kouakou, Simon, Mareschal, Frédéric, Soumahoro, Kouassi, Rakotondrazafy, Rapidel, Laclau and Brauman2021) and more quickly realize the benefits of agroforestry’s spatial organization.
Despite its importance in designing systems that effectively integrate soil functions, soil spatial heterogeneity in agroforestry remains largely underexplored in the literature. While rubber and oil palm hold strong potential for agroforestry (Qi et al., Reference Qi, Wu, Chen, Zhang, Yang and Fu2024; Rival et al., Reference Rival, Ancrenaz, Guizol, Lackman, Burhan, Zemp, Sulaiman and Djama2025), there remains a significant lack of long-term experiments with proper replications. This study was implemented in a plot of Indonesian Rubber Research Institute, focusing on an innovative system that remains rarely adopted by rubber and oil palm farmers, particularly the rubber double-row design, which has yet to gain attraction among smallholders. To optimize the design of efficient and resilient rubber–oil palm agroforestry systems, more targeted research is needed. For instance, certain factors such as fertilization, the use of cover crops, and the overall spacing between the two species should be examined separately in future experiments. Moreover, the performance of the mixed rubber–oil palm system should be compared with that of their respective monocultures to better assess the potential advantages of diversification.
Conclusion
This study explored soil health heterogeneity in an innovative rubber–oil palm agroforestry system. Using the Biofunctool® method, we identified indicators that were significantly responsive to plot compartments, reflecting the influence of specific management practices. In particular, cover cropping, fertilization, and harvesting activities played a key role in shaping soil biological functions related to carbon transformation, nutrient cycling, and soil structure maintenance. However, the majority of soil health indicators exhibited low sensitivity to spatial variation, likely due to the intensive disturbance during planting and the relatively young age of the plot. These findings offer valuable insights for adapting management strategies to improve soil conditions in agroforestry systems. Moving forward, it is essential to broaden the range of measurements – particularly to assess agronomic and economic performance at the plot level – to inform more comprehensive recommendations. Also, increasing the diversity of this mixed planting could provide extra-benefits that should further be studied.
Supplementary material
The supplementary material for this article can be found at https://doi.org/10.1017/S0014479726100283.
Acknowledgements
The authors thank Pascal Montoro and Frédéric Gay for their respective support in the coordination of the RUBIS project and in the initial activities of the working package 2 of the RUBIS project. Alexis Thoumazeau acknowledges the Thailand International Cooperation Agency (TICA) for supporting his activities in Thailand. We would like to thank the three anonymous reviewers for their constructive comments that helped us to improve the quality of our manuscript.
Funding statement
This study was implemented under the RUBIS project, supported by the LabexAgro 2011-LBX-002 and coordinated by the Agropolis Foundation.
Competing interests
All authors declare that they have no conflicts of interest.
Credit
Conceptualization: A.N.C., R.A, T., S.V., A.T.; Data curation: A.N.C., R.A, A.A., S.; Formal analysis: A.T.; Funding acquisition: F.O.; Investigation: A.N.C., R.A, A.A., S.; Methodology: T., A.T.; Project administration: F.O., A.T.; Resources: A.N.C., R.A, T., F.O.; Software: A.T.; Supervision: A.T.; Validation: A.T.; Visualization: A.T.; Writing – Original draft preparation: A.N.C., R.A, A.T.; Writing – review and editing: A.N.C., R.A, T., S.V., A.A., S., F.O., A.T.
Declaration of generative AI in scientific writing
During the preparation of this work the author(s) used Chat-GPT in order to rephrase English sentences or detect English language errors. After using this tool/service, the author(s) reviewed and edited the content as needed and take(s) full responsibility for the content of the publication.


 Open access