


In Atlantic salmon (Salmo salar) farming, the feed currently consists of 60 % plant-based material, which is a substantial increase from 22 % in 2000(Reference Aas, Ytrestoyl and Asgard1). The change in feed raw materials from marine to plant based alters the requirement levels of certain micronutrients. Recommendations have thereby been re-evaluated through the EU-funded ARRAINA project(Reference Hamre, Sissener and Lock2–Reference Vera, Hamre and Espe6), and recent research also points to methionine as a key micronutrient along with folic acid, vitamin B6 (pyridoxine) and vitamin B12 (cobalamin) for improved and healthy growth through smoltification(Reference Espe, Vikesa and Thomsen7,Reference Espe, Skjaerven and Chen8) . B vitamin supplementation above the NRC recommendations improved overall growth performance, protein retention and reduced relative liver size of Atlantic salmon(Reference Hemre, Lock and Olsvik3,Reference Taylor, Vera and De Santis4,Reference Vera, Hamre and Espe6,9,Reference Saito, Whatmore and Taylor10) . Dietary micronutrients including the B vitamins have been proposed as the most probable candidates affecting fillet texture and increasing muscle cell size observed in post-smolts(Reference Hamre, Bjornevik and Espe5).
Methionine, folic acid, vitamin B6 and vitamin B12 are important substrates and cofactors in the one-carbon (1C) metabolism, hereinafter collectively referred to as 1C nutrients. The 1C metabolism links several pathways that allocate 1C groups by S-adenosylmethionine (SAM) that is synthesised from methionine by the enzyme methionine adenosyltransferase. In mammals, SAM affects not only energy metabolism, synthesis of proteins, phosphatidylcholines, creatine and polyamines but also redox defence, cell signalling through post-translational protein modification and epigenetic control of gene expression through methylation of DNA and histones(Reference Ducker and Rabinowitz11–Reference Francioso, Conrado and Mosca15). S-adenosylhomocysteine (SAH) is formed after donation of the methyl group from SAM to a methyl acceptor and hydrolysed to homocysteine. Homocysteine can be re-methylated back to methionine by methionine synthase that requires vitamin B12 and 5-methyltetrahydrofolate, re-methylated through the betaine homocysteine methyltransferase pathway or irreversibly transsulphurated through the vitamin B6-dependent cystathionine β-synthase to glutathione (GSH).(Reference Skjaerven, Jakt and Dahl16,Reference Skjaerven, Jakt and Fernandes17)
Skeletal muscle mass represents a dynamic balance between protein synthesis and degradation controlled by numerous factors, including growth hormone (GH), insulin-like growth factors (IGF-1, IGF-2) and their cell surface receptors, and IGF-binding proteins (IGFBP) in the GH/IGF system in fish(Reference Bower, Li and Taylor18–Reference Fuentes, Valdes and Molina21). A shift towards increased protein synthesis leads to positive protein accretion, and the availability of nutrients is one of the most important factors influencing muscle growth performance in fish(Reference Valente, Moutou and Conceicao22). GH activates IGF-1 production through GH receptors (GHR) mainly in liver, whereas IGF function greatly depends on IGFBP activity in target tissues such as muscle(Reference Velloso19,Reference Reindl and Sheridan23) . During protein synthesis in muscle, myofibrillar content increases along with the enlargement of muscle fibres. The formation of muscle tissue, called myogenesis, is regulated by several myogenic regulatory factors and myocyte-specific enhancer factor 2 transcription factors that stimulate differentiating myocytes to fuse to multinucleated myofibres during myofibrillogenesis(Reference Johnston, Bower and Macqueen20,Reference Johnston24,Reference Le Grand and Rudnicki25) . Endocrine regulation of growth, particularly circulating plasma GH levels are nutritionally regulated, however, nutritional regulation of IGFBP receptors and GHR is tissue specific that remains to be understood(Reference Perez-Sanchez, Simo-Mirabet and Naya-Catala26). The availability of certain nutrients such as lysine, methionine or B vitamins through the diet has been shown to modulate GH/IGF responses by modulating gene expression and protein deposition, turnover thus affecting growth performance in fish(Reference Espe, Vikesa and Thomsen7,Reference Rolland, Dalsgaard and Holm27,Reference Hevroy, El-Mowafi and Taylor28) . The crosstalk between the GH/IGF system and sirtuins, which de-acylate histones or non-histone proteins, is coupled to the energy status of a cell via NAD+ and is involved in tuning growth energy-demanding processes(Reference Perez-Sanchez, Simo-Mirabet and Naya-Catala26).
Factors such as photoperiod(Reference Johnston, Manthri and Smart29), temperature(Reference Johnston, Manthri and Alderson30–Reference Campos, Valente and Conceicao32), circadian clock(Reference Amaral and Johnston33), dietary macronutrients such as protein, but also dietary micronutrients(Reference Hemre, Lock and Olsvik3,Reference Hamre, Bjornevik and Espe5,Reference Espe, Vikesa and Thomsen7,Reference Saito, Whatmore and Taylor10,Reference Skjaerven, Jakt and Dahl16,Reference Bower and Johnston34) affect muscle growth and quality in teleost species. The role of dietary 1C nutrients when feeding plant-based feed has broad consequences for amino acid availability utilised for growth(Reference Skjaerven, Jakt and Dahl16), for regulating mRNA levels of genes encoding enzymes in the 1C metabolism both intra-(Reference Saito, Whatmore and Taylor10) and intergenerationally(Reference Skjaerven, Jakt and Fernandes17), and moreover it has shown to enhance growth by altering the metabolism in both liver and muscle of Atlantic salmon(Reference Espe, Vikesa and Thomsen7,Reference Espe, Hevroy and Liaset35) . In a recently published study, two 1C nutrient surplus levels were given in a Med-1C and a High-1C diet on top of the current recommendations as formulated in the Low-1C diet(Reference Espe, Vikesa and Thomsen7). When salmon was fed the highest surplus level (High-1C), no additional benefit for growth was reported in the respective trial. Feeding a moderate surplus of 1C nutrients (Med-1C) during the fresh water period, through smoltification until the on-growing saltwater period, increased body weight and decreased liver weight of salmon, which was reflected in a higher condition factor and specific growth rate compared with the Low-1C group(Reference Espe, Vikesa and Thomsen7). The present study compares muscle from Low-1C and Med-1C fed salmon, hereinafter named as Ctrl and 1C+, respectively. Describing the metabolic signatures and gene expression profiles in muscle from better growing 1C+ fed salmon will improve our knowledge on active pathways and interactions to explain how surplus 1C nutrients fed to pre-smolts throughout smoltification improves growth already at the start of the on-growing saltwater period.
Materials and methods
Feeding trial
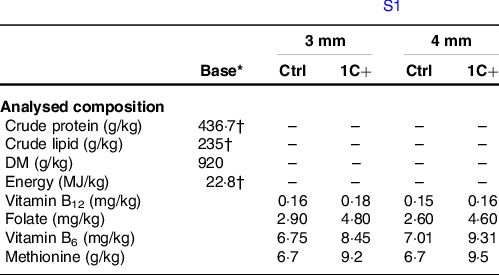
The Atlantic salmon feeding trial was performed at Lerang Research Station (Skretting Aquaculture Research Centre). In accordance to Norwegian Regulation on Animal Experimentation (FOR-2015-06-18-761) and European legislation (Directive 2010/63/EU), formal ethical approval of the experiment by the Norwegian Animal Research Authority was not required as experimental conditions were practices undertaken for the purpose of recognised animal husbandry, and experimental feed was not deficient in nutrient composition with regard to health and welfare of the animals. Two earlier described experimental feeds(Reference Espe, Vikesa and Thomsen7), Ctrl (Low-1C) and 1C+ (Med-1C), contained varying levels of methionine, folate, vitamin B6 and B12, collectively named as 1C nutrients. Analysed proximate composition and 1C nutrient levels in the feed are given in Table 1. Feed composition is provided in online Supplementary Table S1 and Fig. S1. For the Ctrl feed, B vitamins were included at recommended levels(Reference Vera, Hamre and Espe6) and methionine at known NRC requirement levels(9). The 1C+ feed contained a moderate surplus of four 1C nutrients to support maximal performance as suggested in previous work(Reference Vera, Hamre and Espe6,Reference Espe, Andersen and Holen36) .
Analysed proximate composition and 1C nutrient levels in Ctrl and 1C+ feed. Re-used and modified table from Espe et al. (Reference Espe, Vikesa and Thomsen7). Feed composition is provided in online Supplementary Table S1

* Base values indicate that all values in the same row are equivalent/similar across the feeds and the pellet sizes.
† Values are not equivalent but similar as determined by their relatively small sd: ±5·2, ±5·5 and ±0·18, respectively.
Primary outcomes of the feeding experiment, that is, growth performance, body indices, nutrient retention, feed conversion ratio and protein utilisation of the same experimental fish, were described by Espe et al. (Reference Espe, Vikesa and Thomsen7).
The feeds were fed in triplicate tanks 6 weeks prior to smoltification until 3 months after saltwater transfer (Fig. 1). Pre-smolt salmon (SalmoBreed strain) was randomly assigned to experimental tanks for a 2-week long acclimatisation period prior to the start of the experiment as earlier described(Reference Espe, Vikesa and Thomsen7). Tanks from all treatment groups were placed in random order. To avoid poor tank environment, abnormal behaviour and poor welfare, ninety fish per tank were initially kept during the freshwater period (mean body weight of 32·1 g (bulk weight), tank diameter 0·6 m, tank volume 70 l, water flow 300–450 l/h; rearing temperature 11·9 (sd 0·4)°C), and then moved to larger tanks for the saltwater period (mean body weight of 95·0 (sd 3·9) g, tank diameter 0·6 m, tank volume 450 l, water flow 450–900 l/h; rearing temperature 12·0 (sd 0·1)°C)(Reference Espe, Vikesa and Thomsen7). Fish were fed continuously until day 94 of the experiment, and thereafter fed three meals daily for 2 h per meal (8am, 12am and 8pm)(Reference Espe, Vikesa and Thomsen7). The fish received 12 h light and 12 h darkness during the first 6 weeks, and continuous light for the rest of the experiment(Reference Espe, Vikesa and Thomsen7). Fish were vaccinated at day 38 and starved for 5 d during vaccination. Early signs of disease, pain or distress were regularly monitored to avoid suffering. 40 mg/l tricaine (Pharmaq) was used to anaesthetise fish before all handling, and samples were collected from salmon 24 h after feeding to address effects on metabolism rather than reflecting the feed itself(Reference Espe, Vikesa and Thomsen7). Tricaine solved in salt water requires no additional buffering, but tricaine solved in fresh water was buffered with 40 mg/l Na2CO3.
Experimental design and sampling of muscle from Atlantic salmon fed a control feed (Ctrl) and a feed including surplus levels of one-carbon (1C) nutrients (1C+) through the smoltification period. The Ctrl feed contained 1C nutrients (folate, methionine, vitamin B6 and B12) as recommended and on the requirement levels to support maximal performance (ARRAINA(Reference Vera, Hamre and Espe6) and NRC(9)). The 1C+ feed included even higher levels of the 1C nutrients, which improved growth when given through smoltification(Reference Espe, Vikesa and Thomsen7). Fish were fed in triplicate tanks for 6 weeks in the fresh water period, through saltwater transfer and 3 months in the on-growing saltwater period. Muscle tissue was sampled in the end of the fresh water and in the on-growing saltwater period for further analyses: global metabolic profiling, SAM/SAH by HPLC and RNA-sequencing (RNA-seq). Figure is modified from Espe et al. (Reference Espe, Vikesa and Thomsen7).

Pre-smolt and post-smolt muscle sampling
Fast muscle from Ctrl and 1C+ fed salmon were taken in the end of the fresh water period (pre-smolt, day 95) and in the on-growing saltwater period (post-smolt, day 220) as illustrated in Fig. 1. Muscle tissue was obtained from the same epaxial area in the filet between dorsal and anal fin from three fish of each of the three replicate tanks per group. mRNA was extracted from muscle from individual fish for RNA-sequencing (online Supplementary Table S2). Global metabolic profiling and SAM/SAH analysis were performed on the same pooled samples containing muscle tissue from five fish derived from the same tank (online Supplementary Table S3).
S-adenosylmethionine and S-adenosylhomocysteine analysis
SAM and SAH were determined in twelve pooled muscle samples (each contained five muscles from fish of the same tank) on a reverse phase HPLC after deproteinisation in 0·4 M HClO4 and quantified using standards of the respective metabolites (Sigma) as earlier described(Reference Espe, Hevroy and Liaset35,Reference Wang, Kramer and Yang37) .
Global metabolic profiling
Twelve muscle samples containing pooled muscle tissue of five individual fish from the same tank were analysed in an MxP® Global Profiling by Metanomics Health GmbH. Samples were weighed, freeze dried and homogenised, and dry weight was determined before extraction. After extraction and protein precipitation, samples were separated into lipid and polar fractions before further analysis using the GC-MS (Agilent 6890 GC coupled to an Agilent 5973 MS System, Agilent) and liquid chromatography-MS/MS (LC-MS/MS; Agilent 1100 HPLC-System, Agilent, coupled to an Applied Biosystems API4000 MS/MS-System, Applied Biosystems). Integration and validation of chromatographic data were performed by Metanomics Health GmbH. Metabolite levels were normalised against the median of the pool reference samples (derived from aliquots of all samples) to give pool-normalised ratios performed for each sample per metabolite. GraphPad Prism (version 8.3.0) was used for illustration of pool-normalised metabolite data. Evaluation of all metabolites was semi-quantitative and metabolite levels were reported as pool-normalised ratios (online Supplementary Table S4). Results were given for free (non-covalently bound) metabolites as sample preparation did not involve hydrolysation.
mRNA extraction
For mRNA extraction, muscle tissue of thirty-six individual fish was homogenised each in Qiazol (Qiagen) and three ceramic beads (CK28) using a Precellys 24 homogeniser (Bertin Technologies) at 6000 rpm. Total RNA was extracted following the EZ1 RNA Tissue Mini Kit (Qiagen) including a DNAase treatment using the RNAse-Free DNAse set (Qiagen). RNA quantity and quality were verified using NanoDrop® ND-1000 Spectrophotometer (NanoDrop Technologies) and Agilent 2100 Bioanalyser (RNA 6000 Nano LabChip kit, Agilent Technologies), respectively.
RNA library preparation and high-throughput RNA-sequencing
Total RNA quality was assessed before creating mRNA fragments for high-throughput sequencing (RNA-seq). RNA integrity number (RIN) values from a total of thirty-six samples were on average 9·3 (RINmin = 8·2; RINmax = 9·7, online Supplementary Table S2). The libraries were divided into two sets of eighteen samples each, which were prepared simultaneously and were balanced for sex, dietary group and stage. See online Supplementary File S1 for library preparation and sequencing details. The generated libraries of an approximately 200 nt insert size were PCR enriched, and quality of the libraries was assessed; they were barcoded, pooled and denatured according to the NextSeq System Denature and Dilute Libraries Guide (Illumina). The two library pools were sequenced on a NextSeq500 (Illumina) at Nord University to generate 76 bp single-end reads. Fastqc v0·11·8 (Babraham Bioinformatics) was used for quality assessment. Quality control assessment indicated that sequences were of high quality with minimal adapters present and trimming was not required. Quality-trimmed reads were mapped to the latest Atlantic salmon RefSeq reference genome and annotation (ICSASG_v2. 6/10/2016). This genome was indexed using the latest version of HISAT2 (v2.1.0).
Statistical analyses
Differences in metabolites between treatment groups (pre-smolt 1C + v. pre-smolt Ctrl, and post-smolt 1C + v. post-smolt Ctrl) were determined by calculating the ratio of the group means from log10-transformed data for each of the metabolites (online Supplementary Table S4). Significantly different metabolites in each group comparison were determined using ANOVA with Tukey adjustment and false discovery rate by Benjamini and Hochberg multiple comparison adjustment(Reference Benjamini and Hochberg38). The enrichment for significant altered metabolites (false discovery rate < 0·1) in a metabolite class shows the largest differences in the metabolic profiles using enrichment scores (online Supplementary Table S5). One score corresponds to the ratio between the odds of the number of altered metabolites among the number of detected metabolites in one class and the odds of all altered metabolites among all detected in the whole screening. The significance of enrichment (adjusted P < 0·05) was assessed by Fisher’s exact test with Benjamini and Hochberg multiple comparison correction(Reference Benjamini and Hochberg38) using the functions fisher.test and p.adjust in R, respectively.
Statistically significant changes in SAM and SAH levels comparing the 1C+ with the Ctrl group were assessed by an unpaired t test (two-tailed) with P < 0·05. F test and Shapiro–Wilk test were applied to test variance and normality of the data.
For RNA-seq analysis, differential gene expression analysis was determined using the R package DESeq2 with default parameters (version 1.24.0) that estimates variance-mean dependence in count data from high-throughput sequencing assays and tests for differential expression based on a model using the negative binomial distribution(Reference Love, Huber and Anders39). Two differential expression comparisons were made: (1) pre-smolt 1C + v. pre-smolt Ctrl and (2) post-smolt 1C + v. post-smolt Ctrl. Statistical significance of over-representation of differentially expressed genes (DEG, |log2FC| >1 and adjusted P < 0·05) in KEGG pathways and gene ontology terms was determined using a hypergeometric distribution test (over-representation analysis (ORA)) using the package clusterProfiler(Reference Yu, Wang and Han40). Since ORA is ratio based, many genes can be annotated to multiple pathways and these tests can also lead to false positives when species and pathways are poorly annotated. Gene Set Enrichment Analysis relies on the whole set of genes detected, allows the detection of smaller differences and being able to indicate either up- or down-regulation for pathways instead of selecting DEG based on fold change thresholds for defining differences as in case of ORA(Reference Saito, Whatmore and Taylor10,Reference Subramanian, Tamayo and Mootha41) . Both ORA and Gene Set Enrichment Analysis were performed to examine enrichment in KEGG pathways.
No data points or samples were excluded in the analysis of metabolites, SAM and SAH, or RNA-seq.
Analysis and bioinformatics environment
For metabolomics and SAM/SAH analyses, the statistical software R (version 3.4.4) and GraphPad Prism 8·3·0 (GraphPad Software) were used. RNA-seq analysis was completed using Linux tools (online Supplementary File S1) and bioconductor packages for downstream analysis using the R programming language version 3.6.1 (2019–07–05, https://www.r-project.org/).
Data availability
Unaligned RNA-seq raw data are accessible through accession number PRJNA680206 (https://www.ncbi.nlm.nih.gov/sra/). Supplementary tables have been made available on figshare (https://doi.org/10.6084/m9.figshare.14484489.v1).
Results
Metabolic and transcriptomic changes in pre-smolt and post-smolt muscles
Metabolic profiles from both Ctrl and 1C+ muscle were analysed using a mass spectrometric-based metabolomic approach, where in total 536 free, non-covalently bound metabolites were detected (online Supplementary Table S4). The most significantly different metabolites were found in post-smolt (thirty-seven metabolites) than in pre-smolt (thirteen metabolites) muscle when comparing 1C+ and Ctrl groups (Fig. 2(a)). However, for both pre- and post-smolts, the differences between the dietary groups were found in the free amino acid profile and their conjugates, and again the results show that this effect was less pronounced in pre-smolt than in post-smolt muscle (Fig. 2(b) and online Supplementary Table S5).
Feeding a 1C nutrient surplus to Atlantic salmon during the smoltification period changed metabolic and transcriptomic profiles in muscle from both pre- and post-smolts. (a) Volcano plots showing metabolomic data from pre-smolt and post-smolt muscle. Differences in metabolites (dots) between the 1C+ and Ctrl group were plotted as log2-transformed ratios of group means on the x-axis. Statistically different log2-ratios (FDR < 0·1, dashed line crossing the y-axis) were highlighted in shades of blue. In total, 13 and 37 out of 536 detected metabolites were different between 1C+ and Ctrl profiles at pre- and post-smolt, respectively. Metabolites with negative log2-ratios indicate lower levels (light blue) in the 1C+ compared with the Ctrl group, and vice versa for positive log2-ratios (dark blue). Metabolites with either high positive or negative log2-ratios display large magnitude differences between the groups. Metabolites-of-interest were labelled with their names (online Supplementary Table S4). (b) Metabolite class enrichment analysis shows that the largest differences between 1C+ and Ctrl muscle were in the amino acids and their conjugates, which were particularly pronounced in post-smolt muscle. Calculated enrichment scores (x-axis) underlie a ratio of significant altered metabolites (FDR < 0·1) among detected ones in a metabolite class in relation to all significant altered metabolites among all detected ones in the global metabolic profiling. Significance of enrichment was assessed using Fisher’s exact test with Benjamini and Hochberg correction(Reference Benjamini and Hochberg38) and adjusted P-values given for each bar. Bold compound classes designate significant enrichment (adjusted P-value < 0·05). (c) The total number of differentially expressed genes (DEG, RNA-seq) was higher in post-smolt (902) than in pre-smolt muscle (95) when using false-discovery adjusted P-value < 0·05 and |log2-fold change| 1 as significance cut-offs. Numbers within bars represent DEG with either higher (upregulated) or lower mRNA levels (down-regulated) in 1C+ muscle compared with Ctrl muscle. (a) ![]() , significantly higher metabolite level;
, significantly higher metabolite level; ![]() , significantly lower metabolite level;
, significantly lower metabolite level; ![]() , not significantly different; (c)
, not significantly different; (c) ![]() , +log2FC;
, +log2FC; ![]() , –log2FC.
, –log2FC.

For RNA-seq analysis, on average 94·2 % of 24·6 million reads were mapped to the reference genome (online Supplementary Table S6). Samples were controlled for outliers and mRNA libraries showed no batch effects by sex, flow cell or tanks (online Supplementary Fig. S2). Gene expression profiles clustered by dietary treatment and particularly by life-stage of Atlantic salmon (online Supplementary Fig. S3). Hierarchical clustering of the samples shows a clear separation between the 1C+ and Ctrl group at post-smolt (online Supplementary Fig. S3). More DEG between dietary groups were found in post-smolt (902 DEG) than in pre-smolt muscle (ninety-five DEG, Fig. 2(c)). The majority of the DEG show lower mRNA levels in 1C+ than in Ctrl for both pre- and post-smolt muscle (Fig. 2(c)). The annotated lists of DEG are given in online Supplementary Table S7 and volcano plots in online Supplementary Fig. S4 to visualise differential expression in pre- and post-smolt muscle.
Metabolic characteristics of muscle from pre-smolt and post-smolt salmon
The amino acids lysine, histidine and proline were the metabolites showing the biggest differences (highest pool-normalised ratio), whereas alanine, proline and arginine were the most significant metabolites (lowest adjusted P-value) between the dietary groups (Fig. 2(a) and 3, online Supplementary Table S4). Fourteen out of in total nineteen detected amino acids, including the N-metabolite taurine, showed lower levels in 1C+ compared with Ctrl post-smolt muscle (Fig. 3). Lysine, histidine, alanine, proline, leucine, isoleucine, phenylalanine, tryptophan, serine, glycine, glutamine, arginine, valine and glutamate had significantly lower levels, while methionine had significantly higher levels in post-smolt muscle (Fig. 3 and online Supplementary Table S4).
Relative amino acid levels in muscle from 1C+ and Ctrl fed salmon after smoltification (post-smolt). The heatmap illustrates individual sample levels of single amino acids and the N-metabolite taurine that were detected in the global metabolic profiling. Cysteine and asparagine were not detected. Each cell illustrates the level of a single amino acid (rows) in each sample (columns) from each dietary group expressed as pool-normalised ratios in a colour scale. Asterisks (*) show significantly different amino acid levels between 1C+ and Ctrl muscle (FDR < 0·1). Amino acids were sorted after the effect size (magnitude of log2ratio) between group means in the descending order. All metabolic data are provided in Supplementary Table S4.

Lysine, generally present in high proportions in fish muscle, is involved in growth and cross-linking of proteins such as collagen. Another major component of collagen is trans-4-hydroxyproline, which was here elevated in 1C+ (Fig. 2(a)). Post-translational acetylation of lysine or lysine residues of histones and non-histone proteins forms derivatives like ϵ-acetyllysine, which was decreased in 1C+. 1C+ comprised lower nicotinamide levels, which is an important epigenetic mediator of deacetylases and part of NAD+ functioning in oxidation–reduction reactions of intermediary metabolism. 1C+ showed higher levels of β-alanine and the histidine conjugate 1-methylhistidine, which are together constituents of anserine important for muscle homoeostasis, pH buffering and antioxidant capacity. The amine oxide trimethylamine N-oxide, in short TMAO, was elevated in 1C+. Trimethylamine N-oxide is biosynthesised from choline and phosphatidylcholine and known to protect against the adverse effects of temperature, salinity, high urea and hydrostatic pressure. Choline was not different, but 1C+ exhibited higher levels of choline phosphate (other name for phosphocholine), which is an intermediate in the synthesis of phosphatidylcholine. Phosphatidylcholine C32:3 was significantly lower in 1C+. SAM acts as a methyl donor in the synthesis of phosphatidylcholine from phosphatidylethanolamine. Levels of phosphatidyl-myo-inositols and maltotriose were lower in 1C+ than in Ctrl muscle.
1C+ muscle revealed lower levels of arginine, ornithine and putrescine, which is the direct precursor for polyamines (Fig. 2(a)). Polyamine synthesis is dependent on the availability of SAM, which was not detected in the metabolic profiling, but additional analysis of SAM revealed increased levels in 1C+ in post-smolt muscle (Fig. 4). SAH, synthesised upon donation of a methyl group from SAM, was not different between the dietary groups (online Supplementary Table S4 and Fig. 4). The ratio of SAM to SAH was higher in 1C+ than in Ctrl. SAM synthesis depends on methionine, in which levels follow the dietary treatment with higher amounts in 1C+ than Ctrl (Fig. 2(a)). Methionine can get irreversible metabolised through transsulphuration into cysteine, taurine and the antioxidant GSH, which was significantly increased in 1C+ (Fig. 2(a)).
S-adenosylmethionine (SAM) and S-adenosylhomocysteine (SAH) levels comparing 1C+ and Ctrl in pre- and post-smolt salmon muscle assessed by HPLC. The ratio of SAM to SAH is given as a measure to study methylation capacity in the muscle. Statistical significance was assessed using a two-tailed t test with P < 0·05. P-values of significant differences were indicated above dark grey coloured bars. Non-significant differences were kept light grey.

Pre-smolt muscle shares most of their changed metabolites with those that were different in post-smolt muscle (Fig. 2(a)). Common metabolites show the same direction of change between 1C+ and Ctrl muscle. Methionine, trimethylamine N-oxide and trans-4-hydroxyproline levels were increased, whereas levels of alanine, serine, putrescine, proline, histidine, lysine and ϵ-acetyllysine were decreased in 1C+ compared with the Ctrl (Fig. 2(a)). Betaine, an osmolyte and methyl group donor in the re-methylation of homocysteine to methionine, was decreased in pre-smolt 1C+ but not in post-smolt (Fig. 2(a) and online Supplementary Table S4).
Common differentially expressed genes between pre-smolt and post-smolt muscle
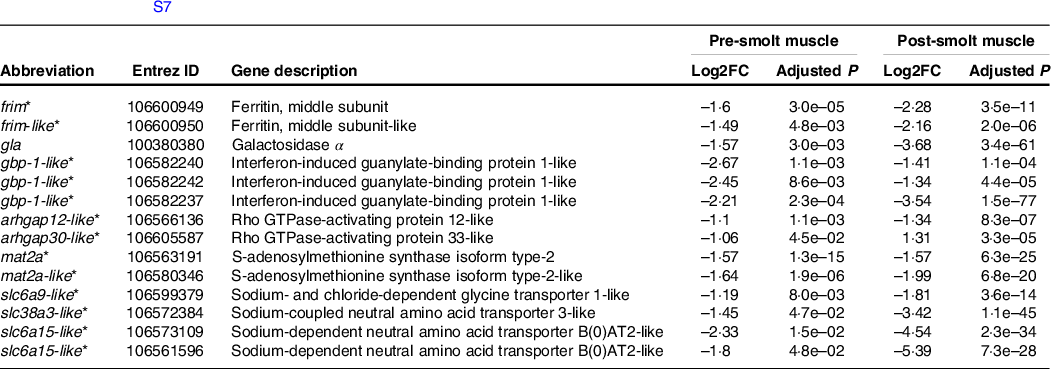
Twenty-five DEG were shared between pre- and post-smolt muscle differences (online Supplementary Table S7). Among them (Table 2), decreased mRNA levels in 1C+ muscle were found for two S-adenosylmethionine synthase paralogous genes (mat2a, mat2a-like), two genes encoding ferritin subunit paralogs (frim, frim-like) and four Na-coupled amino acid transporter paralogs (slc6a9-like, slc38a3-like, slc6a15-like, slc6a15-like). The gene encoding galactosidase α (gla), which is active in lysosomes and catalyses the removal of terminal α-galactose groups from glycoproteins and glycolipids, was expressed at significantly lower levels in 1C+ muscle from both pre- and post-smolts. Three paralogs of the interferon-induced guanylate-binding protein 1 (gbp-1-like) involved in endosomal trafficking, cytoskeleton regulation and autophagy were expressed at lower levels in 1C+. Two overlapping DEG encode Rho family GTPase-activating proteins (arhgap12-like, arhgap30-like) that function in a variety of cytoskeleton-dependent cell functions.
Selected genes differentially expressed with diet in both pre-smolt and post-smolt muscle. List of all overlapping genes is provided in online Supplementary Table S7. Log2FC, log2-fold change. Adjusted P, adjusted P-value (output of DESeq2)

* Genes that received a human orthologue name when an official gene symbol was not available for the Atlantic salmon reference genome.
Lower expressed genes linked to mRNA translation and amino acid metabolisation in 1C+ muscles from post-smolts
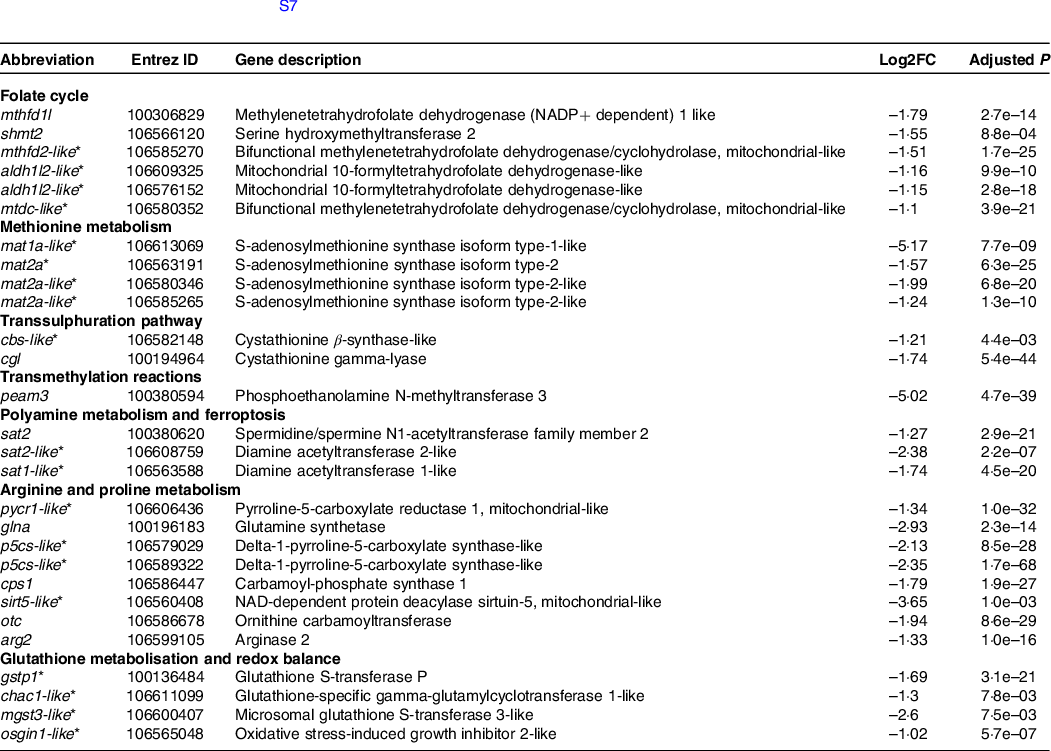
DEG between 1C+ and Ctrl (online Supplementary Table S7) have been associated with biological processes and molecular functions by ORA. ORA results from pre- and post-smolt muscles are listed separately in Supplementary Table S8 and S9, respectively. For post-smolt enrichment, solely down-regulated genes encoding amino acid-specific tRNA synthetases and ligases central in translation for protein synthesis account for the most enriched KEGG pathway, aminoacyl-tRNA biosynthesis (Fig. 5) and a few enriched gene ontology term categories listed in online Supplementary Table S9. Figure 5 shows also DEG enrichment in the KEGG pathway biosynthesis of amino acids entirely by lower expressed genes encoding a diverse group of enzymes driving amino acid metabolisation (Fig. 5, online Supplementary Table S9). Among them were genes like glna, cgl, shmt2, cbs-like, mat1a-like, mat2a-like, pycr1-like, p5cs-like, cps1, otc and arg2, which were listed in Table 3 and categorised after their functional roles or pathway affiliation. Concordant results were found with Gene Set Enrichment Analysis (online Supplementary Fig. S5) revealing aminoacyl-tRNA biosynthesis and biosynthesis of amino acids as the most down-regulated KEGG pathways in the post-smolt gene expression profiles.
Over-representation of differentially expressed genes (DEG) in KEGG pathways and cellular components (CC) between 1C+ and Ctrl muscle after smoltification. Over-representation analysis (ORA) was performed to show functional enrichment of DEG. Bars illustrate the DEG number in a category. Shades of blue highlight DEG either with positive (+log2FC) or negative log2-fold changes (-log2FC). DEG with -log2FC show lower mRNA levels in 1C+ than in Ctrl muscle. Adjusted P-values for each enrichment were associated with each category (bars). ORA is based on DEG with a |log2-fold change| > 1 and adjusted P-value < 0·05 when comparing gene expression of 1C+ and Ctrl muscle. ![]() , +log2FC;
, +log2FC; ![]() , –log2FC.
, –log2FC.

Selected differentially expressed genes (DEG) between 1C+ and Ctrl post-smolt muscle categorised after their functional roles or pathway affiliation. Online supplementary Table S7 provides the full list of DEG between diet groups in post-smolts. Log2FC, log2-fold change. Adjusted P, adjusted P-value (output of DESeq2)

* Genes that received a human orthologue name when an official gene symbol was not available for the Atlantic salmon reference genome.
Folate cycle key genes are expressed at lower levels in 1C+ muscle from post-smolts
Genes encoding mitochondrial homologs of folate cycle enzymes enriched the KEGG pathway one carbon pool by folate (Fig. 5, online Supplementary Table S9). Compared with the Ctrl, 1C+ muscle showed lower expression of shmt2, mthfd1l, mthfd2-like, aldh1l2-like and mtdc-like (Table 3).
1C+ muscle from post-smolts reveals lower gene expression in transmethylation and transsulphuration reactions
Transmethylation reactions depend on the availability of SAM. peam3 (Table 3), encoding a N-methyltransferase that methylates phosphoethanolamine to phosphocholine using SAM as substrate, was among the top DEG with the largest fold change showing lower mRNA levels in 1C+ muscle. Table 3 also lists the transsulphuration pathway and vitamin B6-dependent genes cgl and cbs-like that were lower expressed in 1C+. The transsulphuration pathway removes undesirable amounts of homocysteine through cystathionine and cysteine.
1C+ muscle from post-smolts shows lower expression of genes linked to polyamine homoeostasis regulation
Polyamine homoeostasis is maintained by the spermidine/spermine N1-acetyltransferase family member 1 and 2, also known as diamine acetyltransferases 1 and 2. sat2, sat2-like and its paralog sat1-like (Table 3) were lower expressed in 1C+ than in the Ctrl muscle.
Ferroptosis and glutathione metabolising genes are expressed at lower levels in post-smolt 1C+ muscle
The ferroptosis KEGG pathway was enriched by solely lower expressed genes in both pre-smolt and post-smolt muscle comparisons (Fig. 5, online Supplementary Table S8). Decreased expression in 1C+ was found for ferritin middle subunit paralogs (frim, frim-like), ferritin heavy polypeptide 1–1 (frih), sat2, sat2-like, sat1-like and slc40a1 (online Supplementary Table S9). One regulatory pathway of ferroptosis is the metabolism of GSH. 1C+ showed decreased expression of the GSH regulating and conjugating enzymes encoded by gstp1, chac1-like, mgst3-like and osgin1-like (Table 3).
Differential expression of myofibrillar proteins and genes regulating cytoskeletal organisation in post-smolt muscle
Actin cytoskeleton, striated muscle thin filament and the troponin complex were among the DEG-enriched cellular component ontology terms (Fig. 5). Several genes encoding various proteins building the actin cytoskeleton such as myosin and troponins I and T were differentially expressed between 1C+ and Ctrl muscle (online Supplementary Table S9). Transgelin-3 is an actin-binding protein of the cytoskeleton, and differences in tagln-3-like expression showed the highest fold change in the post-smolt data, where it was expressed in Ctrl, but not expressed in 1C+ muscle (Fig. 6(a)). Contrarily, 1C+ muscle revealed an increased expression of myoz2 encoding an α-actinin- and γ-filamin-binding Z line protein involved in myofibrillogenesis. Fibrillar proteins and extracellular matrix regulating proteins involved in homoeostasis and organisation of the sarcomeric cytoskeleton were more highly expressed in 1C+ than in Ctrl muscle. Among them, there were DEG encoding various collagen α paralogs, collagenase 3 and cathepsin S (Fig. 6(a) and online Supplementary Table S7). A few other DEG encoding muscular cytoskeleton assembly proteins such as integrin α and β subunits (itgae, itb2, LOC106586548, LOC106602819) and tubulin α chain-like (LOC106565439) showed increased expression in 1C+ (online Supplementary Table S7).
mRNA expression of selected differentially expressed genes (DEG) that encode myofibrillar proteins and proteins regulating cytoskeletal organisation (a), and genes associated with growth and myogenesis regulating factors (b) between 1C+ and Ctrl muscle from post-smolts. Bar graphs show the group mean (n 9) of normalised mRNA read counts detected by RNA-seq. (a) tagln3-like: transgelin-3-like, myoz2: myozenin 2, mmp13: collagenase 3, cats: cathepsin S; (b) igfbp-1a1: insulin-like growth factor binding protein 1 paralog A1, egr1: early growth response 1, mrf4: myogenic regulatory factor 4, mef2b-like: myocyte-specific enhancer factor 2B-like. Log2FC: log2-fold change; padj: adjusted P-value (DESeq2 output).

Differential expression of factors mediating growth and myogenesis in post-smolt muscle
Expression of igfbp-1a1 encoding a protein that inhibits or potentiates IGF-1 growth promoting functions was decreased in 1C+ muscle (Fig. 6(b)). The early growth response 1 encoding gene (egr1) encodes a transcription factor that can be induced by growth factors in the IGF-1 cascade and that acts in a wide range of growth and cell differentiation-related processes. egr1 showed decreased expression in 1C+ muscle. Maintenance of muscle fibre differentiation is regulated by myogenic regulatory factor 4 encoded by mrf4 that was lower expressed in 1C+ (Fig. 6(b)). Lower expression was also found for mef2b-like that encodes a paralog of myocyte-specific enhancer factor 2B, a transcriptional activator of growth-related genes (Fig. 6(b)).
Discussion
A moderate surplus of dietary methionine, folic acid, vitamin B6 and B12 above the current requirements and recommended levels for Atlantic salmon given with the Med-1C feed improved growth, that is, increased body weight in the on-growing saltwater period as recently described by Espe et al. (Reference Espe, Vikesa and Thomsen7). We aimed to understand how salmon fed the Med-1C feed, which is identical to the 1C+ feed in the present study improved growth during the on-growing saltwater period(Reference Espe, Vikesa and Thomsen7). We investigated metabolic and molecular signatures of muscle from the same fish as in the previous study(Reference Espe, Vikesa and Thomsen7) from the Ctrl (Low-1C) and 1C+ (Med-1C) group before and after smoltification to acquire deeper insight in metabolic properties, pathways and possible nutrient–gene interactions involved in the observed difference in growth.
We found a higher number of different metabolites and DEG in muscle of salmon from the on-growing saltwater period (post-smolt) than in the fresh water period (pre-smolt). That is in line with the phenotype earlier described for the same experimental fish between the two dietary groups after smoltification(Reference Espe, Vikesa and Thomsen7). Espe et al. reported higher protein accretion (deposition of muscle protein) and higher retention of indispensable amino acids in post-smolts compared with pre-smolts(Reference Espe, Vikesa and Thomsen7). Moreover, the retention of methionine was higher when dietary inclusion was lowest while none of the other indispensable amino acid levels differed between the two feeds(Reference Espe, Vikesa and Thomsen7). Results from the present study were in line with Espe et al. showing lower methionine levels in Ctrl muscle when dietary inclusion was lower. Free amino acids in Ctrl muscle from the present study were increased, which confirms the results from Espe et al. showing that utilisation or deposition of amino acids was lower when the Ctrl diet was fed to salmon. This points to free amino acids accumulation as an indicator of a reduced growth capacity in both salmon and zebrafish(Reference Espe, Vikesa and Thomsen7,Reference Skjaerven, Jakt and Dahl16,Reference Skjærven, Oveland and Mommens42) . Conformably, increased mRNA expression of genes involved in translation and amino acid metabolisation suggests a readiness for translation with a following mobilisation of amino acids for protein synthesis in Ctrl muscle. Amino acids have the ability to influence gene expression through modulating the initiation phase of mRNA translation, but the likelihood that an aminoacyl-tRNA synthetase acts in translation for protein synthesis may also depend on other transcription factors that can explain the reduced growth capacity in the Ctrl group(Reference Guo and Schimmel43,Reference Kimball and Jefferson44) .
Since the demand of methionine is shared between protein synthesis and transmethylation reactions, efficient metabolisation of methionine requires both dietary methionine and B vitamin supply in the 1C metabolism, and the endogenous supply of betaine from choline. For 1C+ muscle, the demand of methionine for protein growth was most likely met through dietary and endogenous supply of methionine and the B vitamins. Contrarily, Ctrl muscle showed increased expression of key genes in the mitochondrial folate cycle to meet the demand for methionine in protein synthesis and other reactions. Espe et al. reported lower cystathionine levels in Ctrl muscle, which indicates that the dietary levels of B vitamins were not sufficient(Reference Espe, Vikesa and Thomsen7). When methionine gets less incorporated into protein, it will be metabolised through SAM to a variety of other metabolites. In the present study, 1C+ muscle showed increased levels of both SAM, the mediator of transmethylation reactions and GSH synthetised through the transsulphuration pathway. Ctrl muscle revealed increased expression of S-adenosylmethionine synthase isoforms and vitamin B6-dependent enzymes suggesting stronger regulation of methionine metabolisation, transsulphuration and folate cycle in the 1C metabolism. Further, peam3 expression was increased suggesting increased synthesis of phosphatidylcholine from phosphoethanolamine; however, we found only one phosphatidylcholine (C32:3) significantly increased in the Ctrl group. Except for increased phosphatidylcholine and decreased choline-phosphate levels in Ctrl muscle, we hardly found an effect on lipid or fatty acid composition in muscle that is in line with the previous results from the same experimental fish(Reference Espe, Vikesa and Thomsen7). Overall, metabolic and RNA-seq results from muscle in this study show that the demand for dietary folic acid and methionine seems larger in Ctrl fed salmon to counterbalance the need for protein synthesis and growth-related investments, which was more pronounced in the saltwater period. However, we cannot be certain whether the amounts of all 1C nutrients together or solely one of them were the main driving factors that improved growth when fed the 1C+ feed consisting of a combined surplus package of methionine, folic acid, vitamin B6 and B12.
Skeletal muscle growth in fish is plastic and involves the enlargement of already existing muscle fibres (hypertrophy) and the recruitment of new fibres (hyperplasia). The balance between both is dependent on genetic differences and extrinsic factors such as early nutritional history(Reference Bjornevik, Beattie and Hansen31,Reference Morkore, Ruohonen and Kiessling45) . It has been suggested that increased muscle hypertrophic growth in salmon is also associated with the stimulation of protein synthesis by diet balanced in micronutrients, particularly in B vitamins(Reference Hamre, Bjornevik and Espe5). In general, fish growth and muscle maturation are centrally regulated through GH acting on receptors on the sarcolemma that indirectly initiates IGFBP production by IGF from the liver and by myogenic regulatory factors, respectively(Reference Johnston, Bower and Macqueen20,Reference Fuentes, Valdes and Molina21,Reference Perez-Sanchez, Simo-Mirabet and Naya-Catala26) . We found significantly higher mRNA expression of genes encoding factors involved in growth and transcription, which suggests stronger stimulation of myogenesis and growth in the Ctrl than in the 1C+ group. Other genes that encode GHR1 and GHR2 precursors, IGF-1 and a few more IGFBP had higher mRNA levels in Ctrl muscle but were either below the chosen threshold |log2FC| < 1 or were not significant differentially expressed. Espe et al. reported from targeted RT-qPCR analysis in muscle that ghr was significantly increased, whereas igf-1 and its receptor were not different but showed the same trend with higher expression in Ctrl muscle(Reference Espe, Vikesa and Thomsen7). Mechanisms explaining the increased expression of growth-stimulating factors in Ctrl muscle and the lower growth reported for this group are indicative of compensatory growth regulation at local tissue level. A compensatory regulation of systemic and local components of the GH/IGF axis has been shown for gilthead sea bream (Sparus aurata) fed diets highly replaced marine ingredients by alternative raw materials(Reference Benedito-Palos, Saera-Vila and Calduch-Giner46). The ability of increased free amino acids in muscle to stimulate translation and protein accretion on the one hand, and a likely higher methionine, SAM, GSH and B vitamin demand on the other hand, may account as factors for the reduced growth capacity in the Ctrl group(Reference Kimball and Jefferson44).
Muscle tissue consists of muscle fibres and myofibrils with a complex and highly organised network, the sarcomeric cytoskeleton that interlinks filaments with contractile, structural and regulatory proteins(Reference Johnston, Bower and Macqueen20). RNA-seq analysis revealed differences in expression of genes encoding a wide range of actin-binding and structural proteins such as troponin and myosin, but also proteins regulating cytoskeletal re-organisation. Interestingly, in case of transgelin-3, which is involved in membrane trafficking and actin-binding, we could not detect any mRNAs in 1C+, but its transcripts were present in Ctrl muscle. Tissue remodelling involves both protein synthesis and degradation through proteolytic activity that are central to nutrient supply adaptation and homoeostasis of a tissue(Reference Johnston, Bower and Macqueen20,Reference Lavajoo, Perello-Amoros and Velez47) . Here, we found increased expression of collagenase 3 and cathepsin S in 1C+ muscle that suggest increased proteolysis capacity thus tissue remodelling. The expression of proteolytic enzymes has also been associated with quality measures such as high firmness of salmon filet(Reference Larsson, Morkore and Kolstad48). Overall, RNA-seq results from 1C+ post-smolts imply increased muscle tissue remodelling, but less stimulation of differentiation and growth in muscle. However, analysis of muscle cellularity is needed to provide more details on structural changes and possible quality measures of salmon muscle.
Ctrl muscle from the present study showed increased levels of the polyamine precursor putrescine and increased expression of ferritin subunits and enzymes regulating polyamine levels. Activation of sat1 has been linked to lipid peroxidation and ferroptosis stimulation upon reactive oxygen species (ROS) formation in cell culture(Reference Ou, Wang and Li49). The metabolism of amino acids is tightly linked to the regulation of ferroptosis, which is an iron-dependent form of cell death(Reference Dixon and Stockwell50,Reference Stockwell, Angeli and Bayir51) . Ferroptosis is characterised by the accumulation of intracellular lipid ROS(Reference Stockwell, Angeli and Bayir51) upon intracellular iron accumulation. Under oxidative stress conditions, methionine can be converted through the transsulphuration pathway to GSH that further exerts antioxidant effects(Reference Li, Cao and Yin52). Ferritin contributes to decrease in oxidative stress besides main functions in intracellular iron storage(Reference Dixon and Stockwell50,Reference Arosio, Ingrassia and Cavadini53,Reference Hou, Xie and Song54) . This might explain the increased mRNA levels of ferritin and the depletion of GSH that suggest higher GSH utilisation with increased oxidative load in the Ctrl muscle, possibly associated with increased polyamine metabolism(Reference Pegg13,Reference Ou, Wang and Li49,Reference Stockwell, Angeli and Bayir51,Reference Yu and Long55) . Polyamines, produced from putrescine and ornithine, regulate fundamental cellular processes such as cell growth and proliferation but can also affect redox balance as polyamine acetylation (degradation) can promote ROS affecting the oxidative load(Reference Murray Stewart, Dunston and Woster56). However, central enzymes in polyamine synthesis were not differentially expressed, whereas sat2 and sat1-like expression was increased, suggesting higher degradation to maintain polyamine homoeostasis thus affecting redox balance in Ctrl muscle(Reference Pegg13,Reference Murray Stewart, Dunston and Woster56) . Interestingly, Ctrl muscle showed decreased expression of glutathione S-transferase P that suggests GSH depletion through S-glutathionylation of functional and structural proteins to maintain cellular redox homoeostasis in response to ROS in the Ctrl group(Reference Li, Cao and Yin52,Reference Tew, Manevich and Grek57) .
Adequate amounts of micronutrients prior to biological transformations such as smoltification in salmonids can be a decisive factor for later growth. Feeding a 1C-nutrient surplus prior to smoltification affected growth of pre-smolts marginally but that of post-smolts significantly, which indicates metabolic, possibly epigenetic programming in muscle. Changes in methionine levels can directly impact methyl-donor availability with possible consequences for DNA and histone tail methylation(Reference Anderson, Sant and Dolinoy58–Reference Serefidou, Venkatasubramani and Imhof60). Differences we found in ϵ-acetyllysine amounts and sirt5-like mRNA expression in muscle point to effects on histone tail or non-histone protein acetylation, but also solely to non-enzymatic acetylation of free lysine(Reference Wagner and Hirschey61–Reference Ali, Conrad and Verdin63). One can speculate whether a dietary 1C-nutrient surplus as for the 1C+ feed can introduce life-long changes in epigenetic profiles that affect muscle gene expression and improve growth(Reference Sharples, Stewart and Seaborne64,Reference Marousez, Lesage and Eberle65) . Future studies should consider integration analysis of DNA methylation, histone methylation and acetylation marks to provide a deeper insight into nutrient-sensitive regulation of epigenetic mechanisms involved in growth, and whether post-smolt growth can be programmed prior to smoltification or during early development(Reference Clare, Brassington and Kwong12,Reference Choudhary, Kumar and Gnad66–Reference Robinson and Dilworth71) .
Conclusion
A dietary surplus of methionine, folate, vitamin B6 and B12 above current requirement and recommended levels throughout smoltification appears to be beneficial in protein accretion for improved growth in farmed Atlantic salmon. The results from this study support that the availability of methionine along with B vitamins is important to efficiently use amino acids for protein growth. The metabolic signatures point to improved growth and redox capacity through improved utilisation and metabolisation of amino acids in muscle of 1C+ fed salmon. We have also demonstrated that transcriptional changes in muscle in response to a dietary 1C-nutrient surplus relate to translation, mobilisation of amino acids, cytoskeletal organisation and growth. Understanding how growth is controlled by non-genetic mechanisms becomes important for a rapidly growing aquaculture industry whose concerns are to optimise production, sustainability and quality.
Acknowledgements
The authors thank the provision of the Atlantic salmon muscle through the project NutrEpi (NFR grant number 267787), and Tårn Helgøy Thomsen and staff at Skretting ARC (Stavanger, Norway) for performing the feeding trial and providing the feed. The authors are grateful to Jorge M.O. Fernandes’s laboratory at Nord University (Bodø, Norway), particularly Qirui Zhang and Martina E.L. Kopp for assisting the high-throughput sequencing. The authors thank Metanomics Health GmbH (Berlin, Germany) for MxP® Global Profiling. The authors also would thank Eva Mykkeltvedt at IMR for technical assistance in sampling. Graphical abstract was created with BioRender.com.
This work was supported by the Research Council of Norway through the grant 295118 and by the Institute of Marine Research (Bergen, Norway). The Research Council of Norway had no role in the design, analysis or writing of this article.
A. A., M. E. and K. H. S conceived and designed the research. V. V. provided the feed and performed the feeding trial. A. A. and J. M. O. F. prepared the libraries, and P. W. and T. S. performed bioinformatics analysis for the RNA-seq results. A. A., K. H. S., M. E. and T. S. analysed and interpreted data. A. A. drafted the manuscript. All authors read and approved the final manuscript.
The authors have no financial or personal conflicts of interest to declare.
Supplementary material
For supplementary materials referred to in this article, please visit https://doi.org/10.6084/m9.figshare.14484489.v1 and https://doi.org/10.1017/S0007114521002336


 Open access