


As countries develop, transformations take place in many aspects of society. ‘As incomes rise and populations become more urban, societies enter different stages of what has been called the nutrition transition. Generally, diets high in complex carbohydrates and fiber give way to more varied diets with a higher proportion of fats, saturated fats, and sugars’(Reference Drewnowski and Popkin1). During this nutrition transition, the prevalence of undernutrition remains stable or starts to decline, while the prevalence of overnutrition increases.
Much research has been conducted on the prevalence of undernutrition and its consequences in less developed countries, but nutritional problems in these countries have actually become more complicated, as the improvements made in reducing undernutrition have been accompanied by the even more rapidly increasing prevalence of overnutrition. Of thirty-six developing countries studied between 1992 and 2000, overweight prevalence for women actually exceeded underweight prevalence in more than half of these countries. Moreover, a high prevalence of overweight and a low prevalence of underweight was more common among countries with higher levels of urbanization and higher per capita gross national incomes, both proxies of greater economic development(Reference Mendez, Monteiro and Popkin2).
From population health and economic standpoints, the double burden of malnutrition, or the coexistence of under- and overnutrition at relatively high levels, is problematic. Consequences include increased health-care expenditures and adverse effects on mortality, morbidity and productivity(Reference Haddad, Cameron and Barnett3). Both ends of the nutritional spectrum are significant problems in many low- and middle-income countries(Reference Shrimpton and Rokx4). These opposing problems warrant further study, especially in conjunction with each other. Yet despite the opposing nature of these problems, there are some shared root causes(Reference Tanumihardjo, Anderson and Kaufer-Horwitz5), further emphasizing the importance of concurrently investigating these two issues.
Under- and overnutrition usually affect different segments of the population(Reference Subramanian, Perkins and Khan6). A natural question is whether the relationship of such characteristics with these nutritional extremes is consistent across countries. To efficiently allocate limited resources, it would be valuable to know which population segments within a country suffer from which nutritional extreme.
In developing countries, underweight and overweight prevalences have generally been problems of rural and urban areas, respectively. In Gambia, the prevalence of adult undernutrition was still higher than that of adult obesity. And while undernutrition seemed to affect all layers of society, overnutrition was ‘mainly confined to urban women 35 years or older’(Reference van der Sande, Ceesay and Milligan7). The increase in overweight prevalence in China was driven by urban dwellers, while the overall decline in underweight prevalence was not observed among male rural residents(Reference Popkin, Paeratakul and Ge8). Urban–rural differentials in BMI were not found in overweight and obesity prevalence in ten European countries(Reference Peytremann-Bridevaux, Faeh and Santos-Eggimann9), although interestingly, in the USA, adults living in rural areas were found to be more obese than their counterparts in urban areas(Reference Befort, Nazir and Perri10). If these countries are lined up by increasing level of development, overnutrition shifts from being a greater issue for urban dwellers to one for those in rural areas.
Such a shift has also been observed in the relationship between socio-economic status and the distribution of BMI categories as countries develop. It was shown from meta-analyses that the association between broadly defined socio-economic status and obesity was generally negative in developed societies, but positive in developing societies(Reference McLaren11–Reference Monteiro, Moura and Conde13). Neuman et al. observed in their study of women in thirty-seven low- and middle-income countries at the turn of the 21st century a consistently positive association between BMI and household wealth quintile(Reference Neuman, Finlay and Davey Smith14). However, as countries develop, obesity prevalence extends to other segments of the population and is no longer a problem reserved for people of high socio-economic status. In a study of women in fifty-four low- and middle-income countries, a pattern of decreasing overweight prevalence was generally observed among females as one went down the wealth quartiles. But in the richer of these fifty-four countries, women in the wealthiest quartile were actually less likely to be overweight than those in the second and third quartiles(Reference Subramanian, Perkins and Ozaltin15). These patterns perhaps point to higher income and greater access to unhealthy foods being counterbalanced with increased knowledge and better health care(Reference Caballero16). While educational attainment and income are positively correlated, it could be that more education prevents people from being at nutritional extreme due to knowledge on health and nutrition. Having a low level of education was positively associated with underweight in men, but not women, in Iran. In this same sample, overweight and obesity were more common among both men and women with low educational attainment(Reference Janghorbani, Amini and Willett17).
These studies documented shifts in patterns of nutritional status as countries developed. What mechanisms might there be for these shifts? As countries develop, occupations tend to shift from those requiring more energy expenditure to those that are less physically demanding. That, combined with more leisure activities at home and perhaps fewer opportunities for exercise in urban areas, leads to more sedentary lifestyles(Reference Goryakin and Suhrcke18). In addition, globalization of low- and middle-income countries has led to the diffusion of nutritional habits from higher-income countries. Food consumption patterns have shown signs of convergence towards a more Western diet, higher in energy, fats, refined carbohydrates and processed foods(Reference Goryakin and Suhrcke18, Reference Popkin, Adair and Ng19). Increased demand for these foods also gives rise to the spread of global supermarket chains and fast-food restaurants, further perpetuating the problem(Reference Pingali20).
The interrelationship between under- and overnutrition demonstrates why it is necessary to simultaneously study these two nutritional extremes, and this was what many previous studies failed to take into account. For each country, which population segments are important to target for each of the two nutritional extremes? It is necessary to explore multiple characteristics that could be related to changes in the distribution of BMI categories with increasing development. In particular, changes in urbanicity and socio-economic status, both of which have been linked to economic development, have been cited as drivers of the nutrition transition.
It is certainly important to look at the stratification of BMI categories within each country to determine where efforts need to be directed. However, previous literature also highlighted the importance of studying multiple countries together. The strong connection between development and the nutrition transition puts forward a reasonable hypothesis, that there is a continuum in the relationship between under-/overnutrition and development-related characteristics. Studying countries together might help to isolate the points of development associated with trend reversals when shifts in priorities might be appropriate.
The present study used the WHO Study on global AGEing and adult health (SAGE) to examine nutritional disparities among older adults, both females and males, in six different countries: China, Ghana, India, Mexico, Russia and South Africa. These six countries vary drastically in terms of geography, history and culture, and should give insight as to how similar or different the patterns of nutritional problems were across countries. Patterns of nutritional status, as measured by BMI category, were analysed within countries along various dimensions of development. How these associations varied with a country’s level of development was then explored. Both these within- and across-country differences are important for aid allocations and interventions.
Data and methods
For the present analyses, the first wave of SAGE implemented between 2007 and 2010 was used. SAGE is an ongoing longitudinal study of health and well-being in China, Ghana, India, Mexico, Russia and South Africa that focuses mostly on people aged 50 years or over(21). In the current paper, the objective was to explore the relationship of categorical BMI, calculated using measured height and weight, with various development-related (place of residence, educational attainment and wealth) and demographic (sex and age) factors among older adults in these six countries.
The dependent variable in these analyses was BMI category. There was a clear ordering of BMI categorization. Underweight was defined as BMI < 18·5 kg/m2, normal as 18·5 kg/m2 ≤ BMI < 25 kg/m2, pre-obese as 25 kg/m2 ≤ BMI < 30 kg/m2 and obese as BMI ≥ 30 kg/m2(22). While a conventional ordinal logistic model would take such ordering into account and simplify the analysis and its resulting interpretation, the proportional odds assumption underlying such model was tested and generally rejected. On the other hand, a multinomial logistic regression model would sacrifice parsimony and interpretability. A partial proportional odds model for an ordinal dependent variable would provide an alternative that falls in between, by relaxing the proportional odds assumption for certain variables while being more parsimonious and interpretable than a multinomial logistic regression model(Reference Williams23). As a result, a partial proportional odds model for each of the six countries was run to quantify the relationship between BMI category and various social, economic and demographic characteristics.
Respondents in the SAGE surveys were asked about asset ownership. An asset index was created that linearly combined the binary variables of having electricity, bicycle, car, mobile phone, computer, television, land and jewellery, using principal components analysis(Reference Vyas and Kumaranayake24). For each of the six countries, the first principal component already explained about 95 % of the variance among observations, so only this first component was used. This way, an index representing wealth was constructed without unnecessarily increasing the dimension of the problem. Figure 1 illustrates the weights assigned to the assets, providing information on their relative importance. All assets contributed positively to the wealth index, but their weights varied. Generally, electricity, mobile phone and television had the greatest weights in the wealth index. In Ghana and India, land also had a sizeable contribution.
Weights assigned to assets (![]() , electricity;
, electricity; ![]() , bicycle;
, bicycle; ![]() , car;
, car; ![]() , mobile phone;
, mobile phone; ![]() , computer;
, computer; ![]() , television;
, television; ![]() , land;
, land; ![]() , jewellery) in principal components analysis
, jewellery) in principal components analysis

One of the issues with using principal components analysis is interpretability, as a unit in the wealth index does not translate into the ownership of a certain asset. Even if such an index were interpretable, an absolute measure is not ideal as different countries have different standards of living. Thus, instead of treating the wealth index as a continuous variable, it was converted into a categorical variable of wealth quartiles, with the first and fourth quartiles representing the poorest and the richest, respectively.
All the independent variables used in the analyses were categorical, except for age. The reference groups were male for sex, urban for place of residence, less than high school for educational attainment and the first quartile for wealth. The study sample was restricted to those at least 50 years of age to focus on the experiences of older adults. Due to the age of survey participants in these analyses, pregnancy was unlikely to be an issue. Observations with missing data were excluded by listwise deletion and the resulting sample sizes for China, Ghana, India, Mexico, Russia and South Africa were 8892, 1842, 3106, 1557, 3372 and 2240, respectively.
While the longitudinal aspect of the SAGE survey was not used, as the second wave has not yet been released for all countries, there was still something to be said about development and the nutrition transition. The six countries in the present study were at different stages of development. By suitably ordering these countries, it would be possible to overlay the process of development with the nutrition transition. To this end, national gross domestic product (at purchasing power parity) per capita (GDPpC) in the year 2010, measured in current international dollars, was selected as the measure of development. According to GDPpC in 2010, the ordering of these six countries from least to most developed was Ghana (2998), India (4316), China (9333), South Africa (11 647), Mexico (14 765) and Russia (20 498)(25). If development was indeed an important player in the landscape of BMI categories, the coefficients across countries for a specific variable should reflect the GDPpC rankings of these countries.
To test the hypothesis that differences between countries were associated with level of development, data from all six countries were combined, and the same independent variables, along with the natural logarithm of GDPpC and its interactions with the development-related covariates, were used. These additional variables would help determine whether BMI category was associated not only with an individual’s characteristics, but also with the level of development of this individual’s country.
Partial proportional odds models were run in Stata using the gologit2 package(Reference Williams23) and all other analyses were run in R version 3.5.1 (2018). When discussing the results, the term ‘significant’ means significant at the level of 5 %.
Results
Distribution of BMI categories
Figure 2 shows the proportion of people in each BMI category (underweight, normal, pre-obese and obese), along with the sample sizes for the six SAGE countries, arranged in ascending order of GDPpC.
Distribution of BMI categories (![]() , underweight;
, underweight; ![]() , normal;
, normal; ![]() , pre-obese;
, pre-obese; ![]() , obese) for the six countries. Data on older adults aged 50 years or over from the first wave of the WHO Study on global AGEing and adult health (SAGE) implemented between 2007 and 2010
, obese) for the six countries. Data on older adults aged 50 years or over from the first wave of the WHO Study on global AGEing and adult health (SAGE) implemented between 2007 and 2010
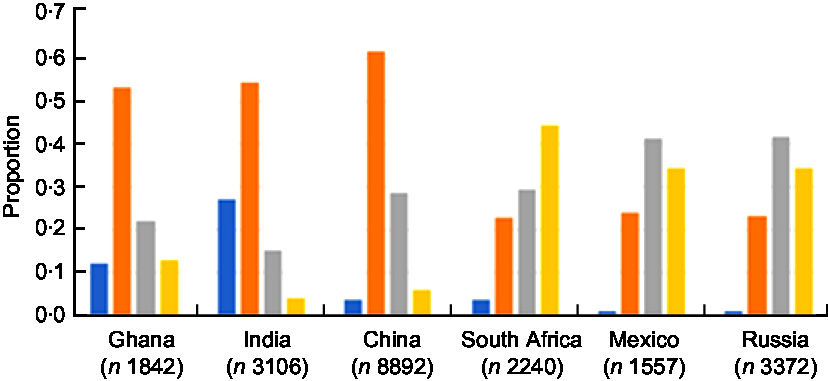
In Ghana, India and China, more than half of the samples were in the normal category. In Ghana and China, pre-obese was the next largest group, followed by obese and underweight. In India, underweight was the second largest group, followed by pre-obese and obese. Of the six countries, India had the largest proportion of underweight at 27 %. In South Africa, Mexico and Russia, more than 70 % of the sample populations were either pre-obese or obese, followed by normal and then underweight. In Mexico and Russia, not even 1 % was classified as underweight. Besides India, which still showed a heavy underweight burden, the other five countries seemed to have a greater overnutrition problem that would need to be addressed.
To foreshadow the importance of development levels, Fig. 3 shows the proportions of underweight, overweight (pre-obese or obese) and obese in the country samples v. log(GDPpC), together with the least-squares line for each nutritional status.
Proportions of underweight (![]() ), overweight (
), overweight (![]() ) and obese (
) and obese (![]() ) v. log(GDPpC), and their linear trends (
) v. log(GDPpC), and their linear trends (![]() , underweight;
, underweight; ![]() , overweight;
, overweight; ![]() , obese), for the six countries. Data on older adults aged 50 years or over from the first wave of the WHO Study on global AGEing and adult health (SAGE) implemented between 2007 and 2010 (GDPpC, national gross domestic product (at purchasing power parity) per capita)
, obese), for the six countries. Data on older adults aged 50 years or over from the first wave of the WHO Study on global AGEing and adult health (SAGE) implemented between 2007 and 2010 (GDPpC, national gross domestic product (at purchasing power parity) per capita)
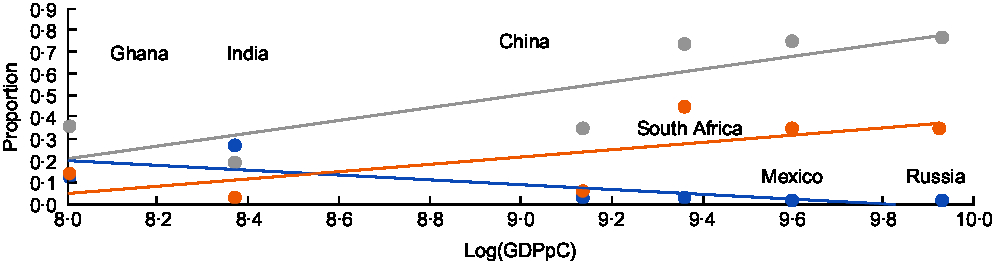
Generally, the proportion of underweight was negatively associated with log(GDPpC), whereas proportions of overweight and obese were positively associated with log(GDPpC), in agreement with previous findings on nutritional status and development. The obese line was lower than the overweight line, which was expected, as obese is a subset of overweight. India was the only country with an underweight prevalence higher than its overweight prevalence.
Associations of under- and overnutrition with development-related factors
Figure 4 has nine parts showing the bivariate relationships between the proportions of underweight, overweight (pre-obese or obese) and obese with the development-related characteristics. All of these variables were subsequently studied in a multivariate framework.
Distribution of BMI categories for the six countries: (a), (b) and (c) proportion of underweight, overweight and obese, respectively, by place of residence (![]() , rural;
, rural; ![]() , urban); (d), (e) and (f) proportion of underweight, overweight and obese, respectively, by education (
, urban); (d), (e) and (f) proportion of underweight, overweight and obese, respectively, by education (![]() , less than high school;
, less than high school; ![]() , completed high school;
, completed high school; ![]() , completed college); (g), (h) and (i) proportion of underweight, overweight and obese, respectively, by wealth (
, completed college); (g), (h) and (i) proportion of underweight, overweight and obese, respectively, by wealth (![]() , 1st quartile;
, 1st quartile; ![]() , 2nd quartile;
, 2nd quartile; ![]() , 3rd quartile;
, 3rd quartile; ![]() , 4th quartile). Data on older adults aged 50 years or over from the first wave of the WHO Study on global AGEing and adult health (SAGE) implemented between 2007 and 2010
, 4th quartile). Data on older adults aged 50 years or over from the first wave of the WHO Study on global AGEing and adult health (SAGE) implemented between 2007 and 2010
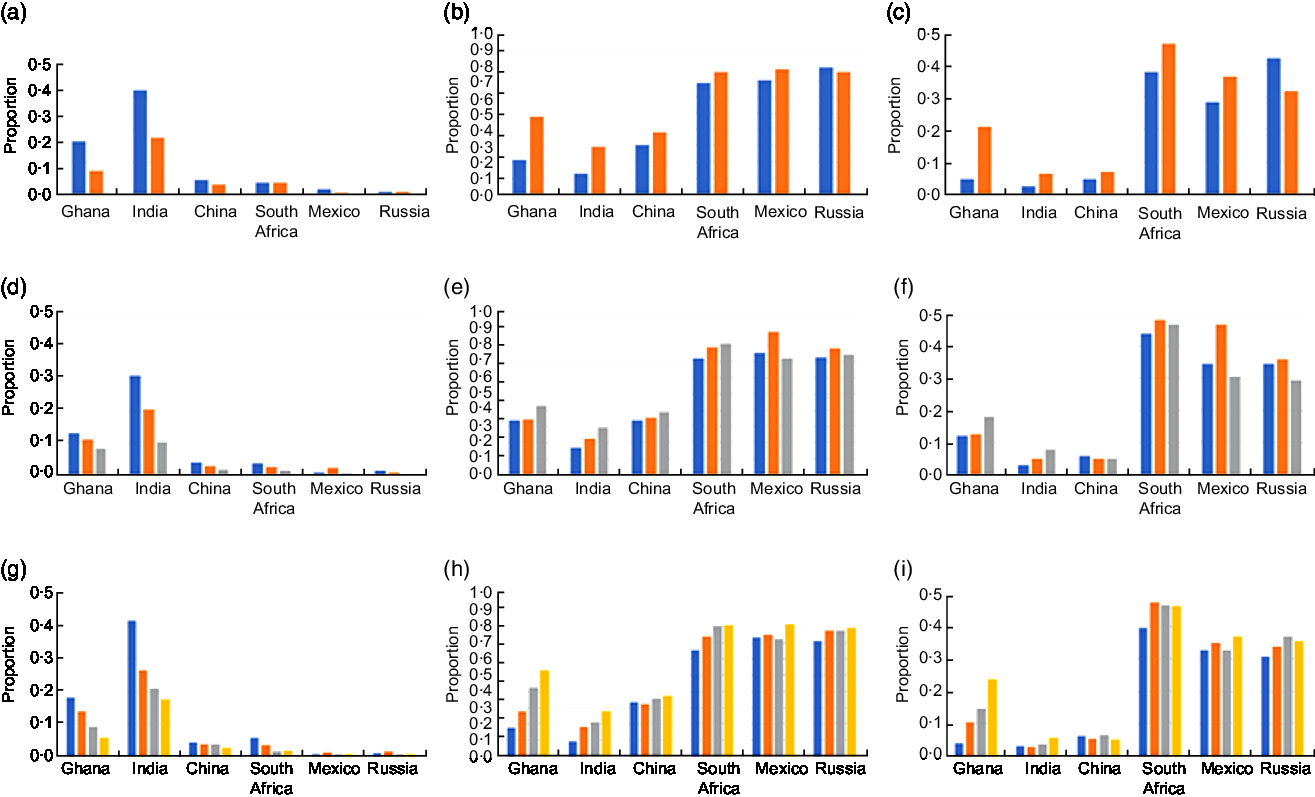
Consider first Fig. 4(a), (d) and (g) that show the relationships for the proportion of underweight. Ghana and India showed illustrative patterns. It is clear that such proportion was higher among rural dwellers, the less educated and the poor. Additionally, the bars for these two countries were decreasing in height. China and South Africa seemed to exhibit similar patterns, although the proportion of underweight was relatively low. It appears that in the most developed country, Russia, the bars levelled out to be about the same height.
Now consider Fig. 4(b), (e) and (h), and Fig. 4(c), (f) and (i), that illustrate the proportions of overweight and obese, respectively. In all countries except Russia, the proportion of overweight/obese was higher in urban areas. In Russia, the pattern was swapped – the proportion of overweight/obese was higher in rural areas – lending support to the hypothesis that a shift would accompany development. There was a reversal in urban/rural gradients as level of development increased (Fig. 4(b) and (c)). In Ghana, the proportion of overweight/obese increased with educational attainment and wealth quartile, and the same general pattern could be seen in India (Fig. 4(e) and (f), Fig. 4(h) and (i)). While this pattern held for overweight by educational attainment in China and South Africa, it did not for obese. In South Africa, the proportion of obese was actually highest for those who had completed high school (the middle education category). This same finding was observed for overweight/obese in Mexico and Russia (Fig. 4(e) and (f)). Perhaps this population segment had enough resources for sustenance but did not have the education to choose properly. The pattern was less clear for wealth quartile for the four more developed countries.
Country-specific models
Table 1 shows the OR in each country-specific partial proportional odds model. The BMI categories were ranked, from low to high, as follows: underweight, normal, pre-obese and obese. Each panel shows the ratios of odds for being in higher status(es) v. being in lower status(es). If the OR of a variable are the same in all three panels, the variable satisfies the proportional odds assumption.
OR from partial proportional odds models with BMI as an ordinal variable in Ghana, India, China, South Africa, Mexico and Russia. Data on older adults aged 50 years or over from the first wave of the WHO Study on global AGEing and adult health (SAGE) implemented between 2007 and 2010

*Significance at the 0·05 level, **significance at the 0·01 level, ***significance at the 0·001 level.
With the exception of China, Mexico and Russia in the first panel, female was always significant with OR greater than 1, in each panel and in each country. The three exceptions were all insignificant. In all countries besides South Africa, when female was significant, the OR were increasing as one went down the panels. Thus, females were more likely to be in a higher category than males and the sex differential increased as one moved up the nutritional categories. Age was significant with OR less than 1 for Ghana, India and Mexico in all three panels, and it was also significant with OR less than 1 for China when comparing normal, pre-obese or obese v. underweight. That is, older individuals were less likely to be in a higher category than those who were younger. In the case of China, this was true when comparing everything above underweight with underweight.
The rural variable was significant for all countries and panels except for all three panels for South Africa and the first panel for Russia. The OR were consistently less than 1 for Ghana, India, China and Mexico, meaning that rural dwellers were less likely to be in a higher category than urban dwellers. The OR were closer to 1 for China and Mexico than for India and Ghana, implying less disparity by place of residence in China and Mexico. In Ghana, the OR became smaller with each successive panel, meaning that the residential differential became greater for higher BMI categories. In Russia, the rural OR were greater than 1. That is, rural dwellers tended to be in a higher category than urban dwellers. Furthermore, the OR became larger from the second to the third panels, implying an increasing gradient between Russian rural and urban dwellers. Since Russia was the most developed among these six countries, this might not be surprising.
For educational attainment, completed high school and completed college were significant with OR greater than 1 for India, and completed college was significant with OR less than 1 for Mexico. In India, more education was associated with being in a higher category. Furthermore, the OR for completed college were greater than those for completed high school, meaning that there was a greater propensity of being in a higher category with more education. In Mexico, the OR of those completed college, relative to those with less than a high-school education, was less than 1, so the most educated had a lower propensity of being a higher BMI category.
All of the significant results for the wealth variables had OR greater than 1. While there tended to be an increase when climbing up the quartiles (i.e. a greater likelihood of being in a higher BMI category when in a higher wealth quartile), the patterns were not always consistent. None of the wealth quartiles was significant for Mexico in these models, nor were they significant for India in the third panel, when comparing obese v. underweight, normal or pre-obese. In such cases, wealth quartile (relative to the first) did not have a significant relationship with a person’s likelihood of being in a higher BMI category.
Pooled model
There were statistically different OR between countries in Table 1. While innate country characteristics might play a role, level of development could also provide a reason for the differences. The continuous variable log(GDPpC) was introduced to explicitly test the association with development. Interactions were included between log(GDPpC) and place of residence, educational attainment and wealth quartiles. Table 2 shows these results. As opposed to three panels, the results are displayed side by side here.
OR from the pooled partial proportional odds model with BMI as an ordinal variable and log(GDPpC) as an additional independent variable. Data on older adults aged 50 years or over from the first wave of the WHO Study on global AGEing and adult health (SAGE) implemented between 2007 and 2010

GDPpC, national gross domestic product (at purchasing power parity) per capita.
*Significance at the 0·05 level, **significance at the 0·01 level, ***significance at the 0·001 level.
Although the OR were different, female was significant with OR greater than 1 in all three columns. Females were more likely to be in a higher BMI category than males, and the OR was higher for pre-obese or obese v. underweight or normal, and even higher for obese v. underweight, normal or pre-obese. Age was significant with OR ratios less than 1 in all three columns. That is, being older decreased the odds for being in a higher BMI category. Both of these findings were consistent with what had been presented in Table 1. Log(GDPpC) was significant with OR greater than 1 in all three columns, so a higher log(GDPpC) was associated with a higher BMI category. The OR became smaller from left to right. That is, higher GDPpC pulled people up from underweight more strongly than it pulled people up from normal or pre-obese.
Now, consider the development-related covariates, which had additional interaction terms in the model. Rural and its interactions were significant in all three columns. The OR were less than 1 for rural and became increasingly small across the three columns. Without the interactions, this would suggest that the average rural dweller was less likely to be in a higher BMI category than the average urban dweller, and this differential got even more pronounced up the nutritional status spectrum. On the other hand, the interaction between rural and log(GDPpC) was significant with OR greater than 1 in all three columns. Thus, with a high enough level of GDPpC, the pattern switched such that rural dwellers, on average, had a higher propensity of being in a higher BMI category than urban dwellers. In addition, these interaction OR became increasingly large across the three columns. This would imply that the residence differential of obese v. underweight, normal and pre-obese started off the largest, but the rate at which this gap closed was the quickest as GDPpC went up.
Completed high school was significant with OR greater than 1 in the first and third columns, and completed college was significant with OR greater than 1 in the second and third columns. Those who had higher levels of educational attainment, on average, were more likely to be in a higher BMI category. For these significant results, all of the corresponding interactions were also significant, except for completed college in the second column, with OR less than 1. While more education was associated with a higher probability of being in a higher BMI category, the relationship changed in countries that were more developed, where, eventually, more education would be associated with a lower probability of being in a higher BMI category.
The interesting comparisons for the wealth variables were the third and fourth quartiles in the second and third columns. While more wealth was associated with a higher probability of being in a higher BMI category, the relationship changed in countries that were more developed, where, eventually, more wealth would be associated with a lower probability of being in a higher BMI category. It was also interesting to note that the second quartile and its interaction were both insignificant in each of the three columns, suggesting that the first and second wealth quartiles were not statistically different in their relationship with BMI category.
Discussion
Despite all six countries being low- and middle-income countries, there was a great deal of heterogeneity in the prevalence of underweight, normal, pre-obese and obese. In countries where underweight prevalence is still high, development might have positive implications with respect to nutrition status, as it, and processes intertwined with it, might be associated with pulling people out of the underweight category. In countries where overnutrition is more dominant, backward development is certainly not recommended to pull people down to the normal category. However, the associations found in these analyses and the potential effect of development on nutritional status reported in the literature, such as the paper by Drewnowski and Popkin(Reference Drewnowski and Popkin1), suggest that programmes could be initiated to counter the health consequences.
The general trend was that urban-dwelling, educated and wealthier older individuals in these countries were more likely to be in a higher BMI category. However, some of these countries might be at a level of development that is at the cusp of a trend reversal. Of these six countries, Russia was the one with the highest level of economic development. In the country-specific models for Russia, those who were in urban areas, on average, were less likely to be in a higher BMI category than their counterparts in rural areas. This was opposite to the results from the five other countries in the current study, but corroborated findings in more developed countries(Reference Befort, Nazir and Perri10).
While this reversal was not as clear for the other development-related variables, the partial proportional odds model which merged all the country-specific data sets and included log(GDPpC) interactions makes the case for intertwining processes of development and the nutrition transition. Reversals might be at higher levels of development than these countries were at and perspectives on which population segments to target for which nutritional problem might have to switch.
Monteiro et al. observed a similar trend reversal in their review of the literature from 1989 to 2003(Reference Monteiro, Moura and Conde13), although there are a couple of new insights in the present paper. The SAGE data consisted of older individuals, and the relationship between development and BMI category might differ by age group. Might the elderly be more robust to changes accompanying development? Yet the patterns remain. Second, few of the studies in their review considered this relationship among men. While education and affluence have been observed to have a positive relationship with obesity among low-income countries in many studies, a different systematic review has discovered mixed results among middle-income countries, especially among men(Reference Dinsa, Goryakin and Fumagalli26). The use of both males and females in the present study painted a more complete picture about the populations of interest and its results suggested differences by sex that warrant further research.
There are a few caveats to note. The development-related characteristics (place of residence, educational attainment, wealth quartile) were not necessarily comparable across countries. For example, a survey participant in Russia with a college degree was different from a survey participant in Ghana with a college degree with respect to other socio-economic and development-related factors, despite reaching the same level of education.
Assets, which took account of long-term household wealth, were used in the wealth index. Incomes or expenditures, which suffered from recall bias and could be subject to cyclical fluctuations as a result of the economy, the seasons, etc., were avoided. Additionally, survey participants in the current sample were 50 years of age or older, and their incomes or expenditures might have been different at the time of survey from those when they were working adults. However, quality of assets was not considered and so there could be differences in the assets themselves(Reference Vyas and Kumaranayake24).
GDPpC was used here as a proxy for economic development, although development could also take place in non-economic spheres. As a sensitivity analysis, the Human Development Index (HDI) was used in place of GDPpC. HDI is ‘a composite index measuring average achievement in three basic dimensions of human development—a long and healthy life, knowledge and a decent standard of living’, taking into account life expectancy and education as well(27). However, using HDI could result in reverse causality, as the dependent variable BMI category could be a factor affecting mortality, a component of HDI, an independent variable. The models that were run with HDI in lieu of log(GDPpC) actually produced similar results and the same substantive conclusions were reached.
Other sensitivity analyses were also performed. To test whether age associations might be non-linear, age was used as a categorical instead of a continuous variable. Models performed similarly regardless of how age was quantified. Furthermore, while BMI category was the dependent variable in the above analyses, the continuous variable BMI was also tested as a dependent variable. While the interpretations might be different, the stories were actually quite similar.
Finally, since there were only six countries in the current analysis, there were also only six levels of GDPpC. As a result, interpretations from these models should be taken with caution. While there was variation in GDPpC among these six countries, more levels are needed to make credible interpretations. Added variation could come in the form of more countries or future waves of SAGE with these same countries.
Conclusion
This line of research could be extremely relevant from a policy perspective. Traditionally, assistance from developed countries and international organizations has mainly been devoted to alleviating the undernutrition problem. While the prevalence of undernutrition has been reduced by such laudable efforts, the prevalence of overnutrition is rising rapidly at the same time. Policy makers need to adapt to this changing nutritional landscape and create policies to counter both nutritional extremes.
An important consideration that policy makers need to keep in mind is that assistance needs to target appropriate population segments. The current paper parsed out the appropriate segments of the population likely to be more afflicted by one nutritional extreme or the other. For the most part, the six country-specific models produced similar findings, despite differences in magnitude. However, the exceptions in these country-specific models demonstrated that there was a potential shift in nutritional patterns working in tandem with the processes of development. The collective model with the addition of economic development and its interactions revealed that these shifts could in fact occur and might be at levels of economic development beyond those of these six countries. Further research in this direction could prove fruitful.
Author ORCID
Carmen D Ng, 0000-0001-9453-7818.
Acknowledgements
Acknowledgements: The author would like to thank Professors Michel Guillot, Jere Behrman and Samuel Preston for their time and guidance throughout the development of this paper. Financial support: This work was supported by the Population Research Training grant (NIH T32 HD007242) from the Eunice Kennedy Shriver National Institute of Child Health and Human Development (NICHD). The NICHD had no role in the design, analysis or writing of this article. Conflict of interest: The author declares no conflict of interest. Authorship: C.D.N. is the sole author of this paper. Ethics of human subject participation: Not applicable.


