




1. Introduction
The varieties of Irish (Gaelic) spoken traditionally in south/west Munster, the southern province of Ireland, have long been noted in dialectological and linguistic literature to exhibit a complex system of lexical stress. Unlike the other macrovarieties of Modern Irish and earlier stages of Middle and Old Irish, which show a strong preference for word-initial prominence, Munster Irish (MI) often returns non-initial stress based on syllable weight, syllable count, and the distribution and adjacency of heavy syllables within a word.
The particular details of the MI stress system, including the circumstances under which non-initial prominence obtains, have been the object of some interest for formal phonological analysis since at least the early 1990s. A review of relevant points from treatments in this vein follows in Section 1.2. There has been limited instrumental phonetic investigation into the robustness of the foundational MI stress ‘facts’ (as they are often termed) that underpin formal analyses and accounts are typically based on 19th- and 20th-century dialectological descriptions (see Section 1.1). The minority of key exceptions to this are valuable but also rest fundamentally on the assumption that impressionistic L2 descriptions of stress location are accurate, with the phonetic and statistical task then being the identification of correlates of stress as described. Further, limited acoustic investigations of MI stress to date have exclusively used 21st century data. Developments in the sociolinguistic situation of Irish over the 20th century, characterised largely by the continued decline in traditional-community speaker numbers and intergenerational transmission outlined below, render the implicit assumption of compatibility between modern data and old descriptions questionable.
In 1925, a government commission reported 53,796 Munster residents across Counties Clare, Cork, Kerry, Tipperary, and Waterford with ‘ordinary conversational knowledge of Irish’ split between districts identified as fully and partially Irish-speaking (Coimisiún na Gaeltachta 1925), although it has been claimed that these figures may have been somewhat inflated (Ó Cuív Reference Ó Cuív1951: 29). By contrast, as of the 2022 census, there are a total of 15,209 people living in the three Munster Gaeltachtaí (statutorily defined language-planning zones in which Irish retains a significant community-level function), of whom 70–80% indicated knowledge of Irish. 40–47% of these speakers reported that they spoke Irish ‘very well’, and approximately one third (29–35%) said that they spoke the language on a daily basis. On the basis of proficiency and frequency of use, the number of present-day MI speakers resident in the Munster Gaeltachtaí can therefore be estimated to be between 4,588 (‘very good’ speakers) and 5,076 (daily speakers). The precision of such estimates should in any case be treated with caution, given the self-assessment of proficiency and the lack of data on respondents’ language backgrounds. Nevertheless, it is clear that in terms of both raw speaker numbers and geographical distribution/density, MI has declined significantly in its traditional heartlands since the 1920s. This numerical decline stands alongside shifts in prestige and evaluation of traditional Irish dialects in competition with supraregionalised and English-influenced urban-centred varieties amongst younger generations of Irish speakers resident in these regions, especially since the rise of broadcast media and increased social/geographical mobility from the 1960s onwards (Ó Danachair Reference Ó Danachair1969; Ó Murchadha Reference Ó Murchadha2019). These changes clearly require consideration when comparing present-day data with dialectological descriptions made in and before the 1920s.
Here, an exploratory study of phonetic prominence-marking in naturalistic MI speech is presented which is intended to begin to empirically address questions about stress in this variety of Irish, namely:
-
(i) How do common phonetic markers of lexical stress pattern across di- and trisyllabic words of different weight structures in MI data?
-
(ii) Are any of these patterns consistent with foundational descriptions of MI stress?
This proceeds via a series of Bayesian mixed-effect linear regressions which model a syllable’s maximum intensity, maximum f0, f0 range, and vowel duration as a function of syllable position, while taking into account weight-structural variation across lexical items (see Section 1.2). Ultimately, it is argued that there are questions to be answered in further research about the robustness and productivity of the MI stress system, and that formal analysis to account for MI stress as described in the absence of such validation risks being premature. This is offered in the context of cross-linguistic literature (see Section 1.3) that is critical of relying on historical dialect descriptions, grammars, etc. as data for phonological analysis, particularly in the case of impressionistic descriptions of such a complex and diverse phenomenon as lexical prominence/stress.
Sections 1.1–1.3 provide background on MI stress, formal phonological interest in the system, and limited instrumental phonetic work to date. Section 2 outlines the data for the present study and the methods of analysis. Section 3 presents results of the statistical analysis. The paper concludes with a general discussion of findings, implications, and directions for future work in Section 4.
1.1 Background on Munster Irish stress
Old Irish (c.600–900 AD) located stress in initial position in virtually all cases, with long vowels in unstressed (and non-initial) syllables being rare outside of loanwords (Thurneysen Reference Thurneysen1946: 27, 31, 67; Ó Sé Reference Ó Sé1989; McCone Reference McCone1994). There were systematic, if limited, exceptions to this for (i) certain types of verbal compounds (involving unstressable prefixes), and (ii) nouns, adjectives, and adverbs deriving from historical compounding. The same scepticism of contemporary impressionistic descriptions and descriptions based on written records should reasonably apply to this summary account of historical Irish stress as to more recent dialectological accounts. However, historical evidence in support of a fairly strong initial stress preference in Old Irish can be found in the shortening or syncope of inherited long vowels in non-initial syllables including in Latin loanwords, for example Latin ecclēsia > Old Irish eclais > Modern eaglais /ˈagˠlˠɪʃ/ ‘church’ with initial stress (O’Rahilly Reference O’Rahilly1932: 84). This situation persisted through the Middle Irish period (c.900–1200 AD) and has been inherited more or less intact in the Connacht (western) and Ulster (northern) macrovarieties of Modern Irish. A map of Ireland can be found in Figure 1 in Section 2.1.
Place of origin of L1 MI speakers sampled on a map of Ireland. Regional/county subvarieties are shown geographically and with colour. Circles indicate 1928 sample sites; triangles indicate 2020–21. Base map sourced from Rankin (Reference Rankin2007).

Munster, meanwhile, has developed a divergent system in which stress frequently occurs in non-initial position. Grammatical treatises of the 17th–19th centuries make passing reference to Munster’s prosodic idiosyncrasies (Donlevy Reference Donlevy1742; O’Donovan Reference O’Donovan1845). O’Donovan’s (Reference O’Donovan1845) grammar of Modern Irish contains the earliest systematic treatment of lexical stress in the modern language. In his discussion of ‘accent’, he notes a tendency for ‘nearly equal’ prominence on the first two syllables of di- and trisyllabic words if both syllables contain long vowels, possibly favouring the second syllable (O’Donovan Reference O’Donovan1845: 404).
In a seminal work on Irish dialects, O’Rahilly (Reference O’Rahilly1932) characterises Irish stress as ‘strong’, with a dispreference for unstressed long syllables (p.84). In MI and other southern Irish dialects, O’Rahilly describes second-syllable long vowels and third-syllable long vowels preceded by light/short syllables as attracting stress (e.g. casóg /kˠasoːgˠ/Footnote
1
‘cassock’ $\rightarrow$
[kˠəˈsoːgˠ], achainí /axanʲiː/ ‘petition’
$\rightarrow$
[kˠəˈsoːgˠ], achainí /axanʲiː/ ‘petition’ $\rightarrow$
[axəˈnʲiː]; p.86). Variable final stress in a minority of light–light disyllables is also noted as occurring in all Irish varieties such as agam /agˠamˠ/ ‘at me’
$\rightarrow$
[axəˈnʲiː]; p.86). Variable final stress in a minority of light–light disyllables is also noted as occurring in all Irish varieties such as agam /agˠamˠ/ ‘at me’ $\rightarrow$
[əˈgˠʊmˠ] or orm /ɔɾˠᵊmˠ/ ‘on me’
$\rightarrow$
[əˈgˠʊmˠ] or orm /ɔɾˠᵊmˠ/ ‘on me’ $\rightarrow$
[əˈɾˠʊmˠ], but in MI this occurs in a wider range of conditions, most notably when the second syllable in question is /ax/ (e.g. gealach /gʲalˠax/ ‘moon’
$\rightarrow$
[əˈɾˠʊmˠ], but in MI this occurs in a wider range of conditions, most notably when the second syllable in question is /ax/ (e.g. gealach /gʲalˠax/ ‘moon’ $\rightarrow$
[gʲəˈlˠax]). The apparently exceptional status of /ax/ in MI has attracted attention in the phonological literature and is returned to in Section 1.2.
$\rightarrow$
[gʲəˈlˠax]). The apparently exceptional status of /ax/ in MI has attracted attention in the phonological literature and is returned to in Section 1.2.
Ó Cuív (Reference Ó Cuív1944) and Breatnach (Reference Breatnach1947) describe similar states of affairs more specifically for County Cork’s West Muskerry (a.k.a. Múscraí), and Co. Waterford’s Ring (An Rinn). Regarding the now-extinct Irish varieties of County Clare, Holmer (1962) distinguishes between Clare Irish ‘proper’ and those varieties which border County Galway. The former are said to exhibit the ‘Munster’ system, specifically as described by O’Rahilly (Holmer 1962: 63), with the qualification that words longer than disyllables (i.e. three syllables or more) are challenging for concise, rule-based description.
After this, Ó Sé (Reference Ó Sé1989) provided a geographical and lexical study of stress location in various Irish varieties. This is the earliest work to explicitly refer to syllable weight in connection with Irish stress, classing syllables with a long vowel, diphthong, or /ax/ as heavy, and those with only a short vowel as light. Ó Sé summarises MI stress as (i) culminative (i.e. signalling locationally variable prominence) rather than demarcative, using Trubetzkoy’s (Reference Trubetzkoy1969: 277) terminology, (ii) weight-sensitive, (iii) generally restricted to the first three syllables of a word (with allowance here and in later work for rare lexically specified cases of fourth-syllable stress; Ó Sé Reference Ó Sé2000: 46–47), and (iv) occurring on a ‘rightward heavy syllable’ when applicable, otherwise defaulting to initial position.
The works outlined here represent the foundations for later formal phonological treatments of MI stress. While they are key sources and represent substantial scholarship on the language, they are also entirely impressionistic and present persistent ambiguity in terminology (e.g. ‘stress’, ‘accent’, ‘tone’Footnote 2 ). Further, they are written in terms which allow for lexical and inter-/intraspeaker variation in the realisation of prominence in contrast to more restrictive and monolithic interpretations implicit in later formal theoretical approaches to the patterns described (see Section 1.2).
1.2 Formal interest in MI stress
The historical development of MI ‘forward stress’ was first treated formally by Blankenhorn (Reference Blankenhorn1981). Based on descriptions of rising pitch-accents in Cork Irish by Ó Cuív (Reference Ó Cuív1944: 72-77), Blankenhorn suggests a reanalysis of phrase-level high f0 as an exponent of lexical stress. The exceptional behaviour of /ax/ is attributed to its resistance to vowel-reduction, and final stress in limited short–short disyllables such as turas /ˈt̪ˠʊɾˠas/ ( $\rightarrow$
MI /t̪ˠɾˠʊs/) ‘trip’ or tirim /ˈtʲɪɾʲɪmʲ/ (
$\rightarrow$
MI /t̪ˠɾˠʊs/) ‘trip’ or tirim /ˈtʲɪɾʲɪmʲ/ ( $\rightarrow$
MI /tʲɾʲɪmʲ/) ‘dry’ is linked to lexical frequency.Footnote
3
$\rightarrow$
MI /tʲɾʲɪmʲ/) ‘dry’ is linked to lexical frequency.Footnote
3
Later work continued in the main to take the impressionistic work of the dialectologists as their points of departure. From the early 1990s onwards, treatments of MI stress in the phonological literature are concerned mainly with accounting for the descriptions presented by the dialectologists. These are summarised in (1) following Doherty (Reference Doherty1991) with notable deviations indicated.
-
(1) Algorithm for assigning stress in MI, based on typically summaries of the system:
-
1. ‘If the second syllable is heavy, stress it.’ (Doherty Reference Doherty1991)
-
a. Count /ax/ as pseudo-/medium-heavy if in second position
LˈH(L/H), HˈH(L/H), LˈX(L?)
-
-
-
2. ‘Otherwise, stress the leftmost heavy syllable.’ (Doherty Reference Doherty1991)
ˈHL(L/H), ˈHLL, LLˈH
-
a. Contested by Rowicka (Reference Rowicka1996) and Gussmann (Reference Gussmann1997) who cite third-syllable stress in HLˈHL structures, with secondary stress on initial syllable.
-
b. Contested by Noyer (Reference Noyer1990) based on O’Rahilly (Reference O’Rahilly1932), citing initial stress in ˈLᵊLH structures (example imleacán /ˈɪmʲəlʲakˠɑːn̪ˠ/ ‘navel’).
-
c. Contested by Ó Sé (Reference Ó Sé1989) who cites a preference for rightmost heavy syllables.
-
-
3. ‘Otherwise, stress the leftmost syllable.’ (Doherty Reference Doherty1991)
-
a. Compounded by Ó Sé (Reference Ó Sé2000: 54–55) who describes a phrase-level preference for initial stress in non-final/prenuclear items in Kerry Irish (specifically the Corca Dhuibhne variety) under various lexical and derivational conditions.
-
In all cases, the main point of interest for formal accounts (rule- or constraint-based) is the apparent mismatch between left- and rightward stress preferences depending on the particular count and distribution of heavy syllables. Implications of their analyses are often brought to bear on broader theoretical questions in cross-linguistic metrical phonology. Issues addressed using the MI stress case include:
-
(i) ordering of stress assignment with respect to segmental/phonotactic processes such as epenthesis (Noyer Reference Noyer1990),
-
(ii) analytical requirement for suprasegmental metrical constituents, their construction, and restrictions on their adjacency, including of the foot (Doherty Reference Doherty1991; Rowicka Reference Rowicka1996; Gussmann Reference Gussmann1997; Bennett Reference Bennett2012: 194–256) and the colon (Green Reference Green1997: 121–129),
-
(iii) extrametricality (Doherty Reference Doherty1991), and
-
(iv) the relationship between weight and default stress preferences (Iosad Reference Iosad2013).
1.3 Instrumental phonetic work on MI stress
A serious drawback of the work outlined in Section 1.2 is the empirical basis of the descriptions used as a starting point. Not least for technological reasons, early 20th-century dialectological descriptions, while based in some cases on extensive auditory phonetic training, was impressionistic rather than instrumental. In more recent cross-linguistic literature on stress/accent, it has become clear that such data must be treated with caution until their descriptions can be empirically verified (cf. van Zanten & van Heuven Reference van Zanten and van Heuven1998; van Zanten, Goedemans & Pacilly Reference van Zanten, Goedemans and Pacilly2003; Hyman Reference Hyman and van der Hulst2014; de Lacy Reference de Lacy and van der Hulst2014). This issue has been raised by other authors as a point of concern and as a pertinent gap in MI stress research (e.g. Ó Sé Reference Ó Sé1989; Iosad Reference Iosad2013; Torres-Tamarit & Hermans Reference Torres-Tamarit and Hermans2017).
Recently, Windsor (Reference Windsor2017: 27–70) and colleagues (Windsor, Coward & Flynn Reference Windsor, Coward and Flynn2018) used data from one speaker each from the Cork and Waterford Gaeltachtaí (in comparison with two Connacht speakers) to identify acoustic correlates of stress, as identified by ‘phonetically trained undergraduate research assistants’ with reference to the traditional descriptive sources (Windsor Reference Windsor2017: 49). Labelled stress in the MI data was predicted by an interaction between intensity range with maximum pitch and maximum intensity, while labelled pitch-accented syllables were predicted by an interaction between minimum and mean pitch. These findings were used to classify MI as a ‘top-down’ language, according to Gordon’s (Reference Gordon and van der Hulst2014) prosodic typology (i.e. lexical and phrasal prominence are assigned separately, with reference to different levels of the prosodic hierarchy).
By contrast, Blum (Reference Blum2018) presented data from a single speaker of Kerry Irish in which intensity, pitch, duration, spectral tilt, and vowel F1 and F2 were checked against the usual descriptions for correlation. Notably, the conclusion was that the speaker analysed had a system of initial stress with the exception of light–/ax/ items. Shortly after this, Kukhto (Reference Kukhto2019) used data from four speakers of Kerry Irish to argue that /ax/ does not have a synchronically productive exceptional weight status.
These studies draw on different, if at times overlapping, sources of data from particular MI subvarieties, subsets of MI subvarieties, or small speaker numbers (including single speakers) from each present-day MI subvariety, and proceed with different analytical aims and methods. It is clear that before deciding between the competing phonological accounts outlined in 1.2, it is necessary to establish the reliability of previous descriptions of MI stress – a task the minority of studies outlined in this section have begun to address. The present study, while relatively modest, is to date the largest-scale systematic attempt at this verification and to my knowledge the first to explicitly distance itself from reliance on previous impressionistic descriptions’ accuracy as a reflection of phonological reality for L1 speakers of MI. Key aspects of this latter issue are presented in Section 1.4.
1.4 Perception and functional load of stress in MI
No studies of MI stress to date have dealt in detail with questions of stress perception by L1 (or indeed L2) speakers. It is well established that languages vary in terms of (i) whether syllables are meaningfully differentiated in suprasegmental terms at the lexical level (i.e. whether they have stress), and (ii) the phonetic parameters used to implement such prominence. This has been summarised with reference to typologically diverse languages by, e.g., Cutler (Reference Cutler, Pisoni and Remez2011; Cutler & Jesse Reference Cutler, Jesse, Pardo, Nygaard, Remez and Pisoni2021). The choice of parameters may interact with functional load of certain segmental contrasts in a given language/variety, e.g. a language with a phonological vowel-length contrast like Hungarian (or Irish) may disprefer the use of duration to indicate stress compared to a language with no such length contrast such as Greek (Vogel, Athanasopoulou & Pincus Reference Vogel, Athanasopoulou, Pincus, Heinz, Goedemans and van der Hulst2016).
When languages differ in terms of the functional load and phonetic implementation of stress, cross-linguistic perceptual conflicts can arise. This has been discussed for the perception of stress in Welsh by L1 Welsh and L1 English speakers (Jones Reference Jones1949; Oftedal Reference Oftedal and Tielinget1969; Williams Reference Williams1985; See also summary discussion in Cooper Reference Cooper2015: 45–55). A frequent mismatch between the usually penultimate location of stress in Welsh and high-pitch excursions peaking in or after the final syllable of a wordFootnote 4 has been shown to cue final stress percepts for naïve L1 English listeners. The latter seem to strongly associate high pitch with stress in their L1 and use this in attempting to diagnose Welsh stress. Meanwhile, speakers of languages with lexical stress have been found to identify stress in languages where none exists in the mind of the L1 speaker (e.g. stressless Indonesian as perceived by L1 Indonesian vs by L1 Dutch listeners and analysts; van Zanten & van Heuven Reference van Zanten and van Heuven1998). The reverse also obtains: speakers of languages with weak or arguably no lexical stress (e.g. French) struggle to reliably identify stress in languages that use it – so-called ‘stress deafness’ (Dupoux et al. Reference Dupoux, Pallier, Sebastián and Mehler1997; Peperkamp & Dupoux Reference Peperkamp and Dupoux2002).
For the case of MI, it is therefore important to note that stress is never lexically contrastive in Irish (i.e. no minimal pairs distinguished by stress location exist), giving reason to imagine a low functional load for the feature. Further, the foundational descriptions outlined in Section 1.1 were carried out by L1 English speakers. Other contemporary early 20th-century descriptions had, e.g., L1 French (Sjöstedt-Jonval Reference Sjöstedt-Jonval1931, Reference Sjöstedt-Jonval1938), but none to my knowledge had L1 Irish. In light of the (mis)perception by L1 English speakers of stress in Welsh (another Celtic language in long-term contact with English), this must be taken into account when evaluating the reliability of MI stress descriptions. Direct study of the perception of phonetic stress cues by L1 MI speakers is left for future work, but this perspective informs the cautiously bottom-up approach taken to the data in the remainder of the paper.
2. Methods and materials
The present exploratory study sets previous descriptions of MI stress to one side, and instead presents a series of models of common phonetic exponents of stress as a function of syllable position in di- and trisyllabic words of various weight structures. This approach is intended to evaluate the distribution of such exponents in light of questions of lexical/weight-structural frequency, robustness/credibility of patterns, and correlation between measures. Emergent patterns are then compared to previous descriptions and analyses, returned to in broad terms in Section 4.
2.1 Data
The data are naturalistic story reading, telling, and retelling recordings of L1 MI speakers from two eras (1928 and 2020–21). In each era, all available regional (county) subvarieties are represented: Counties Kerry, Cork, Waterford, and (for 1928 only) Clare and Tipperary. The latter two varieties have since gone extinct as community languages. Sample sites are shown in Figure 1.
For 1928, the data come from the Doegen Records Web Archive maintained by the Royal Irish Academy (2009). In 1925 shortly before these recordings were made, the number of Irish speakers reported in Munster electoral districts identified by the 1925–26 Gaeltacht Commission as fully and partially Irish-speaking were respectively 16,727 (Clare), 22,512 (Cork), 37,477 (Kerry), 12,892 (Waterford), and 738 (Tipperary) (Coimisiún na Gaeltachta 1925: 8). These recordings were made on wax cylinders by Wilhelm Doegen at the invitation of the government of the Irish Free State (in existence 1922–1937); the collection has since been digitised, and is freely accessible online. The recordings comprise (i) semi-scripted readings/retellings of the short story The Prodigal Son (An Mac Scaiptheach; Luke 15:11–32), and (ii) general, extemporaneous storytellings.
The collection also contains wordlists (numbers, phrases, etc.), poems, and songs, but these were excluded from consideration. There are 20 L1 MI speakers, all male, with birth years ranging 1846–1892. Two of the Kerry informants were reported to be monolingual. All but one were reported to be literate, though six were reported to have only ‘limited’ schooling; most had spent little if any time away from their home regions with the exception of two who spent 10–12 years each in the USA. These recordings represent a linguistic conservatism in sharp contrast to the universal Irish/English bilingualism, growing English dominance, and contact effects on Irish of the present day.
2020–21 data were collected remotely over Zoom during the COVID-19 pandemic. Institutional ethical approval for collection, processing, and retention of these recordings came under the permissions granted to the larger ABAIR projectFootnote 5 , of which the author was a part at the time of collection, to the satisfaction of institutional requirements. The use of remote recording techniques was inevitable due to global circumstances at the time of study. While supervised on Zoom, participants recorded themselves locally on their personal devices using the open-source recording and editing software Audacity. The resulting recording was exported as a.wav file and sent to the researcher by email. All recordings are readings and retellings of The Prodigal Son, in a form slightly modified from the 1981 ‘Maynooth’ Bible (Ó Fiaich & Ó Fiannachta Reference Ó Fiaich and Ó Fiannachta1981). This text was selected to match the story most represented in the 1928 data.
The most obvious consequences of the remote data collection method are that multiple microphones were used in collecting these data, and participants’ surrounding environment, distance from and orientation with regard to the microphone were uncontrolled. Previous comparisons of laboratory recordings and those collected remotely using smartphones and laptops broadly indicate that while the former is preferable, some measurements, including of f0, are roughly comparable for broad analytical purposes (Jannetts et al. Reference Jannetts, Schaeffler, Beck and Cowen2019; Leemann et al. Reference Leemann, Jeszenszky, Steiner, Studerus and Messerli2020). Others, including key vowel measures such as F1 and F2, may be altered by compression and must be treated with more caution (de Decker & Nycz Reference de Decker and Nycz2011; Sanker et al. Reference Sanker, Babinski, Burns, Evans, Johns, Kim, Smith, Weber and Bowern2021). For present purposes, (i) the quality baseline for comparison was the digitised wax-cylinder recordings of the 1928 corpus, (ii) remotely collected 2020–21 recordings were judged to be of comparable quality, and (iii) measures extracted (see details in Section 2.1.1) were restricted in type and granularity.
14 L1 MI participants, 11 female and three male, from the remaining Munster Gaeltachtaí of Counties Kerry, Cork, and Waterford with birth years 1932–2001 took part. All 14 were identified as fully Irish/English bilingual. Fluency in English can be assumed as a matter of course for those who have grown up in present-day Ireland (see e.g. Ó Catháin Reference Ó Catháin2016). As noted in Section 1, the number of traditional L1 Irish speakers has declined drastically over the past century, both in Munster and more broadly. In the 2022 census (Central Statistics Office, 2023), the number of daily speakers of Irish in the local Gaeltacht populations (LGPs) of Munster are respectively 35.1% (Kerry, 3,171 speakers in an LGP of 9,036), 28.8% (Cork, 1,184 speakers in an LGP of 4,110), and 34.5% (Waterford, 712 speakers in an LGP of 2,063). By self-identified fluency, the numbers for those who speak Irish ‘very well’ (the highest available option on the census) are 2,783 (Kerry, 30.8% LGP), 1,167 (Cork, 28.4% LGP), and 689 (Waterford, 33.4% LGP). Sociolinguistically, as touched on in Section 1, there are also significant generational changes at play in Gaeltacht varieties since at least the 1960s, with growing influence from English in phonology, morphosyntax, and lexis and functional shifts towards English as a dominant community language, as well as open questions about the future of the Gaeltachtaí as geographically defined concentrations of linguistically self-sustaining traditional Irish-speaking communities (de Bhaldraithe Reference de Bhaldraithe1993; Ó Giollagáin & Charlton Reference Ó Giollagáin and Charlton2015: 128; Ó Catháin Reference Ó Catháin2016; Walsh Reference Walsh2019).
For the present study, participants self-identified as native/L1 Irish speakers from one of the three Gaeltachtaí during the initial recruitment process, after which a questionnaire was completed. The questionnaire asked participants to identify (i) the language(s) most spoken in the home when they were growing up, (ii) their language(s) of education, and (iii) the native language(s) of their parents. All participants but one had at least one natively Irish-speaking parent, and all reported significant use of Irish in the home and community (always one of the three Gaeltachtaí in question). All participants had Irish as their medium of education through at least secondary school, with Irish-medium third level education (university or equivalent) for nine of 14.
2.1.1 Processing
Recordings were processed manually in Praat (Boersma & Weenink Reference Boersma and Weenink2024) by the author. Files were divided into utterances, words, syllables (details on syllabification are provided below), and segments based on spectrographic and audio information. Particularly in the case of the 1928 recordings, sound quality for which was variable and often characterised by background hissing as a result of the original recording medium, auditory verification of segment/syllable/word boundaries was sometimes required. However, because this was carried out by a single analyst, and because the measures of interest pertain primarily to syllable nuclei, any inconsistencies in this segmentation are expected to be minor and of low consequence for the particular analysis in question.
Individual lexical items were labelled orthographically, while syllables were transcribed phonemically. Syllables were divided in line with onset maximisation, with word-medial consonants treated as syllable onsets rather than codas (subject to phonotactically licit clustering). As noted by a reviewer, Irish syllabification has been the subject of debate in literature on the language. A coda preference for medial consonants has been cited in historical grammars of the classical language (e.g. the 1634 Franciscan Rudimenta Grammaticae Hibernicae specifies syllabifications such as /mˠaɾˠkˠ.ax/ for marcach ‘horseman’, /gʲalˠ.ə/ for gealladh ‘promising’, and /kɔd̪ˠ.lˠə/ for codladh ‘sleeping’); Mac Aogáin Reference Mac Aogáin1968: 13) as well as in later dialectological and philological works (e.g. writing about Cork Irish, Ó Cuív Reference Ó Cuív1944: 64 syllabifies a single medial consonant as the coda of a preceding stressed syllable rather than as the onset of a following unstressed one, such as doras /d̪ˠɔɾˠ.əs/ ‘door’). Using experimental perceptual methods, Ní Chiosáin, Welby & Espesser (Reference Ní Chiosáin, Welby and Espesser2012) found a general preference in Connemara Irish speakers for onset maximisation against a typologically exceptional syllabification system for the language, albeit with evidence of medial-consonant ambisyllabicity under certain conditions. For present purposes, onset maximisation allowed for efficient and consistent division of syllables, the measurements to be extracted from which (see below) rely almost entirely on the nuclear vowels of the syllables in question.
Lexical items were then categorised according to weight structure, with syllable labels L (light, containing a short vowel), X (syllables involving the sequence /ax/), and H (heavy, syllables containing a long vowel or diphthong). For example, the word sealúchas /ʃalˠuːxas/ ‘inheritance’ was labelled LHL versus, e.g. LX amach /əˈmˠax/ ‘out’. X-type units for this weight-structure labelling were identified by sequence/string rather than by strict syllabification criteria. For instance, gairdeachas /gˠaɾʲdʲaxas/ ‘rejoicing’ was classed as LXL despite the fact that for mechanical purposes the medial /x/ would be syllabified as the onset of a final syllable /xas/ rather than a medial syllable /dʲax/. As illustrated in Figure 2, cases of non-final /ax/ were very infrequent. Weight-labelling was not always straightforward, for instance in cases of conflict between orthographic vowel length or composition and what speakers produced. It was decided that defaulting to speaker production was most consistent with an acoustic-phonetic approach to the data. For example, individual tokens of an item such as fiafraigh ‘ask, inquire’ could be labelled LL /fʲɪ(ə)fˠɾˠɪgʲ/ or HL /fʲiəfˠɾˠɪgʲ/, depending on whether a substantial second element could be identified in the initial syllable to define a diphthong. It is here worth noting the possible circularity in operationalising the identification of stress and vowel quality/quantity. It is conceivable that cases of ambiguous vowel length hinge on a syllable’s stress status, as in tharla /ˈhaɾˠlˠə/ ‘happened’ which has a historically short /a/ in the initial syllable but is often produced with long /ɑː/ due to initial stress (i.e. /ˈhɑːɾˠlˠə/). Under the present operationalisation, tokens of this lexical item could be labelled LL or HL depending on the determined quality and relative duration of the initial vowel. Without recourse to previously described MI stress location, this was difficult to completely circumvent during transcription and coding. Such cases were relatively rare, but their existence should be borne in mind as a limitation of the current method for consideration in future study.
Frequency of different disyllabic weight structures in the 1928 and 2020–21 data. Number of individual lexical items within categories is indicated with the numbers above each bar. Structures expected based on the literature to exhibit non-initial stress are marked with asterisks (e.g. *LH* – a light–heavy disyllable expected to have final stress).

Once labelled, maximum intensity, maximum f0, f0 range, and vowel duration were extracted automatically for component syllables of all di- and trisyllables in the data using two Praat scripts (Kim Reference Kim2008; Antoniou Reference Antoniou2013). The selected measures were chosen based on previous work on stress in Irish and cross-linguistically (see representative sample outlined in Sections 1.3–1.4). Other measures of prominence, most notably spectral tilt and source-excitation may be investigated in future, but measures for the present work were required to be recoverable with reasonable reliability from the qualitatively variable 1928 data.
Scripts were supplied with the TextGrids containing the time aligned and syllabified transcriptions from both corpora and their associated.wav files. They operated by moving iteratively through each labelled interval in a TextGrid and extracting the four measurements specified from the audio along with syllable, lexical, and weight-structure labels. For this automatic extraction, f0 settings were configured to range from 50–300 Hz for male speakers, and 75–400 Hz for female speakers (in the 2020–21 corpus only). Praat’s periodicity detection algorithm was set to estimate f0 using its default .75 time step which also determines the time window for calculation of intensity by dividing said time step by the (gender-specified) f0 floor. This meant a 60 millisecond window for intensity calculation for male speakers, and a 40 ms one for female speakers. Formant values were extracted using default settings, allowing for five formants and a ceiling of 5,500 Hz with a window length of .025. However, measures of vowel height (F1) and backness (F2) were not considered for this analysis due to the lack of control over the vowel phonemes in question and the sparseness of the by-phoneme data if such controls were implemented.
For models of all measures except for vowel duration, items containing undefined f0 or other estimation errors were discarded before proceeding further. Approximately 6% of items were removed on this basis; 8% of syllables in the 1928 corpus (8% of disyllable members, 11% of trisyllable members), and 4% of syllables in the 2020–21 corpus (3% of disyllable members, 5% of trisyllable members). Unsurprisingly, measurement/estimation errors were more frequent in the lower quality 1928 data, and more frequent in trisyllables (in which at least one syllable may be significantly reduced) in both corpora. F0 measures in Hertz from the remaining majority of syllables were converted to semitones with reference to 50 Hz, and then z-scored by speaker. Vowel durations were first log transformed (see e.g. Rosen Reference Rosen2005), before being z-scored by speaker within phonological duration categories (i.e. z-scores reflect duration relative to a given speaker’s category average and standard deviation for either short or long vowels). Intensity maxima were z-scored by speaker.
All four measures were obtained for a total of 7,699 disyllables (1928, N=3,941; 2020–21, N=3,758) and 767 trisyllables (1928, N=342; 2020–21, N=425)Footnote 6 . This disparity is consistent with anecdotal impressions of the Irish lexicon; only 77 tetrasyllables were present in the same dataset (1928, N=52; 2020–21, N=55). Frequency considerations for both syllable count and lexical weight structure are returned to in later discussion of productivity (see Section 4). Distribution of di- and trisyllables across weight structures are presented in Figures 2 and 3.
Frequency of different trisyllabic weight structures in the 1928 and 2020–21 data. Number of individual lexical items within categories is indicated with the numbers above each bar. Structures expected based on the literature to exhibit non-initial stress are marked with asterisks (e.g. *LHL* – a light–heavy–light trisyllable expected to have medial stress).

2.1.2 Limitations of the data
Immediately evident in Figures 2 and 3 is the uneven distribution of lexical items in the two corpora across weight-structure categories. Additionally, due to the naturalistic nature of the material in question, individual lexical items (within and across weight structures) have been taken from utterances of variable length and from diverse prosodic positions within said utterances. The utterances are overwhelmingly declarative sentences in the context of story narration (93% in the 1928 data, 95% in the 2020–21), and the information structure of the utterances and the location of the extracted items in said structure is not controlled. This all in turn poses a cumulative challenge for the robustness and reliability of any analysis carried out on such data, and limits the generalisations and conclusions that can be made. Such variables are known to affect the implementation of stress marking, particularly for major, cross-linguistically frequent features such as pitch and duration (see Bolinger Reference Bolinger1958, Reference Bolinger1961; Gordon Reference Gordon and van der Hulst2014; Röttger & Gordon Reference Röttger and Gordon2017, inter alia. With specific reference to MI, noted earlier in Section 1.2, see Ó Sé Reference Ó Sé2000: 54–55; Windsor et al. Reference Windsor, Coward and Flynn2018). Some of these limitations are returned to in discussion of the results in Section 4.3 and Section 5.
The rationale for proceeding with the analysis without additional controls on the data was as follows. The phonologically notable cases of described non-initial stress are those in which multiple heavy syllables stand in competition with one another, and those in which one or more /ax/ syllable is in competition with light syllable(s). Such structures have relatively low frequency in both the Irish lexicon and the corpora under investigation. To restrict the weight-structure categories under investigation in the interest of a more balanced sample for statistical analysis would have risked marginalising or indeed excluding the very cases that are most of interest for the phenomenon in question. Ultimately, the aim of the study is primarily exploratory and descriptive, for which aim the inclusion of all possible datapoints in a sparse set (especially in the case of the 1928 corpus) is of interest. More strictly controlled analysis of the same data would be a welcome and valuable development in futureFootnote 7 .
2.2 Statistical methods
Statistical analysis of the data proceeded via a series of Bayesian mixed-effect linear regressions for each measure by syllable count and era, making for 16 basic models (4 measures $\times$
2 syllable counts
$\times$
2 syllable counts $\times$
2 eras) with variant remodels addressed in Sections 3.1 and 3.2 as relevant. All modelling was carried out using brms (Bürkner Reference Bürkner2017) in RStudio. In all cases, the measure in question for an individual syllable was set as the dependent variable predicted by position, with random slopes specified by speaker and weight structure. This allowed for the consideration of the validity of a simple, position-based explanation for change in a given parameter over the course of a word, while allowing for the joint possibilities of traditional/expected weight-sensitive subpatterning and individual-speaker variation.
$\times$
2 eras) with variant remodels addressed in Sections 3.1 and 3.2 as relevant. All modelling was carried out using brms (Bürkner Reference Bürkner2017) in RStudio. In all cases, the measure in question for an individual syllable was set as the dependent variable predicted by position, with random slopes specified by speaker and weight structure. This allowed for the consideration of the validity of a simple, position-based explanation for change in a given parameter over the course of a word, while allowing for the joint possibilities of traditional/expected weight-sensitive subpatterning and individual-speaker variation.
For disyllables, there was a single treatment-coded predictor of a given syllable being or not being in second/final position (coded as 1 and 0, respectively), leaving the intercept as representing initial position. For trisyllables, there were two predictors, namely whether a given syllable was (1) or was not (0) in either of first or third/final position, leaving the intercept to represent medial position (i.e. neither initial nor final).
A standard set of weakly informative, regularising priors were specified for all models, with mean 0 and standard deviation 1 for the intercept, slopes, standard deviations, and sigma, consistent with an assumption of a null to weak (+/– 1 standard deviation) effect emerging in z-scored data. LKJ(2) was used for the correlation prior, based on precedent in the literature (Vasishth et al. Reference Vasishth, Nicenboim, Beckman, Li and Kong2018). Each model was specified to run four chains of 2,000 iterations each, with the first 1,000 iterations discarded as warmup. Joint posterior distributions’ convergence was then assessed using caterpillar plots, R-hat, and posterior predictive checks against the input data. In the minority of cases in which divergent transitions emerged after running a given model, the model was re-run with adapt_delta() increased to .99 to reduce sampling speed. All models reported in Section 3 were satisfactory according to these assessments. The Bayesian credible intervals (CIs) initially obtained for population-level parameters and by-structure adjustments represent the range within which the true value of the parameter in question is likely to be contained at the level specified (often 95%; Morey et al. 2015; Nicenboim & Vasishth Reference Nicenboim and Vasishth2016; Vasishth et al. Reference Vasishth, Nicenboim, Beckman, Li and Kong2018). These lend themselves more readily to flexible discussion of statistical models without an arbitrary cutoff for ‘significance’ than frequentist confidence intervals. When discussed at the population level in Section 3, 95% CIs are provided in square brackets after estimates.
For intercepts, slopes, and by-structure random effects in each model’s joint posterior distribution, probability of direction (PD) was obtained using p_direction() in the package bayestestR (Makowski, Ben-Shachar & Lüdecke Reference Makowski, Ben-Shachar and Lüdecke2021). Probability of direction reflects the proportion of the posterior distribution which shares the sign of the distribution’s median value, ranging from 50% to 100%, which allows for evaluation of the likelihood of a non-null effect (positive or negative). A PD value of 50% indicates an even split between the proportion of the distribution which shares the sign of the median value, and the proportion with the opposite value. PD has been cited as an approximate Bayesian equivalent – though not an exact analogue – to the frequentist p-value, which may facilitate interpretation of Bayesian modelling for those more familiar with analyses in a frequentist framework (Makowski et al. Reference Makowski, Ben-Shachar, Chen and Lüdecke2019). However, it is important to understand that PD is not a simple indicator of effect presence (or absence), and must not be interpreted as such. Rather, it is a convenient summary statistic of the distribution of values for the parameter(s) in question in the joint posterior distribution of the model based on the priors, model specifications, and observed data, which may inform cautious inference. For the present work, such summarisation was useful due to the quantity of distributions in question when examining random intercepts and slopes across 28 attested weight structures. There are approximately 692 relevant distributions, when all intercepts, slopes, and random effects across models of four measures for disyllables (eight and nine structures attested respectively in the 1928 and 2020–21 data) and trisyllables (19 and ten structures attested respectively in the 1928 and 2020–21 data), along with limited remodels, are taken into account. Density plots of the posterior distribution of values for these parameters are provided in the supplementary materials.
For the discussion in Sections 3 and 4, two PD values of interest were identified for use in summarising model estimates for cross-syllable change in the four measures in question: 75% and 95%. Given the diverse nature of the datasets, including highly uneven distribution of observations across weight-structure categories, and the preliminary and often fuzzy character of the models built using them, 75% PD was selected by virtue of being the halfway point in the possible PD range of 50–100%. This indicates that approximately three quarters of the distribution of the parameter in question, or more if PD is greater than 75%, shares the sign of the median value. The higher 95% PD level indicates cases in which a more striking 95% of the distribution in question shares the same sign as the median. In the summary figures of cross-syllable change in prominence measures presented in Sections 3.1–3.3, linear representations of point estimates with by-structure random adjustments to both intercepts and slopes are classed according to the PDs of their component parts. This is a vast simplification of complex distributional information, but allows for coherent consideration of relative estimation and, crucially, overall reliability of these estimations according to the selected index (PD). Ultimately, this serves to minimise discussion of straightforwardly uninformative model estimates without entirely ignoring more marginal results, and is intended to be in keeping with the arbitrary nature of cut-off points for credibility (see e.g. Morey et al. Reference Morey, Hoekstra, Rouder, Lee and Wagenmakers2016 and Kruschke Reference Kruschke2021). Future analyses, including of the same data, the end goals of which require some form of accept/reject decision-making may benefit from more rigorous statistical procedures, such as the establishment of a region of practical equivalence (ROPE) (Kruschke Reference Kruschke2018) to define the cut-off point for engagement with a parameter value range. In practical terms, note that estimates with a minimum PD of 75% are understood here to be marginally ‘credible’ only in the technical sense as satisfying the statistical criterion for inclusion in a discussion which is largely descriptive, while falling short of 75% PD is not intended to be understood as positive evidence of the absence of an effect but rather as an absence of evidence under the current modelling and assessment procedures.
3. Results
Individual model summaries are provided in the supplementary materials available through the Open Science Framework. At the population level, estimates with ≥95% PD are rare. These estimates represent cross-syllable change without reference to weight structure or speaker based only on syllable position. Estimates are most robust for maximum intensity, with positional estimates with ≥75% PD returned for all models (i.e. di- and trisyllables in both eras), ranging from –.25z [95%–.55, .06] with 95.68% PD for second to third syllables in 1928 trisyllables to –.55z [95%–1.03, –.08] with 98.60% PD for first to second syllables in 2020–21 trisyllables. Models of standardised vowel duration are more mixed, with three out of six models having all intercept and slope estimates of ≥75% PD. For one model (2020–21 trisyllables), all estimates have at least 95% PD, collectively indicating a medial reduction in vowel duration (i.e. an initial-to-medial decline in duration followed by a medial-to-final increase). Finally, for f0 maximum only 2020–21 trisyllables return population-level estimates of ≥75% PD; no models of f0 range meet this threshold.
For most models, standard deviations in syllable-position slopes by the random effect of weight structure are quite pronounced. These range from a low of .09 [95%0, .27] (maximum f0 for 1928 trisyllables) to .75 [95% .43, 1.24] (vowel duration for 2020–21 trisyllables). Given the expected variation in the effect of syllable position across weight structures, and the lack of clarity around the phonetic implementation of stress in MI, it is useful to investigate estimates across weight structures as opposed to merely a population-level overview of positional effects on the measures studied.
In Sections 3.1–3.3, model estimates for positional change are presented by weight structure and graded by credibility as evaluated by PD for structures expected to exhibit initial (3.1), second-syllable (3.2), and third-syllable stress (3.3) based on dialectological and phonological literature. This ordering of the results was selected to allow for comparison of findings with received expectations from the literature on stress in MI by grouping all relevant weight structures together for consideration in light of the combined model estimates (and their relative credibility) for cross-syllable change in all four measures examined. The natural alternative of organising results by measure, while hypothetically stauncher in its avoidance of any reliance on previous descriptions, was found to be less intuitive for cross-measure comparison and direct evaluation against claims and stipulations in the literature about the occurrence of MI stress. Thus, the present arrangement is intended to be discursively useful, rather than implicitly accepting of the expectations on which it is based.
By-structure adjustments to intercepts and slopes were obtained using ranef(), with PD for these adjustments obtained using p_direction(). By-structure intercepts and slopes were then calculated by combining the by-structure adjustments with the population level coefficients. Estimates of cross-syllable change classed according to PD criteria for all four component distributions from which mean values were extracted for each such transition (a base intercept, a base slope, and a random adjustment to each) for all measures are presented together in summary plots in the relevant sections. Table 1 outlines the combinations of PD criteria pertinent to this discussion. Note that throughout Sections 3.1–3.4 the use and intended connotation of these adjective labels is restricted to the particular definitions laid out in this table. Where pertinent, these classifications are scrutinised further (e.g. to compare base slope/intercept estimates versus random effects).
Labelling scheme for by-structure estimates of cross-syllable change, based on probability of direction for intercepts, slopes, and by-structure adjustments to both.

When estimated measure values or cross-syllable slopes are noted in the discussion, recall that for disyllable models, the intercept represents the initial syllable, while for trisyllables it represents the medial syllable. For ease of comparison, slopes between initial and medial syllables in trisyllables have had their sign changed to allow for uniform interpretation of slopes from initial to second position across di- and trisyllables (i.e. positive is a medial increase, negative is a medial decrease). Finally, Bayesian CIs represent credible ranges of parameter values within which the true value may be expected to fall. The point estimates used to generate the plots which guide the discussion, while useful for summary visualisation, are therefore simplifications and should be treated as such. The direction of a given estimate is of the broadest interest (i.e. whether a credibly non-zero estimate of change across syllable positions is positive or negative), only then followed by the steepness of such a change. By-structure details of credibility, including 95% CIs for by-structure adjustments to population-level intercepts and slopes, are provided in the supplementary materials.
3.1 Expected first-syllable stress
Out of 13 total weight structures with expected initial stress, models for six are able to provide at least one suggestive estimate of cross-positional change for the measures considered, while only two do so for more than one measure. In all cases, it is either or both of maximum intensity and standardised vowel duration which receive these relatively reliable estimates, with estimates for f0 maximum and range always being indeterminate according to the PD criteria outlined in Table 1. These results are summarised visually in Figure 4, in which di- and trisyllable models for the two eras are separated by row, weight structures are separated by column, measure is indicated by colour, and summarised PD values per Table 1 are indicated by linetype. A solid line indicates the strong class, a mixed line (twodash in ggplot2) the suggestive class, a dashed line the tenuous class, and finally a dotted line the indeterminate class.
Summary of model estimates for structures expected to exhibit initial stress. Measure is indicated by colour, summary label of PD values by linetype, and model results are separated into rows by era.

Results for disyllables are fairly straightforward. All models show estimates of multiply-marked initial-syllable prominence in both eras, though with variable credibility. Slope estimates range from –.06 for maximum f0 in 2020–21 LL (indeterminate PDs; <75% PD for all posterior parameter distributions) to –.96 for maximum intensity in 1928 XL (suggestive PDs; all distributions ≥95% PD, except for that of the base slope with 93.42% PD). Estimates are strongest for intensity, with suggestive PD values for relevant distributions in four out of eight disyllable models in this category.
Credible estimates for trisyllables are less sharply defined, but where estimates characterised by suggestive or tenuous PDs are available for intensity and durational prominence, they generally support initial prominence. There are some exceptions. Turning first to vowel duration in the structure HLL for both eras, apparent estimates of final durational prominence are contradicted by estimates of initial intensity prominence. This is returned to below in discussion of divergence between measures. Second, there is a tenuously supported estimate of medial intensity prominence for LLL items in the 2020–21 data. This prompted a remodelling of these data with two high-frequency lexical items excluded (‘LLL-Restr’ in Figure 4), returned to in more detail below. Finally, estimates of positional change in f0 maximum and range can be seen to be both very modest in scale and indeterminate in terms of component PDs with the exception of single flat estimate in the tenuous category for second to third syllables in 2020–21 LLL.
Cases of divergence between measures are of particular interest. For disyllables, this only emerges for the light–light (LL) category with a split between (weakly) negative slopes for intensity and durational prominence on one hand and (very weakly) positive slopes for f0 maximum and range on the other. However, all of these estimates are very modest and are based on indeterminate distributions in terms of PD. LL was by far the most frequent structure in the data (1928, N = 2,358; 2020–21, N = 2,404), but given the domination of this category by the function word agus /agˠʊs/ ‘and’, which is expected to be reduced in speech, the lack of more robust estimation is not surprising. If at all reflective of a real effect, a shallow increase in f0 across items of this structure could be coincidental, or could reflect a tendency for a transitional rise in f0 towards a later high target in the utterances measured.
Turning to the trisyllables, there are some cases of divergence between measures, but generally these are between flat and/or indeterminate estimates for f0 maximum and range and more informative intensity and/or durational estimates. The most notable contradictions are between estimates of initial or medial intensity prominence and final or ambiguous durational prominence for HLH, HLL, and LLL. Given the lack of contextual control for these data, it is conceivable that vowel duration is frequently affected by utterance or phrase-level rhythmic factors. Words with HLH structure – led by Áibhirseoir /ɑːvʲɪɾʲʃoːɾʲ/ ‘adversary, Satan’ in the 1928 data (N=3, approximately 14% of HLH items) – have previously been noted for their ambiguity and instability for stress, including by Ó Sé (Reference Ó Sé1989) who cites generational change towards final stress in words like cúirimí /kˠuːɾʲɪmʲiː/ ‘cares, worries’. HLL meanwhile (1928, N=52; 2020–21, N=55) is led in the 1928 corpus by tuarastail /t̪ˠuəɾˠast̪ˠalʲ/ ‘wages’ (N=8, 15%) and laethanta /lˠeːhan̪ˠt̪ˠa/ ‘days’ (N=7, 13%), and in the 2020–21 corpus by láthairse /lˠɑːhaɾʲʃɛ/ ‘presence.EMPH’ (N=22, 40%). The apparent final durational prominence estimated for HLL is particularly unusual, and it is highly unlikely that this reflects lexical stress. The more dramatic final rise estimated for 2020–21 HLL (suggestively supported 1.34) is likely driven by phrase-final láthairse subject to rallentando at a boundary.
Looking further into the LLL case, it is clear that this category in the data is dominated by the word abhaile /əˈvˠalʲɛ/ ‘home(wards)’. Crucially, abhaile exhibits peninitial stress in all Irish varieties due to derivation from a historical compound. This comprises 17% of LLL observations in the 1928 data (N=12, 47%), outnumbering the next most frequent item airgid /aɾʲɪgʲɪdʲ/ ‘money.gen’ roughly two to one. In the 2020–21 data, this overrepresentation is more pronounced, with cases of abhaile comprising 46% of the 106 LLL observations, outstripping the second most frequent item uireasa /ʊɾʲasa/ ‘need(iness)’ (N=12) by over four to one. There are therefore strong grounds to consider that abhaile may not be representative of productive stress patterns in MI, and that its outsized contribution to the 2020–21 trisyllable models is a source of distortion.
When 2020–21 trisyllables are remodelled with abhaile tokens excluded, the estimates for LLL are markedly different (‘LLL-Restr’ in Figure 4, showing maximum intensity and, for comparison, maximum f0 which had tenuous estimates of initial prominence in the original model). The new estimated slopes in intensity now suggests initial prominence followed by a syllable-on-syllable decline (–.44 from initial to medial position, –.32 from medial to final position), albeit now with greater ambiguity (indeterminate according to the specified PD criteria) in contrast to the stronger estimates of medial prominence in the original model. This indeterminate classification, however, is due only to the PD of the by-structure adjustments, only one of which has >75% PD. PDs for the distributions of the population-level intercepts and slopes are over 80% (and over 95% in the case of the slopes alone), with all three suggesting a default initial prominence (–.63 [95%–1.07, –.24] to an intercept of –.15 [95%–.47, .14], followed by –.29 [95%–.05, .06] to final position). Thus, there are grounds for inferring initial intensity prominence in this structure as a reasonable possibility. The remodelled estimate for maximum f0, meanwhile, continues to show a negligible preference for the initial syllable (–.16 [95%–.34, .05] from initial to medial position).
To summarise, model results of reasonable credibility according to the criteria defined for this discussion obtained for structures expected to exhibit initial stress in MI are generally in line with prominence on initial syllables. Estimates of cross-syllable change in f0 maximum and range appear to be of weaker credibility than those for maximum intensity and vowel duration. Discussion continues in the following section for items expected to exhibit stress on second syllables.
3.2 Expected second-syllable stress
Figure 5 presents estimates for structures expected to exhibit stress on second syllables (either the final syllable of a disyllable, or medial syllable of a trisyllable), following the same PD labelling criteria as in Table 1 and Section 3.1. As seen for expected initial-stress structures in Section 3.1, estimates are somewhat more consistent in their directionality for disyllables, although fewer estimates meet the PD criteria to be classed beyond indeterminate in the labelling scheme. Estimates of final prominence are strongest for the structures LX and LH, with suggestive PD values. Both of these structures are prototypes for the MI ‘stress shift’ as typically described (e.g. for words like light–/ax/ gealach /gʲalˠax/ ‘moon’ and light–heavy garsún /gˠaɾˠsuːn̪ˠ/‘boy, lad’). Estimates of final prominence emerge for heavy–heavy (HH) items also, led by words like cónaí /kˠoːn̪ˠiː/ ‘home, dwelling’ (1928 N=13, 13%; 2020–21 N=22, 24% and roughly equal with dtabharfaí /d̪ˠaʊɾˠfˠiː/ ‘would be given’ N=21, 23%), but this is notably not the case for intensity which instead shows estimates of initial-to-final decline in models for both eras (1928 –.48; 2020–21 –.37). Notably, while in Figure 5 all HH estimates are classed broadly as indeterminate, for initial intensity prominence in both eras, this results from low-PD adjustments (<75%) to high-PD population-level estimates of initial prominence (>95% PD for an above-average intercept, >90% PD for a negative slope with mean values of –.34 [95%–.79, .11] (1928) and –.34 [95%–.77, .13] (2020–21)). By contrast, corresponding estimates of final prominence for the other measures involve low PD across three of four component distributions. While simplified linear estimates for all four measures should be treated with scepticism, there are grounds for considering that intensity is being more reliably estimated in terms of directionality. This finding is consistent with such cases of adjacent heavy syllables at the left edge of words being previously described as having ambiguous prominence distribution (cf. O’Donovan Reference O’Donovan1845, cited in Section 1.1), and calls an impressionistic attribution of final lexical stress in this structure into question.
Summary of model estimates for structures expected to exhibit second-syllable stress. Measure is indicated by colour, summary label of PD values by linetype, and model results are separated into rows by era.

Turning to the two structures with /ax/ in second position (LX and LXL), there appears to be a conflict in the treatment of /ax/ for weight purposes. Both structures contain /ax/ in second position. LX shows second-syllable slopes ranging from .13 for 2020–21 maximum f0 to .67 for 1928 vowel duration in the indeterminate class. There is a single suggestive estimate for 1928 maximum intensity of .6. Meanwhile, LXL – attested only in the 1928 data – shows initial prominence for vowel duration and intensity. The credibility for estimates of both measures is mixed; slope estimation is more dramatic but PD-indeterminate for vowel duration (–1.57), while for intensity it is shallower (–.61) but somewhat more reliable (tenuous). For vowel duration, the indeterminate classification for both syllable transitions is conditioned only by a low-PD (61.2%) for by-structure intercept adjustment. By-structure slope estimates themselves are actually quite robust (99.98% and 96.05% PD) in suggesting a negative slope from initial to medial position and a positive one from medial to final position, despite an ambiguous medial-syllable intercept. The situation is similar, though less marginal, for intensity. The intercept has a minimal 75%-PD value at the population level, and similarly questionable by-structure slope adjustments. Nevertheless, the population-level slope estimates, if these can be taken on their own terms when an ambiguous by-structure adjustment is excluded, indicate a initial-to-medial decline (–.37 [95%–.72, .01], PD 97.7%) followed by a further decline to final position (–.25 [95%–.55, .06], PD 95.58%). This does not resemble medial prominence an /ax/ syllable, and leaves open the credible possibility of initial intensity and durational prominence in LXL structures.
Turning to disyllabic LX, this category is dominated by adverbs amach /əˈmˠax/ ‘out’ and isteach /ɪˈʃtʲax/ ‘in’, which derive from the same type of historical compound with an unstressed initial syllable as earlier LLL abhaile in Section 3.1. Like abhaile, these two adverbs have uncontroversial stress on the second syllable in all dialects of Irish. In the 1928 corpus, these represent a combined 44% of LX tokens (amach N=43, 23%; isteach N=37, 21%). In 2020–21 data, amach alone leads the category at 42% (N=37), with isteach ranking third in frequency at only 11% (N=9).
Estimates change rather dramatically if tokens of isteach and amach are removed from consideration (‘LX-Restr’ in Figure 5). For the 2020–21 data, there are estimates of initial prominence for intensity and vowel duration in the suggestive and indeterminate classes, respectively. For the 1928 data, there is a strong but flat estimation across the two syllables for intensity, and, as for the corresponding 2020–21 model, indeterminate estimation of initial durational prominence. For the latter, unlike for the 2020–21 remodel, there is marginal evidence of a population-level decline (–.18 [95%–.56, .19], PD 85.35%) from an above-average initial syllable (.12 [95%–.07, .33], PD 89.4%); the indeterminate classification is driven by <75% PD for by-structure adjustments for the LX category, which does not eliminate the possibility of a default decline in vowel duration independent of this adjustment. When broken down further into estimates for individual speakers (see Figure 6), it is clear even within the 1928 data that estimates for the apparently highly credible intensity measure vary widely across speakers and within subregions with regard to the treatment of this final /ax/ syllable. In light of the mixed and lexically-specific findings for disyllabic LX, this in combination with the findings for trisyllabic LXL strengthens the case against a genuine, productive exceptional medium-heavy weight status for /ax/, consistent with Kukhto (Reference Kukhto2019).
95% CIs for the remodel of maximum intensity in the 1928 light–/ax/ data with high-frequency amach/isteach excluded. A clear split is evident between speakers who place intensity prominence on final /ax/ and those who favour the initial light syllable instead.

For trisyllables involving medial heavy syllables, maximum intensity and standardised vowel duration are once again the most reliably estimated measures with several suggestive PD classifications and a single strong one. Some estimates are at least weakly consistent with expectations of medial stress, but there are notable exceptions for all seven structures in this category. In nearly all cases, there are estimations of initial intensity prominence of varying credibility, contrary to the expected location of lexical stress. For some structures, this is matched by estimates for duration (e.g. 1928 LXL), while for others it is contradicted (e.g. 2020–21 HHL). The exceptions to this are LHL and 1928 LHX (i.e. structures with a single heavy syllable in medial position), in which estimations for both intensity maxima and vowel duration either peak in the medial syllable or at least do not decrease from initial position, roughly in line with expected medial stress.
To summarise, expectations of second-syllable prominence are broadly met for structures that contain a single heavy syllable in this position, but are less (or more ambiguously) supported for structures with competing heavy syllables or relying on second-syllable /ax/. The implications of this for the reliability of MI stress descriptions are returned to in Section 4. As for the structures treated in Section 3.1, maximum intensity and vowel duration are the measures for which estimates of cross-syllable change are most reliably returned by the models according to the classification scheme in use. The report of statistical findings concludes in Section 3.3 with discussion of trisyllable structures expected to exhibit final stress before a brief summary is given in Section 3.4.
3.3 Expected third-syllable stress
Finally, the three structures with expected third-syllable stress should exhibit a clear increase in prominence from medial to final position, possibly with a transitional increase from initial to medial position. Estimates are summarised in Figure 7. Note that the structures LXH and XLH are exclusive to the 1928 and 2020–21 data, respectively.
Summary of model estimates for structures expected to exhibit third-syllable stress. Measure is indicated by colour, summary label of PD values by linetype, and model results are separated into rows by era.

Strikingly, final prominence is scarcely in evidence for these three structures. It is best attested for 1928 LLH, for which there is a strong estimate of final durational prominence with a .75 increase from medial position. This technically has support from an ‘indeterminate’ final increases in maximum intensity and f0 range. The final increase in intensity is kept indeterminate only by the PDs of its intercept distributions (i.e. what level the possible increase begins at); PD for the adjustment of the medial-to-final slope to a positive one (approximately .16) is 96.12%. For the same structure in 2020–21, however, there are mixed estimates of initial prominence (on a light syllable) for both intensity and duration. For intensity, this includes population-level default estimates of cross-syllable decline from initial position, namely initial-to-medial –.55 [95%–1.03, –.08] (PD 98.6%) and medial-to-final –.32 [95%–.04, .64] (PD 96.32%). Vowel duration similarly has a population-level estimate of initial-to-medial decline –.3 [95%–.83, .23] (PD 88.9%). For 1928 LXH, there are indeterminate estimates of intensity and vowel duration peaking in the initial light syllable before marked declines to medial position (–.52 for intensity, –.54 for vowel duration). As for LLH, the classifications for these is reduced due to intercept and slope-adjustment factors, and the evidence for a structure-blind cross-syllable decline is in fact reasonably clear.
Initial prominence estimates in direct contradiction of expected final-syllable stress are most striking for 2020–21 XLH, with suggestive and tenuous estimates of initial peaks and below-average medial syllables for both intensity (–1.03) and duration (–1.66). There are only 12 tokens of XLH in the data, all of which are instances of a single lexical item achainí /axanʲiː/ ‘petition’, which was one of the anecdotal instances of final MI stress provided by O’Rahilly (Reference O’Rahilly1932: 86) and cited in Section 1.1. Given the weakened evidence for /ax/ belonging to a separate, non-light weight category, it may be more straightforward to consider this simply as a subtype of LLH. This would strengthen the overall evidence for initial intensity and durational prominence for an expanded LLH category for 2020–21 speakers, apparently in contrast to weak evidence in favour of final prominence in 1928. In any case, it is notable that for this single, repeated item the final heavy syllable apparently fails to credibly exhibit signs of final prominence for the two measures otherwise most robustly estimated in other structures in these data. Indeed, these two measures indicate initial prominence with joint high credibility. This is particularly interesting as achainí is not morphologically derived (for example, it is not a plural unlike many polysyllabic /–iː#/ items in Irish), which eliminates the possibility of derivational morphology interfering with stress assignment.
3.4 Summary
In summary, estimates of cross-syllable change in maximum intensity, maximum f0, f0 range, and standardised vowel duration were obtained from a series of mixed-effect linear regressions of the di- and trisyllable data. In some cases, estimates for these measures were at least broadly consistent with previous descriptions of stress location for MI in dialectological literature. Cases which either contradict or fail to clearly support expected stress location also stand out, such as XLH (Section 3.3), HHX (Section 3.2), or the restricted remodel of LX (Section 3.2).
Maximum intensity and standardised vowel duration stood out as more likely to receive reasonably credible estimates of positional change than the two f0 measures, particularly for trisyllables. This could indicate a phrase-level control of f0 that may correlate with lexical stress but is not a direct exponent of it. In limited cases of at least marginally credible estimation, f0 height and range these estimates do not generally track the more robustly estimated intensity and duration.
4. General discussion
The findings outlined in Section 3 are mixed with regard to dialectological descriptions of stress location in MI. They are most consistent with these descriptions in cases of lone, non-initial heavy syllables (i.e. syllables containing long vowels or diphthongs). With that said, support is not uniform across structures, purportedly ‘forward stress’-eligible or otherwise. In particular, intensity prominence was frequently seen to favour initial syllables even in cases of expected second-syllable stress (Section 3.2), and statistical support for third-syllable prominence was questionable. This therefore represents an important, though preliminary, empirical contrast to impressionistic descriptions previously used to support theoretical claims based on the MI stress system, especially for structures with competition between heavy syllables (discussed in Section 4.2 below). A number of questions remain regarding the credibility/robustness of many of the estimates and the productivity of stress assignment in these varieties. These are treated in turn in Sections 4.1–4.3.
4.1 Single heavy syllables
Standing out as the most robustly marked for prosodic prominence are disyllables containing only a single heavy (or /ax/) syllable, namely LX, LH, HL, and HX. It is satisfactory as a baseline check of historical impressionistic descriptions, that the prototypical ‘stress-shift’ structure LH shows estimates of second-syllable prominence for all four measures considered in models of both the 1928 and 2020–21 data. In other words, there is some evidence for these structures exhibiting above-average intensity and f0 maxima, wider-than-average f0 range, and long vowels of above-average duration. The estimates for LH in Figure 5, particularly when depicted as conveniently calculated linear changes, require caution before any strong inference, but weak agreement across all modelled measures is noteworthy. Based on two tokens of XH in the 1928 data, there is a PD-indeterminate estimate of final durational prominence. By contrast, structures HL and HX with a single, initial heavy-syllable summarised in Section 3.1 show multiply-marked initial prominence, most convincingly for intensity.
Results for LX, the main structure cited in favour of an exceptional medium- or pseudo-heavy status for the sequence /ax/, initially parallels LH, but remodels of this with high-frequency LX items amach and isteach removed return estimates of initial prominence (albeit weaker ones). This is particularly notable for the 2020–21 data, and recall that for the 1928 data there was considerable individual variation behind what appeared to be more ambiguous estimates of final-syllable intensity.
For trisyllables with a single heavy syllable, estimates were generally less robust but in the main had estimates of heavy-syllable intensity prominence in common. Importantly, this was not the case for any three of the four cases of structures in the data expected to exhibit third syllable prominence (LLH in both eras, 1928 LXH, and 2020–21 XLH). In these cases (2020–21 LLH, LXH, XLH), both intensity and vowel duration – with variably credibility – favoured initial syllables as the most prominent.
In all cases, there are accompanying estimates of cross-syllable changes in relative vowel duration of mixed credibility with some more robust exceptions, but this does not always intuitively track stress location according to either historical norms (i.e. initial position) or expected/described MI norms. For example, there is a suggestive estimate of a final durational increase for 2020–21 HLL (Section 3.1). As it is highly unlikely that this reflects lexical stress on a non-initial light syllable, it is worth considering the extent to which this durational measure is impacted by broader rhythmic factors. This casts doubt – or at least scepticism – on the reliability of vowel duration as a diagnostic of stress location in MI, particularly when another measure contradicts it (as is the case for highly credible initial intensity prominence in the 2020–21 HLL example from Section 3.1). Recall also that Irish has a phonological length contrast in its vowel system, which may hinder the functional load that can be allotted to vowel duration as a stress marker, as noted in Section 1.4.
4.2 Competing heavy syllables
Six structures of this type were attested in the data (HLH in Section 3.1, HH, HHH, HHL, HHX, LHH in Section 3.2), with tenuous to suggestive estimates for three of these.
All-heavy disyllables (HH) show marginal evidence of longer relative vowel duration, wider f0 ranges, and higher f0 maxima in their final syllables. Estimates for intensity of initial prominence almost directly contradict these, and recall from Section 3.2 that while classed as indeterminate along with the other three measures, only for intensity is there a high-PD population-level estimate of cross-syllable decline without reference to the random effects. While this does not rule out the possibility of some form of final-syllable prominence for this structure, it does raise questions about the robustness and phonological status of such prominence, not least given counterintuitive distribution particularly of durational prominence in other more clear-cut cases of expected initial stress.
Findings for trisyllables containing more than one heavy syllable are far more problematic for simple claims of non-initial stress. In all cases but one (1928 HHH), there are estimates of initial intensity prominence, albeit with at best suggestive and often indeterminate classifications. In only one instance (2020–21 HHL) is this clearly contradicted by an estimate of medial durational prominence of higher (suggestive) credibility. Taken as a whole, these findings are more in line with 19th-century descriptions of ambiguous, distributed prominence between adjacent heavy syllables at the left edge of MI words, and suggest that later impressionistic descriptions of non-initial stress for such structures must be treated with caution.
4.3 Implications
4.3.1 Phonetic exponents of lexical stress in MI
It is clear on the basis of these findings even without controlling for context (utterance length, information structure, position of a given word within the utterance, etc.; see limitations outlined in Section 2.1.2) that MI speakers in both eras exhibit classic signs of lexical stress. For the majority of weight structures attested in the data, there is some estimation of positional change in one or more cross-linguistically typical phonetic exponents of phonological stress, with better estimates according to the defined evaluation criteria nearly always being for either or both of maximum intensity and vowel duration when extant. This is not surprising on the basis of historical descriptions of Irish as a ‘stress’ language, but is useful to establish without recourse to impressionistic descriptions as a matter of principle.
How these positional changes manifest, or at least availability of credible evidence for such manifestation, appears to differ between di- and trisyllables. In particular, disyllables tend to show a neat bundling of features with little to no cross-measure contradiction in directionality. This might be characterised as evidence for a promotion of the ostensibly stressed syllable (initial or final) to receive prosodic prominence including at the phrase level. In trisyllables, however, this is not so clear. F0 measures (maximum and range) generally did not receive significant estimates of any notable credibility, and contradiction between intensity and vowel duration was not uncommon. Here the relative infrequency of many of the trisyllabic weight permutations must be taken into account, in addition to the lack of positional control on the various tokens, and the blunt, composite nature of the classification labels employed in summarising multiple distributions for each linear estimation.
These findings at least suggest that lexical stress in MI may be multiply marked, although the reliability and/or priority of the different measures considered remains an open issue. Vowel duration is particularly unusual in its behaviour with reference to any plausible stress location in some structures. For example, 2020–21 LLL and HLL are estimated to have their longest vowels (relative to phonemic length category) in final position; in no dialect of Irish is there a trisyllable in which a final light syllable bears stress. Still, there is no reason to believe that there is a consistent syllable-on-syllable stretching of vowel duration given the many trisyllable structures with clear initial or medial durational prominence. A reasonable compromise may be that vowel duration is available for supportive encoding of lexical stress location but may be subject at a higher-level to utterance-rhythmic considerations. Further investigation of the positioning of e.g. 2020–21 LLL and HLL tokens in the utterances in question would contribute to understanding this.
Turning then to f0 height and range, there is a reasonable expectation of some association between high pitch targets and lexically stressed syllables on the basis of previous dialectological and intonational studies of these and other Irish varieties. But, to take this for granted comes with risks. There are Irish varieties, uncontroversial for lexical stress purposes, with both pre-nuclear and nuclear rising pitch accents L*+H (Dalton Reference Dalton2008: 108–110; Dorn Reference Dorn2014: 259–264). At least in blunt terms, the main distinction between such an L*+H and an L+H* (or a sequence of H*+Ls) on a di-, tri-, or polysyllabic word comes down to a reliable identification of which syllable is otherwise metrically strongest. Here, one of the few cases of non-indeterminate estimation for f0 maximum and range (LLH, Section 3.3) is important to consider.
Aside from LLH, there are virtually no instances in which either f0 measure contradicts a credible change in intensity to any notable degree (i.e. slopes are very modest) or with any significant credibility. In cases such as that of heavy–heavy disyllables, caution should be exercised in equating the location of wider f0 ranges and higher maxima directly with the location of lexical stress where non-f0 support comes from vowel duration and is contradicted by estimations of change in intensity. On the one hand, it is plausible that for adjacent heavy syllables, a distinction in metrical strength based on amplitude is not sufficiently salient, with other strategies based on duration and/or pitch being preferable. On the other hand, it may be the case that these items are not reliably final-stressed. There are fewer than 100 tokens of HH structures in either era (total N=187), with a variety of lexical items. While it is possible to descriptively identify weakly credible trends consistent with increased and wider f0 excursions in the second half of these structures, we are left with the possibility of variable stress patterns (of the type that might be otherwise identifiable by intensity) acting in conjunction with phrase-level intonation.
Similar questions concerning acoustic correlates of weight-sensitive lexical stress, interaction between lexical- and phrasal prosody, as well as parallels in terms of change and descriptive challenges arising from heavily imbalanced contact with English have been raised for Māori (Thompson et al. Reference Thompson, Watson, Harlow, Maclagan, Charters, King and Keegan2011; Mixdorff, Watson & Keegan Reference Mixdorff, Watson and Keegan2018; Culhane Reference Culhane2024). Comparison of these issues in the cases of Māori and Irish may be a fruitful avenue for future cross-linguistic research.
4.3.2 Productivity of stress assignment in MI
Given unresolved questions of structural frequency and variability in estimation (and credibility) of prominence marking, we must consider the question of productive phonological processes or constraints underpinning the observed patterns. Having ruled out the possibility that Irish is actually stressless at the lexical level, the other extreme would be to suggest basically unpredictable stress. The latter is also not satisfactory, particularly given the total lack of evidence for contrastive stress in the language (MI included).
A plausible compromise analysis is that MI, and perhaps Irish more generally, has weak stress, with a tendency towards lexicalisation and a consequent tendency towards analogical extension. Following Hyman’s (Reference Hyman and van der Hulst2014) cross-linguistic discussion of stress research, one might suggest Irish to be a language that does not ‘care’ much about stress, albeit not to the extent of not exhibiting stress phenomena at all. This would be consistent with the interference of uncontroversial but historically exceptional high-frequency lexical items in the modelling of e.g. LX, while allowing for final stress in items such as gealach /gʲalˠax/ (typical MI [gʲəˈlˠax]) ‘moon’ (on the basis of isteach/amach-type stress on final /ax/). Given evidence of multiply-marked prominence on single heavy syllables, we may still reasonably expect weight-sensitivity to form a part of the default stress assignment mechanism in MI. Meanwhile, weak or unconvincing evidence of how competition between multiple heavy syllables in a word (particularly in words of more than two syllables) plays out phonetically leaves much room for additional study. It is of course not possible to collect experimentally controlled data from these or other 1928 speakers, but the author is completing an ongoing analysis of data on controlled nonword production for modern MI speakers (McCabe Reference McCabe2023: 171–206, Reference McCabe2025).
5. Conclusions and directions for future work
While these findings support the general existence of an unfixed and likely weight-sensitive stress system in MI, open questions remain about phonetic exponence, individual variability, the perception of lexical stress by MI speakers, and the productivity of the system. In some instances (e.g. remodelling of light–/ax/ items in Section 3.2), wide individual variation was evident behind population-level estimates of positional changes consistent with descriptions of non-initial stress. Blunt, aggregate considerations may in fact be useful in considering the learnability of the system in question, as a parallel to the community-level input to which a child acquiring MI may be exposed (or have been exposed in the case of the historical 1928 data). Nevertheless, although in the absence of contextual controls for the present data this was difficult to engage with meaningfully, variability in estimates across individual speakers remains of interest. Additionally, there are further measures of prominence not considered in this study due to practical constraints which should rightly be taken into consideration, including spectral tilt and vowel quality. Finally, data on L1 MI speakers’ perception of relative prominence amongst syllables with controlled manipulation of acoustic cues would be particularly useful as a means of assessing relative cue-weighting in the variety.
In conclusion, it is evident that prosodic prominence at the lexical level in MI is consistent with a system of weight-sensitive stress divergent from a historical pattern of initial stress (as retained from Old Irish in western and northern varieties of Modern Irish). Syllable position alone does not act as a reliable predictor of how maximum intensity, maximum f0, f0 range, or vowel duration will behave, with wide variability across different permutations of syllable weights. Persistent ambiguity in the credibility and robustness of estimates of non-initial prominence in the more theoretically interesting cases of MI ‘stress shift’ raises inevitable questions about the stability and productivity of the phonological processes and representations underpinning these data.
Acknowledgements
Parts of this research were supported by grants from Trinity College, Dublin (Postgraduate Ussher Fellowship; 2018–2021), the Irish Research Council (GOIPG/2021/216; 2021–2022), and the Government of Ireland (2018–2023) via the support of the Department of Arts, Culture, Heritage and the Gaeltacht for the ABAIR initiative. An earlier stage of this study appeared in my Ph.D. dissertation (McCabe Reference McCabe2023: 106–170). Elements of this work were also presented as a poster at Phonetics and Phonology in Europe VI (Radboud University Nijmegen, June 2023) and as an oral presentation at Teangeolaíocht na Gaeilge / Linguistics of the Gaelic Languages (Royal Irish Academy, June 2023). I am grateful to Ailbhe Ní Chasaide, Diarmuid Ó Sé, Francis Nolan, Kerri-Ann Butcher, Stefano Coretta, and two anonymous reviewers for their feedback during various stages of this work’s preparation. Any remaining errors or shortcomings are my own.
Competing interests
The author declares none.

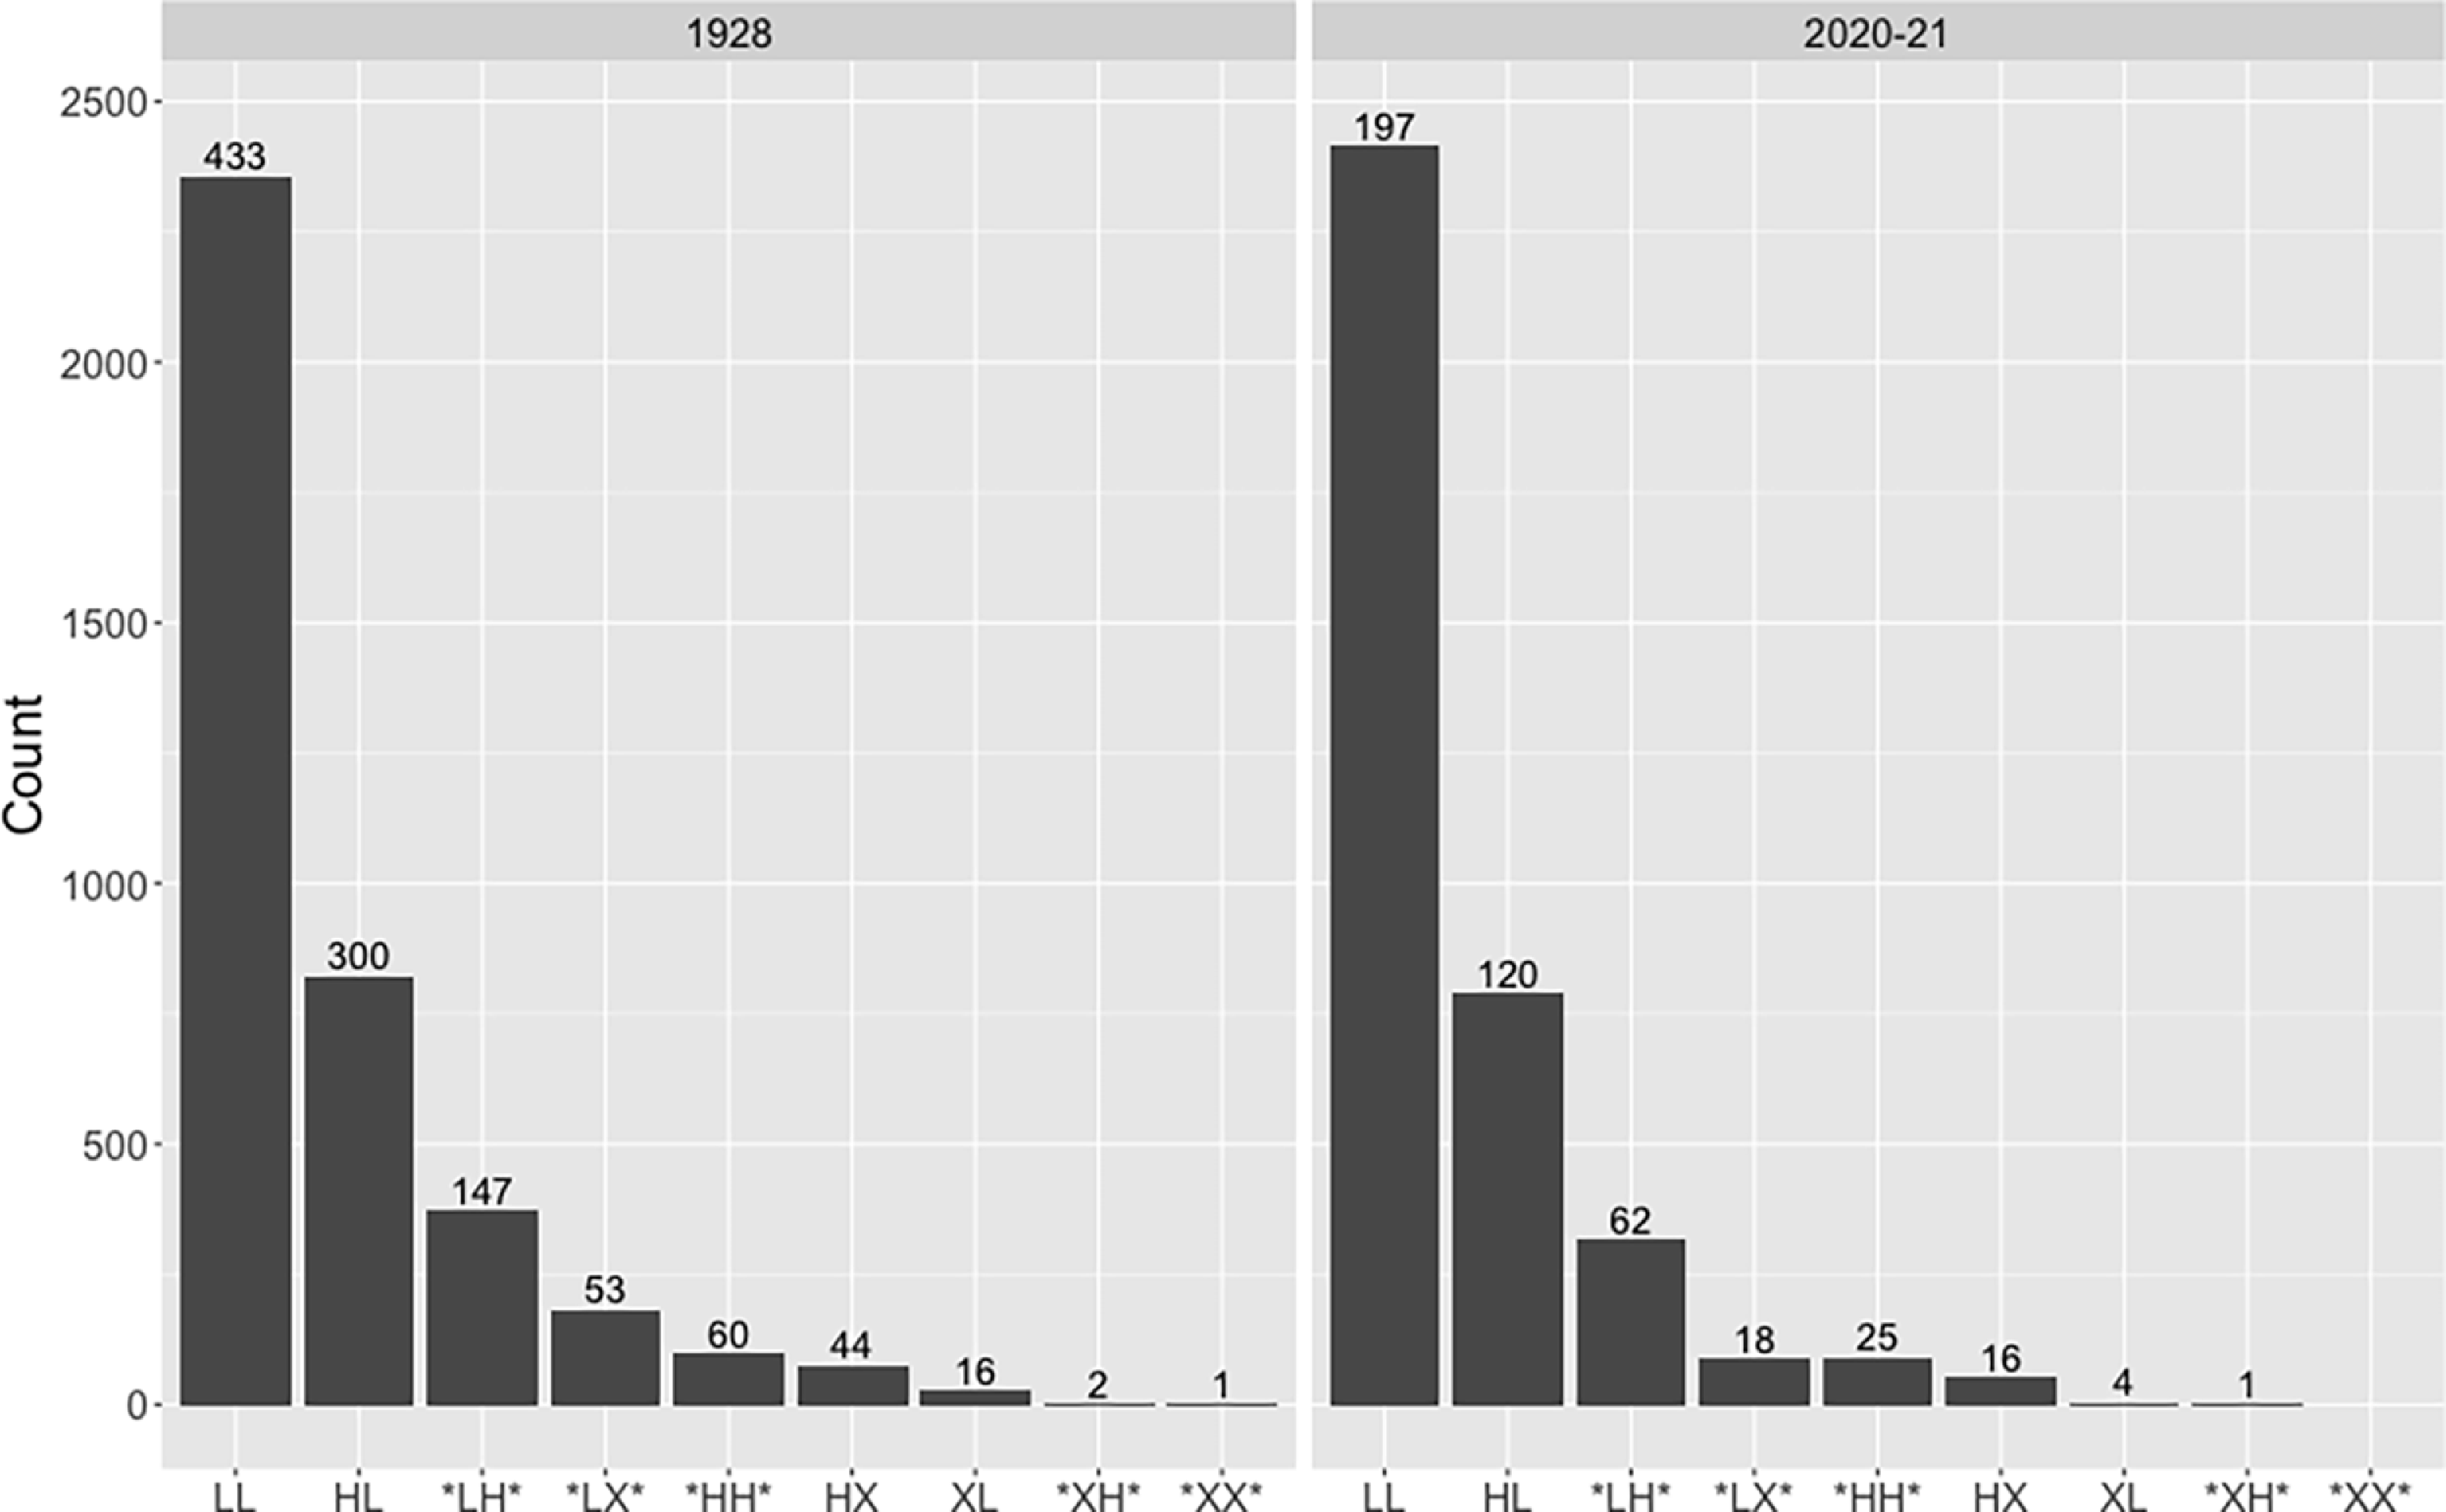
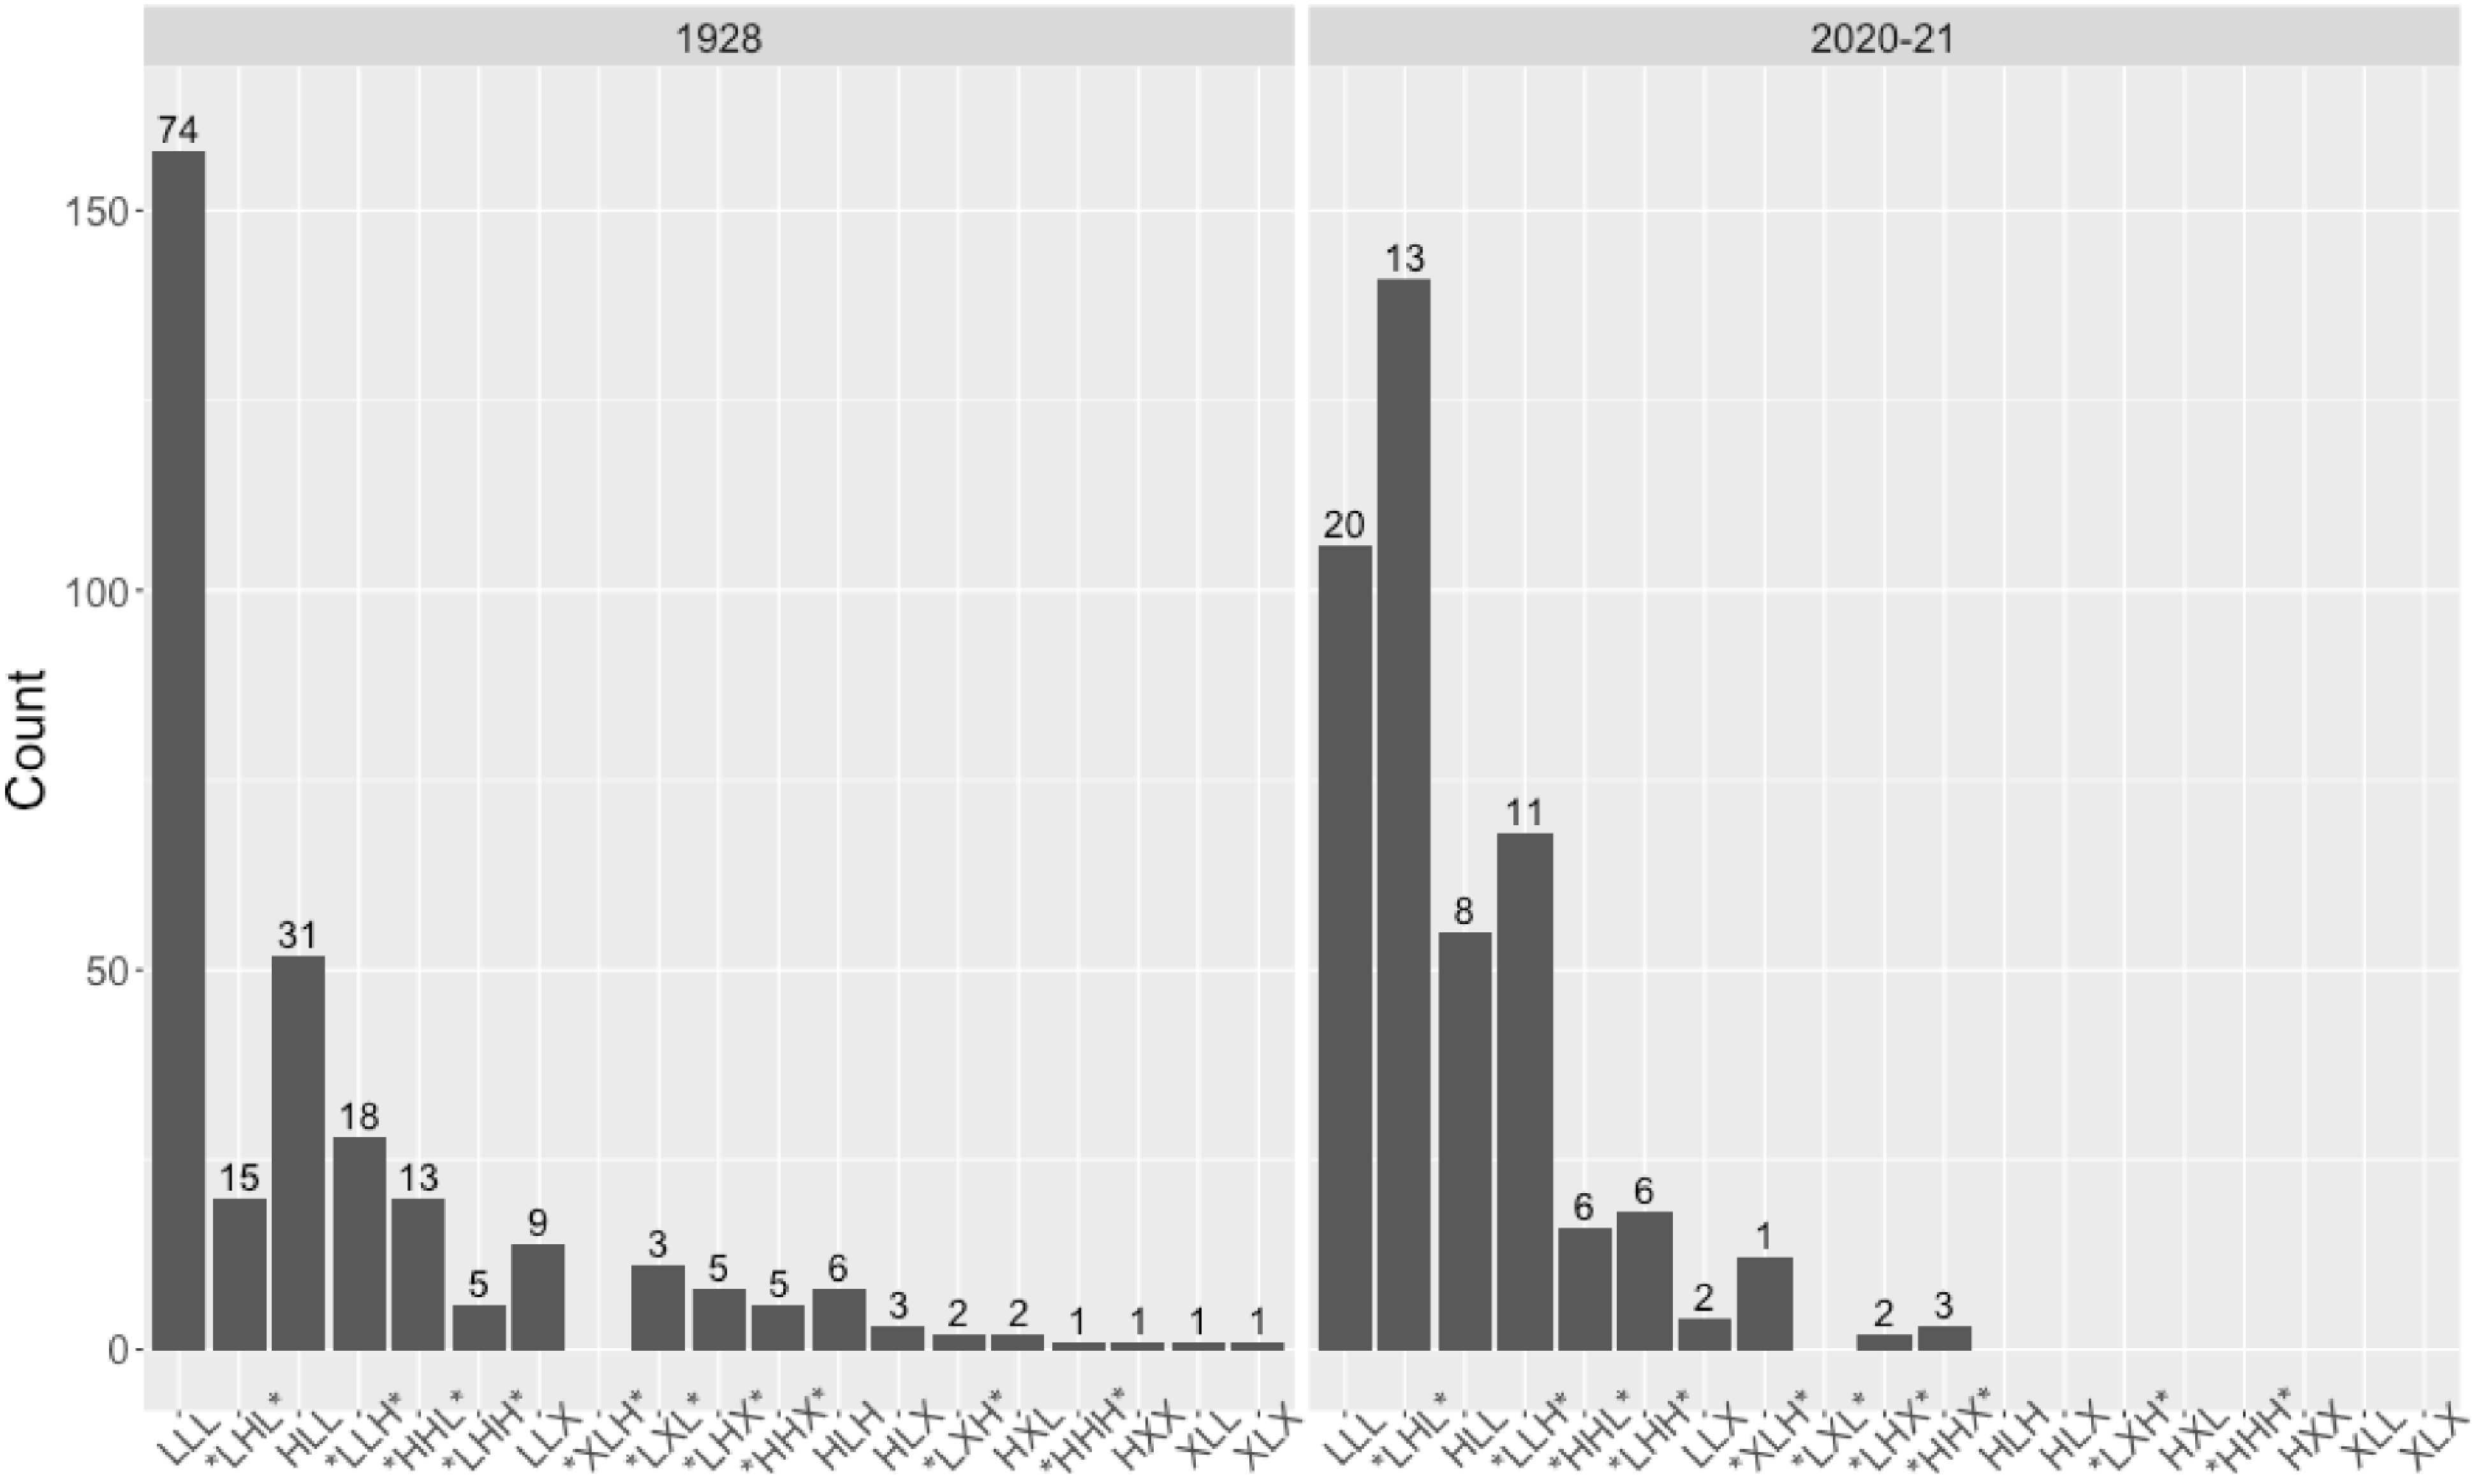
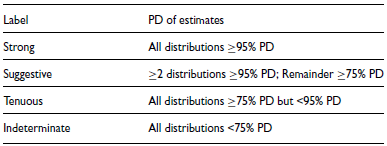
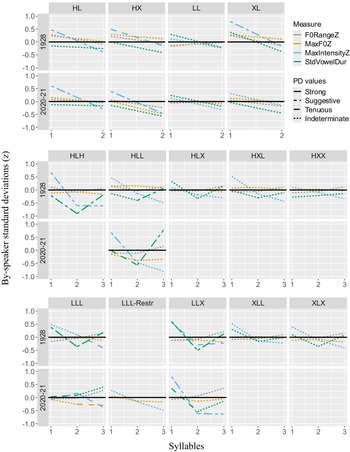


 Open access

