




As populations age rapidly across many countries worldwide, addressing the socioeconomic impact of this change has become a pressing issue for these societies. In Europe, the share of the population who were 65 or over was 17.6 percent in 2015 and is projected to reach 28.5 percent by 2065. In East Asia, the world region where populations are aging at the fastest rate, the share of the elderly population is projected to reach 30.9 percent by 2065 (Horioka et al. Reference Horioka, Morgan, Niimi and Wan2018). Most research on population aging has focused on its economic impacts, such as labor shortages and welfare burdens (Kluge Reference Kluge2013; Powell and Cook Reference Powell and Cook2009), but the political implications of an aging electorate remain underexplored. Seniors, who tend to be highly engaged politically, could influence legislative behavior through their growing numbers. But legislators do not necessarily focus more on advocating for seniors’ policy interests than other age groups. How does an aging electorate influence the representation of seniors, and how does this influence vary across different electoral contexts?
On the one hand, the aging electorate may empower senior citizens as a political force. Compared to younger voters, older citizens possess greater political resources—such as time, disposable income, and political engagement—making them a highly mobilized group (Fieldhouse et al. Reference Fieldhouse, Tranmer and Russell2007; Munger Reference Munger2022). They not only vote at higher rates but also consume more political information and participate in civic activities at a higher rate (Grumbach and Hill Reference Grumbach and Hill2022; Holbein and Hillygus Reference Holbein and Hillygus2020). Their growing share in the electorate, coupled with their consistently high electoral participation, makes them a potentially powerful voting bloc. In addition, many legislatures are dominated by older politicians, while younger generations are underrepresented, which might further amplify seniors’ presence in policymaking arenas (McClean Reference McClean2020; Stockemer, et al. Reference Stockemer, Thompson and Sundstrom2023). These trends suggest that population aging could, in theory, translate into greater substantive representation for the elderly.
On the other hand, seniors’ growing share of the electorate does not always translate into substantive representation of the group, since lawmakers may find it electorally costly to introduce or pass laws that benefit seniors. Policies that favor seniors’ interests as a group may face opposition from younger generations, triggering intergenerational conflicts. For instance, as many governments in Europe and Asia implement reforms to their pension systems in response to their looming depletion, younger generations are often wary that these changes may unfairly benefit older populations, leaving younger workers to contribute more while facing diminished prospects of receiving similar benefits themselves. In South Korea, despite a longstanding cultural tradition of respecting elders, younger generations are increasingly vocal in their opposition to policies that benefit seniors, such as free public transportation for the elderly. In this context, laws favoring seniors’ interests may alienate younger voters who believe that these laws exacerbate intergenerational tensions.
Against this backdrop, we examine how population aging and electoral contexts shape lawmakers’ incentives to promote substantive representation of senior citizens. While the aging electorate is expected to lead legislators to promote elderly voters’ policy interests at a higher rate than before, district-specific electoral contexts may modify these incentives. Specifically, we expect that legislators from competitive districts will be particularly less responsive to higher shares of senior citizens in their districts, as these legislators have incentives to mobilize a broader class of voters.
We test these theoretical expectations using the case of South Korea. Given the rapid changes in its demographic composition, South Korea is a particularly fitting case to test the effect of population aging on legislative outcomes. While populations are aging is spreading across many regions of the world, South Korea is experiencing this demographic change at a faster pace than any other country (OECD 2019). South Korea is on track to become a super-aging society by 2025, with the population aged over 65 making up more than 20 percent of the population.Footnote 1 This trend is accompanied by the country’s fertility rate of 0.68, which is currently the world’s lowest. This context makes South Korea a “harbinger state” (Lipscy Reference Lipscy2023, 86) that is confronting the politics of aging before other countries.
Our analysis focuses on the 21st National Assembly of South Korea, which started on May 30, 2020, and ended on May 29, 2024. We compiled an original dataset combining over 20,000 bill proposals with district-level information. We then categorized these bills into three groups: (1) those that directly address seniors’ policy interests, (2) those that indirectly affect seniors, and (3) those unrelated to senior issues. Our findings show that legislators are not always more likely to introduce bills that represent seniors’ interests as the relative proportion of senior voters in their district increases. Rather, the share of senior voters in the electorate only is related to bill sponsorship in for legislators in safe seats.
Our research contributes to an emerging scholarship exploring the political implications of population aging. While there is a growing body of work examining the impacts of population aging on overall policy outcomes or descriptive representation of different age groups (McClean Reference McClean2020; Sota Reference Sota and Funabashi2018; Stockemer and Sundstrom Reference Stockemer and Sundstrom2022), few studies have examined how the electoral context shapes how legislators respond to seniors’ policy interests. Our district-level analysis challenges the expectation that population aging naturally leads to greater legislative attention to seniors. Although our analysis focuses on South Korea, the findings provide important insights into democratic representation in many democracies across the world that are undergoing similar fundamental demographic changes.
Our article also speaks to the broader literature on legislative responsiveness. One of the fundamental ideals of representative democracy is that elected lawmakers enact policies that reflect citizens’ preferences (Erikson and Wright Reference Erikson, Wright and Brady2000; Miller and Stokes Reference Miller and Stokes1963; Pitkin Reference Pitkin1967). Yet empirical evidence finds that lawmakers’ legislative behaviors do not always reflect their constituents’ preferences (Ansolabehere, et al. Reference Ansolabehere, Snyder and Stewart2001; Soroka and Wlezien, Reference Soroka and Wlezien2010) and that lawmakers are more responsive to some subgroups than others (Druckman and Valdes Reference Druckman and Valdes2019; Fenno, Reference Fenno1978; Flavin and Nelson Reference Flavin and Nelson2017). While previous works found positive effects of group size on legislative responsiveness (Hutchings, et al. Reference Hutchings, McClerking and Charles2004; Leighley Reference Leighley2001; Vishwanath Reference Vishwanath2025), our findings reveal that this relationship is contingent on the interplay of group size, electoral significance, and district competitiveness.
Substantive representation of senior citizens
This article focuses on substantive representation, defined as legislators acting in the interests of the represented (Pitkin Reference Pitkin1967). Substantive representation is especially important in aging societies, where different age groups exhibit divergent policy preferences, yet political decisions often fail to reflect these divides (Phillips Reference Phillips1998). A large body of research examines how descriptive representation—when legislators share an identity with underrepresented groups—can lead to substantive representation. Studies find that female legislators are more likely to propose bills advancing women’s interests (Franceschet and Piscopo Reference Franceschet and Piscopo2008; Lowande, et al. Reference Lowande, Ritchie and Lauterbach2019; Swers Reference Swers2005; Woo Reference Woo2022), and similar patterns hold for racial and ethnic minorities (Cameron et al. Reference Cameron, Epstein and O’Halloran1996; Wallace Reference Wallace2014; Whitby Reference Whitby2000). These findings suggest that shared identity and socialization can motivate lawmakers to actively pursue policy interests aligned with their identity group (Norris and Lovenduski Reference Norris and Lovenduski1995).
Compared to gender or race, age-based representation has received far less scholarly attention. Different age groups prioritize distinct policy areas: older adults often support expanded healthcare and pension provisions (Busemeyer, et al. Reference Busemeyer, Goerres and Weschle2009; Lynch Reference Lynch2006; Umeda Reference Umeda2022), while younger voters tend to focus on housing, education, and childcare (Laenen Reference Laenen2020; Levitt and List Reference Levitt and List2007). Some younger voters also express resentment toward senior-focused welfare, as they believe it imposes a financial burden on younger generations (Kweon and Choi Reference Kweon and Choi2022). These divides underscore the importance of examining how varying policy preferences across generations affect the political behavior of legislators in the context of an aging society.
However, despite their demographic prominence and high political engagement, senior citizens do not always receive substantive representation. This is surprising given the widespread expectation that a growing, high-turnout group would naturally command more political attention (Flavin and Nelson Reference Flavin and Nelson2017). For instance, older voters are often portrayed as a powerful electoral bloc, yet many seniors continue to experience economic insecurity and weak social protection (Anderson and Lynch Reference Anderson and Lynch2007; Carney Reference Carney2010; Sørensen Reference Sørensen2013). This representation gap raises important questions about how lawmakers respond to the growing influence of seniors in the electorate, and under what conditions their policy interests are prioritized in legislative behavior.
Existing studies on the representation of age groups have largely focused on patterns of political behavior (such as turnout) and on legislators’ demographic characteristics—especially how lawmakers’ own age may shape their legislative priorities. While these studies provide valuable insights into descriptive and identity-based representation, they often overlook how an aging population interacts with another factor that might have an impact on legislative behavior: electoral contexts within districts. In particular, district-level electoral competition in shaping legislative responsiveness to aging constituencies remains underexplored. This gap is especially important as senior voters are not only numerous, but also politically engaged and ideologically committed.
In what follows, we present a theoretical framework that links demographic shifts to legislators’ strategic behavior. We argue that electoral competition moderates how legislators respond to aging populations, and that this interaction shapes the conditions under which senior citizens’ interests receive legislative attention.
Theory: Group size, electoral competitiveness, and substantive representation of senior citizens
Under what circumstances do legislators become responsive to the policy interests of the elderly in their district? In answering this question, we focus on how electoral contexts shape legislators’ incentives to prioritize senior citizens.
A voluminous body of research examines how constituents’ preferences influence representatives’ legislative behavior, such as roll-call voting or bill introductions (Ansolabehere, et al. Reference Ansolabehere, Snyder and Stewart2001; Clinton Reference Clinton2006; Erikson, et al. Reference Erikson, Wright and McIver1993; Miller and Stokes Reference Miller and Stokes1963). Scholars view elections as a central mechanism that enables constituents to sanction representatives who deviate from their policy preferences (Canes-Wrone, et al. Reference Canes-Wrone, Brady and Cogan2002; Powell Reference Powell2000) and to select candidates best positioned to represent those preferences (Miller and Stokes Reference Miller and Stokes1963). This logic suggests that the growing presence of senior voters should lead to greater legislative responsiveness to their interests.
Yet the strength of dyadic representation varies substantially with electoral context. Legislators face constraints including limited time, political capital, and legislative capacity (Mayhew Reference Mayhew1975), while balancing ideological differences between the local district and national party (Ansolabehere, et al. Reference Ansolabehere, Snyder and Stewart2001), as well as those between constituents’ preferences and their own (Erikson and Wright Reference Erikson, Wright and Brady2000). Given these diverse concerns, legislators must strategically choose which groups of constituents to prioritize, often calculating which will deliver the greatest electoral benefits (Aragones and Neeman Reference Aragones and Neeman2000; Clinton Reference Clinton2006; Schiller Reference Schiller1995).
The electoral context—such as district-level competitiveness, voter turnout, or demographic composition—shapes these strategic calculations (Binzer Hobolt and Klemmensen Reference Binzer Hobolt and Klemmensen2008; Flavin and Nelson Reference Flavin and Nelson2017). One key factor shaping legislators’ decisions is the relative size of social groups within their electoral district. In particular, in single-member district (SMD) systems, where candidates must secure a plurality of votes to win, group size translates more directly into political influence (Barkan Reference Barkan1995; Fraga Reference Fraga2018). For instance, Leighley (Reference Leighley2001) shows that politicians tend to mobilize black and Latino voters at a greater rate in districts heavily populated by minority voters than they would otherwise. Similarly, as the proportion of seniors within a district increases, legislators should, in theory, have strong incentives to target that group’s interests to secure their support.
Seniors’ consistently high turnout rates further strengthen legislators’ incentives to represent their policy interests. Politically engaged voters can effectively communicate their policy interests, and their reliable turnout in upcoming elections gives legislators with re-election motives to respond to those interests (Griffin and Newman Reference Griffin and Newman2005). Research shows that lawmakers often prioritize policies that benefit large and politically engaged groups (Hajnal and Trounstine Reference Hajnal and Trounstine2005; Martin and Claibourn Reference Martin and Claibourn2013) and vote based on the preference of voters who regularly turn out rather than non-voters (Flavin and Nelson Reference Flavin and Nelson2017; Griffin and Newman Reference Griffin and Newman2005).
Consistent with this argument, South Korean seniors consistently vote at higher rates and engage in political activities more actively than younger cohorts (Bhatti, et al. Reference Bhatti, Hansen and Wass2012; Einstein, et al. Reference Einstein, Palmer and Glick2019; Goerres Reference Goerres2007). In South Korea, voters aged 60 and over have consistently maintained the highest turnout rates across recent elections. In the 18th Presidential Election (2012), their turnout reached 80.9%, substantially exceeding voters in their twenties (68.5%) and thirties (70.0%). This pattern persisted in the 19th Presidential Election (2017), with voters in the over-60 age group recording 79.1% turnout compared to 76.2% for those in their twenties and thirties, respectively. Most recently, in the 20th Presidential Election (2022), the gap widened further: voters in their sixties achieved 87.6% turnout, far outpacing those in their twenties (71.0%) and thirties (70.7%).Footnote 2 These trends suggest that high senior turnout is a stable behavioral pattern rather than a response to short-term campaign mobilization efforts. Given their demographic prominence and consistently high turnout, representatives should face strong incentives to represent seniors’ policy interests.
However, legislators’ responsiveness to the growing political presence of seniors in their districts varies substantially (Anzia Reference Anzia2019). We theorize that electoral competitiveness plays a crucial role in determining legislators’ responsiveness to seniors’ policy interests. Specifically, building on the existing models of electoral incentives to target swing voters, we expect district-level electoral competition to moderate how the size of senior voters in the district shapes legislative representation of this demographic group. Legislators often use bill sponsorship as a key signaling mechanism to demonstrate their commitment to targeted beneficiary groups (Fiorina Reference Fiorina1973; Griffin Reference Griffin2006; Wittman Reference Wittman1983). Sponsoring a bill sends a signal to constituents that a legislator is advocating for their political interests and regards them as important enough to take on the effort and costs involved in the process (Rocca and Sanchez Reference Rocca and Sanchez2008; Schiller Reference Schiller1995). However, introducing a bill that advances one group’s interests often comes at the expense of advocating for other groups, requiring legislators to carefully weigh potential electoral benefits against on another (Schiller Reference Schiller1995). Thus, legislators must calculate whether sponsoring legislation primarily benefiting seniors exceeds the opportunity cost of not addressing other constituencies’ needs.
This concern is especially salient in competitive districts, where the electoral rewards of appealing to any single demographic group are diminished. In highly competitive districts, where incumbents lack a large base of electoral support, the potential costs of targeting a specific voter bloc are likely to weigh more heavily than in safe districts. Consequently, the positive relationship between senior population size and senior representation should be weaker in competitive districts than in safe districts. Moreover, incumbents may have electoral incentives to prioritize targeting other voter groups over senior voters, who already exhibit high turnout and stable voting patterns. Scholars have long debated whether parties and candidates benefit more from targeting core supporters or marginal voters. One group of scholars suggests that allocating distributive benefits to core voters can maximize votes by reinforcing the commitment from these voters (Cox and McCubbins Reference Cox and McCubbins1986). By contrast, others view persuading marginal voters, who are indifferent between political alternatives, as generating greater electoral returns, as swing voters are more responsive to the targeting efforts (Lindbeck and Weibull Reference Lindbeck and Weibull1987; Stokes Reference Stokes2005). Research shows that the incentives to target core supporters versus marginal voters can vary by electoral contexts, such as the timing of elections (Woo Chang Kang Reference Kang2015) or parties’ electoral popularity (Fisher et al., Reference Fisher, Cutts, Fieldhouse and Rottweiler2019).
Similarly, incentives to target marginal voters may increase with electoral competitiveness. To maximize votes, candidates and parties need to appeal beyond the existing base, targeting persuadable voters (Somer-Topcu Reference Somer-Topcu2015). Electoral competitiveness leads political parties to prioritize swing voters over ideologically committed ones (Stokes Reference Stokes2005), as the former’s future support is less certain and thus more valuable in competitive elections. Legislators have an incentive to focus on mobilizing median and swing voters, who are more likely to shift party support based on short-term policy or distributive gains (Woo Chang Kang Reference Kang2015). The marginal returns from persuading swing voters thus exceed those from mobilizing already committed core supporters, especially in competitive districts.
The collective voting patterns of seniors indicate they represent core supporters rather than marginal voters. Seniors tend to exhibit relatively stable voting patterns compared to younger cohorts who are more susceptible to short-term political dynamics (Sears and Valentino Reference Sears and Valentino1997). Research shows that senior voters are less likely to shift partisan support in response to a short-term policy change (Alwin and Krosnick Reference Alwin and Krosnick1991; Grasso et al. Reference Grasso, Farrall, Gray, Hay and Jennings2019; Lackey Reference Lackey2015; Marwell, et al. Reference Marwell, Aiken and Demerath1987; Tilley Reference Tilley2002). Also, their turnout does not significantly increase even after campaigns focused on social security and other aging-related policies (Sides and Karch Reference Sides and Karch2008). This consistency may reflect the fact that individuals become less responsive to new political information and less likely to change ideological positions as they age (Ksiazkiewicz et al. Reference Ksiazkiewicz, Klemmensen, Dawes, Christensen, McGue, Krueger and Nørgaard2020; Sears and Funk Reference Sears and Funk1999; Stoker and Jennings Reference Stoker and Jennings2008).
Survey data from South Korea illustrate this pattern well. In Figure 1, we report the share of respondents in each age group who said they voted for the same party in consecutive elections.Footnote 3 Figure 1 shows that voters aged 60 and over consistently demonstrate the highest rates of same-party voting—59.5% in 2016, 50.9% in 2020, and 54.3% in 2024— compared to younger cohorts. For instance, only 10–29% of voters in their twenties voted for the same party in consecutive elections. This pattern illustrates strong voting stability among seniors. Similarly, studies find that older voters in South Korea exhibit significantly stronger party loyalty than younger voters, who are more likely to be independents (Jo Reference Jo2013; Ryu Reference Ryu2020). For instance, in a post-election survey following the 18th presidential election, about 94% of voters aged 60 and over reported having a party they support, compared to 76% of those in their twenties. (Lee Reference Lee2013).
Same party voting rates by age group.
Note: Plot shows the share of respondents in each age group, who said they voted for the same party in two consecutive.

Figure 1. Long description
The X axis is labeled Age Group with categories 18-29, 19-29, 30-39, 40-49, 50-59, and over 60. The Y axis is labeled Same Party Voting Rate with percentages from 10 percent to 60 percent. A legend to the right identifies three lines by Election Year.
* 2016 General Election red line: Starts at 11 percent for age 19-29 and shows a steep linear increase, reaching nearly 60 percent for the over 60 group.
* 2020 General Election blue line: Starts at 21 percent for age 18-29, rises steadily to 43 percent at age 40-49, and ends at 51 percent for the over 60 group.
* 2024 General Election green line: Starts at 29 percent for age 18-29, plateaus at 39 percent between ages 30-39 and 40-49, then rises to 54 percent for the over 60 group.
All three lines converge near the 45 percent to 47 percent range for the 50-59 age group before diverging slightly at the final data point.
We expect that the stability of seniors’ voting patterns makes them a less attractive group to target in competitive environments, where persuading swing voters is critical. Not only do senior voters already have well-established political preferences, but they also tend to vote at consistently higher rates without targeted mobilization efforts, making their support more predictable than that of younger voters. In contrast, younger voters, among whom a greater proportion are swing voters, are more susceptible to short-term policy changes and thus make more valuable targets for legislative outreach in competitive elections. In sum, the marginal benefit of targeting a highly engaged and stable voting bloc like seniors decreases in competitive environments, ultimately undermining legislative responsiveness to this age group. Building on this logic, we draw our central hypothesis as follows:
Hypothesis 1 Legislators in highly competitive districts will be less responsive to the increased proportion of seniors than those who are in safe districts.
Research design
To empirically examine the relationship between population aging, electoral competition, and legislative responsiveness, we analyze the case of the National Assembly in South Korea. South Korea offers a compelling case as one of the most rapidly aging societies globally. In 2023, the population aged 65 and older made up 18.4% of South Korea’s total population and is predicted to rise to 34.4% by 2040, positioning the country as a super-aging society.Footnote 4 Along with the extremely low birth rate, population aging has become a salient social issue, raising concerns over its impacts on the national economy, healthcare system, and welfare programs. This setting makes South Korea a highly relevant case for testing our theoretical expectations regarding legislators’ responsiveness to seniors in an aging society.
While seniors constitute a rapidly growing voting bloc in South Korea, they do not exhibit homogeneous voting patterns. Instead, evidence suggests that policy preferences vary significantly among senior voters by socioeconomic factors, such as educational level (Lee and Suh Reference Lee and Suh2024), gender (Koo, et al. Reference Koo, Yoon and Choi2015), income, and ideology (Lee Reference Lee2021). Regionalism, which has long structured partisan alignments in South Korea, remains a strong predictor of voting behavior (Moon Reference Moon2017). Electoral competition in South Korea has historically centered on geographic divisions, with major parties emerging along regional cleavages (Heo and Stockton Reference Heo and Stockton2005). The Conservative Party has traditionally secured support from Gyeongsang Province, while the center-left Democratic Party has drawn its base from Jeolla Province. This entrenched regional party loyalty likely continues to exert an enduring effect on seniors’ voting behavior. Scholars have also identified other systematic determinants of voting behavior in South Korea, including urban–rural residence (Kim Reference Kim2011), cohort effects (particularly among generations who experienced democratization) (Kim and Lee, Reference Kim and Lee2020; Noh, et al. Reference Noh, Song and Kang2013), and ideological orientations, especially attitudes toward North Korea (Kang Reference Kang2003).
Despite increasing partisan polarization on many policy issues, South Korea’s major parties have exhibited consensus on senior-related policy issues, including pensions and healthcare. For instance, in 2025, the National Assembly reached a bipartisan agreement to reform the national pension system, which involves increased contributions from the pensioners. In recent presidential elections, candidates from major parties have pledged to increase national pensions.
South Korea uses a two-tier mixed electoral system to elect members of the National Assembly. The system combines single-member districts (SMD), where legislators are elected from individual constituencies, with proportional representation (PR), in which seats are allocated based on party lists in accordance with the share of the national vote each party receives. A key distinction between the two is that PR members are not elected from, nor do they directly represent, specific geographic constituencies. In the 21st National Assembly, 246 members were elected through SMD and 54 through PR.
Patterns of Legislative Behaviors in the South Korean National Assembly
In South Korea, bill sponsorship serves as a primary means for legislators to advance their legislative agendas. As specified in Article 52 of the Constitution, members of the National Assembly or the executive can introduce bills. In recent sessions, the number of bills proposed by the National Assembly has sharply increased, and roughly 90 percent of the bills are introduced by members of the National Assembly in recent sessions (Bang Reference Bang2023; Jung Reference Jung2022b). This trend intensified after the National Assembly Act amendment in 2000, which mandated identification of bill sponsors and co-sponsors and boosted legislative monitoring by media and NGOs (Lee Reference Lee2016).
To introduce a bill, the National Assembly member must secure nine co-sponsors in addition to the main sponsor. Next, the bill is referred to the relevant standing committee. After deliberation, the standing committee submits the bill to the plenary session. The bill is then voted on and can be passed with a majority vote (Jung Reference Jung2022a).
Previous research on legislative behavior in South Korea has identified several key factors influencing bill sponsorship by members of the National Assembly. Consistent with findings from Western democracies, studies of the South Korean case demonstrate the strong influence of legislators’ political ideology (Jung Reference Jung2024) and gender (Kim, et al. Reference Kim, Lee and Park2025; Kweon and Ryan Reference Kweon and Ryan2022) on both the number and content of bills introduced. For instance, a recent study finds that female legislators in the 19th to the 21st National Assemblies were more likely than their male counterparts to sponsor work–family balance bills, and that gender sometimes exerted a stronger influence than party ideology on sponsorship behavior (An and Lee Reference An and Lee2023).
Before a bill reaches the voting stage, it is first referred to the relevant standing committee for review and revision. After committee deliberation, the bill is reported to the plenary session, where it is debated and put to a final vote. These procedures provide the institutional setting in which legislators’ voting behavior takes place. The voting behavior of legislators in the South Korean National Assembly reflects the interaction of party affiliation, ideological orientation, constituency interests, and institutional incentives. While ideological alignment and party identity remain dominant influences (Kang and Ka Reference Kang and Ka2020; Lee and Lee Reference Lee and Lee2011), personal interests, such as legislators’ real estate ownership, also affect roll-call decisions (Seo Reference Seo2025). Yet, partisanship continues to be the most significant factor shaping legislative behavior, even on seemingly non-partisan institutional issues (Koo and Park Reference Koo and Park2018). Other studies show that less experienced or minority-party members may deviate from party lines under certain institutional and ideological conditions (Ka and Park Reference Ka and Park2021; Kang, et al. Reference Kang, Park and Ka2022).
Additionally, evidence suggests that strong regionalism in South Korean elections promotes party unity in legislative voting by leading legislators seeking reelection to vote with their party to secure endorsement from their party leadership (Shin and Lee Reference Shin and Lee2017). Other studies find that both bill sponsorship and legislative voting by Korean assembly members are highly responsive to electoral context, such as voter turnout or competitiveness (Jin Reference Jin2025; Jung Reference Jung2022b, Reference Jung2023b; Lee Reference Lee2016). Overall, these findings suggest that legislative behavior in Korea is not determined solely by party discipline or ideology, but arises from the combined effects of partisan, ideological, and electoral factors.
Data and measurement
We test our theoretical expectations using an original dataset that combines legislators’ bill proposals in the South Korean National Assembly with district-level information. We collected a total of 21,070 bills between May 30, 2020, and August 2, 2023, from the National Assembly Bill Information website.Footnote 5 The website also provides the text describing the purpose of each bill, written by the bill’s sponsor.
We consider all bills proposed by legislators elected through from the SMD-tier, rather than limiting our focus to those that were passed or enacted, for several reasons. First, bill sponsorship itself constitutes a central mechanism through which legislators shape the legislative agenda and signal responsiveness to their constituents (Schiller Reference Schiller1995). Sponsoring legislation remains one of the most salient avenues for representatives to appeal to voters, irrespective of whether the bill ultimately passes.
Second, this approach allows us to avoid the substantial selection bias that would result from analyzing only legislation that has been enacted. The passage of proposed bills depends on several factors beyond the sponsor’s effort to represent seniors, including their seniority, partisanship, committee affiliation, and the partisan composition of co-sponsors (Thomas and Grofman Reference Thomas and Grofman1992; Volden and Wiseman Reference Volden and Wiseman2014). Restricting our analysis to passed bills would therefore introduce selection bias, as successfully enacted legislation may systematically differ from the broader set of proposals. By examining all proposed bills, we capture the full spectrum of legislative efforts to address constituent interests, regardless of whether those efforts ultimately succeed in the legislative process.Footnote 6
Our dataset incorporates electoral and demographic characteristics from prior legislative sessions, reflecting contextual factors that shape legislators’ strategies and constituencies. This broader lens is particularly relevant given the counterintuitive role that legislator age may play in the Korean setting (Jung Reference Jung2023a; Lee Reference Lee2021), the enduring partisan divide between urban and rural districts (Kang Hwi Won Reference Kang2015), and the institutional importance of standing committee membership for shaping legislative output (Shin and Lee Reference Shin and Lee2017).
To identify bills that are related to senior citizens’ policy interests, we employ both manual classification and a machine-learning approach with BERT classifier. For manual coding, three independent coders carefully examined each bill’s title, content, and proposal purpose and classified into three categories: (1) bills that are directly related to senior citizens’ interests, (2) bills that are indirectly related to senior citizens, and (3) bills that are not related to senior citizens.Footnote 7 A bill was categorized as directly related to seniors if it explicitly identified seniors as its primary beneficiaries in its title, content, or stated purpose. For example, this category includes the Partial Amendment to the Act on Support to the Korean Senior Citizens Association (Bill No. 2105780). This bill’s proposal states: “This bill aims to promote the continuous development of the Korean Senior Citizens Association, which is actively working to promote the rights and welfare of the elderly, by having the national and local governments subsidize the costs necessary for their operation, facilities, and projects.” Since this text explicitly identifies seniors as the bill’s primary beneficiary, we coded this bill as directly related to senior citizens.
While not explicitly identifying seniors as primary beneficiaries, some bills addressed broader policy issues that disproportionately affect seniors’ lives, such as mobility access, social welfare, and healthcare. Others proposed administrative reforms that would improve the delivery of social welfare services for the elderly. Although these bills did not explicitly identify the elderly as beneficiaries or frame administrative reform as their primary purpose, they can nonetheless be considered as promoting elderly interests. We categorized these bills as indirectly related to senior citizens. An example is the Partial Amendment to the Act on Promotion of the Transportation Convenience of Mobility Disadvantaged Persons (Bill No. 2105821). While this bill does not explicitly mention seniors as a beneficiary, the bill’s purpose is to promote the convenience of the “transportation disadvantaged,” a category that includes seniors along with people with disabilities, children, and pregnant women, by urging local governments to introduce low-floor buses when establishing new transportation plans. Lastly, bills were classified as not senior-related if they neither referenced seniors nor substantively affected their interests.Footnote 8
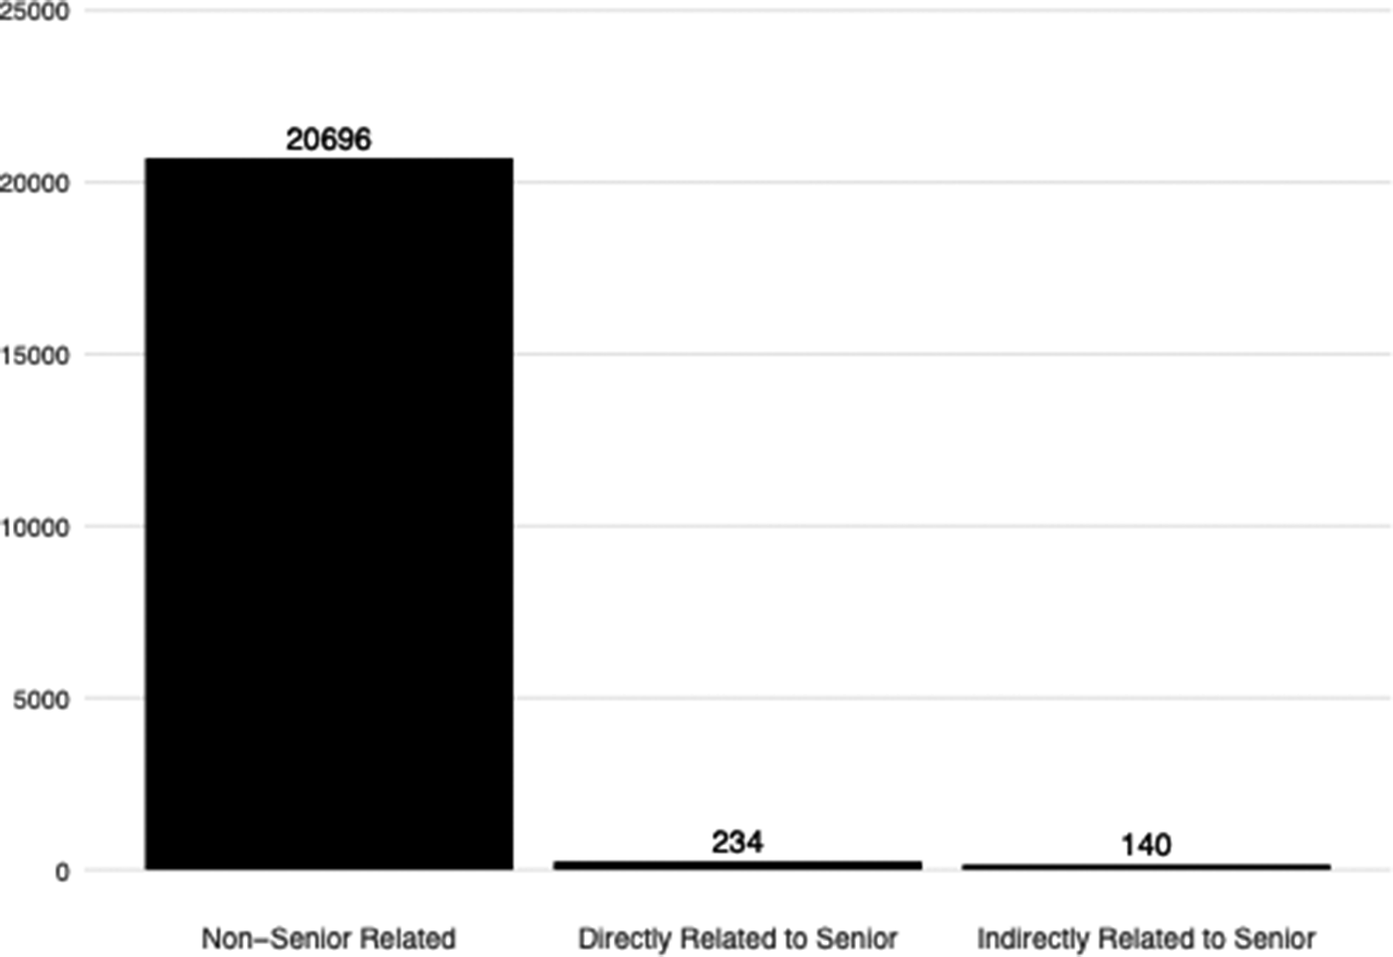
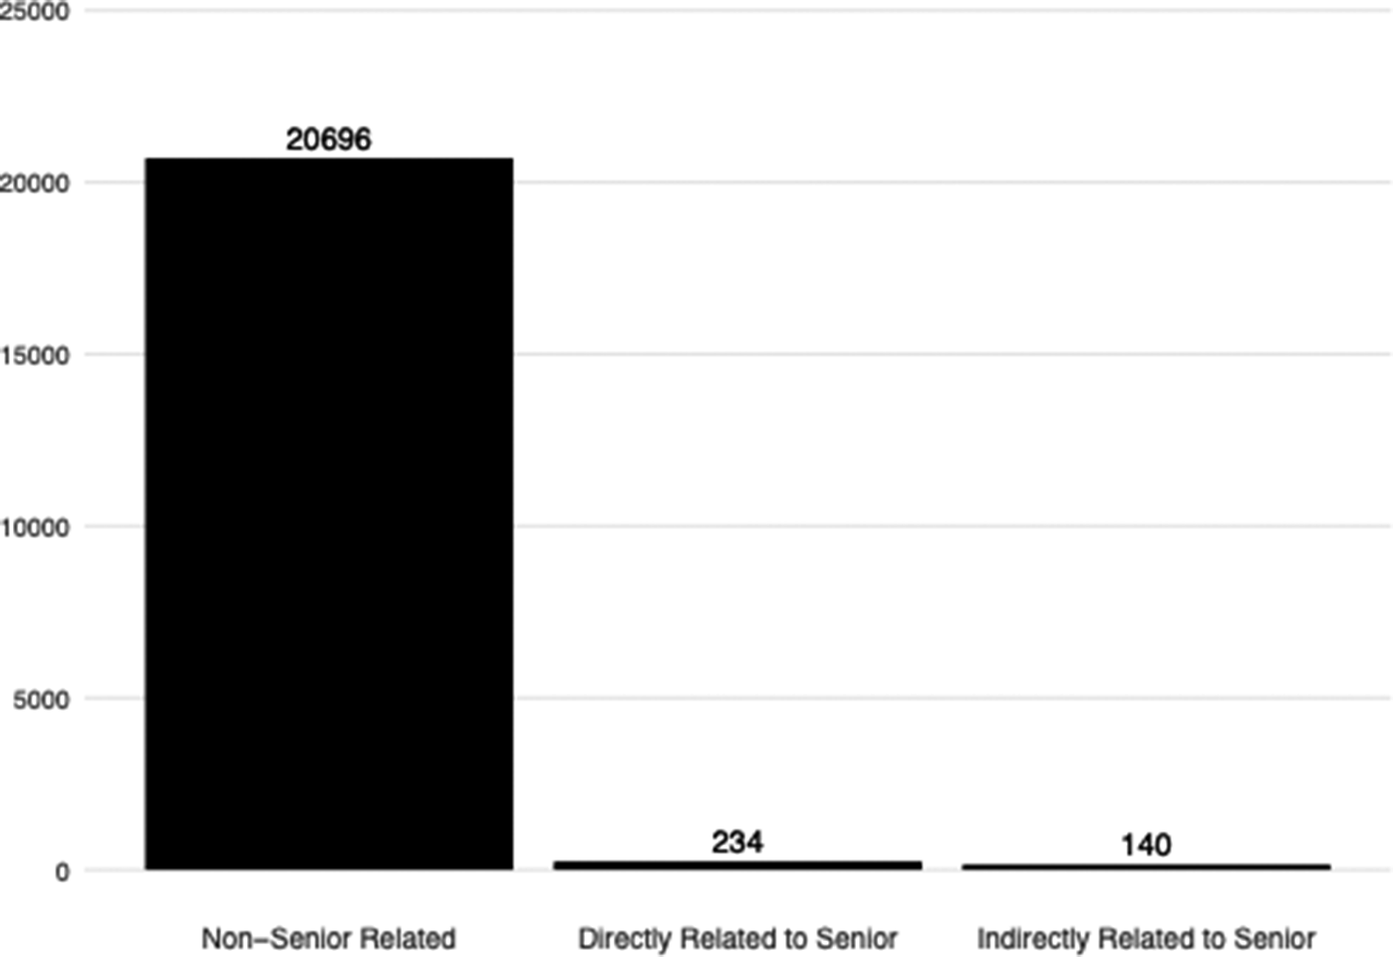
Figure 2 shows a distribution of bills in our sample. It shows that most of the bills are unrelated to senior citizens. Out of 21,070 bills, only 234 (1.11%) bills are classified as directly related to seniors, and an even smaller number of bills are classified as indirectly related to seniors (140 bills). This pattern demonstrates the limited legislative attention to seniors in South Korea.Footnote 9
Distribution of Each Bill Type.
Based on this classification of the bills, we created two dependent variables. First, we created a binary variable named Direct Senior Bill, coded as 1 if the bill is directly related to seniors, and 0 otherwise. Second, we created a binary variable named Senior-Related Bill, coded as 1 if the bill is either directly or indirectly related to seniors, and 0 otherwise.
For additional validation of our classification, we employed a supervised machine learning approach that can address the issue of potential subjectivity in manual coding. To simplify the task, we used binary classification that identifies bills as either senior-related or not senior-related, rather than maintaining the distinction between directly related and indirectly related bills. We used KLUE-BERT, a pre-trained BERT model on the Korean language (Park et al. Reference Park, Moon and Kim2021). To fine-tune the KLUE-BERT model, we first randomly selected 5,000 bills from our dataset as a training set. Three independent coders then labeled each bill, categorizing them as either senior-related (whether directly or indirectly) or not senior-related. The macro F1 score for this model was 0.8098.Footnote 10
Our main analysis uses the bill as the unit of analysis, modeling how the sponsor’s electoral context influences whether the bill addresses seniors’ policy interests. This bill-level approach allows us to account for bill-specific factors, such as timing of the bill proposal and partisan makeup of co-sponsors. Previous studies examining legislative responsiveness have adopted a similar bill-level approach in their analysis (Callaghan and Karch Reference Callaghan and Karch2021; Kweon and Ryan Reference Kweon and Ryan2022; Volden and Wiseman Reference Volden and Wiseman2014).Footnote 11 We then merged this bill-level data with information about each bill’s primary sponsor and their electoral district. We collected information about all 316 elected members of the 21st National Assembly who served for at least one day up to the analysis date, including those elected in by-elections and those who resigned during the term. However, we limit our analysis to the bills with sponsors who were elected through the SMD tier, as our theoretical expectations only consider legislators elected in the SMD context.
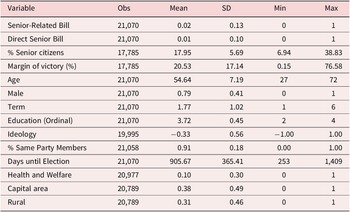
Our main independent variable, the share of senior citizens in the district (% Senior Citizens) was calculated by dividing the number of elderly voters by the total number of voters in each district. This information comes from the Election Commission and the National Statistical Office. We measure electoral competitiveness using Margin of Victory, the difference in vote share between the winning candidate and the runner-up candidate. A smaller margin indicates a more competitive district, where legislators may feel stronger pressure to appeal to a broader electorate, potentially affecting their level of responsiveness to senior voters. We retrieved the data from the National Election Commission. In Table 1, we report summary statistics of our main variables.
Descriptive statistics of variables
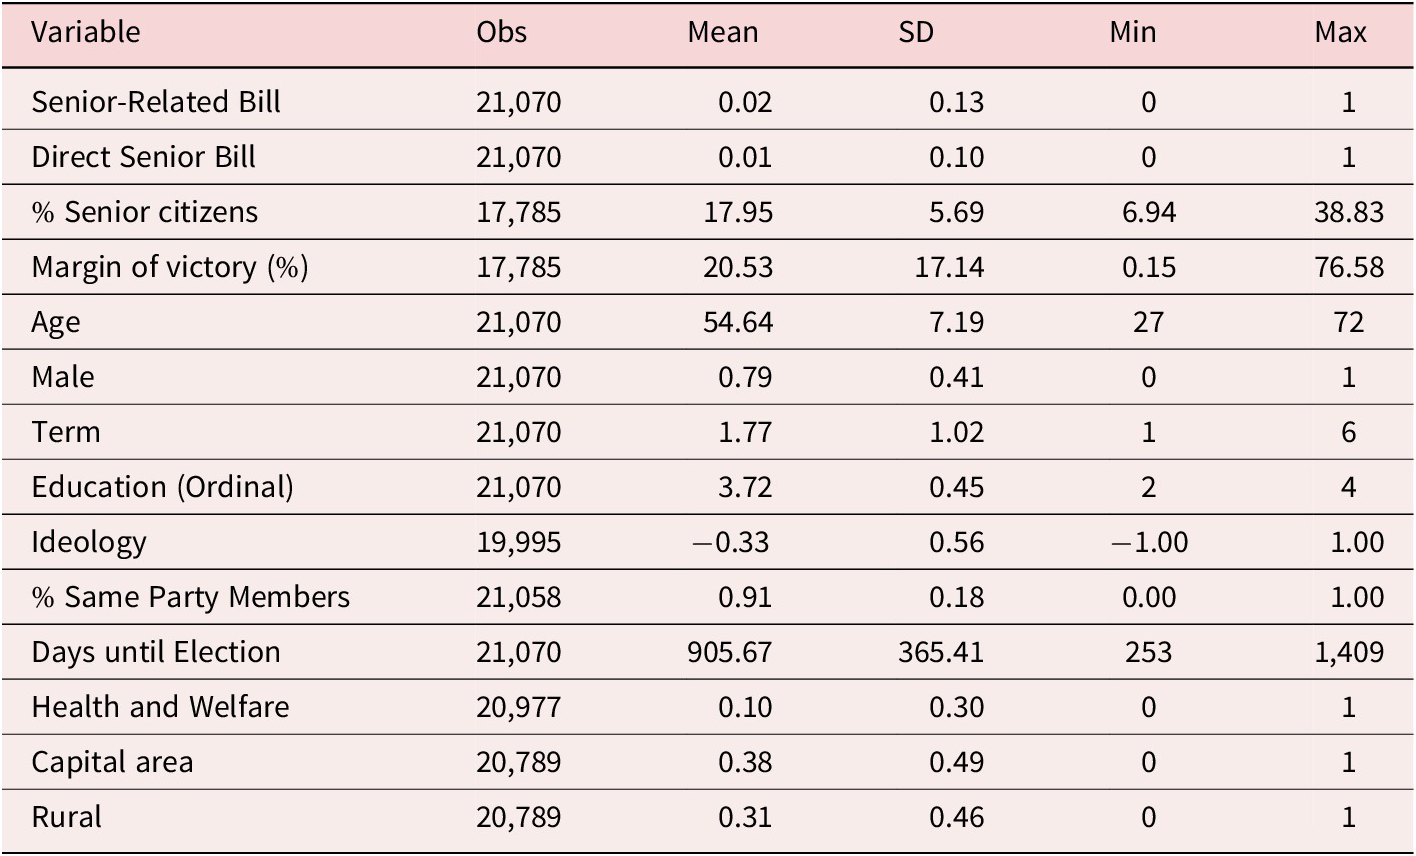
Table 1. Long description
The table contains six columns: Variable, Obs, Mean, S D, Min, and Max.
* Senior-Related Bill: 21,070 observations, mean 0.02, S D 0.13, min 0, max 1.
* Direct Senior Bill: 21,070 observations, mean 0.01, S D 0.10, min 0, max 1.
* percent Senior citizens: 17,785 observations, mean 17.95, S D 5.69, min 6.94, max 38.83.
* Margin of victory percent: 17,785 observations, mean 20.53, S D 17.14, min 0.15, max 76.58.
* Age: 21,070 observations, mean 54.64, S D 7.19, min 27, max 72.
* Male: 21,070 observations, mean 0.79, S D 0.41, min 0, max 1.
* Term: 21,070 observations, mean 1.77, S D 1.02, min 1, max 6.
* Education Ordinal: 21,070 observations, mean 3.72, S D 0.45, min 2, max 4.
* Ideology: 19,995 observations, mean minus 0.33, S D 0.56, min minus 1.00, max 1.00.
* percent Same Party Members: 21,058 observations, mean 0.91, S D 0.18, min 0.00, max 1.00.
* Days until Election: 21,070 observations, mean 905.67, S D 365.41, min 253, max 1,409.
* Health and Welfare: 20,977 observations, mean 0.10, S D 0.30, min 0, max 1.
* Capital area: 20,789 observations, mean 0.38, S D 0.49, min 0, max 1.
* Rural: 20,789 observations, mean 0.31, S D 0.46, min 0, max 1.
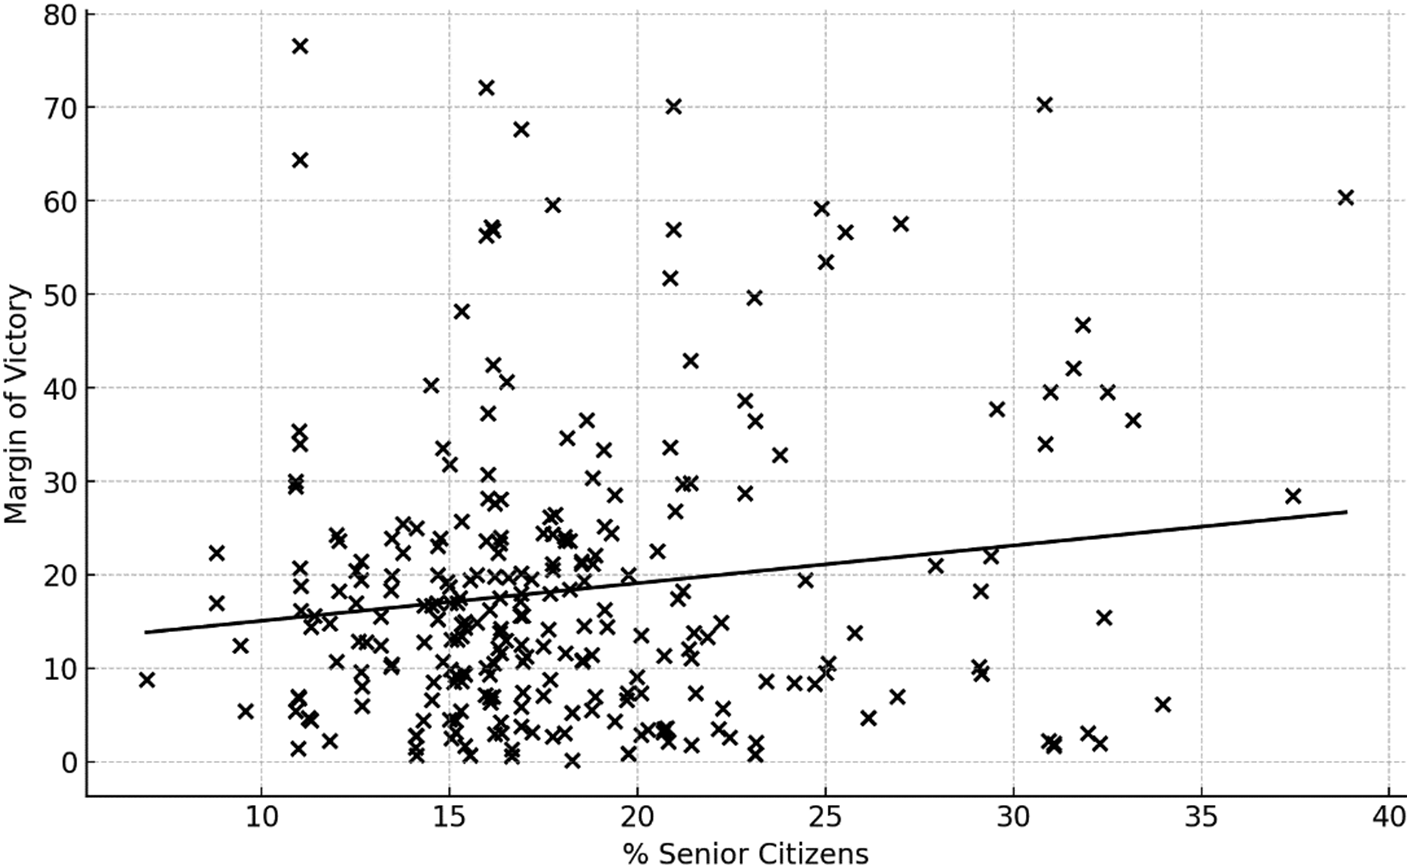
While our hypothesis examines how electoral competitiveness moderates the effect of seniors’ size, these two variables may be highly correlated. Specifically, seniors might be geographically concentrated in districts where one party holds a decisive electoral advantage. To examine this possibility, we first visualized these two key variables on a coordinate plot, marking each electoral district as a distinct data point in Figure 3. Figure 3 shows that both the proportion of senior citizens and the margin of victory vary substantially across electoral districts. While the trend line suggests a positive correlation between the two variables, the correlation coefficient has a relatively small size (0.14).
Relationship between % senior and margin of victory.
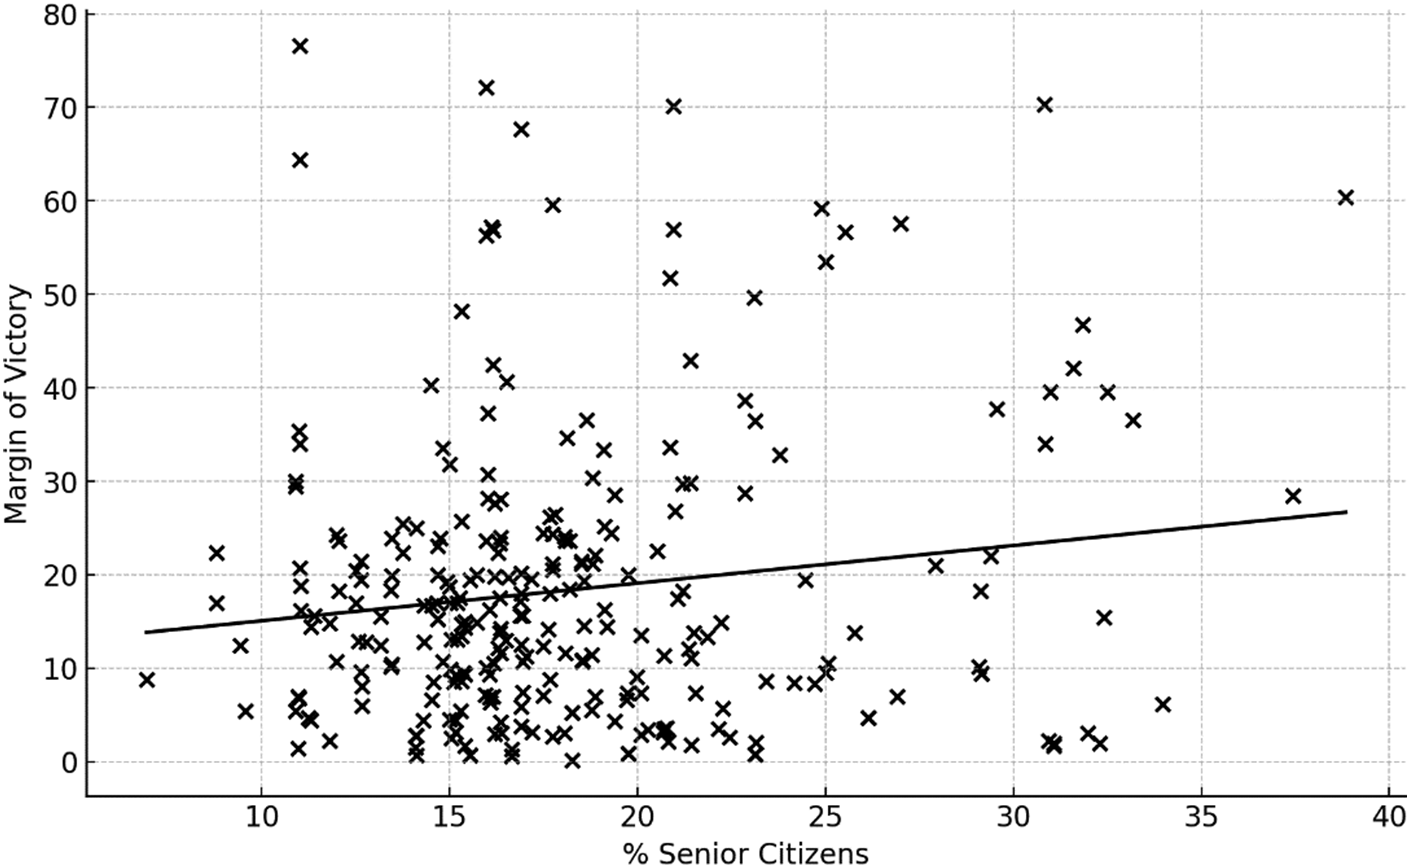
Figure 3. Long description
The horizontal X axis is labeled percent Senior Citizens and ranges from 10 to 40 in increments of 5. The vertical Y axis is labeled Margin of Victory and ranges from 0 to 80 in increments of 10. The data is represented by numerous black x marks scattered across the plot.
* Data Distribution: The highest density of data points is concentrated between 10 and 20 percent on the X axis and between 0 and 30 on the Y axis.
* Outliers: Several points exist above the main cluster, reaching as high as a margin of victory of nearly 80 at approximately 11 percent senior citizens and 70 at approximately 31 percent senior citizens.
* Trend Line: A solid black linear regression line starts at a Y value of approximately 14 at the 7 percent mark on the X axis and slopes upward to a Y value of approximately 27 at the 39 percent mark on the X axis, indicating a slight positive correlation.
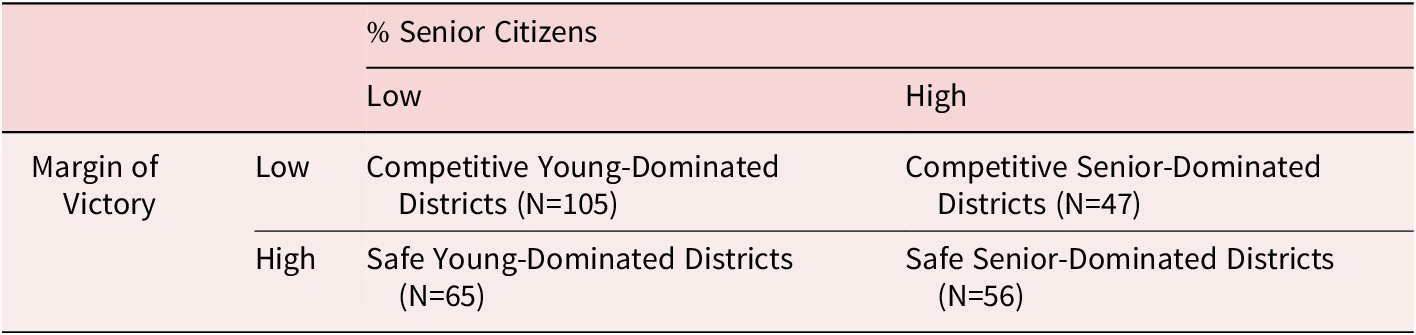
Table 2 classifies districts into a 2 × 2 matrix according to whether the percentage of senior citizens and the margin of victory fall above or below their respective means. This classification yields four distinct categories of electoral districts. The first category refers to competitive youth-dominated districts, where both the proportion of senior citizens and the margin of victory are below average. A total of 105 districts in our sample fall into this group. Representative examples include Yuseong-gu Gap and Eul district in Daejeon, Gangnam-gu Gap and Eul district in Seoul, Asan-si Gap Constituency in South Chungcheong Province (Chungnam) and Wonju-si Gap and Eul district in Gangwon Province.
Groups of senior voters and electoral margins
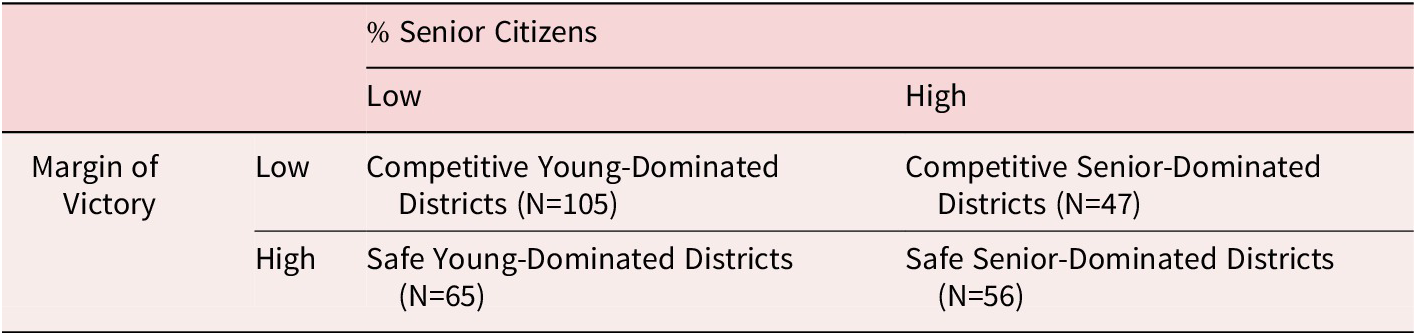
Table 2. Long description
The table is organized with two main columns under the heading percentage Senior Citizens, labeled Low and High. The rows are categorized by Margin of Victory, labeled Low and High.
* The intersection of Low Margin of Victory and Low percentage Senior Citizens contains Competitive Young-Dominated Districts with N equals 105.
* The intersection of Low Margin of Victory and High percentage Senior Citizens contains Competitive Senior-Dominated Districts with N equals 47.
* The intersection of High Margin of Victory and Low percentage Senior Citizens contains Safe Young-Dominated Districts with N equals 65.
* The intersection of High Margin of Victory and High percentage Senior Citizens contains Safe Senior-Dominated Districts with N equals 56.
There were 65 safe youth-dominated districts in our sample, marked by below-average senior populations but above-average electoral margins. Dalseo-gu Gap, Eul, and Byung districts in Daegu, the Seocho-gu Gap district in Seoul, and the Hwaseong-si Eul and Byung districts in Gyeonggi Province belong to this category. Category 3 refers to competitive senior-dominated districts, comprising 47 cases. These districts have above-average shares of senior citizens along with narrow margins of victory. The examples include Dongdaemun-gu Gap and Eul Constituencies in Seoul, the Hongseong-gun and Yesan-gun district in South Chungcheong Province (Chungnam), and the Jung-gu and Nam-gu district in Daegu. Lastly, Category 4 captures 56 safe senior-dominated districts, where both senior population and electoral margins are above average. Representative cases include Jungnang-gu Gap and Eul district in Seoul, the Gyeongju-si district in North Gyeongsang Province (Gyeongbuk), and the Dong-gu Gap and Eul districts in Daegu. This classification reveals substantial variation among districts in both the share of senior citizens and electoral competitiveness. Also, districts in each category are geographically dispersed, instead of regionally concentrated.
Our dataset includes additional variables that may also account for legislator-level differences in bill sponsorship. To begin, our dataset includes information about the legislator’s party to account for the effect of a sponsoring legislator’s affiliated party. Legislators’ bill sponsorship patterns, both in frequency and type, can vary based on their party affiliation, especially when their party holds the majority. Additionally, we consider the type of standing committee on which a legislator serves, as committee assignments can influence the types of bills that he or she sponsors (Miler Reference Miler2017). In particular, legislators who serve on committees related to health or social welfare may be more likely to propose senior-related bills than their colleagues, as these committees often address policy issues affecting senior citizens.
Previous studies have found that legislators’ demographic characteristics influence their patterns of bill sponsorship, as they tend to promote legislation that benefits citizens who share similar identities (Barnes and Burchard Reference Barnes and Burchard2013; Curry and Haydon Reference Curry and Haydon2018; Lowande, et al. Reference Lowande, Ritchie and Lauterbach2019). Considering this, we added the sponsoring legislators’ gender, education level, and age at the time of the 21st general election day as control variables. For those elected in by-elections after the 21st general election, we calculated their ages based on the date of the by-election. Table 1 shows that the vast majority of sponsors are men, accounting for 79 percent of all sponsors. We also consider the number of legislative terms served by the sponsor, since seniority can influence the number and type of sponsoring bills (Schiller Reference Schiller1995). We also control for sponsoring legislators’ ideology, measured by the W-NOMINATE method (Poole and Rosenthal Reference Poole and Rosenthal1985). The variable ranges from -1 to 1 in increments of 0.05, with higher values indicating more conservative ideological positions. The data come from SBS News.Footnote 12
Additionally, our dataset includes several district-level variables that contain information about the district represented by each sponsoring lawmaker. This allows us to control for district-specific characteristics that could also influence the likelihood of introducing senior-related legislation. First, we created a binary variable, Capital Area, which indicates whether the district is located within the capital area. The definition of the capital area follows the Article 2 of the Capital Region Development Act in South Korea. According to this act, the capital region includes Seoul, Incheon, and Gyeonggi-do, and non-capital regions refer to all other areas excluding the capital region. Second, we created a variable, Rural, coded as 1 if the district is located in areas classified as rural or mountainous regions following the Regulations for the Implementation of the Rural and Mountainous Area Education Promotion Act in South Korea. Given significant economic disparities between the capital and the non-capital regions and between urban and rural areas in this country (Lee Reference Lee2004), legislators representing districts in non-capital or rural areas may have policy goals that differ from those of legislators from more developed regions. In addition, rural areas have experienced population aging earlier than metropolitan areas (Kim and Kim Reference Kim and Kim2020). This trend may lead legislators serving rural districts to be more inclined to promote the interests of seniors than their peers.
Finally, we control for bill-specific characteristics to account for variation in the context of individual legislative proposals. Given the strong influence of party discipline and party loyalty in South Korean legislative politics (Baek et al. Reference Baek, Kim, Lee, Jo and Kim2020; Park and Jang Reference Park and Jang2017), whether legislators from different parties collaborated on its introduction may be associated with the type of sponsored bill. Thus, we include the percentage of co-sponsors affiliated with the same party as a control variable. Next, to capture the strength of electoral incentives for legislators in determining the type of bills to introduce, we consider the number of remaining days between bill introduction and the next general election, scheduled for April 10, 2024 (the 22nd General Election).
Findings
We test how the electoral context mediates the effect of proportion of senior citizens in shaping the likelihood of proposing senior-related bills. Since both of our dependent variables Senior-Related Bill and Direct Senior Bill are binary, we first estimate a logistic model using % Senior Citizens, the share of senior voters in the district, and Margin of Victory as key predictors. All models include legislator-, district-, and bill-level control variables.
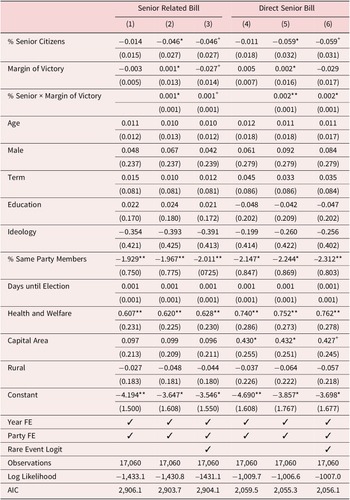
Table 3 presents coefficient estimates of four logistic regression models, each with Senior-Related Bill (Column (1), (2)) and Direct Senior Bill (Column (3), (4)) as the outcome variables. To control for unobserved heterogeneity, we include fixed effects for both year and Sponsor Party in our analysis. We report standard errors that are clustered by the sponsoring legislator to account for heterogeneity across individual legislators. In Table 3, Columns (1) and (3) show that the coefficients for % Senior Citizens are negative, though not statistically significant.
Logistic Regression for Introducing Senior-Related Bills
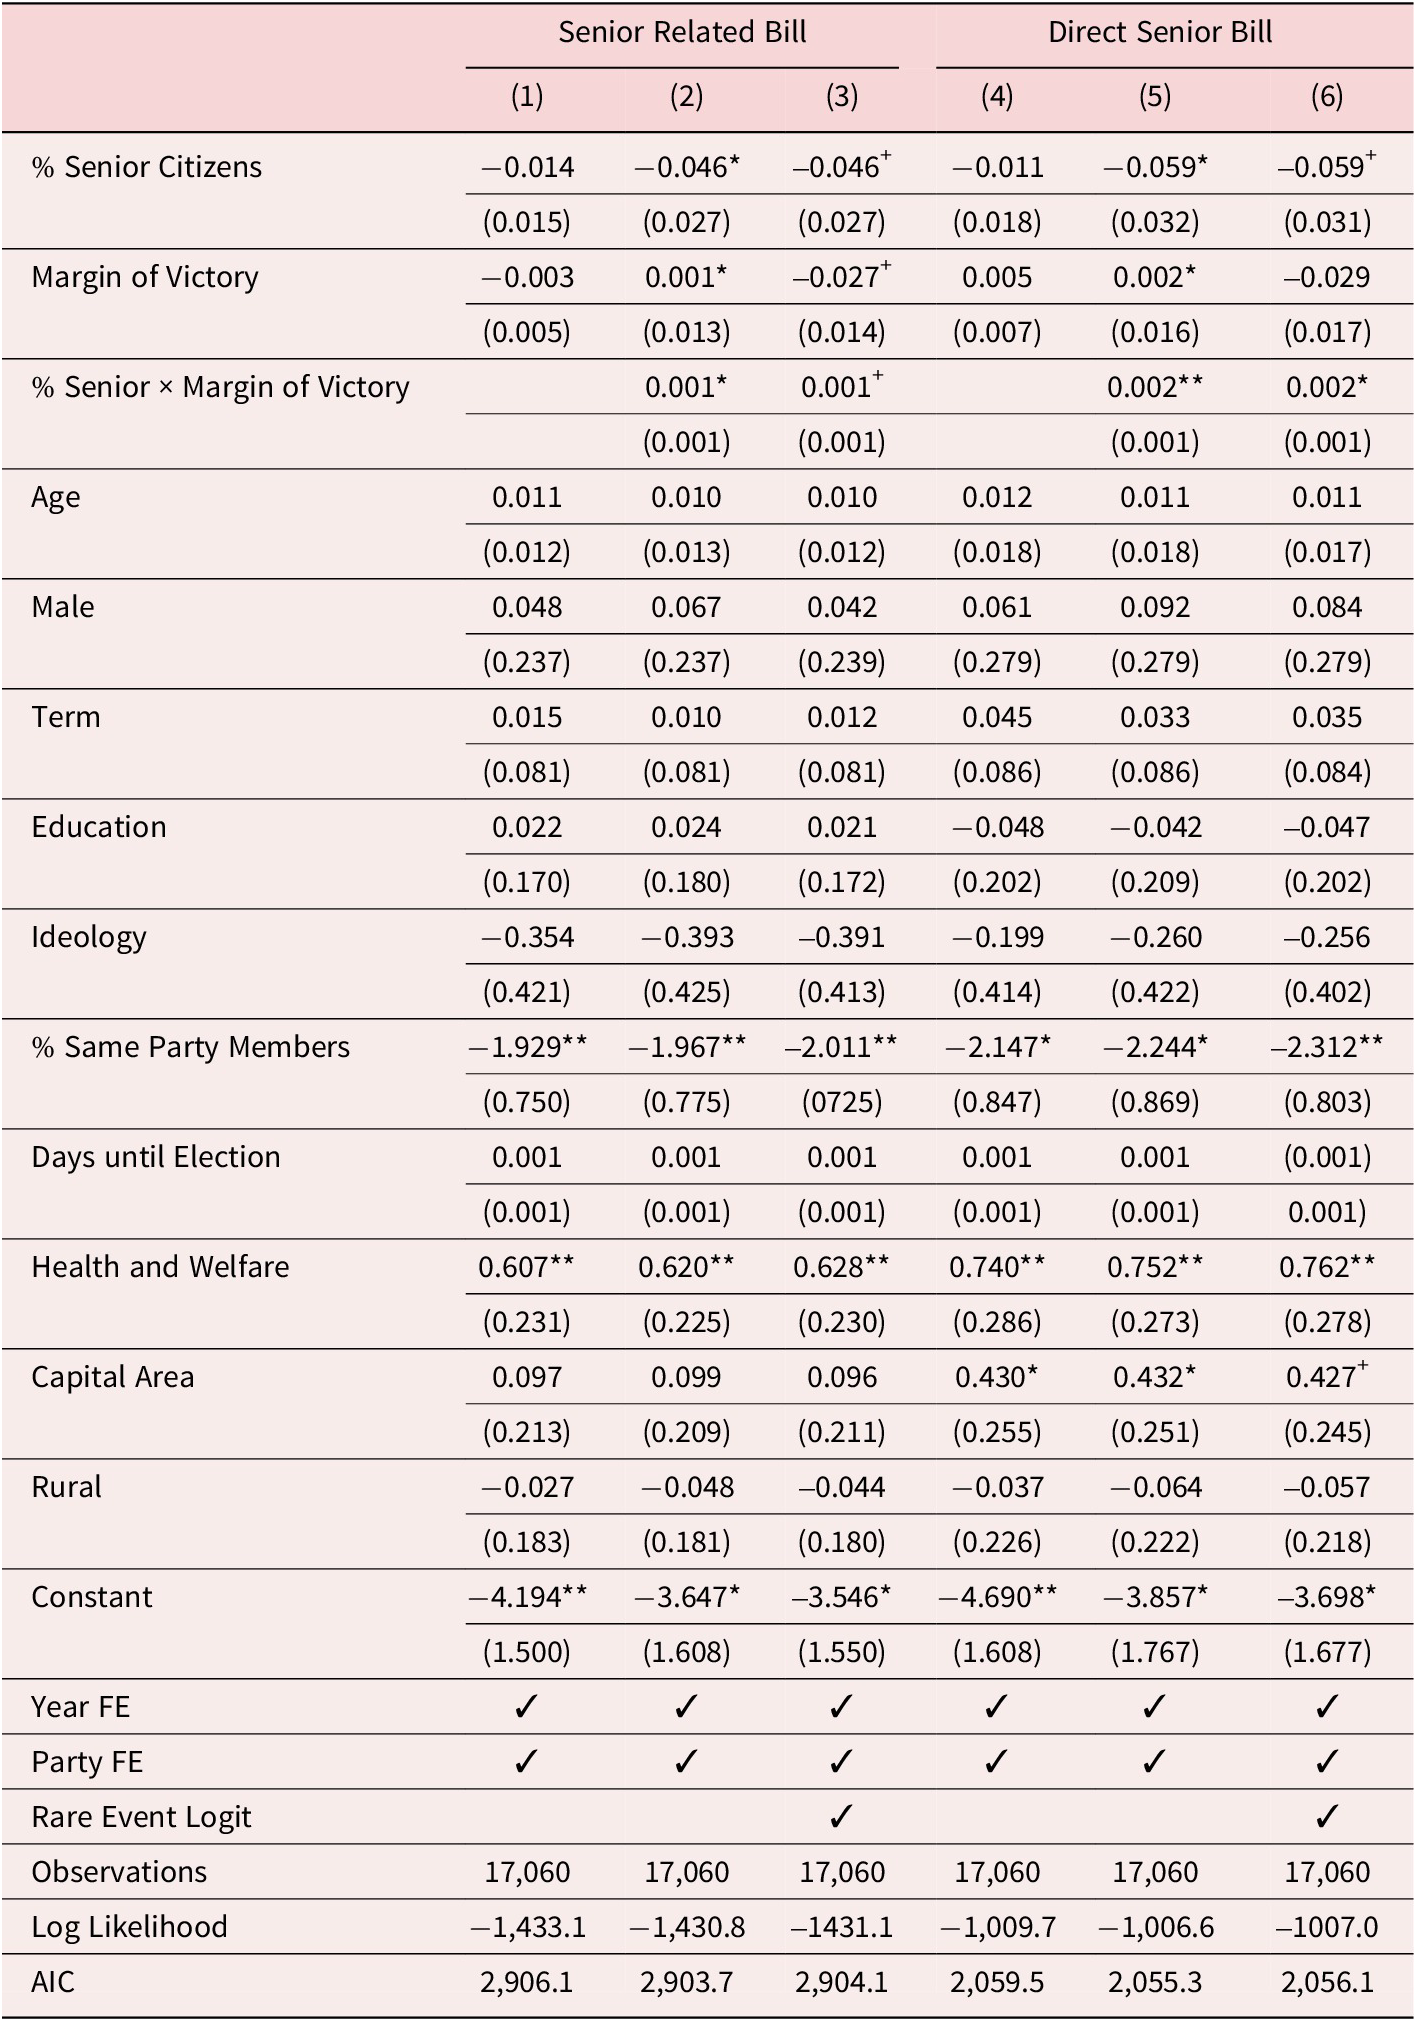
Table 3. Long description
A statistical table with seven columns. The first column lists independent variables, while columns 1 through 3 fall under the heading Senior Related Bill and columns 4 through 6 fall under Direct Senior Bill.
Key variables and their coefficients (standard errors in parentheses):
* % Senior Citizens: Values range from -0.011 to -0.059, with significant negative results in models 2, 3, 5, and 6.
* Margin of Victory: Generally small coefficients, with a significant positive interaction in models 2 and 5.
* % Senior times Margin of Victory: Significant positive coefficients of 0.001 or 0.002 across models 2, 3, 5, and 6.
* % Same Party Members: Strong significant negative correlation ranging from -1.929 to -2.312 across all models.
* Health and Welfare: Significant positive correlation ranging from 0.607 to 0.762 across all models.
* Capital Area: Significant positive correlation in models 4, 5, and 6 (0.427 to 0.432).
* Constant: Significant negative values from -3.546 to -4.690.
Control variables include Age, Male, Term, Education, Ideology, Days until Election, and Rural, most of which are not statistically significant.
Model diagnostics at the bottom:
* Year F E and Party F E are included in all models.
* Rare Event Logit is applied to models 3 and 6.
* Observations: 17,060 for all models.
* Log Likelihood: Ranges from -1,006.6 to -1,433.1.
* A I C: Ranges from 2,055.3 to 2,906.1.
Significance levels are indicated by plus for p < 0.1, asterisk for p < 0.05, and double asterisk for p < 0.01.
Note: Cell entries are logistic regression estimates with standard errors clustered by legislator (in parentheses).
+p< 0.1; *p<0.05; **p<0.01.
Our hypothesis posits that electoral competitiveness, measured as the electoral margin of victory in the most recent general election, moderates the influence exerted by the proportion of the elderly population. Specifically, we expect legislators in competitive districts to be less responsive to seniors’ proportion in the district due to electoral incentives for broad-appeal strategies, whereas those in safer districts may exhibit more responsiveness. To test this expectation, we estimate a separate model including an interaction term between % Senior Citizens and Margin of Victory. We report the results of these models in Columns (2) and (4) of Table 3. These results indicate that the coefficient for % Senior Citizens is negative and statistically significant, suggesting that as the proportion of senior citizens increases, legislators become less likely to introduce senior- related bills. This finding contrasts with conventional expectations that a larger senior population would lead to greater legislative attention to senior-related issues. Consistent with our hypothesis, we find that the interaction term between % Senior and Margin of Victory is positive and statistically significant at the conventional level in both models (2) and (4). This result indicates that while a growing share of seniors decreases the likelihood of sponsoring senior-related bills, this negative effect is attenuated in less competitive districts.
In our dataset, senior-related bill sponsorships constitute a very small share of the total sample (approximately 1.2% of the total sample for directly senior-related and 1.8% for directly and indirectly senior-related combined). This low incidence of senior-related bills may induce biased coefficient estimates (Firth, Reference Firth1993; King and Zeng, Reference King and Zeng2001; Kosmidis and Firth, Reference Kosmidis and Firth2009). We therefore employed a mean bias reduction model as an alternative modeling strategy.Footnote 13 We report the results of the rare events logit models in Columns (3) and (6) of Table 3.Footnote 14 Our results remain robust to this alternative modeling strategy.
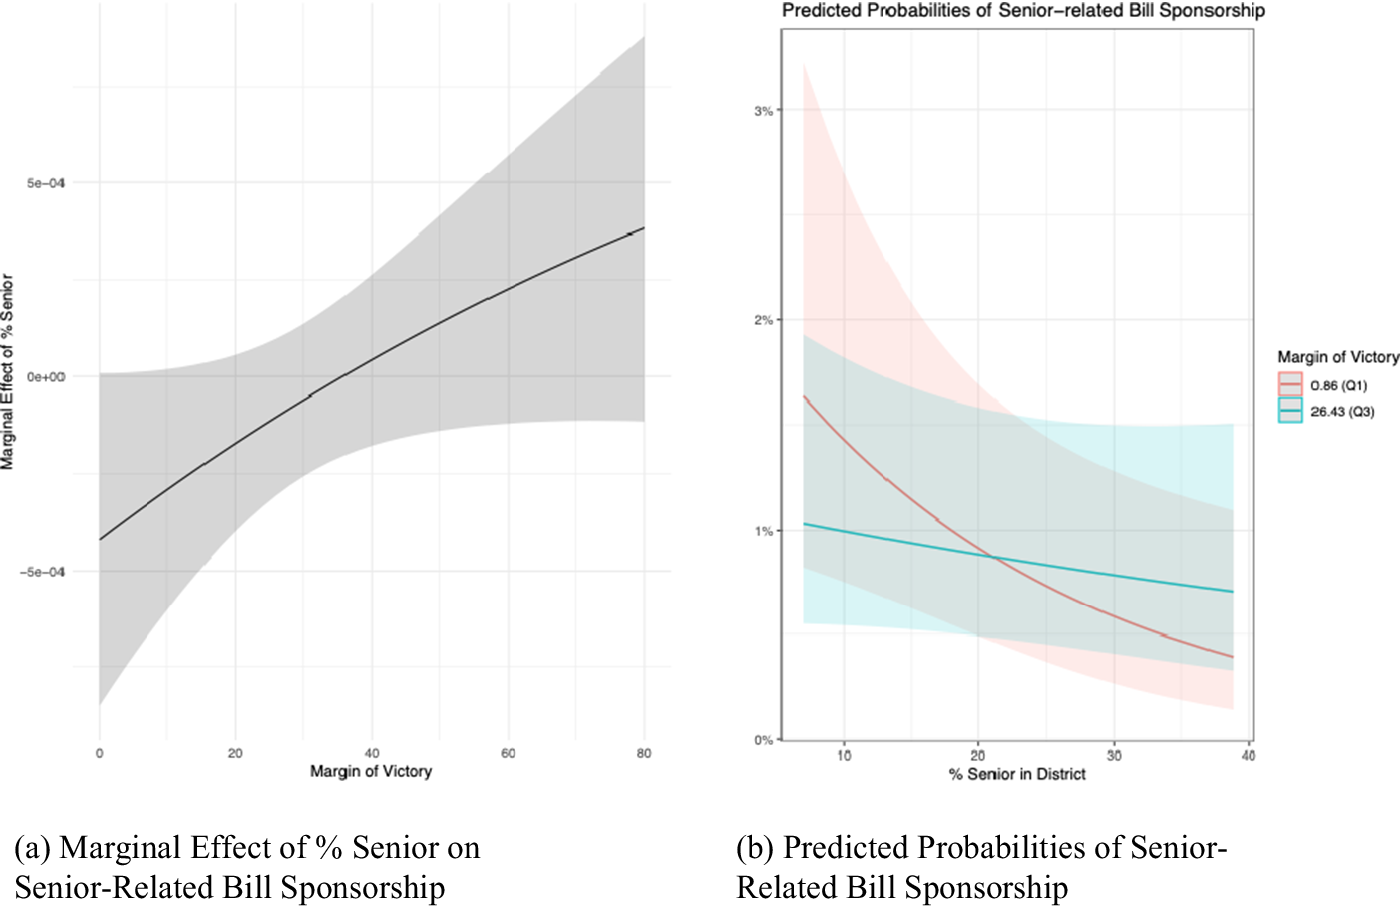
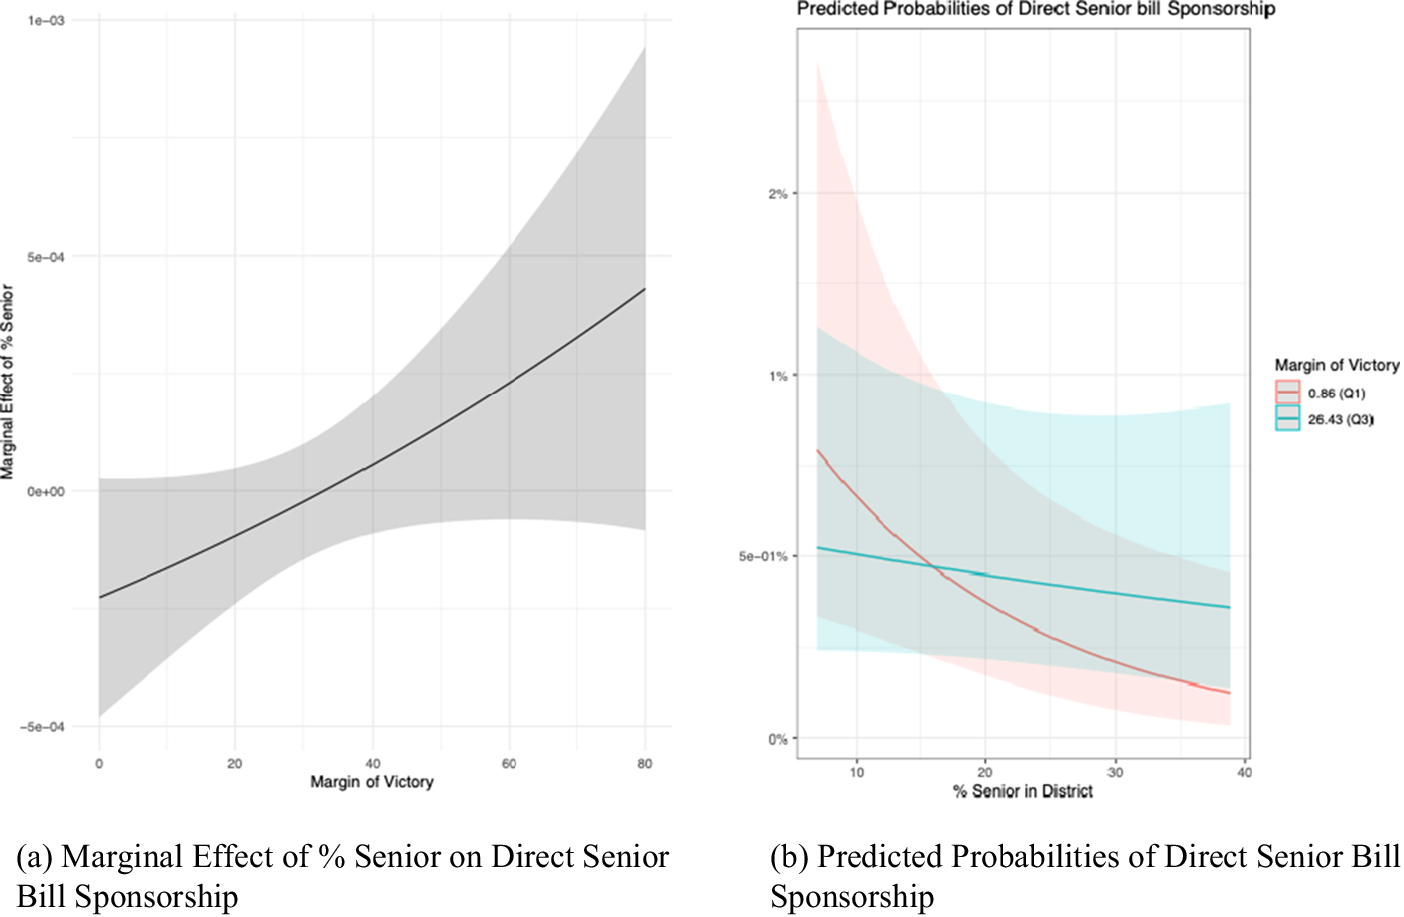
We graphically illustrate the marginal effects and predicted probabilities in Figure 4 and Figure 5. In Figure 4, the left panel shows that the marginal effect of % Senior on the likelihood of sponsoring a senior-related bill increases as the margin of victory increases (i.e., the district becomes less competitive.) The right panel compares the predicted probability of sponsoring a senior-related bill when the margin of victory is at its minimum and at the maximum. The panel shows that an increased share of senior citizens in a district raises the likelihood of sponsoring senior-related bills when the district is electorally secure. In contrast, in highly competitive districts, a larger senior population is associated with a decreased likelihood of such sponsorship. These patterns become clearer when we look at the likelihood of sponsoring direct senior-related bills, as shown in Figure 5. In competitive districts, the predicted probability remains low and stable regardless of the senior population, while the marginal effect of % Senior is consistently negative. In contrast, in safer districts, both the predicted probability and the marginal effect increase, suggesting that legislators actively respond to senior constituents only when electorally unconstrained.
Marginal effects and predicted probabilities (senior-related bill sponsorship).
Note: Predicted probabilities are estimated using the coefficient estimates of column (2) of Table 3.
Other variables are held at their mean or median.
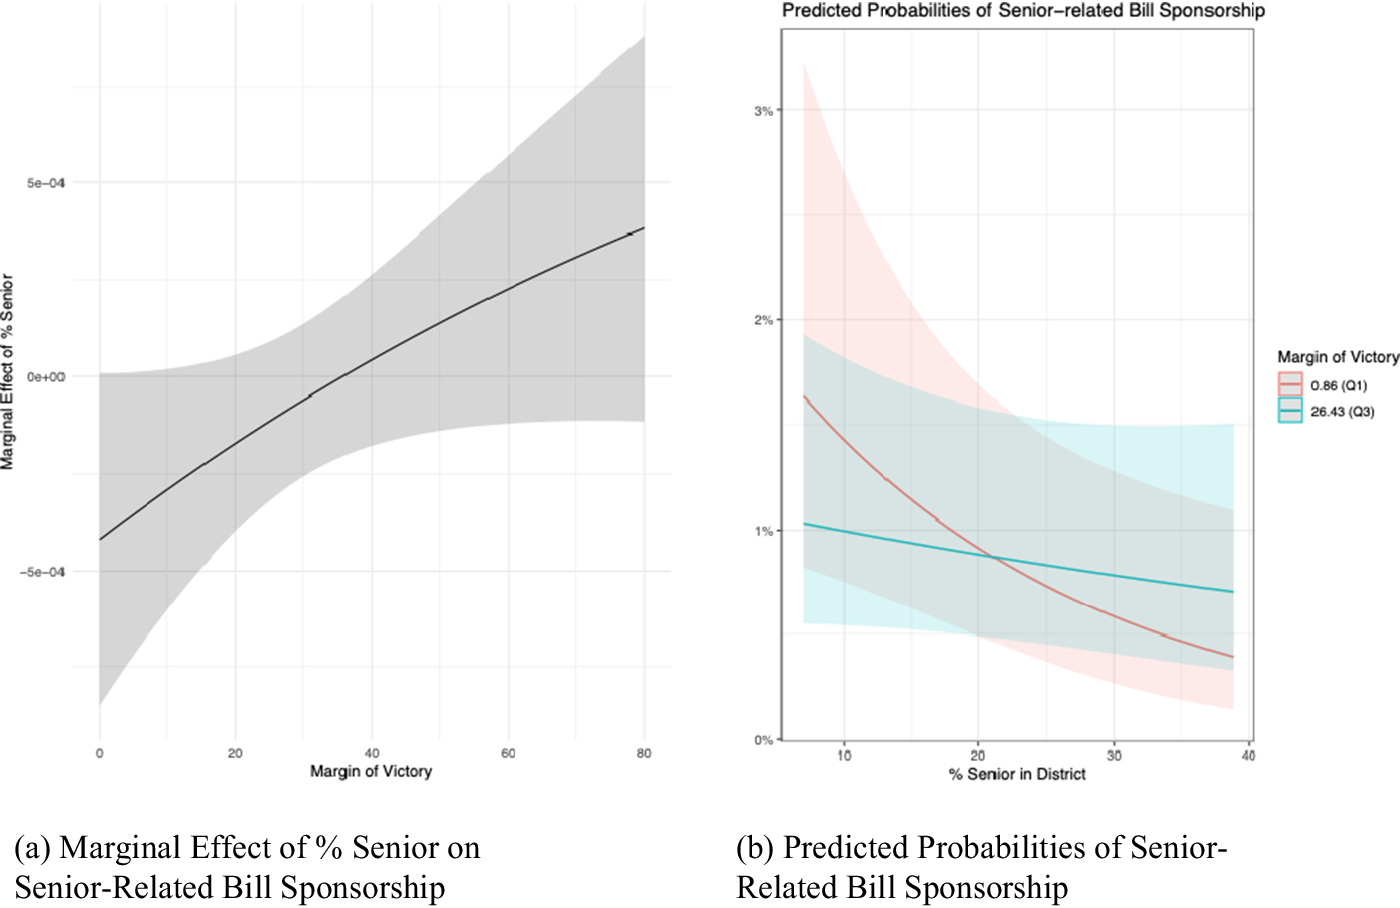
Figure 4. Long description
The image consists of two panels labeled a and b.
Panel a, titled Marginal Effect of percent Senior on Senior-Related Bill Sponsorship, features a horizontal x-axis for Margin of Victory ranging from 0 to 80 and a vertical y-axis for Marginal Effect of percent Senior ranging from negative 5 e minus 04 to 5 e minus 04. A solid black line shows a positive linear increase in the marginal effect as the margin of victory increases. A gray shaded area representing the confidence interval is widest at the far left and far right, narrowing slightly in the middle.
Panel b, titled Predicted Probabilities of Senior-related Bill Sponsorship, features a horizontal x-axis for percent Senior in District ranging from 10 to 40 and a vertical y-axis for probability percentages from 0 percent to 3 percent. Two lines are plotted based on Margin of Victory:
* A red line for Q 1 (0.86) starts at approximately 1.6 percent and shows a steep downward curve, ending near 0.4 percent. It is surrounded by a light red shaded confidence interval.
* A teal line for Q 3 (26.43) starts at approximately 1 percent and shows a very gradual, nearly linear decline, ending near 0.7 percent. It is surrounded by a light teal shaded confidence interval.
The two lines intersect at approximately 22 percent Senior in District.
Marginal effects and predicted probabilities (direct senior bill sponsorship).
Note: Predicted probabilities are estimated using the coefficient estimates of column (4) of Table 3.
Other variables are held at their mean or median.
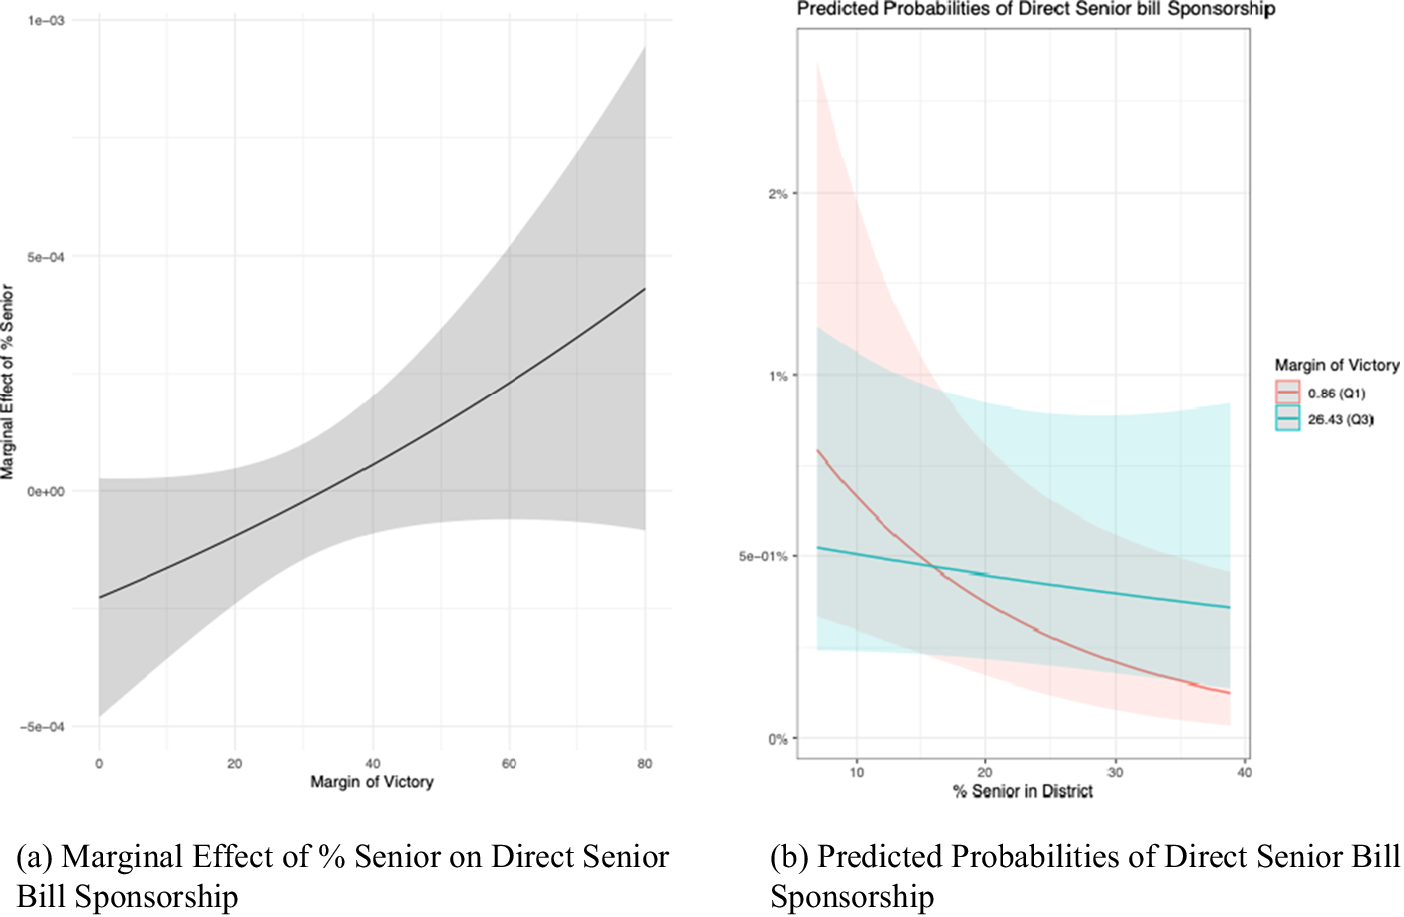
Figure 5. Long description
The figure consists of two panels labeled a and b.
Panel a, titled Marginal Effect of percent Senior on Direct Senior Bill Sponsorship, has an x-axis representing Margin of Victory ranging from 0 to 80 and a y-axis representing Marginal Effect of percent Senior ranging from negative 5e-04 to 1e-03. A solid black line shows a positive linear increase in the marginal effect as the margin of victory increases. A grey shaded area representing the confidence interval starts narrow at a margin of victory of 0 and widens significantly as it moves toward 80.
Panel b, titled Predicted Probabilities of Direct Senior bill Sponsorship, has an x-axis representing percent Senior in District ranging from 10 to 40 and a y-axis representing probability percentages from 0 percent to 2 percent. Two lines are shown based on Margin of Victory:
* A red line for a margin of 0.86 (Q 1) shows a steep exponential decay, starting near 1.5 percent and dropping toward 0.2 percent as the senior population increases. Its light red confidence interval is very wide at the start and narrows at the end.
* A teal line for a margin of 26.43 (Q 3) shows a much flatter, slightly negative linear trend, staying between 0.5 percent and 0.4 percent. Its light teal confidence interval remains relatively consistent in width across the x-axis.
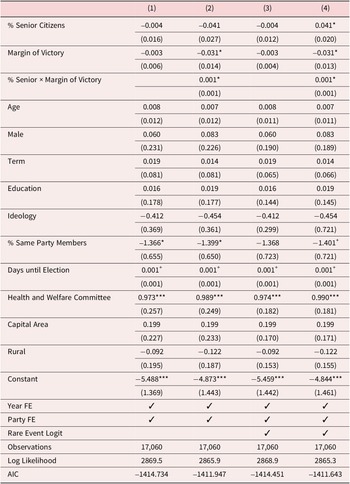
Other variables are associated with the likelihood of proposing legislation related to senior citizens. First, we find a negative correlation between the proportion of co-sponsors from the same political party and the likelihood of introducing senior-related bills. This indicates that legislation on seniors’ issues is less likely to be introduced when it is sponsored by members from a single party rather than as a multi-party effort. Second, when the sponsor is a member of the health and welfare committee in the National Assembly, he or she is more likely to introduce a bill that considers senior citizens’ interests. Other variables, including legislators’ age, legislative terms, education level, and time remaining until the next election, do not appear to have a meaningful relationship with the likelihood of introducing senior-related legislation. Contrary to previous research highlighting a correlation between legislators’ age and their efforts to promote older citizens’ interests (Curry and Haydon Reference Curry and Haydon2018; McClean Reference McClean2021), our findings demonstrate that legislators’ age does not explain their legislative actions benefiting senior citizens. Instead, our results underscore the powerful influence of electoral incentives in shaping legislators’ decisions to substantively represent senior citizens’ interests.Footnote 15 Additionally, we estimate the same logistic regression with measures classified using BERT and report the results in Table 4. The results are consistent with the analysis using the hand-coded measures.
Logistic regression for introducing senior-related bills (classified using BERT)
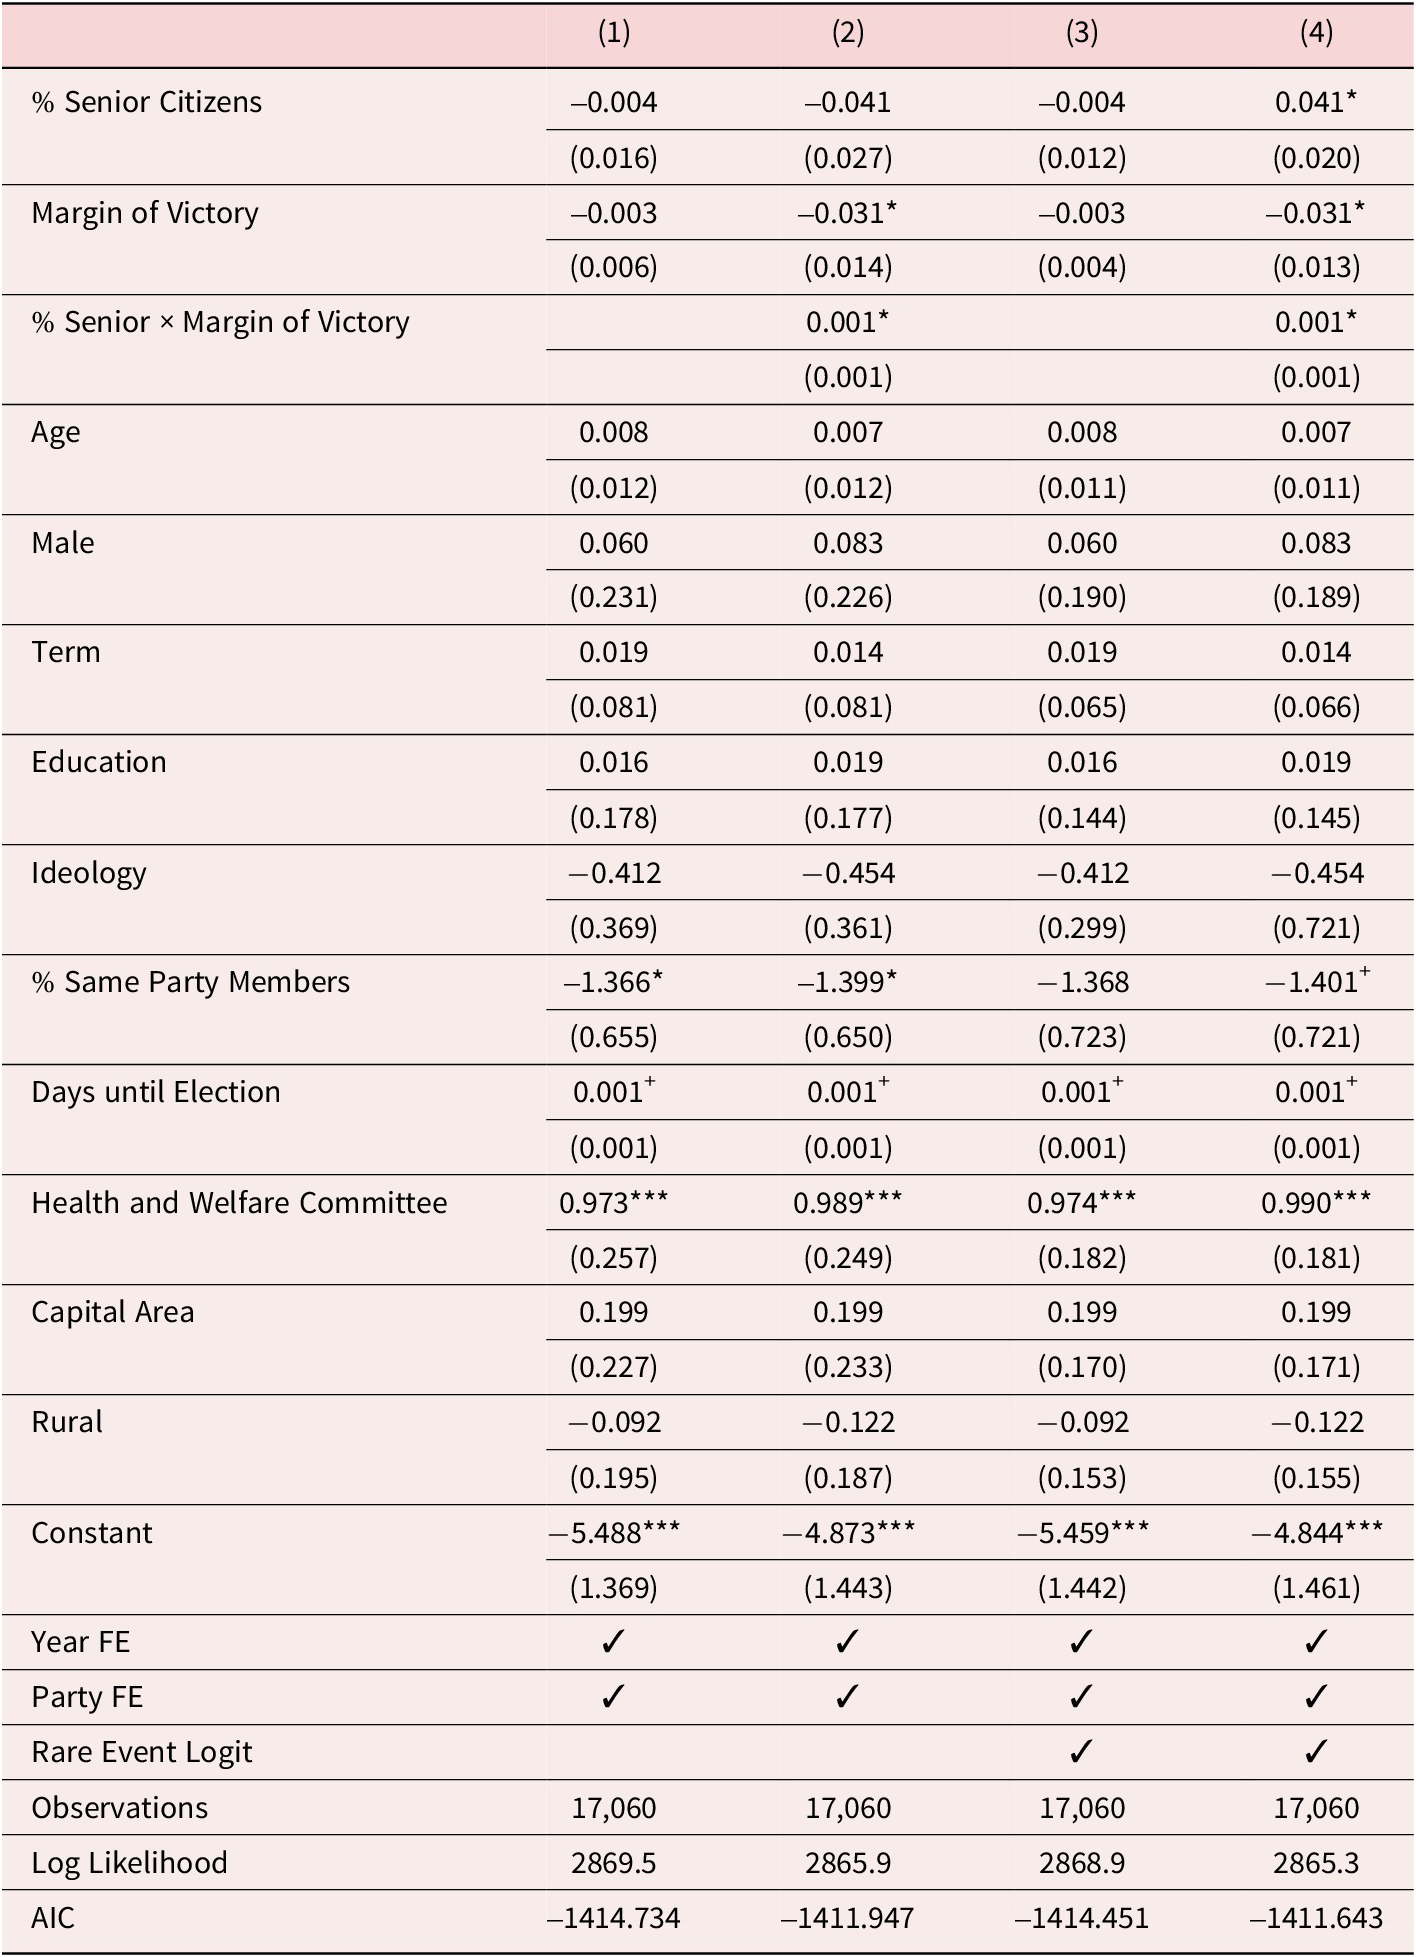
Table 4. Long description
The table presents logistic regression estimates across four models, labeled 1 through 4.
Independent variables and their coefficients (with standard errors in parentheses):
* % Senior Citizens: -0.004 (0.016) in Model 1; -0.041 (0.027) in Model 2; -0.004 (0.012) in Model 3; 0.041* (0.020) in Model 4.
* Margin of Victory: -0.003 (0.006) in Model 1; -0.031* (0.014) in Model 2; -0.003 (0.004) in Model 3; -0.031* (0.013) in Model 4.
* % Senior multiplied by Margin of Victory: 0.001* (0.001) in Models 2 and 4.
* Age: 0.008 (0.012) in Model 1; 0.007 (0.012) in Model 2; 0.008 (0.011) in Model 3; 0.007 (0.011) in Model 4.
* Male: 0.060 (0.231) in Model 1; 0.083 (0.226) in Model 2; 0.060 (0.190) in Model 3; 0.083 (0.189) in Model 4.
* Term: 0.019 (0.081) in Model 1; 0.014 (0.081) in Model 2; 0.019 (0.065) in Model 3; 0.014 (0.066) in Model 4.
* Education: 0.016 (0.178) in Model 1; 0.019 (0.177) in Model 2; 0.016 (0.144) in Model 3; 0.019 (0.145) in Model 4.
* Ideology: -0.412 (0.369) in Model 1; -0.454 (0.361) in Model 2; -0.412 (0.299) in Model 3; -0.454 (0.721) in Model 4.
* % Same Party Members: -1.366* (0.655) in Model 1; -1.399* (0.650) in Model 2; -1.368 (0.723) in Model 3; -1.401 plus (0.721) in Model 4.
* Days until Election: 0.001 plus (0.001) across all models.
* Health and Welfare Committee: 0.973*** (0.257) in Model 1; 0.989*** (0.249) in Model 2; 0.974*** (0.182) in Model 3; 0.990*** (0.181) in Model 4.
* Capital Area: 0.199 (0.227) in Model 1; 0.199 (0.233) in Model 2; 0.199 (0.170) in Model 3; 0.199 (0.171) in Model 4.
* Rural: -0.092 (0.195) in Model 1; -0.122 (0.187) in Model 2; -0.092 (0.153) in Model 3; -0.122 (0.155) in Model 4.
* Constant: -5.488*** (1.369) in Model 1; -4.873*** (1.443) in Model 2; -5.459*** (1.442) in Model 3; -4.844*** (1.461) in Model 4.
Model Specifications:
* Year F E and Party F E are included in all models.
* Rare Event Logit is applied only to Models 3 and 4.
* Observations: 17,060 for all models.
* Log Likelihood: 2869.5 (Model 1), 2865.9 (Model 2), 2868.9 (Model 3), 2865.3 (Model 4).
* A I C: -1414.734 (Model 1), -1411.947 (Model 2), -1414.451 (Model 3), -1411.643 (Model 4).
Note: Cell entries are logistic regression estimates with standard errors clustered by legislator (in parentheses).
+p< 0.1; *p<0.05; **p<0.01, ***p<0.001.
Conclusion
In many countries across the world, populations are aging at an unprecedented rate. In particular, many East Asian countries are facing aging populations and associated socioeconomic challenges faster than other regions. In this article, we shed light on the political implications of these factors by focusing on how lawmakers respond to the growing number of senior citizens.
Using the case of South Korea, a country with a rapidly aging society, this article examined how legislators respond to an aging electorate. Our analysis of an original dataset of bill sponsorship from the most recent legislative session in South Korea that legislators’ responsiveness to a growing elderly population depends on the electoral context they face. Specifically, we found that in competitive districts, legislators do not increase senior-related bill sponsorship in response to a high senior population share. Overall, our results demonstrate the strong influence of the electoral context in shaping legislators’ representation of a social group that constitutes an increasing share of the electorate. In contrast to existing studies that emphasize the centrality of ascriptive characteristics such as legislators’ age, our results show that the interplay between the relative proportion of seniors and competitiveness plays a more crucial role in motivating legislators to represent seniors in an aging society.
Our findings have significant implications for understanding how population aging shapes the legislative and representational outcomes in democracies. While seniors make up an increasing proportion of the world population, we find limited, if any, political efforts to represent their policy interests. Our findings also suggest that lawmakers have few electoral incentives to represent seniors as their electoral environment becomes more competitive. In the long run, this reduced legislative attention to seniors may further weaken the already fragile policy and institutional support for this demographic group, undermining the quality of democratic representation. Beyond this age group, our findings show that the size of any demographic group alone does not guarantee increased attention and representation from legislators. Rather, our results suggest that the interplay between the group’s collective voting patterns and electoral context shapes its substantive representation.
Our findings also have implications for electoral redistricting in the era of population decline by showing that legislators are not universally responsive to the growing size of the senior population, and that they strategically adjust their legislative action to their district’s electoral context. The demographic crisis driven by population aging and declining birth rates has sparked a heated debate about democratic representation. Specifically, as rural areas experience disproportionate population decline, they face the risk of losing electoral districts, potentially diminishing their political voice. Adding an important dimension to this debate, our findings reveal unequal representation between seniors residing in electorally safe districts and those in competitive districts. These findings offer valuable insights for electoral redistricting reforms.
Our article opens up several avenues for future research on this topic. While our results show that district-level electoral incentives shaped by group size and competitiveness motivate legislators to represent the policy interests of seniors, we do not test whether these incentives similarly motivate the representation of other groups. In other words, our current analysis does not test whether these electoral contexts make legislators particularly responsive to senior citizens compared to other age groups, such as youth. Future research can investigate these different effects across age groups and examine whether senior citizens exert a particularly less strong influence on legislative behavior. Future research can also explore how changing demographics influence legislators’ messaging strategies. Although lawmakers’ bill sponsorship reflects their legislative priorities, they may use alternative means to appeal to a social group, such as floor speeches or communications on social media platforms.
In addition, more work can be done to explore the long-term effects of an aging population on legislative outcomes over time. While we analyzed bill proposals within one assembly session, future research can work on more bill proposals by collecting them across multiple congressional sessions. Such analysis would provide deeper insights into the circumstances under which legislators become responsive to the policy interests of the elderly. An extended examination could also shed light on how long-term demographic shifts influence legislative priorities and behaviors. Finally, it is crucial to investigate how the effect of population aging varies across electoral systems. For instance, future research can explore what motivates legislators in proportional representation (PR) systems to advocate for seniors’ interests. Since PR legislators are not tied to specific geographic districts, understanding their incentives and strategies for representing elderly constituents could reveal important insights into how demographic changes shape legislative behavior and responsiveness.
Supplementary material
The supplementary material for this article can be found at http://doi.org/10.1017/jea.2026.10030.
Acknowledgements
The authors thank Sunkyoung Park, Hyeok Yong Kwon, Yesola Kweon, Christopher Larimer, the editors of the Journal of East Asian Studies, and the anonymous reviewers for offering helpful feedback.
Funding statement
This research was supported by the Institute for AI and Social Innovation at Yonsei University and the Yonsei University Research Fund of 2024 (2024–22–0525).
Competing interests
The authors declare none.



 Open access

