


1 Introduction
The
 $\unicode[STIX]{x1D6FF}f$
-PIC method (Dimits & Lee Reference Dimits and Lee1993; Parker & Lee Reference Parker and Lee1993) is widely used for electrostatic gyrokinetic particle-in-cell (PIC) simulations to discretise the gyro-centre particle number distribution function
$\unicode[STIX]{x1D6FF}f$
-PIC method (Dimits & Lee Reference Dimits and Lee1993; Parker & Lee Reference Parker and Lee1993) is widely used for electrostatic gyrokinetic particle-in-cell (PIC) simulations to discretise the gyro-centre particle number distribution function
 $f_{s}$
of a species
$f_{s}$
of a species
 $s$
. It is based on the
$s$
. It is based on the
 $\unicode[STIX]{x1D6FF}f$
-ansatz
$\unicode[STIX]{x1D6FF}f$
-ansatz
 $$\begin{eqnarray}f_{s}=f_{0s}+\unicode[STIX]{x1D6FF}f_{s},\end{eqnarray}$$
where the distribution function
 $f_{s}$
is split into a usually time-independent background
$f_{s}$
is split into a usually time-independent background
 $f_{0s}$
and a time-dependent perturbation
$f_{0s}$
and a time-dependent perturbation
 $\unicode[STIX]{x1D6FF}f_{s}$
. As long as the perturbed part
$\unicode[STIX]{x1D6FF}f_{s}$
. As long as the perturbed part
 $\unicode[STIX]{x1D6FF}f_{s}$
remains small in comparison to the background part
$\unicode[STIX]{x1D6FF}f_{s}$
remains small in comparison to the background part
 $f_{0s}$
, which is usually chosen to be a Maxwellian, the
$f_{0s}$
, which is usually chosen to be a Maxwellian, the
 $\unicode[STIX]{x1D6FF}f$
-method reduces the statistical noise in some situations dramatically.
$\unicode[STIX]{x1D6FF}f$
-method reduces the statistical noise in some situations dramatically.
Although there is no approximation involved in the
 $\unicode[STIX]{x1D6FF}f$
-ansatz its basic idea stems from a physically motivated perturbative approach where a small deviation from an equilibrium state should be calculated. Hence, the
$\unicode[STIX]{x1D6FF}f$
-ansatz its basic idea stems from a physically motivated perturbative approach where a small deviation from an equilibrium state should be calculated. Hence, the
 $\unicode[STIX]{x1D6FF}f$
-method for PIC was originally derived by inserting the
$\unicode[STIX]{x1D6FF}f$
-method for PIC was originally derived by inserting the
 $\unicode[STIX]{x1D6FF}f$
-ansatz into the Vlasov–Maxwell equations, which has the disadvantage that an additional evolution equation for the perturbed weights of the Monte Carlo particles (markers) appears. For a long time it did not become clear that, in the nonlinear case, this equation was a dummy equation resulting from its derivation using the
$\unicode[STIX]{x1D6FF}f$
-ansatz into the Vlasov–Maxwell equations, which has the disadvantage that an additional evolution equation for the perturbed weights of the Monte Carlo particles (markers) appears. For a long time it did not become clear that, in the nonlinear case, this equation was a dummy equation resulting from its derivation using the
 $\unicode[STIX]{x1D6FF}f$
-ansatz. In principle, its solution is trivial for the nonlinear case and a time integration can be avoided (Allfrey & Hatzky Reference Allfrey and Hatzky2003). Nevertheless, for the linear case, the evolution equation for the weights needs to be solved. In addition, the question about the quantitative reduction of the statistical error for a given
$\unicode[STIX]{x1D6FF}f$
-ansatz. In principle, its solution is trivial for the nonlinear case and a time integration can be avoided (Allfrey & Hatzky Reference Allfrey and Hatzky2003). Nevertheless, for the linear case, the evolution equation for the weights needs to be solved. In addition, the question about the quantitative reduction of the statistical error for a given
 $\unicode[STIX]{x1D6FF}f$
was not answered. Both problems show that there was a lack of a solid mathematical framework for a rigorous description. Finally, Aydemir (Reference Aydemir1994) conveyed the message that the conventional
$\unicode[STIX]{x1D6FF}f$
was not answered. Both problems show that there was a lack of a solid mathematical framework for a rigorous description. Finally, Aydemir (Reference Aydemir1994) conveyed the message that the conventional
 $\unicode[STIX]{x1D6FF}f$
-method for PIC can be traced back to a standard Monte Carlo method, called the control variates method, which is widely used in the Monte Carlo community as a variance reduction method. Usually, the variance and with it the statistical error can be numerically computed within the simulation so that it is possible to quantify and to monitor the error reduction by the
$\unicode[STIX]{x1D6FF}f$
-method for PIC can be traced back to a standard Monte Carlo method, called the control variates method, which is widely used in the Monte Carlo community as a variance reduction method. Usually, the variance and with it the statistical error can be numerically computed within the simulation so that it is possible to quantify and to monitor the error reduction by the
 $\unicode[STIX]{x1D6FF}f$
-method as a control variates method.
$\unicode[STIX]{x1D6FF}f$
-method as a control variates method.
In principle, it is possible to use the
 $\unicode[STIX]{x1D6FF}f$
-method for electromagnetic gyrokinetic PIC simulation (Mishchenko, Hatzky & Könies Reference Mishchenko, Hatzky and Könies2004a
), but the time-step size can be quite restrictive and the required number of markers can be so large that PIC simulations become unfeasible. Hence, in the past three decades, many attempts have been made to improve electromagnetic PIC algorithms in two respects: the increase of the time-step size (Kleiber et al.
Reference Kleiber, Hatzky, Könies, Mishchenko and Sonnendrücker2016) and the reduction of the statistical error (Mishchenko et al.
Reference Mishchenko, Bottino, Hatzky, Sonnendrücker, Kleiber and Könies2017). In the following, we will focus on the latter in the context of simulation of damped magnetohydrodynamics (MHD) modes.
$\unicode[STIX]{x1D6FF}f$
-method for electromagnetic gyrokinetic PIC simulation (Mishchenko, Hatzky & Könies Reference Mishchenko, Hatzky and Könies2004a
), but the time-step size can be quite restrictive and the required number of markers can be so large that PIC simulations become unfeasible. Hence, in the past three decades, many attempts have been made to improve electromagnetic PIC algorithms in two respects: the increase of the time-step size (Kleiber et al.
Reference Kleiber, Hatzky, Könies, Mishchenko and Sonnendrücker2016) and the reduction of the statistical error (Mishchenko et al.
Reference Mishchenko, Bottino, Hatzky, Sonnendrücker, Kleiber and Könies2017). In the following, we will focus on the latter in the context of simulation of damped magnetohydrodynamics (MHD) modes.
The symplectic (
 $v_{\Vert }$
-) formulation of the gyrokinetic Vlasov–Maxwell system has the disadvantage that a partial time derivative of the perturbed parallel magnetic potential
$v_{\Vert }$
-) formulation of the gyrokinetic Vlasov–Maxwell system has the disadvantage that a partial time derivative of the perturbed parallel magnetic potential
 $\unicode[STIX]{x1D6FF}A_{\Vert }$
occurs in the parallel dynamics. Hence, it is very difficult to integrate the parallel dynamics of the markers in time numerically. On the contrary, the so-called ‘
$\unicode[STIX]{x1D6FF}A_{\Vert }$
occurs in the parallel dynamics. Hence, it is very difficult to integrate the parallel dynamics of the markers in time numerically. On the contrary, the so-called ‘
 $p_{\Vert }$
-formulation’ (Hahm, Lee & Brizard Reference Hahm, Lee and Brizard1988) (also called the Hamiltonian formulation) of the gyrokinetic Vlasov–Maxwell system does not have this problem. But it suffers from a large statistical variance in the evaluation of the moments of the distribution function.
$p_{\Vert }$
-formulation’ (Hahm, Lee & Brizard Reference Hahm, Lee and Brizard1988) (also called the Hamiltonian formulation) of the gyrokinetic Vlasov–Maxwell system does not have this problem. But it suffers from a large statistical variance in the evaluation of the moments of the distribution function.
The evolution of the gyrokinetic distribution function depends on the chosen formulation, therefore the gyro-centre distribution function in Hamiltonian (
 $p_{\Vert }$
-) formulation,
$p_{\Vert }$
-) formulation,
 $f^{\text{h}}$
, evolves differently from the distribution function in the symplectic (
$f^{\text{h}}$
, evolves differently from the distribution function in the symplectic (
 $v_{\Vert }$
-) formulation,
$v_{\Vert }$
-) formulation,
 $f^{\text{s}}$
. In particular the
$f^{\text{s}}$
. In particular the
 $p_{\Vert }$
-coordinate is shifted in comparison to the
$p_{\Vert }$
-coordinate is shifted in comparison to the
 $v_{\Vert }$
-coordinate by a linear coordinate transformation. The distribution function is shifted accordingly with the result that the background
$v_{\Vert }$
-coordinate by a linear coordinate transformation. The distribution function is shifted accordingly with the result that the background
 $f_{0}$
in the
$f_{0}$
in the
 $\unicode[STIX]{x1D6FF}f$
-ansatz of the Hamiltonian formulation becomes misaligned. As a consequence, the perturbation to the distribution function,
$\unicode[STIX]{x1D6FF}f$
-ansatz of the Hamiltonian formulation becomes misaligned. As a consequence, the perturbation to the distribution function,
 $\unicode[STIX]{x1D6FF}f^{\text{h}}$
, evolves a so-called ‘adiabatic (Boltzmann) part’ in comparison to
$\unicode[STIX]{x1D6FF}f^{\text{h}}$
, evolves a so-called ‘adiabatic (Boltzmann) part’ in comparison to
 $\unicode[STIX]{x1D6FF}f^{\text{s}}$
. The adiabatic part can be very pronounced so that its contribution to the variance becomes dominant. In such a case, its complement, the physically relevant non-adiabatic part of the distribution function, is exceeded by the adiabatic response to the perturbed magnetic potential
$\unicode[STIX]{x1D6FF}f^{\text{s}}$
. The adiabatic part can be very pronounced so that its contribution to the variance becomes dominant. In such a case, its complement, the physically relevant non-adiabatic part of the distribution function, is exceeded by the adiabatic response to the perturbed magnetic potential
 $\unicode[STIX]{x1D6FF}A_{\Vert }$
. This produces a severe signal-to-noise problem, especially at high density, i.e. high beta cases, and/or small perpendicular wavenumbers
$\unicode[STIX]{x1D6FF}A_{\Vert }$
. This produces a severe signal-to-noise problem, especially at high density, i.e. high beta cases, and/or small perpendicular wavenumbers
 $k_{\bot }$
where the relevant signal is so small that it is usually swamped by the statistical noise.
$k_{\bot }$
where the relevant signal is so small that it is usually swamped by the statistical noise.
As the evaluation of the moments of the perturbation to the distribution function,
 $\unicode[STIX]{x1D6FF}f^{\text{s}}$
, does not suffer from the spurious adiabatic part it would make sense to evaluate the moments in the symplectic formulation instead. Therefore, we propose a hybrid scheme which evolves the equations of motion and thus the distribution function in the Hamiltonian formulation, but evaluates the potential equations in the symplectic formulation. For this a transformation from
$\unicode[STIX]{x1D6FF}f^{\text{s}}$
, does not suffer from the spurious adiabatic part it would make sense to evaluate the moments in the symplectic formulation instead. Therefore, we propose a hybrid scheme which evolves the equations of motion and thus the distribution function in the Hamiltonian formulation, but evaluates the potential equations in the symplectic formulation. For this a transformation from
 $\unicode[STIX]{x1D6FF}f^{\text{h}}$
to
$\unicode[STIX]{x1D6FF}f^{\text{h}}$
to
 $\unicode[STIX]{x1D6FF}f^{\text{s}}$
becomes necessary. In the linear case, the derived scheme is equivalent to an enhanced control variates method (Hatzky, Könies & Mishchenko Reference Hatzky, Könies and Mishchenko2007) which has been presented to solve the inaccuracy problem.
$\unicode[STIX]{x1D6FF}f^{\text{s}}$
becomes necessary. In the linear case, the derived scheme is equivalent to an enhanced control variates method (Hatzky, Könies & Mishchenko Reference Hatzky, Könies and Mishchenko2007) which has been presented to solve the inaccuracy problem.
Although the basic idea of the proposed algorithm is straightforward, the required accuracy of the numerical implementation is very high. This is a consequence of the fact that in the MHD limit (
 $k_{\bot }\unicode[STIX]{x1D70C}\rightarrow 0$
) the ratio between the adiabatic and non-adiabatic parts of the distribution function can be more than three orders of magnitude. Therefore, the implemented transformation of the perturbation to the distribution function,
$k_{\bot }\unicode[STIX]{x1D70C}\rightarrow 0$
) the ratio between the adiabatic and non-adiabatic parts of the distribution function can be more than three orders of magnitude. Therefore, the implemented transformation of the perturbation to the distribution function,
 $\unicode[STIX]{x1D6FF}f^{\text{h}}$
to
$\unicode[STIX]{x1D6FF}f^{\text{h}}$
to
 $\unicode[STIX]{x1D6FF}f^{\text{s}}$
, can only work if the numerical error of
$\unicode[STIX]{x1D6FF}f^{\text{s}}$
, can only work if the numerical error of
 $\unicode[STIX]{x1D6FF}f^{\text{h}}$
is significantly smaller than the magnitude of
$\unicode[STIX]{x1D6FF}f^{\text{h}}$
is significantly smaller than the magnitude of
 $\unicode[STIX]{x1D6FF}f^{\text{s}}$
. Small inconsistencies at the level of the discretisation and implementation, which are usually unimportant, have to be avoided to be able to run a MHD mode simulation within a gyrokinetic model. More complex geometries, e.g. large tokamaks with a small aspect ratio, are especially challenging.
$\unicode[STIX]{x1D6FF}f^{\text{s}}$
. Small inconsistencies at the level of the discretisation and implementation, which are usually unimportant, have to be avoided to be able to run a MHD mode simulation within a gyrokinetic model. More complex geometries, e.g. large tokamaks with a small aspect ratio, are especially challenging.
This situation is aggravated by the fact that we also want to simulate damped modes. For a damped mode the inherent statistical noise accumulates over time whilst for a sufficiently unstable mode the simulation can keep the noise at bay. In addition, the MHD modes become marginally stable in the MHD limit so that the damping rates become arbitrarily small. Therefore, the resolving power of the PIC code must be high enough to yield quantitatively correct damping rates. This is one of the most challenging tasks for PIC codes which demands a precise discretisation of the model equations and the reduction of all sources of error to a minimum. To be able to reproduce our approach it is indispensable to describe the numerics in great detail.
In this context, we will address the following topics:
(i) Shifted Maxwellian as background distribution function
 $f_{0}$
.
$f_{0}$
.(ii) Effect of the full phase-space Jacobian.
(iii) Effect of a limited velocity sphere.
(iv) Solving of the potential equations in the symplectic formulation.
(v) Consistent finite element approach for the discretisation of the parallel electric field perturbation in the parallel dynamics.

2 The statistical error in Monte Carlo integration
There is always a statistical error involved when it comes to the evaluation of the moments of the distribution function
 $f$
via a Monte Carlo approach. Such moments are derived by evaluating integrals over the phase-space volume
$f$
via a Monte Carlo approach. Such moments are derived by evaluating integrals over the phase-space volume
 $\unicode[STIX]{x1D6FA}$
 $$\begin{eqnarray}I(\tilde{\unicode[STIX]{x1D6EC}})\stackrel{\text{def}}{=}\int _{\unicode[STIX]{x1D6FA}}\tilde{\unicode[STIX]{x1D6EC}}(\boldsymbol{z})f(\boldsymbol{z})\,{\mathcal{J}}_{z}\,\text{d}^{6}z,\end{eqnarray}$$
where
 $\tilde{\unicode[STIX]{x1D6EC}}(\boldsymbol{z})$
is a general function of the phase-space coordinates
$\tilde{\unicode[STIX]{x1D6EC}}(\boldsymbol{z})$
is a general function of the phase-space coordinates
 $\boldsymbol{z}$
with the Jacobian
$\boldsymbol{z}$
with the Jacobian
 ${\mathcal{J}}_{z}$
. For example,
${\mathcal{J}}_{z}$
. For example,
 $I(\tilde{\unicode[STIX]{x1D6EC}})$
would be the total particle number if
$I(\tilde{\unicode[STIX]{x1D6EC}})$
would be the total particle number if
 $\tilde{\unicode[STIX]{x1D6EC}}=1$
, and the integral is evaluated over the whole phase space. If
$\tilde{\unicode[STIX]{x1D6EC}}=1$
, and the integral is evaluated over the whole phase space. If
 $\boldsymbol{z}$
is a continuous random variable in
$\boldsymbol{z}$
is a continuous random variable in
 $\mathbb{R}^{n}$
with a probability density
$\mathbb{R}^{n}$
with a probability density
 $g(\boldsymbol{z})$
in the phase-space volume
$g(\boldsymbol{z})$
in the phase-space volume
 $\unicode[STIX]{x1D6FA}$
such that
$\unicode[STIX]{x1D6FA}$
such that
 $$\begin{eqnarray}\int _{\unicode[STIX]{x1D6FA}}g(\boldsymbol{z}){\mathcal{J}}_{z}\,\text{d}^{6}z=1\quad \text{and}\quad g(\boldsymbol{z})>0,\end{eqnarray}$$
we can draw an independent random sample (
 $\boldsymbol{z}_{1},\boldsymbol{z}_{2},\ldots ,\boldsymbol{z}_{N_{\text{p}}}$
) to place our
$\boldsymbol{z}_{1},\boldsymbol{z}_{2},\ldots ,\boldsymbol{z}_{N_{\text{p}}}$
) to place our
 $N_{\text{p}}$
Monte Carlo sampling points (markers) within phase space. Then the integral for
$N_{\text{p}}$
Monte Carlo sampling points (markers) within phase space. Then the integral for
 $I(\tilde{\unicode[STIX]{x1D6EC}})$
can be written as an expected value with respect to the distribution
$I(\tilde{\unicode[STIX]{x1D6EC}})$
can be written as an expected value with respect to the distribution
 $g(\boldsymbol{z})$
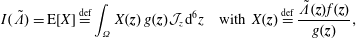 $$\begin{eqnarray}I(\tilde{\unicode[STIX]{x1D6EC}})=\text{E}[X]\stackrel{\text{def}}{=}\int _{\unicode[STIX]{x1D6FA}}X(\boldsymbol{z})\,g(\boldsymbol{z}){\mathcal{J}}_{z}\,\text{d}^{6}z\quad \text{with }X(\boldsymbol{z})\stackrel{\text{def}}{=}\frac{\tilde{\unicode[STIX]{x1D6EC}}(\boldsymbol{z})f(\boldsymbol{z})}{g(\boldsymbol{z})},\end{eqnarray}$$
where
 $\text{E}[X]$
is the expected value of the random variable
$\text{E}[X]$
is the expected value of the random variable
 $X$
. In addition, we define the variance of
$X$
. In addition, we define the variance of
 $X$
by
$X$
by
 $$\begin{eqnarray}\text{Var}_{g}[X]\stackrel{\text{def}}{=}\text{E}[(X-\text{E}[X])^{2}].\end{eqnarray}$$
Thus, in contrast to the expected value, which is in our case (see (2.3)) independent of the marker distribution function
 $g(\boldsymbol{z})$
, the choice of
$g(\boldsymbol{z})$
, the choice of
 $g(\boldsymbol{z})$
strongly influences the value of the variance.
$g(\boldsymbol{z})$
strongly influences the value of the variance.
An unbiased Monte Carlo estimator for the integral
 $I(\tilde{\unicode[STIX]{x1D6EC}})$
, which approximates
$I(\tilde{\unicode[STIX]{x1D6EC}})$
, which approximates
 $\text{E}[X]$
up to the statistical error
$\text{E}[X]$
up to the statistical error
 $\unicode[STIX]{x1D700}_{\text{E}}$
, is given by the sum over all marker weights
$\unicode[STIX]{x1D700}_{\text{E}}$
, is given by the sum over all marker weights
 $w_{p}$
:
$w_{p}$
:
 $$\begin{eqnarray}I(\tilde{\unicode[STIX]{x1D6EC}})=\text{E}[X]=\frac{1}{N_{\text{p}}}\mathop{\sum }_{p=1}^{N_{\text{p}}}\tilde{\unicode[STIX]{x1D6EC}}(\boldsymbol{z}_{p})\,w_{p}\,\pm \,\unicode[STIX]{x1D700}_{\text{E}}\quad \text{where }w_{p}\stackrel{\text{def}}{=}\frac{f(\boldsymbol{z}_{p})}{g(\boldsymbol{z}_{p})}.\end{eqnarray}$$
Accordingly, an unbiased estimator for the variance can be given:
 $$\begin{eqnarray}\text{Var}_{g}[X]=\text{E}[X^{2}]-(\text{E}[X])^{2}=\frac{1}{N_{\text{p}}-1}\left(\mathop{\sum }_{p=1}^{N_{\text{p}}}[\tilde{\unicode[STIX]{x1D6EC}}(\boldsymbol{z}_{p})\,w_{p}]^{2}-\frac{1}{N_{\text{p}}}\left[\mathop{\sum }_{p=1}^{N_{\text{p}}}\tilde{\unicode[STIX]{x1D6EC}}(\boldsymbol{z}_{p})\,w_{p}\right]^{2}\right)\,\pm \unicode[STIX]{x1D700}_{\text{Var}},\end{eqnarray}$$
where
 $\unicode[STIX]{x1D700}_{\text{Var}}$
denotes the statistical error of the variance.
$\unicode[STIX]{x1D700}_{\text{Var}}$
denotes the statistical error of the variance.
Finally, the statistical error of
 $\text{E}[X]$
for a number of
$\text{E}[X]$
for a number of
 $N_{\text{p}}$
markers is given as
$N_{\text{p}}$
markers is given as
 $$\begin{eqnarray}\unicode[STIX]{x1D700}_{\text{E}}\simeq \frac{\unicode[STIX]{x1D70E}}{\sqrt{N_{\text{p}}}},\end{eqnarray}$$
with the definition of the standard deviation
 $\unicode[STIX]{x1D70E}=\sqrt{\text{Var}_{g}[X]}$
. One sees that the convergence rate of
$\unicode[STIX]{x1D70E}=\sqrt{\text{Var}_{g}[X]}$
. One sees that the convergence rate of
 $1/\sqrt{N_{\text{p}}}$
is quite poor, i.e. to halve the error one needs four times more markers. Hence, it would be much more efficient if the standard deviation
$1/\sqrt{N_{\text{p}}}$
is quite poor, i.e. to halve the error one needs four times more markers. Hence, it would be much more efficient if the standard deviation
 $\unicode[STIX]{x1D70E}$
could be reduced. Fortunately, for the Monte Carlo approach there exist variance reduction methods like e.g. the control variates method (see appendix A) which pursue exactly this aim. The effectiveness of such a method can be easily monitored by calculating the variance before and after applying it.
$\unicode[STIX]{x1D70E}$
could be reduced. Fortunately, for the Monte Carlo approach there exist variance reduction methods like e.g. the control variates method (see appendix A) which pursue exactly this aim. The effectiveness of such a method can be easily monitored by calculating the variance before and after applying it.
2.1 Some useful properties of the weights
Using weights gives a high degree of flexibility. With just one marker distribution function
 $g$
different distribution functions
$g$
different distribution functions
 $f$
and
$f$
and
 $\tilde{f}$
can be expressed by just rescaling the weights:
$\tilde{f}$
can be expressed by just rescaling the weights:
 $$\begin{eqnarray}\tilde{w}_{p}\stackrel{\text{def}}{=}\frac{\tilde{f}(\boldsymbol{z}_{p})}{g(\boldsymbol{z}_{p})}=\frac{\tilde{f}(\boldsymbol{z}_{p})}{f(\boldsymbol{z}_{p})}\frac{f(\boldsymbol{z}_{p})}{g(\boldsymbol{z}_{p})}=\frac{\tilde{f_{p}}}{f_{p}}w_{p}.\end{eqnarray}$$
Here we have introduced the abbreviation
 $f_{p}=\,f(\boldsymbol{z}_{p})$
to express that we want to evaluate a quantity at the position of the marker
$f_{p}=\,f(\boldsymbol{z}_{p})$
to express that we want to evaluate a quantity at the position of the marker
 $\boldsymbol{z}_{p}$
in phase space.
$\boldsymbol{z}_{p}$
in phase space.
If we express the marker distribution function
 $g$
itself by the weights, the weights become equal to one. In such a case, we can easily check that the normalisation condition of the marker distribution function, equation (2.2), is fulfilled by our unbiased estimator for the expected value:
$g$
itself by the weights, the weights become equal to one. In such a case, we can easily check that the normalisation condition of the marker distribution function, equation (2.2), is fulfilled by our unbiased estimator for the expected value:
 $$\begin{eqnarray}\frac{1}{N_{\text{p}}}\mathop{\sum }_{p=1}^{N_{\text{p}}}\left.w_{p}\right|_{f_{p}=g_{p}}=\frac{1}{N_{\text{p}}}\mathop{\sum }_{p=1}^{N_{\text{p}}}1=1.\end{eqnarray}$$
In addition, we can define a phase-space volume
 $\unicode[STIX]{x1D6FA}_{p}$
for each marker:
$\unicode[STIX]{x1D6FA}_{p}$
for each marker:
 $$\begin{eqnarray}\unicode[STIX]{x1D6FA}\simeq \frac{1}{N_{\text{p}}}\mathop{\sum }_{p=1}^{N_{\text{p}}}\left.w_{p}\right|_{f_{p}=1}=\frac{1}{N_{\text{p}}}\mathop{\sum }_{p=1}^{N_{\text{p}}}\frac{1}{g_{p}}=\mathop{\sum }_{p=1}^{N_{\text{p}}}\frac{1}{N_{\text{p}}g_{p}}=\mathop{\sum }_{p=1}^{N_{\text{p}}}\unicode[STIX]{x1D6FA}_{p}\quad \text{where }\unicode[STIX]{x1D6FA}_{p}\stackrel{\text{def}}{=}\frac{1}{N_{\text{p}}g_{p}}.\end{eqnarray}$$
Note that the phase-space volume
 $\unicode[STIX]{x1D6FA}_{p}$
as defined here is a constant of motion along the trajectories as long as
$\unicode[STIX]{x1D6FA}_{p}$
as defined here is a constant of motion along the trajectories as long as
 $\text{d}g/\text{d}t=0$
, which is the case for a Hamiltonian flow.
$\text{d}g/\text{d}t=0$
, which is the case for a Hamiltonian flow.
3 The gyrokinetic model
3.1 The model equations in the symplectic formulation
The gyrokinetic equations in the symplectic formulation (
 $v_{\Vert }$
-formulation) as postulated by Kleiber et al. (Reference Kleiber, Hatzky, Könies, Mishchenko and Sonnendrücker2016) are used to calculate the time evolution of the gyro-centre distribution function
$v_{\Vert }$
-formulation) as postulated by Kleiber et al. (Reference Kleiber, Hatzky, Könies, Mishchenko and Sonnendrücker2016) are used to calculate the time evolution of the gyro-centre distribution function
 $f^{\text{s}}(\boldsymbol{R},v_{\Vert },\tilde{\unicode[STIX]{x1D707}},t)$
of each species:
$f^{\text{s}}(\boldsymbol{R},v_{\Vert },\tilde{\unicode[STIX]{x1D707}},t)$
of each species:
 $$\begin{eqnarray}\frac{\text{d}f^{\text{s}}}{\text{d}t}=\frac{\unicode[STIX]{x2202}f^{\text{s}}}{\unicode[STIX]{x2202}t}+\unicode[STIX]{x1D735}f^{\text{s}}\boldsymbol{\cdot }\frac{\text{d}\boldsymbol{R}}{\text{d}t}+\frac{\unicode[STIX]{x2202}f^{\text{s}}}{\unicode[STIX]{x2202}v_{\Vert }}\frac{\text{d}v_{\Vert }}{\text{d}t}+\frac{\unicode[STIX]{x2202}f^{\text{s}}}{\unicode[STIX]{x2202}\tilde{\unicode[STIX]{x1D707}}}\frac{\text{d}\tilde{\unicode[STIX]{x1D707}}}{\text{d}t}=0,\end{eqnarray}$$
where
 $\boldsymbol{R},v_{\Vert },\tilde{\unicode[STIX]{x1D707}}$
are the gyro-centre position, parallel velocity and magnetic moment per unit mass. The gyro-centre distribution function is gyrotropic, i.e. it is independent of the gyro-phase angle
$\boldsymbol{R},v_{\Vert },\tilde{\unicode[STIX]{x1D707}}$
are the gyro-centre position, parallel velocity and magnetic moment per unit mass. The gyro-centre distribution function is gyrotropic, i.e. it is independent of the gyro-phase angle
 $\unicode[STIX]{x1D6FC}$
of the gyration. Without loss of generality we restrict ourselves to a model which includes just ions and electrons.
$\unicode[STIX]{x1D6FC}$
of the gyration. Without loss of generality we restrict ourselves to a model which includes just ions and electrons.
The key idea of the Monte Carlo method is that the markers follow the characteristics of (3.1), i.e. the trajectories of the physical particles of the plasma. Therefore, the marker distribution
 $g^{\text{s}}$
has to evolve in the same way as the phase-space distribution function
$g^{\text{s}}$
has to evolve in the same way as the phase-space distribution function
 $f^{\text{s}}$
:
$f^{\text{s}}$
:
 $$\begin{eqnarray}\frac{\text{d}g^{\text{s}}}{\text{d}t}=\frac{\unicode[STIX]{x2202}g^{\text{s}}}{\unicode[STIX]{x2202}t}+\unicode[STIX]{x1D735}g^{\text{s}}\boldsymbol{\cdot }\frac{\text{d}\boldsymbol{R}}{\text{d}t}+\frac{\unicode[STIX]{x2202}g^{\text{s}}}{\unicode[STIX]{x2202}v_{\Vert }}\frac{\text{d}v_{\Vert }}{\text{d}t}+\frac{\unicode[STIX]{x2202}g^{\text{s}}}{\unicode[STIX]{x2202}\tilde{\unicode[STIX]{x1D707}}}\frac{\text{d}\tilde{\unicode[STIX]{x1D707}}}{\text{d}t}=0.\end{eqnarray}$$
The equations of motion for the gyro-centre trajectories in reduced phase space
 $(\boldsymbol{R},v_{\Vert },\tilde{\unicode[STIX]{x1D707}})$
are
$(\boldsymbol{R},v_{\Vert },\tilde{\unicode[STIX]{x1D707}})$
are
 $$\begin{eqnarray}\displaystyle \frac{\text{d}\boldsymbol{R}}{\text{d}t} & = & \displaystyle \,v_{\Vert }\boldsymbol{b}+\frac{1}{B_{\Vert }^{\ast \text{s}}}\boldsymbol{b}\times \unicode[STIX]{x1D735}(\langle \unicode[STIX]{x1D6FF}\unicode[STIX]{x1D719}\rangle -v_{\Vert }\langle \unicode[STIX]{x1D6FF}A_{\Vert }\rangle )\nonumber\\ \displaystyle & & \displaystyle +\,\frac{m}{q}\left[\frac{\tilde{\unicode[STIX]{x1D707}}B+v_{\Vert }^{2}}{BB_{\Vert }^{\ast \text{s}}}\boldsymbol{b}\times \unicode[STIX]{x1D735}B+\frac{v_{\Vert }^{2}}{BB_{\Vert }^{\ast \text{s}}}(\unicode[STIX]{x1D735}\times \boldsymbol{B})_{\bot }\right]+\frac{v_{\Vert }}{B_{\Vert }^{\ast \text{s}}}\boldsymbol{b}\times \unicode[STIX]{x1D73F}\,\langle \unicode[STIX]{x1D6FF}A_{\Vert }\rangle ,\end{eqnarray}$$
 $$\begin{eqnarray}\displaystyle \frac{\text{d}v_{\Vert }}{\text{d}t} & = & \displaystyle -\frac{q}{m}\left(\frac{\unicode[STIX]{x2202}\langle \unicode[STIX]{x1D6FF}A_{\Vert }\rangle }{\unicode[STIX]{x2202}t}+\boldsymbol{b}\boldsymbol{\cdot }\unicode[STIX]{x1D735}\langle \unicode[STIX]{x1D6FF}\unicode[STIX]{x1D719}\rangle +\frac{1}{B_{\Vert }^{\ast \text{s}}}\unicode[STIX]{x1D735}\langle \unicode[STIX]{x1D6FF}A_{\Vert }\rangle \boldsymbol{\cdot }\boldsymbol{b}\times \unicode[STIX]{x1D735}\langle \unicode[STIX]{x1D6FF}\unicode[STIX]{x1D719}\rangle \right)\nonumber\\ \displaystyle & & \displaystyle -\,\frac{\tilde{\unicode[STIX]{x1D707}}}{B_{\Vert }^{\ast \text{s}}}\left[\boldsymbol{b}\times \unicode[STIX]{x1D735}B\boldsymbol{\cdot }\unicode[STIX]{x1D735}\langle \unicode[STIX]{x1D6FF}A_{\Vert }\rangle +\frac{1}{B}\unicode[STIX]{x1D735}B\boldsymbol{\cdot }(\unicode[STIX]{x1D735}\times B)_{\bot }\langle \unicode[STIX]{x1D6FF}A_{\Vert }\rangle \right]\nonumber\\ \displaystyle & & \displaystyle -\,\frac{1}{B_{\Vert }^{\ast \text{s}}}\!\left(v_{\Vert }+\frac{q}{m}\langle \unicode[STIX]{x1D6FF}A_{\Vert }\rangle \!\right)\boldsymbol{b}\times \unicode[STIX]{x1D73F}\boldsymbol{\cdot }\unicode[STIX]{x1D735}\langle \unicode[STIX]{x1D6FF}\unicode[STIX]{x1D719}\rangle -\tilde{\unicode[STIX]{x1D707}}\,\unicode[STIX]{x1D735}B\boldsymbol{\cdot }\!\left[\boldsymbol{b}+\frac{m}{q}\frac{v_{\Vert }}{BB_{\Vert }^{\ast \text{s}}}(\unicode[STIX]{x1D735}\times \boldsymbol{B})_{\bot }\right]\!,\quad\end{eqnarray}$$
 $$\begin{eqnarray}\frac{\text{d}\tilde{\unicode[STIX]{x1D707}}}{\text{d}t}=0,\end{eqnarray}$$
with
 $\unicode[STIX]{x1D6FF}\unicode[STIX]{x1D719}$
the perturbed electrostatic potential,
$\unicode[STIX]{x1D6FF}\unicode[STIX]{x1D719}$
the perturbed electrostatic potential,
 $\unicode[STIX]{x1D6FF}A_{\Vert }$
the perturbed parallel magnetic potential and
$\unicode[STIX]{x1D6FF}A_{\Vert }$
the perturbed parallel magnetic potential and
 $q$
and
$q$
and
 $m$
the charge and mass of the species. Furthermore, we have
$m$
the charge and mass of the species. Furthermore, we have
 $\boldsymbol{b}\times \unicode[STIX]{x1D73F}=[\boldsymbol{b}\times \unicode[STIX]{x1D735}B+(\unicode[STIX]{x1D735}\times \boldsymbol{B})_{\bot }]/B$
,
$\boldsymbol{b}\times \unicode[STIX]{x1D73F}=[\boldsymbol{b}\times \unicode[STIX]{x1D735}B+(\unicode[STIX]{x1D735}\times \boldsymbol{B})_{\bot }]/B$
,
 $\boldsymbol{B}^{\ast \text{s}}=\unicode[STIX]{x1D735}\times \boldsymbol{A}^{\ast \text{s}}$
,
$\boldsymbol{B}^{\ast \text{s}}=\unicode[STIX]{x1D735}\times \boldsymbol{A}^{\ast \text{s}}$
,
 $\boldsymbol{A}^{\ast \text{s}}=\boldsymbol{A}_{0}+(mv_{\Vert }/q+\langle \unicode[STIX]{x1D6FF}A_{\Vert }\rangle )\boldsymbol{b}$
the so-called ‘modified vector potential’,
$\boldsymbol{A}^{\ast \text{s}}=\boldsymbol{A}_{0}+(mv_{\Vert }/q+\langle \unicode[STIX]{x1D6FF}A_{\Vert }\rangle )\boldsymbol{b}$
the so-called ‘modified vector potential’,
 $\boldsymbol{A}_{0}$
the background magnetic vector potential corresponding to the equilibrium magnetic field
$\boldsymbol{A}_{0}$
the background magnetic vector potential corresponding to the equilibrium magnetic field
 $\boldsymbol{B}=\unicode[STIX]{x1D735}\times \boldsymbol{A}_{0}$
and
$\boldsymbol{B}=\unicode[STIX]{x1D735}\times \boldsymbol{A}_{0}$
and
 $\boldsymbol{b}=\boldsymbol{B}/B$
its unit vector. The Jacobian of phase space
$\boldsymbol{b}=\boldsymbol{B}/B$
its unit vector. The Jacobian of phase space
 ${\mathcal{J}}_{z}^{\text{s}}$
is given in the symplectic formulation by
${\mathcal{J}}_{z}^{\text{s}}$
is given in the symplectic formulation by
 $$\begin{eqnarray}{\mathcal{J}}_{z}^{\text{s}}=B_{\Vert }^{\ast \text{s}}(\boldsymbol{R},v_{\Vert },\tilde{\unicode[STIX]{x1D707}})=\boldsymbol{b}\boldsymbol{\cdot }\boldsymbol{B}^{\ast \text{s}}=B+\left(\frac{m}{q}v_{\Vert }+\langle \unicode[STIX]{x1D6FF}A_{\Vert }\rangle \right)\boldsymbol{b}\boldsymbol{\cdot }(\unicode[STIX]{x1D735}\times \boldsymbol{b}).\end{eqnarray}$$
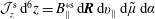
The corresponding gyro-averaged potentials are defined as
 $$\begin{eqnarray}\langle \unicode[STIX]{x1D6FF}\unicode[STIX]{x1D719}\rangle (\boldsymbol{R},\tilde{\unicode[STIX]{x1D707}})\stackrel{\text{def}}{=}\frac{1}{2\unicode[STIX]{x03C0}}\mathop{\oint }_{0}^{2\unicode[STIX]{x03C0}}\unicode[STIX]{x1D6FF}\unicode[STIX]{x1D719}(\boldsymbol{R}+\unicode[STIX]{x1D746})\,\text{d}\unicode[STIX]{x1D6FC},\quad \langle \unicode[STIX]{x1D6FF}A_{\Vert }\rangle (\boldsymbol{R},\tilde{\unicode[STIX]{x1D707}})\stackrel{\text{def}}{=}\frac{1}{2\unicode[STIX]{x03C0}}\mathop{\oint }_{0}^{2\unicode[STIX]{x03C0}}\unicode[STIX]{x1D6FF}A_{\Vert }(\boldsymbol{R}+\unicode[STIX]{x1D746})\,\text{d}\unicode[STIX]{x1D6FC},\end{eqnarray}$$
where
 $\unicode[STIX]{x1D746}$
is the gyroradius vector perpendicular to
$\unicode[STIX]{x1D746}$
is the gyroradius vector perpendicular to
 $\boldsymbol{b}$
which can be parametrised by the gyro-phase angle
$\boldsymbol{b}$
which can be parametrised by the gyro-phase angle
 $\unicode[STIX]{x1D6FC}$
 $$\begin{eqnarray}\unicode[STIX]{x1D746}(\boldsymbol{R},\tilde{\unicode[STIX]{x1D707}},\unicode[STIX]{x1D6FC})\stackrel{\text{def}}{=}\unicode[STIX]{x1D70C}[\cos (\unicode[STIX]{x1D6FC})\boldsymbol{e}_{\bot 1}-\sin (\unicode[STIX]{x1D6FC})\boldsymbol{e}_{\bot 2}]\quad \text{and}\quad \unicode[STIX]{x1D70C}\stackrel{\text{def}}{=}\frac{\sqrt{2B\tilde{\unicode[STIX]{x1D707}}}}{\unicode[STIX]{x1D6FA}_{\text{c}}},\end{eqnarray}$$
with
 $\unicode[STIX]{x1D6FA}_{\text{c}}=|q|B/m$
the cyclotron frequency. Note that
$\unicode[STIX]{x1D6FA}_{\text{c}}=|q|B/m$
the cyclotron frequency. Note that
 $\unicode[STIX]{x1D6FC}$
also corresponds to the angular coordinate in velocity space, but we are not interested here in the actual direction of
$\unicode[STIX]{x1D6FC}$
also corresponds to the angular coordinate in velocity space, but we are not interested here in the actual direction of
 $\unicode[STIX]{x1D746}$
which is determined by the fast gyromotion. In the equations of motion the gradient of the gyro-averaged potentials,
$\unicode[STIX]{x1D746}$
which is determined by the fast gyromotion. In the equations of motion the gradient of the gyro-averaged potentials,
 $\unicode[STIX]{x1D735}\langle \unicode[STIX]{x1D6FF}\unicode[STIX]{x1D719}\rangle$
and
$\unicode[STIX]{x1D735}\langle \unicode[STIX]{x1D6FF}\unicode[STIX]{x1D719}\rangle$
and
 $\unicode[STIX]{x1D735}\langle \unicode[STIX]{x1D6FF}A_{\Vert }\rangle$
, has to be known. It can be calculated analytically as shown in appendix B. Whenever gyro-averaging is done, we approximate the orientation of the gyro-ring to lie in the poloidal plane of the plasma device. Furthermore, we assume a reflecting boundary condition for the gyro-ring, i.e. the part of the gyro-ring leaving the simulation domain is reflected back into the domain.
$\unicode[STIX]{x1D735}\langle \unicode[STIX]{x1D6FF}A_{\Vert }\rangle$
, has to be known. It can be calculated analytically as shown in appendix B. Whenever gyro-averaging is done, we approximate the orientation of the gyro-ring to lie in the poloidal plane of the plasma device. Furthermore, we assume a reflecting boundary condition for the gyro-ring, i.e. the part of the gyro-ring leaving the simulation domain is reflected back into the domain.
In a slab and cylindrical geometry it is possible to use the flux label as the radial coordinate. Instead, in a tokamak geometry, the toroidal canonical momentum
 $\unicode[STIX]{x1D6F9}_{0}$
is a conserved quantity and thus can be used as the radial coordinate. However, it has the disadvantage that the temperature and density profiles are usually given as functions of the toroidal flux
$\unicode[STIX]{x1D6F9}_{0}$
is a conserved quantity and thus can be used as the radial coordinate. However, it has the disadvantage that the temperature and density profiles are usually given as functions of the toroidal flux
 $\unicode[STIX]{x1D6F9}$
(see appendix C) which makes their conversion to functions of the toroidal canonical momentum
$\unicode[STIX]{x1D6F9}$
(see appendix C) which makes their conversion to functions of the toroidal canonical momentum
 $\unicode[STIX]{x1D6F9}_{0}$
quite complex (see Angelino et al.
Reference Angelino, Bottino, Hatzky, Jolliet, Sauter, Tran and Villard2006). Ultimately, in a general geometry, i.e. non-quasi-symmetric stellarator geometry, there exists, apart from the energy, no other constant of motion. Furthermore, we know that a more complete physical model would include collisions. At lowest order, we can introduce a collision operator
$\unicode[STIX]{x1D6F9}_{0}$
quite complex (see Angelino et al.
Reference Angelino, Bottino, Hatzky, Jolliet, Sauter, Tran and Villard2006). Ultimately, in a general geometry, i.e. non-quasi-symmetric stellarator geometry, there exists, apart from the energy, no other constant of motion. Furthermore, we know that a more complete physical model would include collisions. At lowest order, we can introduce a collision operator
 ${\mathcal{C}}[f_{0}]$
which acts only on the background distribution function. As a result, the local Maxwellian
${\mathcal{C}}[f_{0}]$
which acts only on the background distribution function. As a result, the local Maxwellian
 $f_{\text{M}}$
is a solution of the equation
$f_{\text{M}}$
is a solution of the equation
 $$\begin{eqnarray}\frac{\text{d}f_{0}}{\text{d}t}={\mathcal{C}}[f_{0}].\end{eqnarray}$$
Hence, we define the local Maxwellian for species
 $s=\text{i},\text{e}$
(ions and electrons) as a function of the toroidal flux
$s=\text{i},\text{e}$
(ions and electrons) as a function of the toroidal flux
 $\unicode[STIX]{x1D6F9}$
 $$\begin{eqnarray}f_{\text{M}s}\stackrel{\text{def}}{=}\frac{\hat{n}_{0s}(\unicode[STIX]{x1D6F9})}{(2\unicode[STIX]{x03C0})^{3/2}\,v_{\text{th}s}^{3}(\unicode[STIX]{x1D6F9})}\exp \left[-\frac{\tilde{E}_{s}}{v_{\text{th}s}^{2}(\unicode[STIX]{x1D6F9})}\right],\end{eqnarray}$$
where the particle energy per unit mass
 $\tilde{E}_{s}$
and thermal velocity
$\tilde{E}_{s}$
and thermal velocity
 $v_{\text{th}s}$
are defined as
$v_{\text{th}s}$
are defined as
 $$\begin{eqnarray}\tilde{E}_{s}\stackrel{\text{def}}{=}\tilde{\unicode[STIX]{x1D707}}B(\boldsymbol{R})+\frac{[v_{\Vert }-\hat{u} _{0s}(\unicode[STIX]{x1D6F9})]^{2}}{2},\quad v_{\text{th}s}(\unicode[STIX]{x1D6F9})\stackrel{\text{def}}{=}\sqrt{\frac{k_{\text{B}}T_{s}(\unicode[STIX]{x1D6F9})}{m_{s}}}\end{eqnarray}$$
and where
 $k_{\text{B}}$
is the Boltzmann constant and
$k_{\text{B}}$
is the Boltzmann constant and
 $T_{s}$
the temperature. The profiles
$T_{s}$
the temperature. The profiles
 $\hat{n}_{0s}$
and
$\hat{n}_{0s}$
and
 $\hat{u} _{0s}$
are the density and mean velocity of the local Maxwellian in guiding centre coordinates.
$\hat{u} _{0s}$
are the density and mean velocity of the local Maxwellian in guiding centre coordinates.
The parallel background and parallel perturbed magnetic potential
 $A_{0\Vert }=\boldsymbol{b}\boldsymbol{\cdot }\boldsymbol{A}_{0}$
and
$A_{0\Vert }=\boldsymbol{b}\boldsymbol{\cdot }\boldsymbol{A}_{0}$
and
 $\unicode[STIX]{x1D6FF}A_{\Vert }$
add up to
$\unicode[STIX]{x1D6FF}A_{\Vert }$
add up to
 $$\begin{eqnarray}A_{\Vert }\stackrel{\text{def}}{=}A_{0\Vert }+\unicode[STIX]{x1D6FF}A_{\Vert }.\end{eqnarray}$$
The particle and current number density are defined as
 $$\begin{eqnarray}\displaystyle & \displaystyle n_{s}^{\text{s}}(\boldsymbol{x})\stackrel{\text{def}}{=}\int f_{s}^{\text{s}}(\boldsymbol{R},v_{\Vert },\tilde{\unicode[STIX]{x1D707}})\,\unicode[STIX]{x1D6FF}(\boldsymbol{R}-\boldsymbol{x})\,B_{\Vert s}^{\ast \text{s}}\,\text{d}\boldsymbol{R}\,\text{d}v_{\Vert }\,\text{d}\tilde{\unicode[STIX]{x1D707}}\,\text{d}\unicode[STIX]{x1D6FC}, & \displaystyle\end{eqnarray}$$
 $$\begin{eqnarray}\displaystyle & \displaystyle j_{\Vert s}^{\text{s}}(\boldsymbol{x})\stackrel{\text{def}}{=}q_{s}\int v_{\Vert }\,f_{s}^{\text{s}}(\boldsymbol{R},v_{\Vert },\tilde{\unicode[STIX]{x1D707}})\,\unicode[STIX]{x1D6FF}(\boldsymbol{R}-\boldsymbol{x})\,B_{\Vert s}^{\ast \text{s}}\,\text{d}\boldsymbol{R}\,\text{d}v_{\Vert }\,\text{d}\tilde{\unicode[STIX]{x1D707}}\,\text{d}\unicode[STIX]{x1D6FC}. & \displaystyle\end{eqnarray}$$
The integration is performed over phase space
 ${\mathcal{J}}_{z}^{\text{s}}\,\text{d}^{6}z=B_{\Vert }^{\ast \text{s}}\,\text{d}\boldsymbol{R}\,\text{d}v_{\Vert }\,\text{d}\tilde{\unicode[STIX]{x1D707}}\,\text{d}\unicode[STIX]{x1D6FC}$
. The gyro-averaged particle and current number density are defined as
${\mathcal{J}}_{z}^{\text{s}}\,\text{d}^{6}z=B_{\Vert }^{\ast \text{s}}\,\text{d}\boldsymbol{R}\,\text{d}v_{\Vert }\,\text{d}\tilde{\unicode[STIX]{x1D707}}\,\text{d}\unicode[STIX]{x1D6FC}$
. The gyro-averaged particle and current number density are defined as
 $$\begin{eqnarray}\displaystyle & \displaystyle \bar{n}_{s}^{\text{s}}(\boldsymbol{x})\stackrel{\text{def}}{=}\int f_{s}^{\text{s}}(\boldsymbol{R},v_{\Vert },\tilde{\unicode[STIX]{x1D707}})\,\unicode[STIX]{x1D6FF}(\boldsymbol{R}+\unicode[STIX]{x1D746}-\boldsymbol{x})\,B_{\Vert s}^{\ast \text{s}}\,\text{d}\boldsymbol{R}\,\text{d}v_{\Vert }\,\text{d}\tilde{\unicode[STIX]{x1D707}}\,\text{d}\unicode[STIX]{x1D6FC}, & \displaystyle\end{eqnarray}$$
 $$\begin{eqnarray}\displaystyle & \displaystyle \bar{j}_{\Vert s}^{\text{s}}(\boldsymbol{x})\stackrel{\text{def}}{=}q_{s}\int v_{\Vert }\,f_{s}^{\text{s}}(\boldsymbol{R},v_{\Vert },\tilde{\unicode[STIX]{x1D707}})\,\unicode[STIX]{x1D6FF}(\boldsymbol{R}+\unicode[STIX]{x1D746}-\boldsymbol{x})\,B_{\Vert s}^{\ast \text{s}}\,\text{d}\boldsymbol{R}\,\text{d}v_{\Vert }\,\text{d}\tilde{\unicode[STIX]{x1D707}}\,\text{d}\unicode[STIX]{x1D6FC}. & \displaystyle\end{eqnarray}$$
The same definitions are applied to the perturbation to the distribution function,
 $\unicode[STIX]{x1D6FF}f$
, which leads to the quantities:
$\unicode[STIX]{x1D6FF}f$
, which leads to the quantities:
 $\unicode[STIX]{x1D6FF}n^{\text{s}}$
,
$\unicode[STIX]{x1D6FF}n^{\text{s}}$
,
 $\unicode[STIX]{x1D6FF}j_{\Vert }^{\text{s}}$
and
$\unicode[STIX]{x1D6FF}j_{\Vert }^{\text{s}}$
and
 $\unicode[STIX]{x1D6FF}\bar{n}^{\text{s}}$
,
$\unicode[STIX]{x1D6FF}\bar{n}^{\text{s}}$
,
 $\unicode[STIX]{x1D6FF}\bar{j}_{\Vert }^{\text{s}}$
.
$\unicode[STIX]{x1D6FF}\bar{j}_{\Vert }^{\text{s}}$
.
At an equilibrium state we have
 $\unicode[STIX]{x1D6FF}A_{\Vert }(t_{0})=0$
and thus the coordinates between the symplectic and Hamiltonian (
$\unicode[STIX]{x1D6FF}A_{\Vert }(t_{0})=0$
and thus the coordinates between the symplectic and Hamiltonian (
 $p_{\Vert }$
-)formulation do not differ at the beginning of the simulation, i.e. at
$p_{\Vert }$
-)formulation do not differ at the beginning of the simulation, i.e. at
 $t_{0}$
(compare with § 3.2). In such a case, the symplectic Jacobian of phase space
$t_{0}$
(compare with § 3.2). In such a case, the symplectic Jacobian of phase space
 $B_{\Vert }^{\ast \text{s}}$
reduces to the unperturbed one,
$B_{\Vert }^{\ast \text{s}}$
reduces to the unperturbed one,
 $B_{\Vert }^{\ast \text{h}}$
(see (3.56)). Hence, the background particle and current number density become the same for the symplectic and Hamiltonian formulation at
$B_{\Vert }^{\ast \text{h}}$
(see (3.56)). Hence, the background particle and current number density become the same for the symplectic and Hamiltonian formulation at
 $t_{0}$
. They are defined as
$t_{0}$
. They are defined as
 $$\begin{eqnarray}\displaystyle & \displaystyle n_{0s}(\boldsymbol{x})=n_{0s}^{\text{h}}\stackrel{\text{def}}{=}\int f_{0s}(\boldsymbol{R},v_{\Vert },\tilde{\unicode[STIX]{x1D707}})\,\unicode[STIX]{x1D6FF}(\boldsymbol{R}-\boldsymbol{x})\,B_{\Vert s}^{\ast \text{h}}(\boldsymbol{R},v_{\Vert })\,\text{d}\boldsymbol{R}\,\text{d}v_{\Vert }\,\text{d}\tilde{\unicode[STIX]{x1D707}}\,\text{d}\unicode[STIX]{x1D6FC}, & \displaystyle\end{eqnarray}$$
 $$\begin{eqnarray}\displaystyle & \displaystyle j_{0\Vert s}(\boldsymbol{x})=j_{0\Vert s}^{\text{h}}\stackrel{\text{def}}{=}q_{s}\int v_{\Vert }\,f_{0s}(\boldsymbol{R},v_{\Vert },\tilde{\unicode[STIX]{x1D707}})\,\unicode[STIX]{x1D6FF}(\boldsymbol{R}-\boldsymbol{x})\,B_{\Vert s}^{\ast \text{h}}(\boldsymbol{R},v_{\Vert })\,\text{d}\boldsymbol{R}\,\text{d}v_{\Vert }\,\text{d}\tilde{\unicode[STIX]{x1D707}}\,\text{d}\unicode[STIX]{x1D6FC}. & \displaystyle\end{eqnarray}$$
Consistently, we define the particle and current number density of the background
 $f_{0}$
with gyro-averaging:
$f_{0}$
with gyro-averaging:
 $\bar{n}_{0s}$
and
$\bar{n}_{0s}$
and
 $\bar{j}_{0\Vert s}$
. The average speed
$\bar{j}_{0\Vert s}$
. The average speed
 $u_{0s}$
of the background distribution function
$u_{0s}$
of the background distribution function
 $f_{0s}$
is given by
$f_{0s}$
is given by
 $$\begin{eqnarray}j_{0\Vert s}(\boldsymbol{x})=q_{s}n_{0s}u_{0s}\quad \text{where }u_{0s}\stackrel{\text{def}}{=}\frac{j_{0\Vert s}}{qn_{0s}}.\end{eqnarray}$$
If the Jacobian of phase space is approximated in (3.17) and (3.18) by
 $B_{\Vert }^{\ast \text{h}}\simeq B$
and if we use
$B_{\Vert }^{\ast \text{h}}\simeq B$
and if we use
 $f_{0s}=f_{\text{M}s}$
we can identify
$f_{0s}=f_{\text{M}s}$
we can identify
 $\hat{n}_{0s}$
and
$\hat{n}_{0s}$
and
 $\hat{u} _{0s}$
with the background particle number density
$\hat{u} _{0s}$
with the background particle number density
 $n_{0s}$
and the average speed
$n_{0s}$
and the average speed
 $u_{0s}$
:
$u_{0s}$
:
 $$\begin{eqnarray}\hat{n}_{0s}\simeq n_{0s},\quad \hat{u} _{0s}\simeq u_{0s}.\end{eqnarray}$$
However, when using the complete Jacobian of phase space the relation between these quantities becomes more complex:
 $$\begin{eqnarray}\displaystyle & \displaystyle n_{0s}(\boldsymbol{x})=\hat{n}_{0s}\left[1+\frac{m_{s}}{q_{s}}\frac{\boldsymbol{b}\boldsymbol{\cdot }(\unicode[STIX]{x1D735}\times \boldsymbol{b})}{B}\hat{u} _{0s}\right], & \displaystyle\end{eqnarray}$$
 $$\begin{eqnarray}\displaystyle & \displaystyle u_{0s}(\boldsymbol{x})=\hat{u} _{0s}\left[1+\frac{m_{s}}{q_{s}}\frac{\boldsymbol{b}\boldsymbol{\cdot }(\unicode[STIX]{x1D735}\times \boldsymbol{b})}{B}\frac{v_{\text{th}s}^{2}+\hat{u} _{0s}^{2}}{\hat{u} _{0s}}\right]\frac{\hat{n}_{0s}}{n_{0s}}, & \displaystyle\end{eqnarray}$$
 $$\begin{eqnarray}\displaystyle & \displaystyle j_{0\Vert s}(\boldsymbol{x})=q_{s}\hat{n}_{0s}\left[\hat{u} _{0s}+\frac{m_{s}}{q_{s}}\frac{\boldsymbol{b}\boldsymbol{\cdot }(\unicode[STIX]{x1D735}\times \boldsymbol{b})}{B}(v_{\text{th}s}^{2}+\hat{u} _{0s}^{2})\right]. & \displaystyle\end{eqnarray}$$
From (3.23) we can conclude that, depending on the background magnetic field, it is possible to have a contribution to the background current
 $j_{0\Vert }$
even for an unshifted Maxwellian, i.e.
$j_{0\Vert }$
even for an unshifted Maxwellian, i.e.
 $\hat{u} _{0}=0$
. In other words, the unshifted Maxwellian in gyro-centre phase space corresponds to a shifted Maxwellian in real phase space.
$\hat{u} _{0}=0$
. In other words, the unshifted Maxwellian in gyro-centre phase space corresponds to a shifted Maxwellian in real phase space.
The quasi-neutrality equation and parallel Ampère’s law close the self-consistent gyrokinetic Vlasov–Maxwell system. In the derivation of the potential equations, we linearise the
 $\unicode[STIX]{x1D6FF}\unicode[STIX]{x1D719}$
-terms by approximating the distribution function
$\unicode[STIX]{x1D6FF}\unicode[STIX]{x1D719}$
-terms by approximating the distribution function
 $f$
by the background distribution function
$f$
by the background distribution function
 $f_{0}$
which is assumed to be a shifted Maxwellian
$f_{0}$
which is assumed to be a shifted Maxwellian
 $f_{\text{M}s}$
. Furthermore, a long-wavelength approximation is applied to the quasi-neutrality condition where the gyroradius-dependent quantities of the ion gyro-average are expanded up to the order of
$f_{\text{M}s}$
. Furthermore, a long-wavelength approximation is applied to the quasi-neutrality condition where the gyroradius-dependent quantities of the ion gyro-average are expanded up to the order of
 $\text{O}((k_{\bot }\unicode[STIX]{x1D70C}_{0\text{i}})^{2})$
. The finite gyroradius effects are neglected for the electrons. In addition, we use that in a state of equilibrium the quasi-neutrality imposes
$\text{O}((k_{\bot }\unicode[STIX]{x1D70C}_{0\text{i}})^{2})$
. The finite gyroradius effects are neglected for the electrons. In addition, we use that in a state of equilibrium the quasi-neutrality imposes
 $$\begin{eqnarray}\mathop{\sum }_{s=\text{i},\text{e}}q_{s}\bar{n}_{0s}=0,\end{eqnarray}$$
where we have assumed a vanishing background electrostatic potential
 $\unicode[STIX]{x1D719}_{0}=0$
. Ampère’s law is given by
$\unicode[STIX]{x1D719}_{0}=0$
. Ampère’s law is given by
 $$\begin{eqnarray}-\unicode[STIX]{x1D735}\boldsymbol{\cdot }\unicode[STIX]{x1D735}_{\bot }A_{0\Vert }=\unicode[STIX]{x1D707}_{0}\mathop{\sum }_{s=\text{i},\text{e}}\bar{j}_{0\Vert s}.\end{eqnarray}$$
Finally, we assume that the Maxwellian of the ions is unshifted, i.e.
 $\hat{u} _{0\text{i}}=0$
.
$\hat{u} _{0\text{i}}=0$
.
Thus, by using the
 $\unicode[STIX]{x1D6FF}f$
-ansatz and taking into account that the Jacobian
$\unicode[STIX]{x1D6FF}f$
-ansatz and taking into account that the Jacobian
 $B_{\Vert }^{\ast \text{s}}$
is a perturbed quantity in
$B_{\Vert }^{\ast \text{s}}$
is a perturbed quantity in
 $\unicode[STIX]{x1D6FF}A_{\Vert }$
(see also (4.14) and (4.15)) the quasi-neutrality condition (see Bottino Reference Bottino2004, p. 159) and Ampère’s law take the following form:
$\unicode[STIX]{x1D6FF}A_{\Vert }$
(see also (4.14) and (4.15)) the quasi-neutrality condition (see Bottino Reference Bottino2004, p. 159) and Ampère’s law take the following form:
 $$\begin{eqnarray}\displaystyle & & \displaystyle -\unicode[STIX]{x1D735}\boldsymbol{\cdot }\left(\frac{q_{\text{i}}^{2}n_{0\text{i}}}{k_{\text{B}}T_{\text{i}}}\unicode[STIX]{x1D70C}_{0\text{i}}^{2}\unicode[STIX]{x1D735}_{\bot }\unicode[STIX]{x1D6FF}\unicode[STIX]{x1D719}\right)=q_{\text{i}}\unicode[STIX]{x1D6FF}\bar{n}_{\text{i}}^{\text{s}}+q_{\text{e}}\unicode[STIX]{x1D6FF}n_{\text{e}}^{\text{s}}\nonumber\\ \displaystyle & & \displaystyle \qquad +\,q_{\text{i}}\int \frac{\boldsymbol{b}\boldsymbol{\cdot }(\unicode[STIX]{x1D735}\times \boldsymbol{b})}{B}f_{\text{Mi}}\langle \unicode[STIX]{x1D6FF}A_{\Vert }\rangle \,\unicode[STIX]{x1D6FF}(\boldsymbol{R}+\unicode[STIX]{x1D746}-\boldsymbol{x})\,B\,\text{d}\boldsymbol{R}\,\text{d}v_{\Vert }\,\text{d}\tilde{\unicode[STIX]{x1D707}}\,\text{d}\unicode[STIX]{x1D6FC}+\frac{\boldsymbol{b}\boldsymbol{\cdot }(\unicode[STIX]{x1D735}\times \boldsymbol{b})}{B}q_{\text{e}}\hat{n}_{0\text{e}}\,\unicode[STIX]{x1D6FF}A_{\Vert },\nonumber\\ \displaystyle & & \displaystyle\end{eqnarray}$$
 $$\begin{eqnarray}-\unicode[STIX]{x1D735}\boldsymbol{\cdot }\unicode[STIX]{x1D735}_{\bot }\unicode[STIX]{x1D6FF}A_{\Vert }-\unicode[STIX]{x1D707}_{0}\frac{\boldsymbol{b}\boldsymbol{\cdot }(\unicode[STIX]{x1D735}\times \boldsymbol{b})}{B}q_{\text{e}}\hat{n}_{0\text{e}}\hat{u} _{0\text{e}}\,\unicode[STIX]{x1D6FF}A_{\Vert }=\unicode[STIX]{x1D707}_{0}(\unicode[STIX]{x1D6FF}\bar{j}_{\Vert \text{i}}^{\text{s}}+\unicode[STIX]{x1D6FF}j_{\Vert \text{e}}^{\text{s}}),\end{eqnarray}$$
where
 $\unicode[STIX]{x1D70C}_{0s}=\sqrt{m_{s}k_{\text{B}}T_{s}}/(|q_{s}|B)$
is the thermal gyroradius. Due to the quasi-neutrality condition the terms in the second line of (3.26) would vanish if the gyro-averaging of the ions were neglected. Thus for large scale modes the contribution of these terms is usually small.
$\unicode[STIX]{x1D70C}_{0s}=\sqrt{m_{s}k_{\text{B}}T_{s}}/(|q_{s}|B)$
is the thermal gyroradius. Due to the quasi-neutrality condition the terms in the second line of (3.26) would vanish if the gyro-averaging of the ions were neglected. Thus for large scale modes the contribution of these terms is usually small.
3.2 Transformation between the symplectic and Hamiltonian formulation
Before we describe the gyrokinetic model in the Hamiltonian formulation we want to introduce the coordinate transformation
 $$\begin{eqnarray}\tilde{p}_{\Vert }(\boldsymbol{R},v_{\Vert },\tilde{\unicode[STIX]{x1D707}},t)=v_{\Vert }+\frac{q}{m}\langle \unicode[STIX]{x1D6FF}A_{\Vert }(\boldsymbol{R},t)\rangle\end{eqnarray}$$
and its inverse
 $$\begin{eqnarray}v_{\Vert }(\boldsymbol{R},\tilde{p}_{\Vert },\tilde{\unicode[STIX]{x1D707}},t)=\tilde{p}_{\Vert }-\frac{q}{m}\langle \unicode[STIX]{x1D6FF}A_{\Vert }(\boldsymbol{R},t)\rangle ,\end{eqnarray}$$
which links the symplectic with the Hamiltonian formulation. It leaves the spatial coordinate
 $\boldsymbol{R}=\boldsymbol{R}^{\text{s}}=\boldsymbol{R}^{\text{h}}$
untouched but changes the coordinate
$\boldsymbol{R}=\boldsymbol{R}^{\text{s}}=\boldsymbol{R}^{\text{h}}$
untouched but changes the coordinate
 $v_{\Vert }$
from the symplectic formulation to
$v_{\Vert }$
from the symplectic formulation to
 $\tilde{p}_{\Vert }$
of the Hamiltonian one. The difference between the
$\tilde{p}_{\Vert }$
of the Hamiltonian one. The difference between the
 $v_{\Vert }$
- and the
$v_{\Vert }$
- and the
 $\tilde{p}_{\Vert }$
-coordinates depends strongly on the charge to mass ratio and is much more pronounced for the electrons than for the ions.
$\tilde{p}_{\Vert }$
-coordinates depends strongly on the charge to mass ratio and is much more pronounced for the electrons than for the ions.
The transformation of the first-order partial derivatives of a function
 $h^{\text{s}}(\boldsymbol{R},v_{\Vert },\tilde{\unicode[STIX]{x1D707}},t)$
in the symplectic formulation to its equivalent
$h^{\text{s}}(\boldsymbol{R},v_{\Vert },\tilde{\unicode[STIX]{x1D707}},t)$
in the symplectic formulation to its equivalent
 $h^{\text{h}}(\boldsymbol{R},\tilde{p}_{\Vert },\tilde{\unicode[STIX]{x1D707}},t)$
in the Hamiltonian formulation is given by the Jacobian matrix. From this, it follows that the gradient transforms as
$h^{\text{h}}(\boldsymbol{R},\tilde{p}_{\Vert },\tilde{\unicode[STIX]{x1D707}},t)$
in the Hamiltonian formulation is given by the Jacobian matrix. From this, it follows that the gradient transforms as
 $$\begin{eqnarray}\unicode[STIX]{x1D735}h^{\text{h}}(\boldsymbol{R},\tilde{p}_{\Vert },\tilde{\unicode[STIX]{x1D707}},t)=\unicode[STIX]{x1D735}h^{\text{s}}(\boldsymbol{R},v_{\Vert },\tilde{\unicode[STIX]{x1D707}},t)-\frac{q}{m}\unicode[STIX]{x1D735}\langle \unicode[STIX]{x1D6FF}A_{\Vert }(\boldsymbol{R},t)\rangle \frac{\unicode[STIX]{x2202}h^{\text{s}}(\boldsymbol{R},v_{\Vert },\tilde{\unicode[STIX]{x1D707}},t)}{\unicode[STIX]{x2202}v_{\Vert }},\end{eqnarray}$$
where we used the fact that the partial velocity derivative does not change
 $$\begin{eqnarray}\frac{\unicode[STIX]{x2202}h^{\text{h}}(\boldsymbol{R},\tilde{p}_{\Vert },\tilde{\unicode[STIX]{x1D707}},t)}{\unicode[STIX]{x2202}\tilde{p}_{\Vert }}=\frac{\unicode[STIX]{x2202}h^{\text{s}}(\boldsymbol{R},v_{\Vert },\tilde{\unicode[STIX]{x1D707}},t)}{\unicode[STIX]{x2202}v_{\Vert }}.\end{eqnarray}$$
In addition, the total time derivative of
 $\tilde{p}_{\Vert }$
transforms as
$\tilde{p}_{\Vert }$
transforms as
 $$\begin{eqnarray}\frac{\text{d}\tilde{p}_{\Vert }}{\text{d}t}=\frac{\text{d}v_{\Vert }}{\text{d}t}+\frac{q}{m}\left(\frac{\unicode[STIX]{x2202}\langle \unicode[STIX]{x1D6FF}A_{\Vert }(\boldsymbol{R},t)\rangle }{\unicode[STIX]{x2202}t}+\unicode[STIX]{x1D735}\langle \unicode[STIX]{x1D6FF}A_{\Vert }(\boldsymbol{R},t)\rangle \boldsymbol{\cdot }\frac{\text{d}\boldsymbol{R}}{\text{d}t}\right).\end{eqnarray}$$
Furthermore, the coordinate transformation implies various dependencies between quantities in the symplectic and Hamiltonian formulation. First, the phase-space and marker distribution functions are connected in the following way:
 $$\begin{eqnarray}\displaystyle & \displaystyle f^{\text{h}}(\boldsymbol{R},\tilde{p}_{\Vert },\tilde{\unicode[STIX]{x1D707}},t)=f^{\text{h}}(\boldsymbol{R},\tilde{p}_{\Vert }(v_{\Vert }),\tilde{\unicode[STIX]{x1D707}},t)=f^{\text{s}}(\boldsymbol{R},v_{\Vert },\tilde{\unicode[STIX]{x1D707}},t), & \displaystyle\end{eqnarray}$$
 $$\begin{eqnarray}\displaystyle & \displaystyle g^{\text{h}}(\boldsymbol{R},\tilde{p}_{\Vert },\tilde{\unicode[STIX]{x1D707}},t)=g^{\text{h}}(\boldsymbol{R},\tilde{p}_{\Vert }(v_{\Vert }),\tilde{\unicode[STIX]{x1D707}},t)=g^{\text{s}}(\boldsymbol{R},v_{\Vert },\tilde{\unicode[STIX]{x1D707}},t). & \displaystyle\end{eqnarray}$$
This expresses the fact that the distribution functions are shifted by
 $-q/m\langle \unicode[STIX]{x1D6FF}A_{\Vert }\rangle$
in the
$-q/m\langle \unicode[STIX]{x1D6FF}A_{\Vert }\rangle$
in the
 $\tilde{p}_{\Vert }$
-coordinate frame compared to the
$\tilde{p}_{\Vert }$
-coordinate frame compared to the
 $v_{\Vert }$
-coordinate frame.
$v_{\Vert }$
-coordinate frame.
For completeness, also the Jacobian of phase space, equations (3.6) and (3.56), has the property:
 $$\begin{eqnarray}B_{\Vert }^{\ast \text{h}}(\boldsymbol{R},\tilde{p}_{\Vert },t)=B_{\Vert }^{\ast \text{h}}(\boldsymbol{R},\tilde{p}_{\Vert }(v_{\Vert }),t)=B_{\Vert }^{\ast \text{s}}(\boldsymbol{R},v_{\Vert },\tilde{\unicode[STIX]{x1D707}},t).\end{eqnarray}$$
As a direct consequence of (3.33) and (3.34) the weights are invariant under the coordinate transformation (3.28):
 $$\begin{eqnarray}w^{\text{h}}(\boldsymbol{R},\tilde{p}_{\Vert },\tilde{\unicode[STIX]{x1D707}})=w^{\text{h}}(\boldsymbol{R},\tilde{p}_{\Vert }(v_{\Vert }),\tilde{\unicode[STIX]{x1D707}})=w^{\text{s}}(\boldsymbol{R},v_{\Vert },\tilde{\unicode[STIX]{x1D707}}),\end{eqnarray}$$
with the definitions
 $$\begin{eqnarray}w^{\text{h}}(\boldsymbol{R},\tilde{p}_{\Vert },\tilde{\unicode[STIX]{x1D707}})\stackrel{\text{def}}{=}\frac{f^{\text{h}}(\boldsymbol{R},\tilde{p}_{\Vert },\tilde{\unicode[STIX]{x1D707}},t)}{g^{\text{h}}(\boldsymbol{R},\tilde{p}_{\Vert },\tilde{\unicode[STIX]{x1D707}},t)}\quad \text{and}\quad w^{\text{s}}(\boldsymbol{R},v_{\Vert },\tilde{\unicode[STIX]{x1D707}})\stackrel{\text{def}}{=}\frac{f^{\text{s}}(\boldsymbol{R},v_{\Vert },\tilde{\unicode[STIX]{x1D707}},t)}{g^{\text{s}}(\boldsymbol{R},v_{\Vert },\tilde{\unicode[STIX]{x1D707}},t)},\end{eqnarray}$$
i.e. at any time we have the opportunity to shift the phase-space position of the markers from one representation to the other. As the weights are not modified by the transformation, particle number conservation is automatically fulfilled.
3.2.1 Use of the
$\unicode[STIX]{x1D6FF}f$
-ansatz for both formulations

Although the coordinates
 $v_{\Vert }$
and
$v_{\Vert }$
and
 $\tilde{p}_{\Vert }$
are shifted with respect to each other due to the transformation (3.28) the same
$\tilde{p}_{\Vert }$
are shifted with respect to each other due to the transformation (3.28) the same
 $\unicode[STIX]{x1D6FF}f$
-ansatz is used for both the symplectic and Hamiltonian formulation:
$\unicode[STIX]{x1D6FF}f$
-ansatz is used for both the symplectic and Hamiltonian formulation:
 $$\begin{eqnarray}\displaystyle & \displaystyle f^{\text{s}}(v_{\Vert })=f_{0}(v_{\Vert })+\unicode[STIX]{x1D6FF}f^{\text{s}}(v_{\Vert }), & \displaystyle\end{eqnarray}$$
 $$\begin{eqnarray}\displaystyle & \displaystyle f^{\text{h}}(\,\tilde{p}_{\Vert })=f_{0}(\,\tilde{p}_{\Vert })+\unicode[STIX]{x1D6FF}f^{\text{h}}(\,\tilde{p}_{\Vert }). & \displaystyle\end{eqnarray}$$
Hence, the
 $f_{0}$
background follows the coordinate frame and does not show the relation of
$f_{0}$
background follows the coordinate frame and does not show the relation of
 $f^{\text{s}}$
and
$f^{\text{s}}$
and
 $f^{\text{h}}$
expressed by (3.33):
$f^{\text{h}}$
expressed by (3.33):
 $$\begin{eqnarray}f_{0}(\,\tilde{p}_{\Vert })=f_{0}\left(v_{\Vert }+\frac{q}{m}\langle \unicode[STIX]{x1D6FF}A_{\Vert }\rangle \right)\neq f_{0}(v_{\Vert }).\end{eqnarray}$$
In other words, the background distribution function
 $f_{0}(\,\tilde{p}_{\Vert })$
stays fixed while the distribution function
$f_{0}(\,\tilde{p}_{\Vert })$
stays fixed while the distribution function
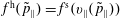 $f^{\text{h}}(\,\tilde{p}_{\Vert })=f^{\text{s}}(v_{\Vert }(\,\tilde{p}_{\Vert }))$
is shifted in the
$f^{\text{h}}(\,\tilde{p}_{\Vert })=f^{\text{s}}(v_{\Vert }(\,\tilde{p}_{\Vert }))$
is shifted in the
 $\tilde{p}_{\Vert }$
-coordinate frame due to the coordinate transformation (3.28). For
$\tilde{p}_{\Vert }$
-coordinate frame due to the coordinate transformation (3.28). For
 $f^{\text{h}}(\,\tilde{p}_{\Vert })$
this means that it gets less and less aligned with the background
$f^{\text{h}}(\,\tilde{p}_{\Vert })$
this means that it gets less and less aligned with the background
 $f_{0}(\,\tilde{p}_{\Vert })$
as the
$f_{0}(\,\tilde{p}_{\Vert })$
as the
 $v_{\Vert }$
- and
$v_{\Vert }$
- and
 $\tilde{p}_{\Vert }$
-coordinates move apart (see figure 1). This has to be compensated by
$\tilde{p}_{\Vert }$
-coordinates move apart (see figure 1). This has to be compensated by
 $\unicode[STIX]{x1D6FF}f^{\text{h}}(\,\tilde{p}_{\Vert })$
and causes an additional contribution to it, which is usually large in relation to
$\unicode[STIX]{x1D6FF}f^{\text{h}}(\,\tilde{p}_{\Vert })$
and causes an additional contribution to it, which is usually large in relation to
 $\unicode[STIX]{x1D6FF}f^{\text{s}}(v_{\Vert })$
, so that we have
$\unicode[STIX]{x1D6FF}f^{\text{s}}(v_{\Vert })$
, so that we have
 $|\unicode[STIX]{x1D6FF}f^{\text{h}}(\,\tilde{p}_{\Vert })|>|\unicode[STIX]{x1D6FF}f^{\text{s}}(v_{\Vert })|$
. As a result, a severe problem with the statistical error within
$|\unicode[STIX]{x1D6FF}f^{\text{h}}(\,\tilde{p}_{\Vert })|>|\unicode[STIX]{x1D6FF}f^{\text{s}}(v_{\Vert })|$
. As a result, a severe problem with the statistical error within
 $\unicode[STIX]{x1D6FF}f$
-PIC codes occurs (see § 4.6). In addition, there is not a simple relation between the perturbation to the distribution functions,
$\unicode[STIX]{x1D6FF}f$
-PIC codes occurs (see § 4.6). In addition, there is not a simple relation between the perturbation to the distribution functions,
 $\unicode[STIX]{x1D6FF}f^{\text{s}}(v_{\Vert })$
and
$\unicode[STIX]{x1D6FF}f^{\text{s}}(v_{\Vert })$
and
 $\unicode[STIX]{x1D6FF}f^{\text{h}}(\,\tilde{p}_{\Vert })$
, such as given by (3.33) for the full distribution functions
$\unicode[STIX]{x1D6FF}f^{\text{h}}(\,\tilde{p}_{\Vert })$
, such as given by (3.33) for the full distribution functions
 $f^{\text{s}}(v_{\Vert })$
and
$f^{\text{s}}(v_{\Vert })$
and
 $f^{\text{h}}(\,\tilde{p}_{\Vert })$
as soon as
$f^{\text{h}}(\,\tilde{p}_{\Vert })$
as soon as
 $\langle \unicode[STIX]{x1D6FF}A_{\Vert }\rangle \neq 0$
. Therefore, the perturbed weights are not invariant under the coordinate transformation (3.28), i.e.
$\langle \unicode[STIX]{x1D6FF}A_{\Vert }\rangle \neq 0$
. Therefore, the perturbed weights are not invariant under the coordinate transformation (3.28), i.e.
 $\unicode[STIX]{x1D6FF}w^{\text{s}}(v_{\Vert })\neq \unicode[STIX]{x1D6FF}w^{\text{h}}(\,\tilde{p}_{\Vert })$
.
$\unicode[STIX]{x1D6FF}w^{\text{s}}(v_{\Vert })\neq \unicode[STIX]{x1D6FF}w^{\text{h}}(\,\tilde{p}_{\Vert })$
.
(a) The distribution function
 $f^{\text{s}}$
(solid red line), the background distribution function
$f^{\text{s}}$
(solid red line), the background distribution function
 $f_{0}$
(dashed blue line) and the perturbation to the distribution function,
$f_{0}$
(dashed blue line) and the perturbation to the distribution function,
 $\unicode[STIX]{x1D6FF}f^{\text{s}}$
, (dotted green line) as a function of
$\unicode[STIX]{x1D6FF}f^{\text{s}}$
, (dotted green line) as a function of
 $v_{\Vert }$
normalised to the thermal velocity
$v_{\Vert }$
normalised to the thermal velocity
 $v_{\text{th}}$
. (b) The distribution function
$v_{\text{th}}$
. (b) The distribution function
 $f^{\text{h}}$
(solid red line), the background distribution function
$f^{\text{h}}$
(solid red line), the background distribution function
 $f_{0}$
(dashed blue line) and the perturbation to the distribution function,
$f_{0}$
(dashed blue line) and the perturbation to the distribution function,
 $\unicode[STIX]{x1D6FF}f^{\text{h}}$
, (dotted green line) as a function of
$\unicode[STIX]{x1D6FF}f^{\text{h}}$
, (dotted green line) as a function of
 $\tilde{p}_{\Vert }$
normalised to the thermal velocity
$\tilde{p}_{\Vert }$
normalised to the thermal velocity
 $v_{\text{th}}$
. Due to the coordinate transformation (3.28) the distribution function
$v_{\text{th}}$
. Due to the coordinate transformation (3.28) the distribution function
 $f^{\text{h}}$
is shifted compared to
$f^{\text{h}}$
is shifted compared to
 $f^{\text{s}}$
(arrow at maximum). As a consequence,
$f^{\text{s}}$
(arrow at maximum). As a consequence,
 $\unicode[STIX]{x1D6FF}f^{\text{h}}$
becomes asymmetric which leads to a non-physical current in the Hamiltonian formulation, the so-called ‘adiabatic current’.
$\unicode[STIX]{x1D6FF}f^{\text{h}}$
becomes asymmetric which leads to a non-physical current in the Hamiltonian formulation, the so-called ‘adiabatic current’.
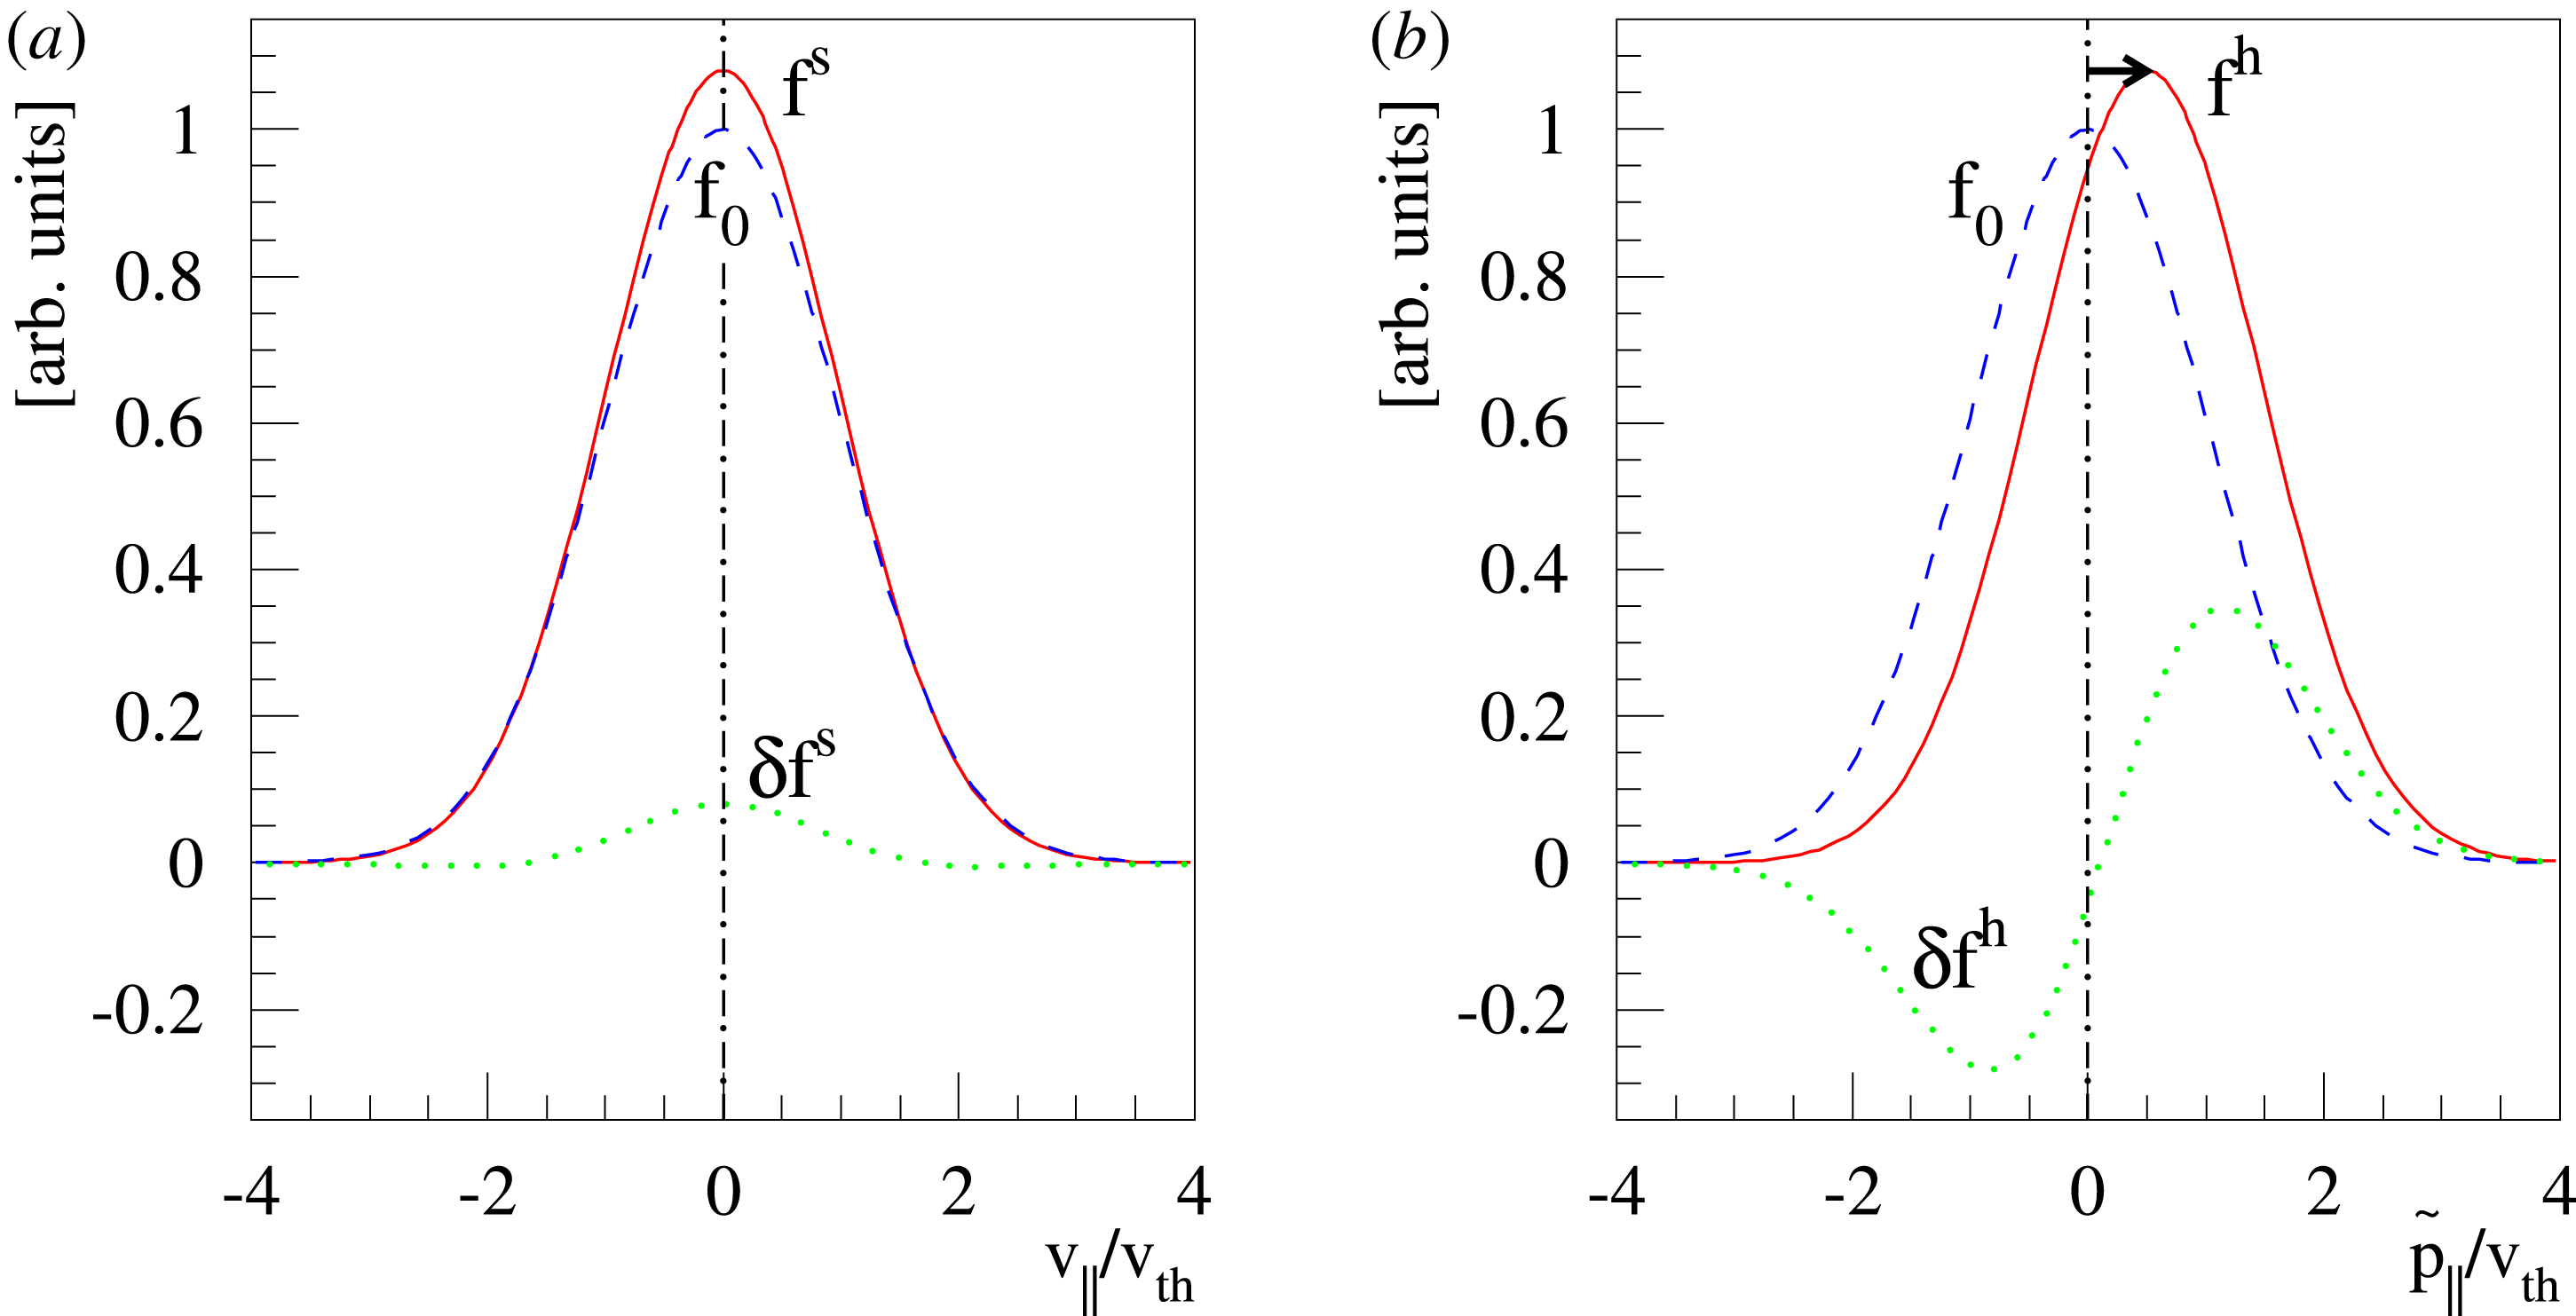
From (3.33) and (3.40) we can derive the following three representations of the perturbation to the distribution functions,
 $\unicode[STIX]{x1D6FF}f^{\text{s}}$
and
$\unicode[STIX]{x1D6FF}f^{\text{s}}$
and
 $\unicode[STIX]{x1D6FF}f^{\text{h}}$
:
$\unicode[STIX]{x1D6FF}f^{\text{h}}$
:
 $$\begin{eqnarray}\displaystyle & \displaystyle \unicode[STIX]{x1D6FF}f^{\text{s}}(v_{\Vert })=f^{\text{h}}(\,\tilde{p}_{\Vert })-f_{0}(v_{\Vert })=f^{\text{h}}(\,\tilde{p}_{\Vert })-f_{0}\left(\tilde{p}_{\Vert }-\frac{q}{m}\langle \unicode[STIX]{x1D6FF}A_{\Vert }\rangle \right), & \displaystyle\end{eqnarray}$$
 $$\begin{eqnarray}\displaystyle & \displaystyle \unicode[STIX]{x1D6FF}f^{\text{s}}(v_{\Vert })=\unicode[STIX]{x1D6FF}f^{\text{h}}(\,\tilde{p}_{\Vert })+f_{0}(\,\tilde{p}_{\Vert })-f_{0}\left(\,\tilde{p}_{\Vert }-\frac{q}{m}\langle \unicode[STIX]{x1D6FF}A_{\Vert }\rangle \right), & \displaystyle\end{eqnarray}$$
 $$\begin{eqnarray}\displaystyle & \displaystyle \unicode[STIX]{x1D6FF}f^{\text{s}}(v_{\Vert })=\unicode[STIX]{x1D6FF}f^{\text{h}}(\,\tilde{p}_{\Vert })-\mathop{\sum }_{n=1}^{\infty }\frac{1}{n!}\left.\frac{\unicode[STIX]{x2202}^{n}f_{0}}{\unicode[STIX]{x2202}v_{\Vert }^{n}}\right|_{v_{\Vert }=\tilde{p}_{\Vert }}\left(-\frac{q}{m}\langle \unicode[STIX]{x1D6FF}A_{\Vert }\rangle \right)^{n}. & \displaystyle\end{eqnarray}$$
 $$\begin{eqnarray}\displaystyle & \displaystyle \unicode[STIX]{x1D6FF}f^{\text{h}}(\,\tilde{p}_{\Vert })=f^{\text{s}}(v_{\Vert })-f_{0}(\,\tilde{p}_{\Vert })=f^{\text{s}}(v_{\Vert })-f_{0}\left(v_{\Vert }+\frac{q}{m}\langle \unicode[STIX]{x1D6FF}A_{\Vert }\rangle \right), & \displaystyle\end{eqnarray}$$
 $$\begin{eqnarray}\displaystyle & \displaystyle \unicode[STIX]{x1D6FF}f^{\text{h}}(\,\tilde{p}_{\Vert })=\unicode[STIX]{x1D6FF}f^{\text{s}}(v_{\Vert })+f_{0}(v_{\Vert })-f_{0}\left(v_{\Vert }+\frac{q}{m}\langle \unicode[STIX]{x1D6FF}A_{\Vert }\rangle \right), & \displaystyle\end{eqnarray}$$
 $$\begin{eqnarray}\displaystyle & \displaystyle \unicode[STIX]{x1D6FF}f^{\text{h}}(\,\tilde{p}_{\Vert })=\unicode[STIX]{x1D6FF}f^{\text{s}}(v_{\Vert })-\mathop{\sum }_{n=1}^{\infty }\frac{1}{n!}\left.\frac{\unicode[STIX]{x2202}^{n}f_{0}}{\unicode[STIX]{x2202}\tilde{p}_{\Vert }^{n}}\right|_{\tilde{p}_{\Vert }=v_{\Vert }}\left(\frac{q}{m}\langle \unicode[STIX]{x1D6FF}A_{\Vert }\rangle \right)^{n}. & \displaystyle\end{eqnarray}$$
In particular (3.42) and (3.45) show that the difference between
 $\unicode[STIX]{x1D6FF}f^{\text{s}}(v_{\Vert })$
and
$\unicode[STIX]{x1D6FF}f^{\text{s}}(v_{\Vert })$
and
 $\unicode[STIX]{x1D6FF}f^{\text{h}}(\,\tilde{p}_{\Vert })$
stems from the misalignment of the two background distribution functions
$\unicode[STIX]{x1D6FF}f^{\text{h}}(\,\tilde{p}_{\Vert })$
stems from the misalignment of the two background distribution functions
 $f_{0}(v_{\Vert })$
and
$f_{0}(v_{\Vert })$
and
 $f_{0}(\,\tilde{p}_{\Vert })$
in the two coordinate frames.
$f_{0}(\,\tilde{p}_{\Vert })$
in the two coordinate frames.
In general, we have three different ways to derive the perturbed symplectic weight
 $\unicode[STIX]{x1D6FF}w^{\text{s}}$
from the perturbed Hamiltonian weight
$\unicode[STIX]{x1D6FF}w^{\text{s}}$
from the perturbed Hamiltonian weight
 $\unicode[STIX]{x1D6FF}w^{\text{h}}$
. The first form is suited for the full-
$\unicode[STIX]{x1D6FF}w^{\text{h}}$
. The first form is suited for the full-
 $f$
method and is called ‘direct
$f$
method and is called ‘direct
 $\unicode[STIX]{x1D6FF}f$
-method’ (see Allfrey & Hatzky (Reference Allfrey and Hatzky2003) and § 5), the second is suited for an algorithm which uses a separate evolution equation for
$\unicode[STIX]{x1D6FF}f$
-method’ (see Allfrey & Hatzky (Reference Allfrey and Hatzky2003) and § 5), the second is suited for an algorithm which uses a separate evolution equation for
 $\unicode[STIX]{x1D6FF}f$
and the third way is to derive e.g. a linearised transformation equation:
$\unicode[STIX]{x1D6FF}f$
and the third way is to derive e.g. a linearised transformation equation:
 $$\begin{eqnarray}\displaystyle & \displaystyle \unicode[STIX]{x1D6FF}w^{\text{s}}(v_{\Vert })=w^{\text{h}}(\,\tilde{p}_{\Vert })-\frac{1}{g^{\text{h}}(\,\tilde{p}_{\Vert })}f_{0}\left(\,\tilde{p}_{\Vert }-\frac{q}{m}\langle \unicode[STIX]{x1D6FF}A_{\Vert }\rangle \right), & \displaystyle\end{eqnarray}$$
 $$\begin{eqnarray}\displaystyle & \displaystyle \unicode[STIX]{x1D6FF}w^{\text{s}}(v_{\Vert })=\unicode[STIX]{x1D6FF}w^{\text{h}}(\,\tilde{p}_{\Vert })+\frac{1}{g^{\text{h}}(\,\tilde{p}_{\Vert })}\left[f_{0}(\,\tilde{p}_{\Vert })-f_{0}\left(\,\tilde{p}_{\Vert }-\frac{q}{m}\langle \unicode[STIX]{x1D6FF}A_{\Vert }\rangle \right)\right], & \displaystyle\end{eqnarray}$$
 $$\begin{eqnarray}\displaystyle & \displaystyle \unicode[STIX]{x1D6FF}w^{\text{s},\text{lin}}(v_{\Vert })=\unicode[STIX]{x1D6FF}w^{\text{h},\text{lin}}(\,\tilde{p}_{\Vert })+\frac{q}{m}\langle \unicode[STIX]{x1D6FF}A_{\Vert }\rangle \frac{1}{g^{\text{h}}(\,\tilde{p}_{\Vert })}\left.\frac{\unicode[STIX]{x2202}f_{0}}{\unicode[STIX]{x2202}v_{\Vert }}\right|_{v_{\Vert }=\tilde{p}_{\Vert }}, & \displaystyle\end{eqnarray}$$
with the definitions
 $$\begin{eqnarray}\unicode[STIX]{x1D6FF}w^{\text{s}}(v_{\Vert })\stackrel{\text{def}}{=}\frac{\unicode[STIX]{x1D6FF}f^{\text{s}}(v_{\Vert })}{g^{\text{s}}(v_{\Vert })}\quad \text{and}\quad \unicode[STIX]{x1D6FF}w^{\text{h}}(\,\tilde{p}_{\Vert })\stackrel{\text{def}}{=}\frac{\unicode[STIX]{x1D6FF}f^{\text{h}}(\,\tilde{p}_{\Vert })}{g^{\text{h}}(\,\tilde{p}_{\Vert })}.\end{eqnarray}$$
3.3 The model equations in the Hamiltonian formulation
In § 3.1 we have introduced the first-order gyrokinetic model in the symplectic formulation. The question is why do we need the same model equations in the Hamiltonian formulation as well? The answer is: just for numerical reasons. The numerical advantage of the Hamiltonian formulation over the symplectic one is that the partial time derivative of
 $\langle \unicode[STIX]{x1D6FF}A_{\Vert }\rangle$
vanishes in the parallel dynamics (compare (3.4) and (3.54)). This is a result of the transformation of the total time derivative of
$\langle \unicode[STIX]{x1D6FF}A_{\Vert }\rangle$
vanishes in the parallel dynamics (compare (3.4) and (3.54)). This is a result of the transformation of the total time derivative of
 $v_{\Vert }$
(see (3.32)). The second term on the right-hand side of (3.32) cancels with the partial derivative of
$v_{\Vert }$
(see (3.32)). The second term on the right-hand side of (3.32) cancels with the partial derivative of
 $\langle \unicode[STIX]{x1D6FF}A_{\Vert }\rangle$
– first term on the right-hand side of (3.4) – being part of the parallel dynamics in the symplectic formulation. This is a big advantage of the Hamiltonian formulation over the symplectic one, as on the numerical level such a partial time derivative makes it very difficult to integrate the coupled set of equations of motion and potential equations in time. Therefore, we will use the Hamiltonian formulation to push the markers along the characteristics while using the symplectic moments in the potential equations.
$\langle \unicode[STIX]{x1D6FF}A_{\Vert }\rangle$
– first term on the right-hand side of (3.4) – being part of the parallel dynamics in the symplectic formulation. This is a big advantage of the Hamiltonian formulation over the symplectic one, as on the numerical level such a partial time derivative makes it very difficult to integrate the coupled set of equations of motion and potential equations in time. Therefore, we will use the Hamiltonian formulation to push the markers along the characteristics while using the symplectic moments in the potential equations.
The equations of motion in the Hamiltonian formulation can be derived from the symplectic ones by using the transformations described in (3.28)–(3.32). Alternatively, one can transform the symplectic Lagrangian from
 $v_{\Vert }$
- to
$v_{\Vert }$
- to
 $\tilde{p}_{\Vert }$
-coordinates. The equivalent Lagrangian is of second order in
$\tilde{p}_{\Vert }$
-coordinates. The equivalent Lagrangian is of second order in
 $\unicode[STIX]{x1D6FF}A_{\Vert }$
. It can be used to derive the equations of motion in the Hamiltonian formulation (Kleiber et al.
Reference Kleiber, Hatzky, Könies, Mishchenko and Sonnendrücker2016).
$\unicode[STIX]{x1D6FF}A_{\Vert }$
. It can be used to derive the equations of motion in the Hamiltonian formulation (Kleiber et al.
Reference Kleiber, Hatzky, Könies, Mishchenko and Sonnendrücker2016).
The gyrokinetic equations in the Hamiltonian formulation (
 $p_{\Vert }$
-formulation) are used to calculate the time evolution of the gyro-centre distribution function
$p_{\Vert }$
-formulation) are used to calculate the time evolution of the gyro-centre distribution function
 $f^{\text{h}}(\boldsymbol{R},\tilde{p}_{\Vert },\tilde{\unicode[STIX]{x1D707}},t)$
of each species:
$f^{\text{h}}(\boldsymbol{R},\tilde{p}_{\Vert },\tilde{\unicode[STIX]{x1D707}},t)$
of each species:
 $$\begin{eqnarray}\frac{\text{d}f^{\text{h}}}{\text{d}t}=\frac{\unicode[STIX]{x2202}f^{\text{h}}}{\unicode[STIX]{x2202}t}+\unicode[STIX]{x1D735}f^{\text{h}}\boldsymbol{\cdot }\frac{\text{d}\boldsymbol{R}}{\text{d}t}+\frac{\unicode[STIX]{x2202}f^{\text{h}}}{\unicode[STIX]{x2202}\tilde{p}_{\Vert }}\frac{\text{d}\tilde{p}_{\Vert }}{\text{d}t}+\frac{\unicode[STIX]{x2202}f^{\text{h}}}{\unicode[STIX]{x2202}\tilde{\unicode[STIX]{x1D707}}}\frac{\text{d}\tilde{\unicode[STIX]{x1D707}}}{\text{d}t}=0,\end{eqnarray}$$
where
 $\tilde{p}_{\Vert }$
is the parallel momentum per unit mass.
$\tilde{p}_{\Vert }$
is the parallel momentum per unit mass.
The marker distribution
 $g^{\text{h}}$
has to evolve in the same way as the phase-space distribution function
$g^{\text{h}}$
has to evolve in the same way as the phase-space distribution function
 $f^{\text{h}}$
:
$f^{\text{h}}$
:
 $$\begin{eqnarray}\frac{\text{d}g^{\text{h}}}{\text{d}t}=\frac{\unicode[STIX]{x2202}g^{\text{h}}}{\unicode[STIX]{x2202}t}+\unicode[STIX]{x1D735}g^{\text{h}}\boldsymbol{\cdot }\frac{\text{d}\boldsymbol{R}}{\text{d}t}+\frac{\unicode[STIX]{x2202}g^{\text{h}}}{\unicode[STIX]{x2202}\tilde{p}_{\Vert }}\frac{\text{d}\tilde{p}_{\Vert }}{\text{d}t}+\frac{\unicode[STIX]{x2202}g^{\text{h}}}{\unicode[STIX]{x2202}\tilde{\unicode[STIX]{x1D707}}}\frac{\text{d}\tilde{\unicode[STIX]{x1D707}}}{\text{d}t}=0.\end{eqnarray}$$
The equations of motion for the gyro-centre trajectories in reduced phase space
 $(\boldsymbol{R},\tilde{p}_{\Vert },\tilde{\unicode[STIX]{x1D707}})$
are
$(\boldsymbol{R},\tilde{p}_{\Vert },\tilde{\unicode[STIX]{x1D707}})$
are
 $$\begin{eqnarray}\displaystyle \frac{\text{d}\boldsymbol{R}}{\text{d}t} & = & \displaystyle \left(\tilde{p}_{\Vert }-\frac{q}{m}\langle \unicode[STIX]{x1D6FF}A_{\Vert }\rangle \right)\boldsymbol{b}+\frac{1}{B_{\Vert }^{\ast \text{h}}}\boldsymbol{b}\times \unicode[STIX]{x1D735}\left(\langle \unicode[STIX]{x1D713}_{\text{eff}}\rangle +\frac{q}{2m}\langle \unicode[STIX]{x1D6FF}A_{\Vert }\rangle ^{2}\right)\nonumber\\ \displaystyle & & \displaystyle +\,\frac{m}{q}\left[\frac{\tilde{\unicode[STIX]{x1D707}}B+\tilde{p}_{\Vert }^{2}}{BB_{\Vert }^{\ast \text{h}}}\boldsymbol{b}\times \unicode[STIX]{x1D735}B+\frac{\tilde{p}_{\Vert }^{2}}{BB_{\Vert }^{\ast \text{h}}}(\unicode[STIX]{x1D735}\times \boldsymbol{B})_{\bot }\right]-\frac{\tilde{p}_{\Vert }}{B_{\Vert }^{\ast \text{h}}}\boldsymbol{b}\times \unicode[STIX]{x1D73F}\,\langle \unicode[STIX]{x1D6FF}A_{\Vert }\rangle ,\end{eqnarray}$$
 $$\begin{eqnarray}\displaystyle \frac{\text{d}\tilde{p}_{\Vert }}{\text{d}t} & = & \displaystyle -\frac{q}{m}\boldsymbol{b}\boldsymbol{\cdot }\unicode[STIX]{x1D735}\left(\langle \unicode[STIX]{x1D713}_{\text{eff}}\rangle +\frac{q}{2m}\langle \unicode[STIX]{x1D6FF}A_{\Vert }\rangle ^{2}\right)-\frac{q}{m}\frac{\tilde{p}_{\Vert }}{B_{\Vert }^{\ast \text{h}}}\boldsymbol{b}\times \unicode[STIX]{x1D73F}\boldsymbol{\cdot }\langle \unicode[STIX]{x1D6FF}A_{\Vert }\rangle \unicode[STIX]{x1D735}\langle \unicode[STIX]{x1D6FF}A_{\Vert }\rangle \nonumber\\ \displaystyle & & \displaystyle -\,\frac{\tilde{p}_{\Vert }}{B_{\Vert }^{\ast \text{h}}}\boldsymbol{b}\times \unicode[STIX]{x1D73F}\boldsymbol{\cdot }\unicode[STIX]{x1D735}\langle \unicode[STIX]{x1D713}_{\text{eff}}\rangle -\tilde{\unicode[STIX]{x1D707}}\,\unicode[STIX]{x1D735}B\boldsymbol{\cdot }\left[\boldsymbol{b}+\frac{m}{q}\frac{\tilde{p}_{\Vert }}{BB_{\Vert }^{\ast \text{h}}}(\unicode[STIX]{x1D735}\times \boldsymbol{B})_{\bot }\right],\end{eqnarray}$$
 $$\begin{eqnarray}\frac{\text{d}\tilde{\unicode[STIX]{x1D707}}}{\text{d}t}=0,\end{eqnarray}$$
where we have
 $\boldsymbol{B}^{\ast \text{h}}=\unicode[STIX]{x1D735}\times \boldsymbol{A}^{\ast \text{h}}$
and
$\boldsymbol{B}^{\ast \text{h}}=\unicode[STIX]{x1D735}\times \boldsymbol{A}^{\ast \text{h}}$
and
 $\boldsymbol{A}^{\ast \text{h}}=\boldsymbol{A}_{0}+m\tilde{p}_{\Vert }/q\boldsymbol{b}$
. The Jacobian of phase space
$\boldsymbol{A}^{\ast \text{h}}=\boldsymbol{A}_{0}+m\tilde{p}_{\Vert }/q\boldsymbol{b}$
. The Jacobian of phase space
 ${\mathcal{J}}_{z}^{\text{h}}$
is given in the Hamiltonian formulation by
${\mathcal{J}}_{z}^{\text{h}}$
is given in the Hamiltonian formulation by
 $$\begin{eqnarray}{\mathcal{J}}_{z}^{\text{h}}=B_{\Vert }^{\ast \text{h}}(\boldsymbol{R},\tilde{p}_{\Vert })=\boldsymbol{b}\boldsymbol{\cdot }\boldsymbol{B}^{\ast \text{h}}=B+\frac{m}{q}\tilde{p}_{\Vert }\boldsymbol{b}\boldsymbol{\cdot }(\unicode[STIX]{x1D735}\times \boldsymbol{b}).\end{eqnarray}$$
The gyro-averaged effective potential is defined as
 $$\begin{eqnarray}\langle \unicode[STIX]{x1D713}_{\text{eff}}\rangle \stackrel{\text{def}}{=}\langle \unicode[STIX]{x1D6FF}\unicode[STIX]{x1D719}-\tilde{p}_{\Vert }\unicode[STIX]{x1D6FF}A_{\Vert }\rangle =\langle \unicode[STIX]{x1D6FF}\unicode[STIX]{x1D719}\rangle -\tilde{p}_{\Vert }\langle \unicode[STIX]{x1D6FF}A_{\Vert }\rangle .\end{eqnarray}$$
The particle and current number density are defined as
 $$\begin{eqnarray}\displaystyle & \displaystyle n_{s}^{\text{h}}(\boldsymbol{x})\stackrel{\text{def}}{=}\int f_{s}^{\text{h}}(\boldsymbol{R},\tilde{p}_{\Vert },\tilde{\unicode[STIX]{x1D707}})\,\unicode[STIX]{x1D6FF}(\boldsymbol{R}-\boldsymbol{x})\,B_{\Vert s}^{\ast \text{h}}\,\text{d}\boldsymbol{R}\,\text{d}\tilde{p}_{\Vert }\,\text{d}\tilde{\unicode[STIX]{x1D707}}\,\text{d}\unicode[STIX]{x1D6FC}, & \displaystyle\end{eqnarray}$$
 $$\begin{eqnarray}\displaystyle & \displaystyle j_{\Vert s}^{\text{h}}(\boldsymbol{x})\stackrel{\text{def}}{=}q_{s}\int \tilde{p}_{\Vert }\,f_{s}^{\text{h}}(\boldsymbol{R},\tilde{p}_{\Vert },\tilde{\unicode[STIX]{x1D707}})\,\unicode[STIX]{x1D6FF}(\boldsymbol{R}-\boldsymbol{x})\,B_{\Vert s}^{\ast \text{h}}\,\text{d}\boldsymbol{R}\,\text{d}\tilde{p}_{\Vert }\,\text{d}\tilde{\unicode[STIX]{x1D707}}\,\text{d}\unicode[STIX]{x1D6FC}. & \displaystyle\end{eqnarray}$$
The integration is performed over phase space
 ${\mathcal{J}}_{z}^{\text{h}}\,\text{d}^{6}z=B_{\Vert }^{\ast \text{h}}\,\text{d}\boldsymbol{R}\,\text{d}\tilde{p}_{\Vert }\,\text{d}\tilde{\unicode[STIX]{x1D707}}\,\text{d}\unicode[STIX]{x1D6FC}$
. The gyro-averaged particle and current number density are defined as
${\mathcal{J}}_{z}^{\text{h}}\,\text{d}^{6}z=B_{\Vert }^{\ast \text{h}}\,\text{d}\boldsymbol{R}\,\text{d}\tilde{p}_{\Vert }\,\text{d}\tilde{\unicode[STIX]{x1D707}}\,\text{d}\unicode[STIX]{x1D6FC}$
. The gyro-averaged particle and current number density are defined as
 $$\begin{eqnarray}\displaystyle & \displaystyle \bar{n}_{s}^{\text{h}}(\boldsymbol{x})\stackrel{\text{def}}{=}\int f_{s}^{\text{h}}(\boldsymbol{R},\tilde{p}_{\Vert },\tilde{\unicode[STIX]{x1D707}})\,\unicode[STIX]{x1D6FF}(\boldsymbol{R}+\unicode[STIX]{x1D746}-\boldsymbol{x})\,B_{\Vert s}^{\ast \text{h}}\,\text{d}\boldsymbol{R}\,\text{d}\tilde{p}_{\Vert }\,\text{d}\tilde{\unicode[STIX]{x1D707}}\,\text{d}\unicode[STIX]{x1D6FC}, & \displaystyle\end{eqnarray}$$
 $$\begin{eqnarray}\displaystyle & \displaystyle \bar{j}_{\Vert s}^{\text{h}}(\boldsymbol{x})\stackrel{\text{def}}{=}q_{s}\int \tilde{p}_{\Vert }\,f_{s}^{\text{h}}(\boldsymbol{R},\tilde{p}_{\Vert },\tilde{\unicode[STIX]{x1D707}})\,\unicode[STIX]{x1D6FF}(\boldsymbol{R}+\unicode[STIX]{x1D746}-\boldsymbol{x})\,B_{\Vert s}^{\ast \text{h}}\,\text{d}\boldsymbol{R}\,\text{d}\tilde{p}_{\Vert }\,\text{d}\tilde{\unicode[STIX]{x1D707}}\,\text{d}\unicode[STIX]{x1D6FC}. & \displaystyle\end{eqnarray}$$
The same definitions are applied to the perturbation to the distribution function,
 $\unicode[STIX]{x1D6FF}f$
, which leads to the quantities:
$\unicode[STIX]{x1D6FF}f$
, which leads to the quantities:
 $\unicode[STIX]{x1D6FF}n^{\text{h}}$
,
$\unicode[STIX]{x1D6FF}n^{\text{h}}$
,
 $\unicode[STIX]{x1D6FF}j_{\Vert }^{\text{h}}$
and
$\unicode[STIX]{x1D6FF}j_{\Vert }^{\text{h}}$
and
 $\unicode[STIX]{x1D6FF}\bar{n}^{\text{h}}$
,
$\unicode[STIX]{x1D6FF}\bar{n}^{\text{h}}$
,
 $\unicode[STIX]{x1D6FF}\bar{j}_{\Vert }^{\text{h}}$
. The perturbed magnetic potential averaged over the gyro-phase and over the distribution function is defined as
$\unicode[STIX]{x1D6FF}\bar{j}_{\Vert }^{\text{h}}$
. The perturbed magnetic potential averaged over the gyro-phase and over the distribution function is defined as
 $$\begin{eqnarray}\overline{\langle \unicode[STIX]{x1D6FF}A_{\Vert }\rangle }_{s}^{\text{h}}\stackrel{\text{def}}{=}\frac{1}{n_{s}^{\text{h}}}\int f_{s}^{\text{h}}(\boldsymbol{R},\tilde{p}_{\Vert },\tilde{\unicode[STIX]{x1D707}})\,\langle \unicode[STIX]{x1D6FF}A_{\Vert }\rangle (\mathbf{R},\tilde{\unicode[STIX]{x1D707}})\,\unicode[STIX]{x1D6FF}(\boldsymbol{R}+\unicode[STIX]{x1D746}-\boldsymbol{x})\,B_{\Vert s}^{\ast \text{h}}\,\text{d}\boldsymbol{R}\,\text{d}\tilde{p}_{\Vert }\,\text{d}\tilde{\unicode[STIX]{x1D707}}\,\text{d}\unicode[STIX]{x1D6FC}.\end{eqnarray}$$
As already in the symplectic case, a long-wavelength approximation is applied to the quasi-neutrality condition. Thus, the quasi-neutrality condition and Ampère’s law take the following form in the Hamiltonian formulation:
 $$\begin{eqnarray}\displaystyle & \displaystyle \underbrace{-\unicode[STIX]{x1D735}\boldsymbol{\cdot }\left(\frac{q_{\text{i}}^{2}n_{0\text{i}}}{k_{\text{B}}T_{\text{i}}}\unicode[STIX]{x1D70C}_{0\text{i}}^{2}\unicode[STIX]{x1D735}_{\bot }\unicode[STIX]{x1D6FF}\unicode[STIX]{x1D719}\right)}_{\text{ion polarisation density}}=q_{\text{i}}\unicode[STIX]{x1D6FF}\bar{n}_{\text{i}}^{\text{h}}+q_{\text{e}}\unicode[STIX]{x1D6FF}n_{\text{e}}^{\text{h}}, & \displaystyle\end{eqnarray}$$
 $$\begin{eqnarray}\displaystyle & \displaystyle -\unicode[STIX]{x1D735}\boldsymbol{\cdot }\unicode[STIX]{x1D735}_{\bot }\unicode[STIX]{x1D6FF}A_{\Vert }+\underbrace{\frac{\unicode[STIX]{x1D6FD}_{\text{i}}^{\text{h}}}{\unicode[STIX]{x1D70C}_{0\text{i}}^{2}}\overline{\langle \unicode[STIX]{x1D6FF}A_{\Vert }\rangle }_{\text{i}}^{\text{h}}+\frac{\unicode[STIX]{x1D6FD}_{\text{e}}^{\text{h}}}{\unicode[STIX]{x1D70C}_{0\text{e}}^{2}}\unicode[STIX]{x1D6FF}A_{\Vert }}_{\text{skin terms}}=\unicode[STIX]{x1D707}_{0}\left(\unicode[STIX]{x1D6FF}\bar{j}_{\Vert \text{i}}^{\text{h}}+\unicode[STIX]{x1D6FF}j_{\Vert \text{e}}^{\text{h}}\right), & \displaystyle\end{eqnarray}$$
where the beta parameter is
 $\unicode[STIX]{x1D6FD}_{s}^{\text{h}}=\unicode[STIX]{x1D707}_{0}n_{s}^{\text{h}}k_{\text{B}}T_{s}/B^{2}$
(note that it is
$\unicode[STIX]{x1D6FD}_{s}^{\text{h}}=\unicode[STIX]{x1D707}_{0}n_{s}^{\text{h}}k_{\text{B}}T_{s}/B^{2}$
(note that it is
 $\unicode[STIX]{x1D6FD}_{0s}=\unicode[STIX]{x1D707}_{0}n_{0s}k_{\text{B}}T_{s}/B^{2}$
which depends only on the background density
$\unicode[STIX]{x1D6FD}_{0s}=\unicode[STIX]{x1D707}_{0}n_{0s}k_{\text{B}}T_{s}/B^{2}$
which depends only on the background density
 $n_{0s}$
). The skin terms in Ampère’s law are a result of the Hamiltonian formulation (see § 4.2).
$n_{0s}$
). The skin terms in Ampère’s law are a result of the Hamiltonian formulation (see § 4.2).
3.3.1 The long-wavelength approximation of the ion skin term
In our model equations we have neglected the gyroradius effects of the electrons which simplifies the electron skin term significantly. However, for the ions we have to take the gyro-averaging into account. In principle, the discretisation of the gyro-averaging of
 $\overline{\langle \unicode[STIX]{x1D6FF}A_{\Vert }\rangle }_{\text{i}}^{\text{h}}$
as part of the ion skin term has to match the discretisation of the gyro-averaging of the perturbed current density
$\overline{\langle \unicode[STIX]{x1D6FF}A_{\Vert }\rangle }_{\text{i}}^{\text{h}}$
as part of the ion skin term has to match the discretisation of the gyro-averaging of the perturbed current density
 $\unicode[STIX]{x1D6FF}\bar{j}_{\Vert \text{i}}^{\text{h}}$
exactly. Otherwise there will be no exact cancellation of the ion skin term and the gyro-averaged adiabatic current term of the ions (see § 4.7). Nevertheless, there are many situations where the long-wavelength approximation of the ion skin term is appropriate (see e.g. Tronko, Bottino & Sonnendrücker Reference Tronko, Bottino and Sonnendrücker2016):
$\unicode[STIX]{x1D6FF}\bar{j}_{\Vert \text{i}}^{\text{h}}$
exactly. Otherwise there will be no exact cancellation of the ion skin term and the gyro-averaged adiabatic current term of the ions (see § 4.7). Nevertheless, there are many situations where the long-wavelength approximation of the ion skin term is appropriate (see e.g. Tronko, Bottino & Sonnendrücker Reference Tronko, Bottino and Sonnendrücker2016):
 $$\begin{eqnarray}\frac{\unicode[STIX]{x1D6FD}_{\text{i}}^{\text{h}}}{\unicode[STIX]{x1D70C}_{0\text{i}}^{2}}\overline{\langle \unicode[STIX]{x1D6FF}A_{\Vert }\rangle }_{\text{i}}^{\text{h}}\simeq \unicode[STIX]{x1D735}\boldsymbol{\cdot }(\unicode[STIX]{x1D6FD}_{\text{i}}^{\text{h}}\unicode[STIX]{x1D735}_{\bot }\unicode[STIX]{x1D6FF}A_{\Vert })+\frac{\unicode[STIX]{x1D6FD}_{\text{i}}^{\text{h}}}{\unicode[STIX]{x1D70C}_{0\text{i}}^{2}}\unicode[STIX]{x1D6FF}A_{\Vert }.\end{eqnarray}$$
Especially, it is very precise for small
 $k_{\bot }\unicode[STIX]{x1D70C}_{\text{i}}$
when the cancellation problem is most pronounced. But caution has to be taken as Ampère’s law (3.64) is due to the gyro-averaged ion skin term an integro-differential equation whereas after the long-wavelength approximation it becomes a second-order differential equation. This also simplifies the treatment of the radial boundary condition (see also Dominski et al.
Reference Dominski, McMillan, Brunner, Merlo, Tran and Villard2017). To avoid problems with the skin term we favour solving Ampère’s law in the symplectic formulation, equation (3.27). Details are discussed for the linear case in § 8.1.3 and for the nonlinear case in § 8.2.1.
$k_{\bot }\unicode[STIX]{x1D70C}_{\text{i}}$
when the cancellation problem is most pronounced. But caution has to be taken as Ampère’s law (3.64) is due to the gyro-averaged ion skin term an integro-differential equation whereas after the long-wavelength approximation it becomes a second-order differential equation. This also simplifies the treatment of the radial boundary condition (see also Dominski et al.
Reference Dominski, McMillan, Brunner, Merlo, Tran and Villard2017). To avoid problems with the skin term we favour solving Ampère’s law in the symplectic formulation, equation (3.27). Details are discussed for the linear case in § 8.1.3 and for the nonlinear case in § 8.2.1.
3.3.2 The linear case
For linearised PIC simulations an extra evolution equation for
 $\unicode[STIX]{x1D6FF}f^{\text{h}}$
is derived by inserting the
$\unicode[STIX]{x1D6FF}f^{\text{h}}$
is derived by inserting the
 $\unicode[STIX]{x1D6FF}f$
-ansatz
$\unicode[STIX]{x1D6FF}f$
-ansatz
 $$\begin{eqnarray}f^{\text{h}}(\boldsymbol{R},\tilde{p}_{\Vert },\tilde{\unicode[STIX]{x1D707}},t)=f_{0}(\boldsymbol{R},\tilde{p}_{\Vert },\tilde{\unicode[STIX]{x1D707}})+\unicode[STIX]{x1D6FF}f^{\text{h}}(\boldsymbol{R},\tilde{p}_{\Vert },\tilde{\unicode[STIX]{x1D707}},t)\end{eqnarray}$$
into the evolution equation (3.51) of the gyro-centre distribution function. As part of the linearisation we assume
 $\unicode[STIX]{x1D6FF}f^{\text{h},\text{lin}}$
to evolve along the unperturbed gyro-centre trajectories of each species, i.e. by
$\unicode[STIX]{x1D6FF}f^{\text{h},\text{lin}}$
to evolve along the unperturbed gyro-centre trajectories of each species, i.e. by
 $$\begin{eqnarray}\left.\frac{\text{d}}{\text{d}t}\right|_{0}\unicode[STIX]{x1D6FF}f^{\text{h},\text{lin}}=-\unicode[STIX]{x1D735}f_{0}\boldsymbol{\cdot }\frac{\text{d}\boldsymbol{R}^{(1)}}{\text{d}t}-\frac{\unicode[STIX]{x2202}f_{0}}{\unicode[STIX]{x2202}\tilde{p}_{\Vert }}\frac{\text{d}\tilde{p}_{\Vert }^{(1)}}{\text{d}t}.\end{eqnarray}$$
The operator
 $\left.\text{d}/\text{d}t\right|_{0}$
denotes the derivative along the unperturbed orbits,
$\left.\text{d}/\text{d}t\right|_{0}$
denotes the derivative along the unperturbed orbits,
 $\text{d}\boldsymbol{R}^{(1)}/\text{d}t$
and
$\text{d}\boldsymbol{R}^{(1)}/\text{d}t$
and
 $\text{d}\tilde{p}_{\Vert }^{(1)}/\text{d}t$
contain only those terms of the time derivative which depend on
$\text{d}\tilde{p}_{\Vert }^{(1)}/\text{d}t$
contain only those terms of the time derivative which depend on
 $\unicode[STIX]{x1D6FF}\unicode[STIX]{x1D719}$
and
$\unicode[STIX]{x1D6FF}\unicode[STIX]{x1D719}$
and
 $\unicode[STIX]{x1D6FF}A_{\Vert }$
.
$\unicode[STIX]{x1D6FF}A_{\Vert }$
.
Although
 $f_{0}$
might be not an exact solution of the unperturbed, collisionless Vlasov equation
$f_{0}$
might be not an exact solution of the unperturbed, collisionless Vlasov equation
 $\text{d}f_{0}/\text{d}t|_{0}=0$
, we assume here that it is a kinetic equilibrium if a collision operator
$\text{d}f_{0}/\text{d}t|_{0}=0$
, we assume here that it is a kinetic equilibrium if a collision operator
 ${\mathcal{C}}[f_{0}]$
on the right-hand side of (3.51) is taken into account. Thus, on the right-hand side of (3.67) the term
${\mathcal{C}}[f_{0}]$
on the right-hand side of (3.51) is taken into account. Thus, on the right-hand side of (3.67) the term
 $-\text{d}f_{0}/\text{d}t|_{0}$
cancels with the collision operator
$-\text{d}f_{0}/\text{d}t|_{0}$
cancels with the collision operator
 ${\mathcal{C}}[f_{0}]$
(see (3.9)).
${\mathcal{C}}[f_{0}]$
(see (3.9)).
Consistently, we choose the evolution equation for
 $g^{\text{h}}$
in such a way that the markers follow the unperturbed trajectories
$g^{\text{h}}$
in such a way that the markers follow the unperturbed trajectories
 $$\begin{eqnarray}\frac{\text{d}g^{\text{h}}}{\text{d}t}=\frac{\unicode[STIX]{x2202}g^{\text{h}}}{\unicode[STIX]{x2202}t}+\unicode[STIX]{x1D735}g^{\text{h}}\boldsymbol{\cdot }\frac{\text{d}\boldsymbol{R}^{(0)}}{\text{d}t}+\frac{\unicode[STIX]{x2202}g^{\text{h}}}{\unicode[STIX]{x2202}\tilde{p}_{\Vert }}\frac{\text{d}\tilde{p}_{\Vert }^{(0)}}{\text{d}t}=0.\end{eqnarray}$$
The equations of motion, equations (3.53) and (3.54), have been split into an unperturbed and a perturbed part:
 $$\begin{eqnarray}\displaystyle & \displaystyle \frac{\text{d}\boldsymbol{R}^{(0)}}{\text{d}t}=\tilde{p}_{\Vert }\boldsymbol{b}+\frac{m}{q}\left[\frac{\tilde{\unicode[STIX]{x1D707}}B+\tilde{p}_{\Vert }^{2}}{BB_{\Vert }^{\ast \text{h}}}\boldsymbol{b}\times \unicode[STIX]{x1D735}B+\frac{\tilde{p}_{\Vert }^{2}}{BB_{\Vert }^{\ast \text{h}}}(\unicode[STIX]{x1D735}\times \boldsymbol{B})_{\bot }\right], & \displaystyle\end{eqnarray}$$
 $$\begin{eqnarray}\displaystyle & \displaystyle \frac{\text{d}v_{\Vert }^{(0)}}{\text{d}t}=\frac{\text{d}\tilde{p}_{\Vert }^{(0)}}{\text{d}t}=-\tilde{\unicode[STIX]{x1D707}}\unicode[STIX]{x1D735}B\boldsymbol{\cdot }\left[\boldsymbol{b}+\frac{m}{q}\frac{\tilde{p}_{\Vert }}{BB_{\Vert }^{\ast \text{h}}}(\unicode[STIX]{x1D735}\times \boldsymbol{B})_{\bot }\right], & \displaystyle\end{eqnarray}$$
 $$\begin{eqnarray}\displaystyle & \displaystyle \frac{\text{d}\boldsymbol{R}^{(1)}}{\text{d}t}=-\frac{q}{m}\left(\boldsymbol{b}+\frac{m}{q}\frac{\tilde{p}_{\Vert }}{B_{\Vert }^{\ast \text{h}}}\boldsymbol{b}\times \unicode[STIX]{x1D73F}\right)\langle \unicode[STIX]{x1D6FF}A_{\Vert }\rangle +\frac{1}{B_{\Vert }^{\ast \text{h}}}\boldsymbol{b}\times \unicode[STIX]{x1D735}\langle \unicode[STIX]{x1D713}_{\text{eff}}\rangle , & \displaystyle\end{eqnarray}$$
 $$\begin{eqnarray}\displaystyle & \displaystyle \frac{\text{d}\tilde{p}_{\Vert }^{(1)}}{\text{d}t}=-\frac{q}{m}\left(\boldsymbol{b}+\frac{m}{q}\frac{\tilde{p}_{\Vert }}{B_{\Vert }^{\ast \text{h}}}\boldsymbol{b}\times \unicode[STIX]{x1D73F}\right)\boldsymbol{\cdot }\unicode[STIX]{x1D735}\langle \unicode[STIX]{x1D713}_{\text{eff}}\rangle . & \displaystyle\end{eqnarray}$$
If we choose the background to be a shifted Maxwellian (3.10), i.e.
 $f_{0}=f_{\text{M}}$
, we can derive:
$f_{0}=f_{\text{M}}$
, we can derive:
 $$\begin{eqnarray}\displaystyle \frac{\unicode[STIX]{x1D735}f_{\text{M}}}{f_{\text{M}}} & = & \displaystyle \frac{1}{f_{\text{M}}}\left(\frac{\unicode[STIX]{x2202}f_{\text{M}}}{\unicode[STIX]{x2202}\unicode[STIX]{x1D6F9}}\unicode[STIX]{x1D735}\unicode[STIX]{x1D6F9}+\frac{\unicode[STIX]{x2202}f_{\text{M}}}{\unicode[STIX]{x2202}\tilde{E}}\unicode[STIX]{x1D735}\tilde{E}\right)\nonumber\\ \displaystyle & = & \displaystyle \left[\left(\frac{\tilde{E}}{v_{\text{th}}^{2}}-\frac{3}{2}\right)\frac{1}{T}\frac{\text{d}T}{\text{d}\unicode[STIX]{x1D6F9}}+\frac{1}{n_{0}}\frac{\text{d}n_{0}}{\text{d}\unicode[STIX]{x1D6F9}}+\frac{\tilde{p}_{\Vert }-\hat{u} _{0}}{v_{\text{th}}^{2}}\frac{\text{d}\hat{u} _{0}}{\text{d}\unicode[STIX]{x1D6F9}}\right]\unicode[STIX]{x1D735}\unicode[STIX]{x1D6F9}-\frac{\tilde{\unicode[STIX]{x1D707}}}{v_{\text{th}}^{2}}\unicode[STIX]{x1D735}B,\end{eqnarray}$$
 $$\begin{eqnarray}\frac{1}{f_{\text{M}}}\frac{\unicode[STIX]{x2202}f_{\text{M}}}{\unicode[STIX]{x2202}\tilde{p}_{\Vert }}=-\frac{\tilde{p}_{\Vert }-\hat{u} _{0}}{v_{\text{th}}^{2}}.\end{eqnarray}$$
By integrating (3.67) in time we can evolve the perturbed weights
 $\unicode[STIX]{x1D6FF}w^{\text{h},\text{lin}}$
which are used at the charge and current assignment. The set of potential equations being used for the linearised PIC simulation is identical with (3.63) and (3.64) except that we use the linearised skin terms in Ampère’s law. This is a consequence of the linearised first moment which neglects the nonlinear skin term (see § 4.5).
$\unicode[STIX]{x1D6FF}w^{\text{h},\text{lin}}$
which are used at the charge and current assignment. The set of potential equations being used for the linearised PIC simulation is identical with (3.63) and (3.64) except that we use the linearised skin terms in Ampère’s law. This is a consequence of the linearised first moment which neglects the nonlinear skin term (see § 4.5).
4 The moments of the distribution function
4.1 Definition of the moments
Usually, the moments of the distribution function are defined as infinite integrals over velocity space. In the symplectic and Hamiltonian formulation, we define the
 $k$
th moment by
$k$
th moment by
 $$\begin{eqnarray}\displaystyle & \displaystyle {\mathcal{M}}_{k}^{\text{s}}[f^{\text{s}}]\stackrel{\text{def}}{=}\int _{0}^{2\unicode[STIX]{x03C0}}\int _{0}^{\infty }\int _{-\infty }^{\infty }v_{\Vert }^{k}\,f^{\text{s}}B_{\Vert }^{\ast \text{s}}\,\text{d}v_{\Vert }\,\text{d}\tilde{\unicode[STIX]{x1D707}}\,\text{d}\unicode[STIX]{x1D6FC}=\int v_{\Vert }^{k}\,f^{\text{s}}B_{\Vert }^{\ast \text{s}}\,\text{d}^{3}v, & \displaystyle\end{eqnarray}$$
 $$\begin{eqnarray}\displaystyle & \displaystyle {\mathcal{M}}_{k}^{\text{h}}[f^{\text{h}}]\stackrel{\text{def}}{=}\int _{0}^{2\unicode[STIX]{x03C0}}\int _{0}^{\infty }\int _{-\infty }^{\infty }\tilde{p}_{\Vert }^{k}\,f^{\text{h}}B_{\Vert }^{\ast \text{h}}\,\text{d}\tilde{p}_{\Vert }\,\text{d}\tilde{\unicode[STIX]{x1D707}}\,\text{d}\unicode[STIX]{x1D6FC}=\int \tilde{p}_{\Vert }^{k}\,f^{\text{h}}B_{\Vert }^{\ast \text{h}}\,\text{d}^{3}p, & \displaystyle\end{eqnarray}$$
where we denote
 $\text{d}^{3}v=\text{d}v_{\Vert }\,\text{d}\tilde{\unicode[STIX]{x1D707}}\,\text{d}\unicode[STIX]{x1D6FC}$
and
$\text{d}^{3}v=\text{d}v_{\Vert }\,\text{d}\tilde{\unicode[STIX]{x1D707}}\,\text{d}\unicode[STIX]{x1D6FC}$
and
 $\text{d}^{3}p=\text{d}\tilde{p}_{\Vert }\,\text{d}\tilde{\unicode[STIX]{x1D707}}\,\text{d}\unicode[STIX]{x1D6FC}$
.
$\text{d}^{3}p=\text{d}\tilde{p}_{\Vert }\,\text{d}\tilde{\unicode[STIX]{x1D707}}\,\text{d}\unicode[STIX]{x1D6FC}$
.
The zeroth moment, i.e.
 $k=0$
, is identical with the particle number density and the first moment, i.e.
$k=0$
, is identical with the particle number density and the first moment, i.e.
 $k=1$
, is the current number density divided by
$k=1$
, is the current number density divided by
 $q$
.
$q$
.
4.2 Transformation of the moments of the distribution function
The moments
 ${\mathcal{M}}_{k}^{\text{s}}[f^{\text{s}}]$
have to be evaluated for the potential equations in the symplectic formulation. However, when we do a PIC simulation in the Hamiltonian formulation we only have
${\mathcal{M}}_{k}^{\text{s}}[f^{\text{s}}]$
have to be evaluated for the potential equations in the symplectic formulation. However, when we do a PIC simulation in the Hamiltonian formulation we only have
 $f^{\text{h}}(\,\tilde{p}_{\Vert })$
at the marker positions at our disposal. Hence, our aim is to compose
$f^{\text{h}}(\,\tilde{p}_{\Vert })$
at the marker positions at our disposal. Hence, our aim is to compose
 ${\mathcal{M}}_{k}^{\text{s}}$
out of
${\mathcal{M}}_{k}^{\text{s}}$
out of
 ${\mathcal{M}}_{k}^{\text{h}}$
. Unfortunately,
${\mathcal{M}}_{k}^{\text{h}}$
. Unfortunately,
 $f^{\text{s}}(v_{\Vert })$
is a function of
$f^{\text{s}}(v_{\Vert })$
is a function of
 $v_{\Vert }$
and not of
$v_{\Vert }$
and not of
 $\tilde{p}_{\Vert }$
. We will need to transform
$\tilde{p}_{\Vert }$
. We will need to transform
 $f^{\text{s}}(v_{\Vert })$
to a form that can be evaluated directly at the
$f^{\text{s}}(v_{\Vert })$
to a form that can be evaluated directly at the
 $\tilde{p}_{\Vert }$
-position. For that purpose we will use the inverse of the so-called ‘pull-back transformation’
$\tilde{p}_{\Vert }$
-position. For that purpose we will use the inverse of the so-called ‘pull-back transformation’
 ${\mathcal{T}}^{\ast -1}$
of
${\mathcal{T}}^{\ast -1}$
of
 $f^{\text{s}}(v_{\Vert })$
to define
$f^{\text{s}}(v_{\Vert })$
to define
 ${\mathcal{T}}^{\ast -1}[f^{\text{s}}](\,\tilde{p}_{\Vert })$
. The pull-back transformation for a function
${\mathcal{T}}^{\ast -1}[f^{\text{s}}](\,\tilde{p}_{\Vert })$
. The pull-back transformation for a function
 ${\hat{h}}^{\text{h}}$
is defined by the coordinate transformation (3.28) as
${\hat{h}}^{\text{h}}$
is defined by the coordinate transformation (3.28) as
 $$\begin{eqnarray}{\mathcal{T}}^{\ast }[{\hat{h}}^{\text{h}}](v_{\Vert })\stackrel{\text{def}}{=}{\hat{h}}^{\text{h}}(\,\tilde{p}_{\Vert }(v_{\Vert }))\end{eqnarray}$$
and its inverse for a function
 ${\hat{h}}^{\text{s}}$
is
${\hat{h}}^{\text{s}}$
is
 $$\begin{eqnarray}{\mathcal{T}}^{\ast -1}[{\hat{h}}^{\text{s}}](\,\tilde{p}_{\Vert })\stackrel{\text{def}}{=}{\hat{h}}^{\text{s}}(v_{\Vert }(\,\tilde{p}_{\Vert })).\end{eqnarray}$$
In case of a
 ${\hat{h}}^{\text{s}}(v_{\Vert })$
having a finite domain, i.e.
${\hat{h}}^{\text{s}}(v_{\Vert })$
having a finite domain, i.e.
 $v_{\Vert }\in [v_{\Vert \text{min}},v_{\Vert \text{max}}]$
,
$v_{\Vert }\in [v_{\Vert \text{min}},v_{\Vert \text{max}}]$
,
 ${\hat{h}}^{\text{h}}(\,\tilde{p}_{\Vert })$
has to be defined consistently in the interval
${\hat{h}}^{\text{h}}(\,\tilde{p}_{\Vert })$
has to be defined consistently in the interval
 $\tilde{p}_{\Vert }\in [\tilde{p}_{\Vert }(v_{\Vert \text{min}}),\tilde{p}_{\Vert }(v_{\Vert \text{max}})]$
. In our PIC simulation we have to discretise the integrals of the moments with a Monte Carlo discretisation using markers being distributed by the marker distribution
$\tilde{p}_{\Vert }\in [\tilde{p}_{\Vert }(v_{\Vert \text{min}}),\tilde{p}_{\Vert }(v_{\Vert \text{max}})]$
. In our PIC simulation we have to discretise the integrals of the moments with a Monte Carlo discretisation using markers being distributed by the marker distribution
 $g^{\text{h}}$
. Hence, the weights are located at
$g^{\text{h}}$
. Hence, the weights are located at
 $\tilde{p}_{\Vert }$
-positions and should cover the correct domain.
$\tilde{p}_{\Vert }$
-positions and should cover the correct domain.
With the definition of the pull-back transformation we can rewrite (3.33) in the following way:
 $$\begin{eqnarray}f^{\text{s}}(v_{\Vert })={\mathcal{T}}^{\ast }[f^{\text{h}}](v_{\Vert })\quad \text{and}\quad f^{\text{h}}(\,\tilde{p}_{\Vert })={\mathcal{T}}^{\ast -1}[f^{\text{s}}](\,\tilde{p}_{\Vert }).\end{eqnarray}$$
The same holds for
 $g^{\text{s}}$
,
$g^{\text{s}}$
,
 $g^{\text{h}}$
, see (3.34), and
$g^{\text{h}}$
, see (3.34), and
 $B_{\Vert }^{\ast \text{s}}$
,
$B_{\Vert }^{\ast \text{s}}$
,
 $B_{\Vert }^{\ast \text{h}}$
, see (3.35).
$B_{\Vert }^{\ast \text{h}}$
, see (3.35).
In general, given a mapping
 $T$
:
$T$
:
 ${\mathcal{V}}\,\rightarrow \,{\mathcal{P}}$
between spaces
${\mathcal{V}}\,\rightarrow \,{\mathcal{P}}$
between spaces
 ${\mathcal{V}},{\mathcal{P}}$
with their corresponding Jacobians
${\mathcal{V}},{\mathcal{P}}$
with their corresponding Jacobians
 ${\mathcal{J}}_{{\mathcal{V}}},{\mathcal{J}}_{{\mathcal{P}}}$
, the pull-back
${\mathcal{J}}_{{\mathcal{V}}},{\mathcal{J}}_{{\mathcal{P}}}$
, the pull-back
 ${\mathcal{T}}^{\ast }$
of a function
${\mathcal{T}}^{\ast }$
of a function
 ${\hat{h}}(p)$
is defined as
${\hat{h}}(p)$
is defined as
 ${\mathcal{T}}^{\ast }[{\hat{h}}](v)={\hat{h}}(p(v))$
with
${\mathcal{T}}^{\ast }[{\hat{h}}](v)={\hat{h}}(p(v))$
with
 $p\in {\mathcal{P}},v\in {\mathcal{V}}$
. For the integral over a pull-back one has the relations (see e.g. Frankel Reference Frankel2012):
$p\in {\mathcal{P}},v\in {\mathcal{V}}$
. For the integral over a pull-back one has the relations (see e.g. Frankel Reference Frankel2012):
 $$\begin{eqnarray}\displaystyle & \displaystyle \int _{T^{-1}(\unicode[STIX]{x1D70E})}{\mathcal{T}}^{\ast }[{\hat{h}}_{{\mathcal{P}}}J_{{\mathcal{P}}}]\,\text{d}v=\int _{\unicode[STIX]{x1D70E}}{\hat{h}}_{{\mathcal{P}}}J_{{\mathcal{P}}}\,\text{d}p, & \displaystyle\end{eqnarray}$$
 $$\begin{eqnarray}\displaystyle & \displaystyle \int _{T(\tilde{\unicode[STIX]{x1D70E}})}{\mathcal{T}}^{\ast -1}[{\hat{h}}_{{\mathcal{V}}}J_{{\mathcal{V}}}]\,\text{d}p=\int _{\tilde{\unicode[STIX]{x1D70E}}}{\hat{h}}_{{\mathcal{V}}}J_{{\mathcal{V}}}\,\text{d}v, & \displaystyle\end{eqnarray}$$
where
 $\unicode[STIX]{x1D70E}$
is a subset of
$\unicode[STIX]{x1D70E}$
is a subset of
 ${\mathcal{P}}$
and
${\mathcal{P}}$
and
 $\tilde{\unicode[STIX]{x1D70E}}$
a subset of
$\tilde{\unicode[STIX]{x1D70E}}$
a subset of
 ${\mathcal{V}}$
(integration domain) and
${\mathcal{V}}$
(integration domain) and
 ${\mathcal{T}}^{\ast }$
has been assumed to be invertible. Note that (4.6) and (4.7), which are an abstract way of performing the integration by substitution, include the integration boundaries.
${\mathcal{T}}^{\ast }$
has been assumed to be invertible. Note that (4.6) and (4.7), which are an abstract way of performing the integration by substitution, include the integration boundaries.
Using (3.33) and (3.35) together with integration by substitution, we get a relation between the moments
 ${\mathcal{M}}_{k}^{\text{s}}[f^{\text{s}}]$
and the moments
${\mathcal{M}}_{k}^{\text{s}}[f^{\text{s}}]$
and the moments
 ${\mathcal{M}}_{k}^{\text{h}}[f^{\text{h}}]$
:
${\mathcal{M}}_{k}^{\text{h}}[f^{\text{h}}]$
:
 $$\begin{eqnarray}\displaystyle {\mathcal{M}}_{k}^{\text{s}}[f^{\text{s}}] & = & \displaystyle \int v_{\Vert }^{k}\,f^{\text{s}}B_{\Vert }^{\ast \text{s}}\,\text{d}^{3}v\nonumber\\ \displaystyle & = & \displaystyle \int _{\tilde{p}_{\Vert }(-\infty )}^{\tilde{p}_{\Vert }(\infty )}v_{\Vert }^{k}(\,\tilde{p}_{\Vert })\,h^{\text{s}}(v_{\Vert }(\,\tilde{p}_{\Vert }))\,\frac{\text{d}v_{\Vert }}{\text{d}\tilde{p}_{\Vert }}\,\text{d}^{3}p\quad \text{with }\frac{\text{d}v_{\Vert }}{\text{d}\tilde{p}_{\Vert }}=1\nonumber\\ \displaystyle & = & \displaystyle \int \left(\tilde{p}_{\Vert }-\frac{q}{m}\langle \unicode[STIX]{x1D6FF}A_{\Vert }\rangle \right)^{k}\,h^{\text{h}}(\,\tilde{p}_{\Vert })\,\text{d}^{3}p=\int \left(\,\tilde{p}_{\Vert }-\frac{q}{m}\langle \unicode[STIX]{x1D6FF}A_{\Vert }\rangle \right)^{k}f^{\text{h}}B_{\Vert }^{\ast \text{h}}\,\text{d}^{3}p,\end{eqnarray}$$
where
 $$\begin{eqnarray}h^{\text{s}}(v_{\Vert })\stackrel{\text{def}}{=}f^{\text{s}}(v_{\Vert })B_{\Vert }^{\ast \text{s}}(v_{\Vert })\quad \text{and}\quad h^{\text{h}}(\,\tilde{p}_{\Vert })\stackrel{\text{def}}{=}f^{\text{h}}(\,\tilde{p}_{\Vert })B_{\Vert }^{\ast \text{h}}(\,\tilde{p}_{\Vert }).\end{eqnarray}$$
Alternatively, we can perform the same calculation by using the inverse pull-back transformation, equation (4.7):
 $$\begin{eqnarray}\displaystyle {\mathcal{M}}_{k}^{\text{s}}[f^{\text{s}}] & = & \displaystyle \int _{\tilde{\unicode[STIX]{x1D70E}}}v_{\Vert }^{k}\,f^{\text{s}}(v_{\Vert })B_{\Vert }^{\ast \text{s}}\,\text{d}^{3}v=\int _{T(\tilde{\unicode[STIX]{x1D70E}})}{\mathcal{T}}^{\ast -1}[v_{\Vert }^{k}\,f^{\text{s}}B_{\Vert }^{\ast \text{s}}]\,\text{d}^{3}p\nonumber\\ \displaystyle & = & \displaystyle \int _{\unicode[STIX]{x1D70E}}\left(\tilde{p}_{\Vert }-\frac{q}{m}\langle \unicode[STIX]{x1D6FF}A_{\Vert }\rangle \right)^{k}f^{\text{h}}B_{\Vert }^{\ast \text{h}}\,\text{d}^{3}p.\end{eqnarray}$$
Using (4.8), we get the particle number density (zeroth moment) and the current number density (first moment) of the distribution function as moments in the Hamiltonian formulation (neglecting gyro-averaging to make the derivation not unnecessarily cumbersome):
 $$\begin{eqnarray}\displaystyle & \displaystyle n^{\text{s}}={\mathcal{M}}_{0}^{\text{s}}[f^{\text{s}}]={\mathcal{M}}_{0}^{\text{h}}[f^{\text{h}}]=n^{\text{h}}, & \displaystyle\end{eqnarray}$$
 $$\begin{eqnarray}\displaystyle & \displaystyle j_{\Vert }^{\text{s}}=q{\mathcal{M}}_{1}^{\text{s}}[f^{\text{s}}]=q{\mathcal{M}}_{1}^{\text{h}}[f^{\text{h}}]-\frac{q^{2}}{m}\unicode[STIX]{x1D6FF}A_{\Vert }{\mathcal{M}}_{0}^{\text{h}}[f^{\text{h}}]=j_{\Vert }^{\text{h}}-\frac{q^{2}}{m}\unicode[STIX]{x1D6FF}A_{\Vert }n^{\text{h}}. & \displaystyle\end{eqnarray}$$
Note that we were able to derive this result only by using
 $h^{\text{s}}(v_{\Vert })=h^{\text{h}}(\,\tilde{p}_{\Vert })$
in (4.8).
$h^{\text{s}}(v_{\Vert })=h^{\text{h}}(\,\tilde{p}_{\Vert })$
in (4.8).
Since the previous relations are not valid for the background
 $f_{0}$
, we separately consider the time-dependent moments of
$f_{0}$
, we separately consider the time-dependent moments of
 $f_{0}$
in the symplectic formulation:
$f_{0}$
in the symplectic formulation:
 $$\begin{eqnarray}\displaystyle {\mathcal{M}}_{k}^{\text{s}}[f_{0}] & = & \displaystyle \int v_{\Vert }^{k}\,f_{0}B_{\Vert }^{\ast \text{s}}\,\text{d}^{3}v\nonumber\\ \displaystyle & = & \displaystyle \int v_{\Vert }^{k}\,f_{0}\left(B+\frac{m}{q}v_{\Vert }\boldsymbol{b}\boldsymbol{\cdot }(\unicode[STIX]{x1D735}\times \boldsymbol{b})\right)\text{d}^{3}v+\boldsymbol{b}\boldsymbol{\cdot }(\unicode[STIX]{x1D735}\times \boldsymbol{b})\int v_{\Vert }^{k}\,f_{0}\unicode[STIX]{x1D6FF}A_{\Vert }\,\text{d}^{3}v\nonumber\\ \displaystyle & = & \displaystyle \int \tilde{p}_{\Vert }^{k}\,f_{0}B_{\Vert }^{\ast \text{h}}\text{d}^{3}p+\boldsymbol{b}\boldsymbol{\cdot }(\unicode[STIX]{x1D735}\times \boldsymbol{b})\int v_{\Vert }^{k}\,f_{0}\unicode[STIX]{x1D6FF}A_{\Vert }\,\text{d}^{3}v\nonumber\\ \displaystyle & = & \displaystyle {\mathcal{M}}_{k}^{\text{h}}[f_{0}]+\frac{\boldsymbol{b}\boldsymbol{\cdot }(\unicode[STIX]{x1D735}\times \boldsymbol{b})}{B}\unicode[STIX]{x1D6FF}A_{\Vert }(t)\int v_{\Vert }^{k}\,f_{0}B\,\text{d}^{3}v,\end{eqnarray}$$
where we have just renamed the integration variable of the first integral on the second line (
 $v_{\Vert }\rightarrow \tilde{p}_{\Vert }$
). In the case
$v_{\Vert }\rightarrow \tilde{p}_{\Vert }$
). In the case
 $f_{0}=f_{\text{M}}$
, we obtain for the zeroth and first moment
$f_{0}=f_{\text{M}}$
, we obtain for the zeroth and first moment
 $$\begin{eqnarray}\displaystyle & \displaystyle n_{0}^{\text{s}}\stackrel{\text{def}}{=}{\mathcal{M}}_{0}^{\text{s}}[f_{0}]=n_{0}+\frac{\boldsymbol{b}\boldsymbol{\cdot }(\unicode[STIX]{x1D735}\times \boldsymbol{b})}{B}\unicode[STIX]{x1D6FF}A_{\Vert }\hat{n}_{0}, & \displaystyle\end{eqnarray}$$
 $$\begin{eqnarray}\displaystyle & \displaystyle j_{0\Vert }^{\text{s}}\stackrel{\text{def}}{=}q{\mathcal{M}}_{1}^{\text{s}}[f_{0}]=j_{0\Vert }+q\frac{\boldsymbol{b}\boldsymbol{\cdot }(\unicode[STIX]{x1D735}\times \boldsymbol{b})}{B}\unicode[STIX]{x1D6FF}A_{\Vert }\hat{n}_{0}\hat{u} _{0}, & \displaystyle\end{eqnarray}$$
where we used the definitions for the particle and current number density of the background (see (3.17) and (3.18)). Thus, the moments of the background
 $f_{0}$
differ in the symplectic and Hamiltonian formulation due to the differing Jacobians in symplectic and Hamiltonian phase space.
$f_{0}$
differ in the symplectic and Hamiltonian formulation due to the differing Jacobians in symplectic and Hamiltonian phase space.
Finally, the corresponding relation for the first two moments of the perturbation to the distribution function
 $\unicode[STIX]{x1D6FF}f^{\text{s}}$
is
$\unicode[STIX]{x1D6FF}f^{\text{s}}$
is
 $$\begin{eqnarray}\displaystyle & \displaystyle \unicode[STIX]{x1D6FF}n^{\text{s}}={\mathcal{M}}_{0}^{\text{s}}[\unicode[STIX]{x1D6FF}f^{\text{s}}]=n^{\text{s}}-n_{0}^{\text{s}}=\unicode[STIX]{x1D6FF}n^{\text{h}}-\frac{\boldsymbol{b}\boldsymbol{\cdot }(\unicode[STIX]{x1D735}\times \boldsymbol{b})}{B}\unicode[STIX]{x1D6FF}A_{\Vert }\hat{n}_{0}, & \displaystyle\end{eqnarray}$$
 $$\begin{eqnarray}\displaystyle & \displaystyle \unicode[STIX]{x1D6FF}j_{\Vert }^{\text{s}}=q{\mathcal{M}}_{1}^{\text{s}}[\unicode[STIX]{x1D6FF}f^{\text{s}}]=j_{\Vert }^{\text{s}}-j_{0\Vert }^{\text{s}}=\unicode[STIX]{x1D6FF}j_{\Vert }^{\text{h}}-\frac{q^{2}}{m}\unicode[STIX]{x1D6FF}A_{\Vert }n^{\text{h}}-q\frac{\boldsymbol{b}\boldsymbol{\cdot }(\unicode[STIX]{x1D735}\times \boldsymbol{b})}{B}\unicode[STIX]{x1D6FF}A_{\Vert }\hat{n}_{0}\hat{u} _{0}, & \displaystyle\end{eqnarray}$$
where we used (4.11), (4.12) and (4.14), (4.15). For the linearisation of (4.17) we have to replace
 $n^{\text{h}}\simeq n_{0}$
. Taking the gyro-averaging into account (4.16) and (4.17) become
$n^{\text{h}}\simeq n_{0}$
. Taking the gyro-averaging into account (4.16) and (4.17) become
 $$\begin{eqnarray}\displaystyle \unicode[STIX]{x1D6FF}\bar{n}^{\text{s}} & = & \displaystyle \unicode[STIX]{x1D6FF}\bar{n}^{\text{h}}-\int \frac{\boldsymbol{b}\boldsymbol{\cdot }(\unicode[STIX]{x1D735}\times \boldsymbol{b})}{B}f_{\text{M}}\langle \unicode[STIX]{x1D6FF}A_{\Vert }\rangle \,\unicode[STIX]{x1D6FF}(\boldsymbol{R}+\unicode[STIX]{x1D746}-\boldsymbol{x})\,B\,\text{d}\boldsymbol{R}\,\text{d}^{3}p,\end{eqnarray}$$
 $$\begin{eqnarray}\displaystyle \unicode[STIX]{x1D6FF}\bar{j}_{\Vert }^{\text{s}} & = & \displaystyle \unicode[STIX]{x1D6FF}\bar{j}_{\Vert }^{\text{h}}-\frac{q^{2}}{m}\int f^{\text{h}}\langle \unicode[STIX]{x1D6FF}A_{\Vert }\rangle \,\unicode[STIX]{x1D6FF}(\boldsymbol{R}+\unicode[STIX]{x1D746}-\boldsymbol{x})\,B_{\Vert }^{\ast \text{h}}\,\text{d}\boldsymbol{R}\,\text{d}^{3}p\nonumber\\ \displaystyle & & \displaystyle -\,q\int \hat{u} _{0}\frac{\boldsymbol{b}\boldsymbol{\cdot }(\unicode[STIX]{x1D735}\times \boldsymbol{b})}{B}f_{\text{M}}\langle \unicode[STIX]{x1D6FF}A_{\Vert }\rangle \,\unicode[STIX]{x1D6FF}(\boldsymbol{R}+\unicode[STIX]{x1D746}-\boldsymbol{x})\,B\,\text{d}\boldsymbol{R}\,\text{d}^{3}p.\end{eqnarray}$$
The linearised form of (4.18) and (4.19) can be written as (see also § 4.3.2)
 $$\begin{eqnarray}\displaystyle \unicode[STIX]{x1D6FF}\bar{n}^{\text{s},\text{lin}} & = & \displaystyle \unicode[STIX]{x1D6FF}\bar{n}^{\text{h},\text{lin}}-\int \frac{\boldsymbol{b}\boldsymbol{\cdot }(\unicode[STIX]{x1D735}\times \boldsymbol{b})}{B}\frac{\tilde{p}_{\Vert }(\,\tilde{p}_{\Vert }-\hat{u} _{0})}{v_{\text{th}}^{2}}f_{\text{M}}\langle \unicode[STIX]{x1D6FF}A_{\Vert }\rangle \,\unicode[STIX]{x1D6FF}(\boldsymbol{R}+\unicode[STIX]{x1D746}-\boldsymbol{x})\,B\,\text{d}\boldsymbol{R}\,\text{d}^{3}p,\end{eqnarray}$$
 $$\begin{eqnarray}\displaystyle \unicode[STIX]{x1D6FF}\bar{j}_{\Vert }^{\text{s},\text{lin}} & = & \displaystyle \unicode[STIX]{x1D6FF}\bar{j}_{\Vert }^{\text{h},\text{lin}}-\frac{q^{2}}{m}\int \frac{\tilde{p}_{\Vert }(\,\tilde{p}_{\Vert }-\hat{u} _{0})}{v_{\text{th}}^{2}}f_{\text{M}}\langle \unicode[STIX]{x1D6FF}A_{\Vert }\rangle \,\unicode[STIX]{x1D6FF}(\boldsymbol{R}+\unicode[STIX]{x1D746}-\boldsymbol{x})\,B_{\Vert }^{\ast \text{h}}\,\text{d}\boldsymbol{R}\,\text{d}^{3}p\nonumber\\ \displaystyle & & \displaystyle -\,q\int \hat{u} _{0}\frac{\boldsymbol{b}\boldsymbol{\cdot }(\unicode[STIX]{x1D735}\times \boldsymbol{b})}{B}\frac{\tilde{p}_{\Vert }(\,\tilde{p}_{\Vert }-\hat{u} _{0})}{v_{\text{th}}^{2}}f_{\text{M}}\langle \unicode[STIX]{x1D6FF}A_{\Vert }\rangle \,\unicode[STIX]{x1D6FF}(\boldsymbol{R}+\unicode[STIX]{x1D746}-\boldsymbol{x})\,B\,\text{d}\boldsymbol{R}\,\text{d}^{3}p,\end{eqnarray}$$
where we used (3.21) and
 $$\begin{eqnarray}\int \left(f_{0}+\tilde{p}_{\Vert }\left.\frac{\unicode[STIX]{x2202}f_{0}}{\unicode[STIX]{x2202}v_{\Vert }}\right|_{v_{\Vert }=\tilde{p}_{\Vert }}\right)\,\text{d}\tilde{p}_{\Vert }=\Big[\tilde{p}_{\Vert }\,f_{0}\Big]_{-\infty }^{\infty }=0\quad \text{with }\left.\frac{\unicode[STIX]{x2202}f_{0}}{\unicode[STIX]{x2202}v_{\Vert }}\right|_{v_{\Vert }=\tilde{p}_{\Vert }}=-\frac{\tilde{p}_{\Vert }-\hat{u} _{0}}{v_{\text{th}}^{2}}f_{\text{M}}.\end{eqnarray}$$
4.3 Effect of the finite velocity sphere on the moments
The markers in reduced phase space are distributed by using the marker distribution function
 $g$
(marker loading). For more details see § 10. In a real simulation, we are always limited by finite compute resources which implicates the simulation being restricted by a finite velocity sphere. An exception might be a Maxwellian marker loading which by definition distributes the markers over the infinite velocity sphere but for the price of having a resolution problem at higher velocities (see also § 6.1).
$g$
(marker loading). For more details see § 10. In a real simulation, we are always limited by finite compute resources which implicates the simulation being restricted by a finite velocity sphere. An exception might be a Maxwellian marker loading which by definition distributes the markers over the infinite velocity sphere but for the price of having a resolution problem at higher velocities (see also § 6.1).
If we assume that the perturbed particle and current number densities are zero at the beginning of the simulation it follows that also the perturbed potentials are zero and thus we have
 $\tilde{p}_{\Vert }(t_{0})=v_{\Vert }(t_{0})$
for the markers. Hence, the marker loading is done in
$\tilde{p}_{\Vert }(t_{0})=v_{\Vert }(t_{0})$
for the markers. Hence, the marker loading is done in
 $(v_{\Vert },v_{\bot })$
-coordinates where the perpendicular velocity coordinate is defined by
$(v_{\Vert },v_{\bot })$
-coordinates where the perpendicular velocity coordinate is defined by
 $v_{\bot }=\sqrt{2B\tilde{\unicode[STIX]{x1D707}}}$
. The markers are distributed in reduced velocity space initially within the limits of a semicircle parametrised by the coordinates. For each species
$v_{\bot }=\sqrt{2B\tilde{\unicode[STIX]{x1D707}}}$
. The markers are distributed in reduced velocity space initially within the limits of a semicircle parametrised by the coordinates. For each species
 $s$
the semicircle is centred around
$s$
the semicircle is centred around
 $(\hat{u} _{0s},0)$
and its radius is defined by the discretisation parameter
$(\hat{u} _{0s},0)$
and its radius is defined by the discretisation parameter
 $\unicode[STIX]{x1D705}_{\text{v}s}$
:
$\unicode[STIX]{x1D705}_{\text{v}s}$
:
 $$\begin{eqnarray}v_{\text{max}s}(\unicode[STIX]{x1D6F9})\stackrel{\text{def}}{=}\unicode[STIX]{x1D705}_{\text{v}s}v_{\text{th}s}(\unicode[STIX]{x1D6F9}).\end{eqnarray}$$
For nonlinear simulations there are two effects. First, the individual marker can be accelerated and thus change its kinetic energy and potentially leave its initial velocity sphere. Second, the
 $v_{\Vert }$
- and
$v_{\Vert }$
- and
 $\tilde{p}_{\Vert }$
-coordinates evolve differently due to the coordinate transformation (3.28). Depending on the value of
$\tilde{p}_{\Vert }$
-coordinates evolve differently due to the coordinate transformation (3.28). Depending on the value of
 $\unicode[STIX]{x1D6FF}A_{\Vert }(t)$
the
$\unicode[STIX]{x1D6FF}A_{\Vert }(t)$
the
 $\tilde{p}_{\Vert }$
-velocity sphere is oscillating around the
$\tilde{p}_{\Vert }$
-velocity sphere is oscillating around the
 $v_{\Vert }$
-velocity sphere which stays fixed as a whole. This has an effect when we calculate the moments of the distribution function within a finite velocity sphere. For a finite velocity sphere the moments
$v_{\Vert }$
-velocity sphere which stays fixed as a whole. This has an effect when we calculate the moments of the distribution function within a finite velocity sphere. For a finite velocity sphere the moments
 ${\mathcal{M}}_{k}^{\text{s}}[f^{\text{s}}]$
and
${\mathcal{M}}_{k}^{\text{s}}[f^{\text{s}}]$
and
 ${\mathcal{M}}_{k}^{\text{h}}[f^{\text{h}}]$
are approximated by the integrals:
${\mathcal{M}}_{k}^{\text{h}}[f^{\text{h}}]$
are approximated by the integrals:
 $$\begin{eqnarray}\displaystyle & \displaystyle \widetilde{{\mathcal{M}}}_{k}^{\text{s}}[f^{\text{s}}]\stackrel{\text{def}}{=}\int _{0}^{2\unicode[STIX]{x03C0}}\int _{0}^{v_{\bot \text{max}}}\int _{v_{\Vert \text{min}}}^{v_{\Vert \text{max}}}v_{\Vert }^{k}\,f^{\text{s}}\frac{B_{\Vert }^{\ast \text{s}}}{B}v_{\bot }\,\text{d}v_{\Vert }\,\text{d}v_{\bot }\,\text{d}\unicode[STIX]{x1D6FC}, & \displaystyle\end{eqnarray}$$
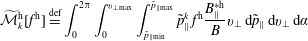 $$\begin{eqnarray}\displaystyle & \displaystyle \widetilde{{\mathcal{M}}}_{k}^{\text{h}}[f^{\text{h}}]\stackrel{\text{def}}{=}\int _{0}^{2\unicode[STIX]{x03C0}}\int _{0}^{v_{\bot \text{max}}}\int _{\tilde{p}_{\Vert \text{min}}}^{\tilde{p}_{\Vert \text{max}}}\tilde{p}_{\Vert }^{k}\,f^{\text{h}}\frac{B_{\Vert }^{\ast \text{h}}}{B}v_{\bot }\,\text{d}\tilde{p}_{\Vert }\,\text{d}v_{\bot }\,\text{d}\unicode[STIX]{x1D6FC} & \displaystyle\end{eqnarray}$$
with the limits:
 $$\begin{eqnarray}v_{\Vert \text{min}}=-v_{\text{max}}+\hat{u} _{0},\quad v_{\Vert \text{max}}=v_{\text{max}}+\hat{u} _{0}\quad \text{and}\quad v_{\bot \text{max}}=v_{\text{max}},\end{eqnarray}$$
 $$\begin{eqnarray}\displaystyle & \displaystyle \tilde{p}_{\Vert \text{min}}=\tilde{p}_{\Vert }(v_{\Vert \text{min}})=-\sqrt{v_{\max }^{2}-v_{\bot }^{2}}+\hat{u} _{0}+\frac{q}{m}\langle \unicode[STIX]{x1D6FF}A_{\Vert }\rangle , & \displaystyle\end{eqnarray}$$
 $$\begin{eqnarray}\displaystyle & \displaystyle \tilde{p}_{\Vert \text{max}}=\tilde{p}_{\Vert }(v_{\Vert \text{max}})=\sqrt{v_{\max }^{2}-v_{\bot }^{2}}+\hat{u} _{0}+\frac{q}{m}\langle \unicode[STIX]{x1D6FF}A_{\Vert }\rangle . & \displaystyle\end{eqnarray}$$
The moments of the background distribution function
 $\widetilde{{\mathcal{M}}}_{k}^{\text{s}}[f_{0}]$
and
$\widetilde{{\mathcal{M}}}_{k}^{\text{s}}[f_{0}]$
and
 $\widetilde{{\mathcal{M}}}_{k}^{\text{h}}[f_{0}]$
can be calculated analytically for the finite sphere if we suppose a shifted Maxwellian (3.10). This will be done for the particle number density (zeroth moment) and the current number density (first moment) in the following sections. The difference between the results of the finite and infinite integrals can be expressed by correction factors
$\widetilde{{\mathcal{M}}}_{k}^{\text{h}}[f_{0}]$
can be calculated analytically for the finite sphere if we suppose a shifted Maxwellian (3.10). This will be done for the particle number density (zeroth moment) and the current number density (first moment) in the following sections. The difference between the results of the finite and infinite integrals can be expressed by correction factors
 $\tilde{C}_{\text{v}}(\unicode[STIX]{x1D705}_{\text{v}s},\unicode[STIX]{x1D6FE}_{s})$
being defined in appendix D. Only in the Hamiltonian formulation do they depend on the parameter
$\tilde{C}_{\text{v}}(\unicode[STIX]{x1D705}_{\text{v}s},\unicode[STIX]{x1D6FE}_{s})$
being defined in appendix D. Only in the Hamiltonian formulation do they depend on the parameter
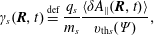 $$\begin{eqnarray}\unicode[STIX]{x1D6FE}_{s}(\boldsymbol{R},t)\stackrel{\text{def}}{=}\frac{q_{s}}{m_{s}}\frac{\langle \unicode[STIX]{x1D6FF}A_{\Vert }(\boldsymbol{R},t)\rangle }{v_{\text{th}s}(\unicode[STIX]{x1D6F9})},\end{eqnarray}$$
which denotes the shift of the
 $\tilde{p}_{\Vert }$
-velocity sphere. In the limit of
$\tilde{p}_{\Vert }$
-velocity sphere. In the limit of
 $\unicode[STIX]{x1D6FE}_{s}\rightarrow 0$
, we approach the symplectic case and in the limit of
$\unicode[STIX]{x1D6FE}_{s}\rightarrow 0$
, we approach the symplectic case and in the limit of
 $\unicode[STIX]{x1D705}_{\text{v}s}\rightarrow \infty$
the case of an infinite velocity sphere.
$\unicode[STIX]{x1D705}_{\text{v}s}\rightarrow \infty$
the case of an infinite velocity sphere.
Although the formal description by a finite velocity sphere is the correct way, one might argue that it is of minor importance as the velocity sphere can always be chosen sufficiently large in numerical simulation to approximate the case of an infinite velocity sphere sufficiently well. However, the correct description by a finite velocity sphere results in a faster convergence rate with the parameter
 $\unicode[STIX]{x1D705}_{\text{v}}$
having the benefit of needing a smaller number of markers
$\unicode[STIX]{x1D705}_{\text{v}}$
having the benefit of needing a smaller number of markers
 $N_{\text{p}}$
(Hatzky et al.
Reference Hatzky, Könies and Mishchenko2007, figure 2) and being able to select a larger time-step size
$N_{\text{p}}$
(Hatzky et al.
Reference Hatzky, Könies and Mishchenko2007, figure 2) and being able to select a larger time-step size
 $\unicode[STIX]{x0394}t$
in numerical simulation.
$\unicode[STIX]{x0394}t$
in numerical simulation.
4.3.1 The nonlinear case
Again, we can express the moments
 $\widetilde{{\mathcal{M}}}_{k}^{\text{s}}[f^{\text{s}}]$
by the moments
$\widetilde{{\mathcal{M}}}_{k}^{\text{s}}[f^{\text{s}}]$
by the moments
 $\widetilde{{\mathcal{M}}}_{k}^{\text{h}}[f^{\text{h}}]$
using the following relation (compare with (4.8) and (4.10)):
$\widetilde{{\mathcal{M}}}_{k}^{\text{h}}[f^{\text{h}}]$
using the following relation (compare with (4.8) and (4.10)):
 $$\begin{eqnarray}\displaystyle \widetilde{{\mathcal{M}}}_{k}^{\text{s}}[f^{\text{s}}] & = & \displaystyle \int _{0}^{2\unicode[STIX]{x03C0}}\int _{0}^{v_{\bot \text{max}}}\int _{v_{\Vert \text{min}}}^{v_{\Vert \text{max}}}v_{\Vert }^{k}h^{\text{s}}(v_{\Vert })\,\text{d}v_{\Vert }\,\frac{v_{\bot }}{B}\,\text{d}v_{\bot }\,\text{d}\unicode[STIX]{x1D6FC}\nonumber\\ \displaystyle & = & \displaystyle \int _{0}^{2\unicode[STIX]{x03C0}}\int _{0}^{v_{\bot \text{max}}}\int _{\tilde{p}_{\Vert }(v_{\Vert \text{min}})}^{\tilde{p}_{\Vert }(v_{\Vert \text{max}})}\left(\tilde{p}_{\Vert }-\frac{q}{m}\langle \unicode[STIX]{x1D6FF}A_{\Vert }\rangle \right)^{k}h^{\text{h}}(\,\tilde{p}_{\Vert })\,\text{d}\tilde{p}_{\Vert }\,\frac{v_{\bot }}{B}\,\text{d}v_{\bot }\,\text{d}\unicode[STIX]{x1D6FC}\nonumber\\ \displaystyle & = & \displaystyle \int _{0}^{2\unicode[STIX]{x03C0}}\int _{0}^{v_{\bot \text{max}}}\int _{\tilde{p}_{\Vert \text{min}}}^{\tilde{p}_{\Vert \text{max}}}\left(\tilde{p}_{\Vert }-\frac{q}{m}\langle \unicode[STIX]{x1D6FF}A_{\Vert }\rangle \right)^{k}f^{\text{h}}\frac{B_{\Vert }^{\ast \text{h}}}{B}\,\text{d}\tilde{p}_{\Vert }\,v_{\bot }\,\text{d}v_{\bot }\,\text{d}\unicode[STIX]{x1D6FC}.\end{eqnarray}$$
The particle and current number density, now having a tilde, can be written as (neglecting gyro-averaging to make the derivation not unnecessarily cumbersome)
 $$\begin{eqnarray}\displaystyle & \displaystyle {\tilde{n}}^{\text{s}}=\widetilde{{\mathcal{M}}}_{0}^{\text{s}}[f^{\text{s}}]=\widetilde{{\mathcal{M}}}_{0}^{\text{h}}[f^{\text{h}}]={\tilde{n}}^{\text{h}}, & \displaystyle\end{eqnarray}$$
 $$\begin{eqnarray}\displaystyle & \displaystyle \tilde{j}_{\Vert }^{\text{s}}=q\widetilde{{\mathcal{M}}}_{1}^{\text{s}}[f^{\text{s}}]=q\widetilde{{\mathcal{M}}}_{1}^{\text{h}}[f^{\text{h}}]-\frac{q^{2}}{m}\unicode[STIX]{x1D6FF}A_{\Vert }\widetilde{{\mathcal{M}}}_{0}^{\text{h}}[f^{\text{h}}]=\tilde{j}_{\Vert }^{\text{h}}-\frac{q^{2}}{m}\unicode[STIX]{x1D6FF}A_{\Vert }{\tilde{n}}^{\text{h}}. & \displaystyle\end{eqnarray}$$
Therefore, equations (4.31) and (4.32) are a generalisation of (4.11) and (4.12).
The moments of the background
 $f_{0}=f_{\text{M}}$
can be derived analogously to (4.14) and (4.15):
$f_{0}=f_{\text{M}}$
can be derived analogously to (4.14) and (4.15):
 $$\begin{eqnarray}\displaystyle & \displaystyle {\tilde{n}}_{0}^{\text{s}}=\widetilde{{\mathcal{M}}}_{0}^{\text{s}}[f_{0}]=\,C_{\text{v}2}n_{0}+\frac{\boldsymbol{b}\boldsymbol{\cdot }(\unicode[STIX]{x1D735}\times \boldsymbol{b})}{B}\unicode[STIX]{x1D6FF}A_{\Vert }C_{\text{v}2}\hat{n}_{0}, & \displaystyle\end{eqnarray}$$
 $$\begin{eqnarray}\displaystyle & \displaystyle \tilde{j}_{0\Vert }^{\text{s}}=q\widetilde{{\mathcal{M}}}_{1}^{\text{s}}[f_{0}]=\,q\hat{n}_{0}\left[C_{\text{v}2}\hat{u} _{0}+\frac{m}{q}\frac{\boldsymbol{b}\boldsymbol{\cdot }(\unicode[STIX]{x1D735}\times \boldsymbol{b})}{B}C_{\text{v}3}(v_{\text{th}}^{2}+\hat{u} _{0}^{2})+\frac{\boldsymbol{b}\boldsymbol{\cdot }(\unicode[STIX]{x1D735}\times \boldsymbol{b})}{B}\unicode[STIX]{x1D6FF}A_{\Vert }C_{\text{v}2}\hat{u} _{0}\right]. & \displaystyle \nonumber\\ \displaystyle & & \displaystyle\end{eqnarray}$$
We used the correction factors
 $\tilde{C}_{v}(\unicode[STIX]{x1D705}_{\text{v}},\unicode[STIX]{x1D6FE})$
(see appendix D). In the symplectic case, where we have
$\tilde{C}_{v}(\unicode[STIX]{x1D705}_{\text{v}},\unicode[STIX]{x1D6FE})$
(see appendix D). In the symplectic case, where we have
 $\unicode[STIX]{x1D6FE}=0$
, we will use the abbreviations
$\unicode[STIX]{x1D6FE}=0$
, we will use the abbreviations
 $C_{\text{v}1}=\tilde{C}_{\text{v}1}(\unicode[STIX]{x1D705}_{\text{v}},0)$
,
$C_{\text{v}1}=\tilde{C}_{\text{v}1}(\unicode[STIX]{x1D705}_{\text{v}},0)$
,
 $C_{\text{v}2}=\tilde{C}_{\text{v}2}(\unicode[STIX]{x1D705}_{\text{v}},0)$
and
$C_{\text{v}2}=\tilde{C}_{\text{v}2}(\unicode[STIX]{x1D705}_{\text{v}},0)$
and
 $C_{\text{v}3}=\tilde{C}_{\text{v}3}(\unicode[STIX]{x1D705}_{\text{v}},0)$
.
$C_{\text{v}3}=\tilde{C}_{\text{v}3}(\unicode[STIX]{x1D705}_{\text{v}},0)$
.
As the
 $\unicode[STIX]{x1D6FF}f$
-ansatz separates the background part
$\unicode[STIX]{x1D6FF}f$
-ansatz separates the background part
 $f_{0}$
from the perturbed part
$f_{0}$
from the perturbed part
 $\unicode[STIX]{x1D6FF}f$
, we can further simplify these equations by choosing an infinite velocity sphere for the analytic calculation of the unperturbed quantities:
$\unicode[STIX]{x1D6FF}f$
, we can further simplify these equations by choosing an infinite velocity sphere for the analytic calculation of the unperturbed quantities:
 $$\begin{eqnarray}\displaystyle & \displaystyle {\tilde{n}}_{0}^{\text{s}}=n_{0}+\frac{\boldsymbol{b}\boldsymbol{\cdot }(\unicode[STIX]{x1D735}\times \boldsymbol{b})}{B}\unicode[STIX]{x1D6FF}A_{\Vert }C_{\text{v}2}\hat{n}_{0}, & \displaystyle\end{eqnarray}$$
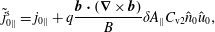 $$\begin{eqnarray}\displaystyle & \displaystyle \tilde{j}_{0\Vert }^{\text{s}}=j_{0\Vert }+q\frac{\boldsymbol{b}\boldsymbol{\cdot }(\unicode[STIX]{x1D735}\times \boldsymbol{b})}{B}\unicode[STIX]{x1D6FF}A_{\Vert }C_{\text{v}2}\hat{n}_{0}\hat{u} _{0}, & \displaystyle\end{eqnarray}$$
Taking the gyro-averaging into account (4.35) and (4.36) become:
 $$\begin{eqnarray}\displaystyle & \displaystyle \tilde{\bar{n}}_{0}^{\text{s}}=\bar{n}_{0}+q\int _{v_{\text{fin}}}\frac{\boldsymbol{b}\boldsymbol{\cdot }(\unicode[STIX]{x1D735}\times \boldsymbol{b})}{B}f_{\text{M}}\langle \unicode[STIX]{x1D6FF}A_{\Vert }\rangle \,\unicode[STIX]{x1D6FF}(\boldsymbol{R}+\unicode[STIX]{x1D746}-\boldsymbol{x})\,B\,\text{d}\boldsymbol{R}\,\text{d}^{3}v, & \displaystyle\end{eqnarray}$$
 $$\begin{eqnarray}\displaystyle & \displaystyle \tilde{\bar{j}}_{0\Vert }^{\text{s}}=\bar{j}_{0\Vert }+q\int _{v_{\text{fin}}}\hat{u} _{0}\frac{\boldsymbol{b}\boldsymbol{\cdot }(\unicode[STIX]{x1D735}\times \boldsymbol{b})}{B}f_{\text{M}}\langle \unicode[STIX]{x1D6FF}A_{\Vert }\rangle \,\unicode[STIX]{x1D6FF}(\boldsymbol{R}+\unicode[STIX]{x1D746}-\boldsymbol{x})\,B\,\text{d}\boldsymbol{R}\,\text{d}^{3}v. & \displaystyle\end{eqnarray}$$
With the help of (4.35)–(4.38) one sees that the quasi-neutrality condition and Ampère’s law take the following form in the symplectic formulation for a finite velocity sphere (compare with (3.26) and (3.27)):
 $$\begin{eqnarray}\displaystyle \hspace{-30.0pt} & & \displaystyle -\unicode[STIX]{x1D735}\boldsymbol{\cdot }\left(\frac{q_{\text{i}}^{2}n_{0\text{i}}}{k_{\text{B}}T_{\text{i}}}\unicode[STIX]{x1D70C}_{0\text{i}}^{2}\unicode[STIX]{x1D735}_{\bot }\unicode[STIX]{x1D6FF}\unicode[STIX]{x1D719}\right)=q_{\text{i}}\unicode[STIX]{x1D6FF}\tilde{\bar{n}}_{\text{i}}^{\text{s}}+q_{\text{e}}\unicode[STIX]{x1D6FF}{\tilde{n}}_{\text{e}}^{\text{s}}\nonumber\\ \displaystyle \hspace{-30.0pt} & & \displaystyle \quad +\,q_{\text{i}}\int _{v_{\text{fin}}}\frac{\boldsymbol{b}\boldsymbol{\cdot }(\unicode[STIX]{x1D735}\times \boldsymbol{b})}{B}f_{\text{Mi}}\langle \unicode[STIX]{x1D6FF}A_{\Vert }\rangle \,\unicode[STIX]{x1D6FF}(\boldsymbol{R}+\unicode[STIX]{x1D746}-\boldsymbol{x})\,B\,\text{d}\boldsymbol{R}\,\text{d}^{3}v+\frac{\boldsymbol{b}\boldsymbol{\cdot }(\unicode[STIX]{x1D735}\times \boldsymbol{b})}{B}q_{\text{e}}C_{\text{v}2\text{e}}\hat{n}_{0\text{e}}\,\unicode[STIX]{x1D6FF}A_{\Vert },\nonumber\\ \displaystyle & & \displaystyle\end{eqnarray}$$
 $$\begin{eqnarray}-\unicode[STIX]{x1D735}\boldsymbol{\cdot }\unicode[STIX]{x1D735}_{\bot }\unicode[STIX]{x1D6FF}A_{\Vert }-\unicode[STIX]{x1D707}_{0}\frac{\boldsymbol{b}\boldsymbol{\cdot }(\unicode[STIX]{x1D735}\times \boldsymbol{b})}{B}q_{\text{e}}C_{\text{v}2\text{e}}\hat{n}_{0\text{e}}\hat{u} _{0\text{e}}\,\unicode[STIX]{x1D6FF}A_{\Vert }=\unicode[STIX]{x1D707}_{0}(\unicode[STIX]{x1D6FF}\tilde{\bar{j}}_{\Vert \text{i}}^{\text{s}}+\unicode[STIX]{x1D6FF}\tilde{j}_{\Vert \text{e}}^{\text{s}}).\end{eqnarray}$$
Note that we did not neglect the gyro-averaging here and that the symplectic set of potential equations holds for both the linear and nonlinear case.
Unfortunately, a simple relation for the moments of
 $\unicode[STIX]{x1D6FF}f^{\text{s}}$
, which expresses them in the Hamiltonian formulation (compare with (4.18) and (4.19)), cannot be derived for the case of a finite velocity sphere. However, it is possible for the linear case which will be addressed in the next section.
$\unicode[STIX]{x1D6FF}f^{\text{s}}$
, which expresses them in the Hamiltonian formulation (compare with (4.18) and (4.19)), cannot be derived for the case of a finite velocity sphere. However, it is possible for the linear case which will be addressed in the next section.
4.3.2 The linear case
Only in the linear case, it is feasible to express the symplectic moments by the Hamiltonian ones. Within a linear simulation the markers are pushed along the unperturbed trajectories, e.g. for the parallel dynamics by (3.70). Hence,
 $v_{\Vert }(t)=\tilde{p}_{\Vert }(t)$
is valid during the whole simulation. In addition, the total energy or rather the velocity of each marker is conserved. Therefore, the limits of the initial velocity sphere do not change over time and the markers cannot leave the initial loading sphere.
$v_{\Vert }(t)=\tilde{p}_{\Vert }(t)$
is valid during the whole simulation. In addition, the total energy or rather the velocity of each marker is conserved. Therefore, the limits of the initial velocity sphere do not change over time and the markers cannot leave the initial loading sphere.
Due to the oscillating limits of the finite velocity sphere the moments of the background
 $f_{0}=f_{\text{M}}$
in the Hamiltonian formulation are complicated expressions (compare with (3.21) and (3.23)):
$f_{0}=f_{\text{M}}$
in the Hamiltonian formulation are complicated expressions (compare with (3.21) and (3.23)):
 $$\begin{eqnarray}\displaystyle \hspace{-24.0pt}{\tilde{n}}_{0}^{\text{h}}=\widetilde{{\mathcal{M}}}_{0}^{\text{h}}[f_{0}] & = & \displaystyle \hat{n}_{0}\left\{\tilde{C}_{\text{v}2}(\unicode[STIX]{x1D705}_{\text{v}},\unicode[STIX]{x1D6FE})+\frac{m}{q}\frac{\boldsymbol{b}\boldsymbol{\cdot }(\unicode[STIX]{x1D735}\times \boldsymbol{b})}{B}[\tilde{C}_{\text{v}2}(\unicode[STIX]{x1D705}_{\text{v}},\unicode[STIX]{x1D6FE})\hat{u} _{0}+\tilde{C}_{\text{v}4}(\unicode[STIX]{x1D705}_{\text{v}},\unicode[STIX]{x1D6FE})]\right\},\end{eqnarray}$$
 $$\begin{eqnarray}\displaystyle \hspace{-24.0pt}\tilde{j}_{0\Vert }^{\text{h}}=q\widetilde{{\mathcal{M}}}_{1}^{\text{h}}[f_{0}] & = & \displaystyle q\hat{n}_{0}\left\{\tilde{C}_{\text{v}2}(\unicode[STIX]{x1D705}_{\text{v}},\unicode[STIX]{x1D6FE})\hat{u} _{0}+\tilde{C}_{\text{v}4}(\unicode[STIX]{x1D705}_{\text{v}},\unicode[STIX]{x1D6FE})\right.\nonumber\\ \displaystyle \hspace{-24.0pt} & & \displaystyle \left.+\,\frac{m}{q}\frac{\boldsymbol{b}\boldsymbol{\cdot }(\unicode[STIX]{x1D735}\times \boldsymbol{b})}{B}\left[\tilde{C}_{\text{v}3}(\unicode[STIX]{x1D705}_{\text{v}},\unicode[STIX]{x1D6FE})(v_{\text{th}}^{2}+\hat{u} _{0}^{2})+2\tilde{C}_{\text{v}4}(\unicode[STIX]{x1D705}_{\text{v}},\unicode[STIX]{x1D6FE})\hat{u} _{0}\right]\right\}.\end{eqnarray}$$
After linearisation it is simple to split these equations into a background and perturbed part. Hence, we derive the linearised background particle and current number densities in the Hamiltonian formulation:
 $$\begin{eqnarray}\displaystyle {\tilde{n}}_{0}^{\text{h},\text{lin}}=\widetilde{{\mathcal{M}}}_{0}^{\text{h},\text{lin}}[f_{0}] & = & \displaystyle \hat{n}_{0}\left\{C_{\text{v}2}+\frac{m}{q}\frac{\boldsymbol{b}\boldsymbol{\cdot }(\unicode[STIX]{x1D735}\times \boldsymbol{b})}{B}[C_{\text{v}2}\hat{u} _{0}+\tilde{C}_{\text{v}4}^{\text{lin}}(\unicode[STIX]{x1D705}_{\text{v}},\unicode[STIX]{x1D6FE})]\right\},\end{eqnarray}$$
 $$\begin{eqnarray}\displaystyle \tilde{j}_{0\Vert }^{\text{h},\text{lin}}=q\widetilde{{\mathcal{M}}}_{1}^{\text{h},\text{lin}}[f_{0}] & = & \displaystyle q\hat{n}_{0}\bigg\{C_{\text{v}2}\hat{u} _{0}+\tilde{C}_{\text{v}4}^{\text{lin}}(\unicode[STIX]{x1D705}_{\text{v}},\unicode[STIX]{x1D6FE})\nonumber\\ \displaystyle & & \displaystyle +\,\frac{m}{q}\frac{\boldsymbol{b}\boldsymbol{\cdot }(\unicode[STIX]{x1D735}\times \boldsymbol{b})}{B}\left[C_{\text{v}3}(v_{\text{th}}^{2}+\hat{u} _{0}^{2})+2\tilde{C}_{\text{v}4}^{\text{lin}}(\unicode[STIX]{x1D705}_{\text{v}},\unicode[STIX]{x1D6FE})\hat{u} _{0}\right]\!\bigg\}.\end{eqnarray}$$
Due to the
 $\unicode[STIX]{x1D6FF}f$
-ansatz we can choose again an infinite velocity sphere for the analytic calculation of the unperturbed quantities. As a result, the background particle and current number density take the following form:
$\unicode[STIX]{x1D6FF}f$
-ansatz we can choose again an infinite velocity sphere for the analytic calculation of the unperturbed quantities. As a result, the background particle and current number density take the following form:
 $$\begin{eqnarray}\displaystyle {\tilde{n}}_{0}^{\text{h},\text{lin}} & = & \displaystyle \hat{n}_{0}\left\{1+\frac{m}{q}\frac{\boldsymbol{b}\boldsymbol{\cdot }(\unicode[STIX]{x1D735}\times \boldsymbol{b})}{B}[\hat{u} _{0}+\tilde{C}_{\text{v}4}^{\text{lin}}(\unicode[STIX]{x1D705}_{\text{v}},\unicode[STIX]{x1D6FE})]\right\}\nonumber\\ \displaystyle & = & \displaystyle n_{0}+\frac{\boldsymbol{b}\boldsymbol{\cdot }(\unicode[STIX]{x1D735}\times \boldsymbol{b})}{B}\unicode[STIX]{x1D6FF}A_{\Vert }C_{\text{v}1}\hat{n}_{0},\end{eqnarray}$$
 $$\begin{eqnarray}\displaystyle \tilde{j}_{0\Vert }^{\text{h},\text{lin}} & = & \displaystyle q\hat{n}_{0}\bigg\{\hat{u} _{0}+\tilde{C}_{\text{v}4}^{\text{lin}}(\unicode[STIX]{x1D705}_{\text{v}},\unicode[STIX]{x1D6FE})+\frac{m}{q}\frac{\boldsymbol{b}\boldsymbol{\cdot }(\unicode[STIX]{x1D735}\times \boldsymbol{b})}{B}\left[v_{\text{th}}^{2}+\hat{u} _{0}^{2}+2\tilde{C}_{\text{v}4}^{\text{lin}}(\unicode[STIX]{x1D705}_{\text{v}},\unicode[STIX]{x1D6FE})\hat{u} _{0}\right]\!\bigg\}\nonumber\\ \displaystyle & = & \displaystyle j_{0\Vert }+\frac{q^{2}}{m}\unicode[STIX]{x1D6FF}A_{\Vert }C_{\text{v}1}n_{0}+q\frac{\boldsymbol{b}\boldsymbol{\cdot }(\unicode[STIX]{x1D735}\times \boldsymbol{b})}{B}\unicode[STIX]{x1D6FF}A_{\Vert }C_{\text{v}1}\hat{n}_{0}\hat{u} _{0},\end{eqnarray}$$
where we neglected the gyro-averaging and used (3.21), (3.23) and (D 12). We can see that new terms, which depend linearly on
 $\unicode[STIX]{x1D6FF}A_{\Vert }$
, appear. They originate from the fact that the moments of the background distribution function
$\unicode[STIX]{x1D6FF}A_{\Vert }$
, appear. They originate from the fact that the moments of the background distribution function
 $f_{0}$
have been integrated over boundaries depending linearly on
$f_{0}$
have been integrated over boundaries depending linearly on
 $\unicode[STIX]{x1D6FF}A_{\Vert }$
. As all these additional terms depend on
$\unicode[STIX]{x1D6FF}A_{\Vert }$
. As all these additional terms depend on
 $C_{\text{v}1}$
, they vanish for an infinite velocity sphere.
$C_{\text{v}1}$
, they vanish for an infinite velocity sphere.
Next, we have to linearise the zeroth and first moment, equations (4.31) and (4.32):
 $$\begin{eqnarray}\displaystyle & \displaystyle {\tilde{n}}^{\text{s},\text{lin}}={\tilde{n}}^{\text{h},\text{lin}}, & \displaystyle\end{eqnarray}$$
 $$\begin{eqnarray}\displaystyle & \displaystyle \tilde{j}_{\Vert }^{\text{s},\text{lin}}=\tilde{j}_{\Vert }^{\text{h},\text{lin}}-\frac{q^{2}}{m}\unicode[STIX]{x1D6FF}A_{\Vert }C_{\text{v}2}n_{0}, & \displaystyle\end{eqnarray}$$
where we used (4.43).
So with equations (4.35)–(4.36), (4.45)–(4.48) and (D 1) we get the corresponding relation for the first two moments of
 $\unicode[STIX]{x1D6FF}f^{\text{s}}$
:
$\unicode[STIX]{x1D6FF}f^{\text{s}}$
:
 $$\begin{eqnarray}\displaystyle & \displaystyle \unicode[STIX]{x1D6FF}{\tilde{n}}^{\text{s},\text{lin}}=\widetilde{{\mathcal{M}}}_{0}^{\text{s}}[\unicode[STIX]{x1D6FF}f^{\text{s},\text{lin}}]={\tilde{n}}^{\text{s},\text{lin}}-{\tilde{n}}_{0}^{\text{s}}=\unicode[STIX]{x1D6FF}{\tilde{n}}^{\text{h},\text{lin}}-\frac{\boldsymbol{b}\boldsymbol{\cdot }(\unicode[STIX]{x1D735}\times \boldsymbol{b})}{B}\unicode[STIX]{x1D6FF}A_{\Vert }C_{\text{v}3}\hat{n}_{0}, & \displaystyle\end{eqnarray}$$
 $$\begin{eqnarray}\displaystyle & \displaystyle \unicode[STIX]{x1D6FF}\tilde{j}_{\Vert }^{\text{s},\text{lin}}=q\widetilde{{\mathcal{M}}}_{1}^{\text{s}}[\unicode[STIX]{x1D6FF}f^{\text{s},\text{lin}}]=\tilde{j}_{\Vert }^{\text{s},\text{lin}}-\tilde{j}_{0\Vert }^{\text{s}}=\unicode[STIX]{x1D6FF}\tilde{j}_{\Vert }^{\text{h},\text{lin}}-\frac{q^{2}}{m}\unicode[STIX]{x1D6FF}A_{\Vert }C_{\text{v}3}n_{0}-q\frac{\boldsymbol{b}\boldsymbol{\cdot }(\unicode[STIX]{x1D735}\times \boldsymbol{b})}{B}\unicode[STIX]{x1D6FF}A_{\Vert }C_{\text{v}3}\hat{n}_{0}\hat{u} _{0}. & \displaystyle \nonumber\\ \displaystyle & & \displaystyle\end{eqnarray}$$
Unfortunately, it is not obvious how to generalise (4.49) and (4.50) to include the gyro-averaging. For this purpose it is much more convenient to use the linearised pull-back transformation which will be done in the next section. However, the result should be stated here (compare with (4.20) and (4.21)):
 $$\begin{eqnarray}\displaystyle \unicode[STIX]{x1D6FF}\tilde{\bar{n}}^{\text{s},\text{lin}} & = & \displaystyle \unicode[STIX]{x1D6FF}\tilde{\bar{n}}^{\text{h},\text{lin}}-\int _{p_{\text{fin}}}\frac{\boldsymbol{b}\boldsymbol{\cdot }(\unicode[STIX]{x1D735}\times \boldsymbol{b})}{B}\frac{\tilde{p}_{\Vert }(\,\tilde{p}_{\Vert }-\hat{u} _{0})}{v_{\text{th}}^{2}}f_{\text{M}}\langle \unicode[STIX]{x1D6FF}A_{\Vert }\rangle \,\unicode[STIX]{x1D6FF}(\boldsymbol{R}+\unicode[STIX]{x1D746}-\boldsymbol{x})\,B\,\text{d}\boldsymbol{R}\,\text{d}^{3}p,\quad\end{eqnarray}$$
 $$\begin{eqnarray}\displaystyle \unicode[STIX]{x1D6FF}\tilde{\bar{j}}_{\Vert }^{\text{s},\text{lin}} & = & \displaystyle \unicode[STIX]{x1D6FF}\tilde{\bar{j}}_{\Vert }^{\text{h},\text{lin}}-\frac{q^{2}}{m}\int _{p_{\text{fin}}}\frac{\tilde{p}_{\Vert }(\,\tilde{p}_{\Vert }-\hat{u} _{0})}{v_{\text{th}}^{2}}f_{\text{M}}\langle \unicode[STIX]{x1D6FF}A_{\Vert }\rangle \,\unicode[STIX]{x1D6FF}(\boldsymbol{R}+\unicode[STIX]{x1D746}-\boldsymbol{x})\,B_{\Vert }^{\ast \text{h}}\,\text{d}\boldsymbol{R}\,\text{d}^{3}p\nonumber\\ \displaystyle & & \displaystyle -\,q\int _{p_{\text{fin}}}\hat{u} _{0}\frac{\boldsymbol{b}\boldsymbol{\cdot }(\unicode[STIX]{x1D735}\times \boldsymbol{b})}{B}\frac{\tilde{p}_{\Vert }(\,\tilde{p}_{\Vert }-\hat{u} _{0})}{v_{\text{th}}^{2}}f_{\text{M}}\langle \unicode[STIX]{x1D6FF}A_{\Vert }\rangle \,\unicode[STIX]{x1D6FF}(\boldsymbol{R}+\unicode[STIX]{x1D746}-\boldsymbol{x})\,B\,\text{d}\boldsymbol{R}\,\text{d}^{3}p.\end{eqnarray}$$
And finally, our linear model equations for the quasi-neutrality condition and Ampère’s law in the Hamiltonian formulation take the following form for a finite velocity sphere (compare with (3.63) and (3.64)):
 $$\begin{eqnarray}\displaystyle & & \displaystyle -\unicode[STIX]{x1D735}\boldsymbol{\cdot }\left(\frac{q_{\text{i}}^{2}n_{0\text{i}}}{k_{\text{B}}T_{\text{i}}}\unicode[STIX]{x1D70C}_{0\text{i}}^{2}\unicode[STIX]{x1D735}_{\bot }\unicode[STIX]{x1D6FF}\unicode[STIX]{x1D719}\right)=q_{\text{i}}\unicode[STIX]{x1D6FF}\tilde{\bar{n}}_{\text{i}}^{\text{h},\text{lin}}+q_{\text{e}}\unicode[STIX]{x1D6FF}{\tilde{n}}_{\text{e}}^{\text{h},\text{lin}}\nonumber\\ \displaystyle & & \displaystyle \quad +\,q_{\text{i}}\int _{p_{\text{fin}}}\frac{\boldsymbol{b}\boldsymbol{\cdot }(\unicode[STIX]{x1D735}\times \boldsymbol{b})}{B}\left(1-\frac{\tilde{p}_{\Vert }^{2}}{v_{\text{thi}}^{2}}\right)f_{\text{Mi}}\langle \unicode[STIX]{x1D6FF}A_{\Vert }\rangle \,\unicode[STIX]{x1D6FF}(\boldsymbol{R}+\unicode[STIX]{x1D746}-\boldsymbol{x})\,B\,\text{d}\boldsymbol{R}\,\text{d}^{3}p\nonumber\\ \displaystyle & & \displaystyle \quad +\,\frac{\boldsymbol{b}\boldsymbol{\cdot }(\unicode[STIX]{x1D735}\times \boldsymbol{b})}{B}q_{\text{e}}C_{\text{v1e}}\hat{n}_{0\text{e}}\,\unicode[STIX]{x1D6FF}A_{\Vert },\end{eqnarray}$$
 $$\begin{eqnarray}\displaystyle & & \displaystyle -\unicode[STIX]{x1D735}\boldsymbol{\cdot }\unicode[STIX]{x1D735}_{\bot }\unicode[STIX]{x1D6FF}A_{\Vert }+\frac{\unicode[STIX]{x1D6FD}_{0\text{i}}}{\unicode[STIX]{x1D70C}_{0\text{i}}^{2}}\overline{\langle \unicode[STIX]{x1D6FF}A_{\Vert }\rangle }_{\text{i}}^{\text{h},\text{lin}}+C_{\text{v3e}}\frac{\unicode[STIX]{x1D6FD}_{0\text{e}}}{\unicode[STIX]{x1D70C}_{0\text{e}}^{2}}\unicode[STIX]{x1D6FF}A_{\Vert }\nonumber\\ \displaystyle & & \displaystyle \quad -\,\unicode[STIX]{x1D707}_{0}\frac{\boldsymbol{b}\boldsymbol{\cdot }(\unicode[STIX]{x1D735}\times \boldsymbol{b})}{B}q_{\text{e}}C_{\text{v1e}}\hat{n}_{0\text{e}}\hat{u} _{0\text{e}}\,\unicode[STIX]{x1D6FF}A_{\Vert }=\unicode[STIX]{x1D707}_{0}\left(\unicode[STIX]{x1D6FF}\tilde{\bar{j}}_{\Vert \text{i}}^{\text{h},\text{lin}}+\unicode[STIX]{x1D6FF}\tilde{j}_{\Vert \text{e}}^{\text{h},\text{lin}}\right),\end{eqnarray}$$
where we used (4.49)–(4.52). The significance of the correction factor
 $C_{\text{v3}}$
as part of the electron skin term was already pointed out in Mishchenko et al. (Reference Mishchenko, Hatzky and Könies2004a
).
$C_{\text{v3}}$
as part of the electron skin term was already pointed out in Mishchenko et al. (Reference Mishchenko, Hatzky and Könies2004a
).
The perturbed magnetic potential averaged with the weighting factor
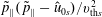 $\tilde{p}_{\Vert }(\,\tilde{p}_{\Vert }-\hat{u} _{0s})/v_{\text{th}s}^{2}$
over the gyro-phase and over the background distribution function is defined as
$\tilde{p}_{\Vert }(\,\tilde{p}_{\Vert }-\hat{u} _{0s})/v_{\text{th}s}^{2}$
over the gyro-phase and over the background distribution function is defined as
 $$\begin{eqnarray}\overline{\langle \unicode[STIX]{x1D6FF}A_{\Vert }\rangle }_{s}^{\text{h},\text{lin}}\stackrel{\text{def}}{=}\frac{1}{n_{0s}}\int _{p_{\text{fin}}}\frac{\tilde{p}_{\Vert }(\,\tilde{p}_{\Vert }-\hat{u} _{0s})}{v_{\text{th}s}^{2}}f_{\text{M}s}\langle \unicode[STIX]{x1D6FF}A_{\Vert }\rangle \,\unicode[STIX]{x1D6FF}(\boldsymbol{R}+\unicode[STIX]{x1D746}-\boldsymbol{x})\,B_{\Vert s}^{\ast \text{h}}\,\text{d}\boldsymbol{R}\,\text{d}^{3}p.\end{eqnarray}$$
Note that the averaging differs from the nonlinear case (compare with (3.62)).
For large scale modes it is usually appropriate to use a long-wavelength approximation for the first term of the second line of (4.39) and (4.53). Thus, we get for the two terms of the second and third line of (4.53):
 $$\begin{eqnarray}\unicode[STIX]{x1D735}\boldsymbol{\cdot }\left[\frac{\boldsymbol{b}\boldsymbol{\cdot }(\unicode[STIX]{x1D735}\times \boldsymbol{b})}{B}q_{\text{i}}C_{\text{v1i}}\hat{n}_{0\text{i}}\unicode[STIX]{x1D70C}_{0\text{i}}^{2}\unicode[STIX]{x1D735}_{\bot }\unicode[STIX]{x1D6FF}A_{\Vert }\right]+\frac{\boldsymbol{b}\boldsymbol{\cdot }(\unicode[STIX]{x1D735}\times \boldsymbol{b})}{B}\unicode[STIX]{x1D6FF}A_{\Vert }\mathop{\sum }_{s=\text{i},\text{e}}q_{s}C_{\text{v}1s}\hat{n}_{0s}.\end{eqnarray}$$
Furthermore, due to the quasi-neutrality condition the terms on the second line of (4.39) and on the second and third line of (4.53) would vanish if the gyro-averaging of the ions would be neglected and the velocity spheres of the ions and electrons would be of equal size, i.e.
 $C_{\text{v1i}}=C_{\text{v1e}}$
and
$C_{\text{v1i}}=C_{\text{v1e}}$
and
 $C_{\text{v}2\text{e}}=C_{\text{v2i}}$
. Therefore for large scale modes, the contribution of these terms is usually small. In addition, the terms on the second and third line of (4.53) are much smaller than the terms on the second line of (4.39) due to
$C_{\text{v}2\text{e}}=C_{\text{v2i}}$
. Therefore for large scale modes, the contribution of these terms is usually small. In addition, the terms on the second and third line of (4.53) are much smaller than the terms on the second line of (4.39) due to
 $C_{\text{v}1s}\ll C_{\text{v}2s}$
.
$C_{\text{v}1s}\ll C_{\text{v}2s}$
.
4.4 The linearised pull-back transformation of the weights
For later reference we rederive (4.49) and (4.50) using the pull-back transformation. The pull-back transformation (see also § 4.2) of the perturbation to the distribution function,
 $\unicode[STIX]{x1D6FF}f^{\text{h}}$
, is defined by (3.43). In the linear case with a shifted Maxwellian (3.10) as background
$\unicode[STIX]{x1D6FF}f^{\text{h}}$
, is defined by (3.43). In the linear case with a shifted Maxwellian (3.10) as background
 $f_{0}$
, this gives
$f_{0}$
, this gives
 $$\begin{eqnarray}\unicode[STIX]{x1D6FF}f^{\text{s},\text{lin}}(v_{\Vert })=\unicode[STIX]{x1D6FF}f^{\text{h},\text{lin}}(\,\tilde{p}_{\Vert })-\unicode[STIX]{x1D6FF}f^{\text{ad}}(\,\tilde{p}_{\Vert }),\end{eqnarray}$$
where we have introduced the so-called ‘adiabatic part’ of the perturbation to the distribution function in the Hamiltonian formulation:
 $$\begin{eqnarray}\unicode[STIX]{x1D6FF}f^{\text{ad}}(\,\tilde{p}_{\Vert })\stackrel{\text{def}}{=}-\frac{q}{m}\langle \unicode[STIX]{x1D6FF}A_{\Vert }\rangle \left.\frac{\unicode[STIX]{x2202}f_{0}}{\unicode[STIX]{x2202}v_{\Vert }}\right|_{v_{\Vert }=\tilde{p}_{\Vert }}=\frac{q}{m}\langle \unicode[STIX]{x1D6FF}A_{\Vert }\rangle \frac{\tilde{p}_{\Vert }-\hat{u} _{0}}{v_{\text{th}}^{2}}f_{\text{M}}.\end{eqnarray}$$
The corresponding pull-back transformation of the perturbed weights is (see (3.49))
 $$\begin{eqnarray}\unicode[STIX]{x1D6FF}w^{\text{s,lin}}(v_{\Vert })=\unicode[STIX]{x1D6FF}w^{\text{h},\text{lin}}(\,\tilde{p}_{\Vert })-\unicode[STIX]{x1D6FF}w^{\text{ad}}(\,\tilde{p}_{\Vert }),\end{eqnarray}$$
where we have introduced the so-called ‘adiabatic weight’
 $$\begin{eqnarray}\unicode[STIX]{x1D6FF}w^{\text{ad}}(\,\tilde{p}_{\Vert })\stackrel{\text{def}}{=}\frac{\unicode[STIX]{x1D6FF}f^{\text{ad}}(\,\tilde{p}_{\Vert })}{g(\,\tilde{p}_{\Vert })}.\end{eqnarray}$$
Again, we neglect the gyro-averaging to make the derivation not unnecessarily cumbersome. The first two moments of the adiabatic part are:
 $$\begin{eqnarray}\displaystyle \unicode[STIX]{x1D6FF}{\tilde{n}}^{\text{ad}} & = & \displaystyle \widetilde{{\mathcal{M}}}_{0}^{\text{h}}[\unicode[STIX]{x1D6FF}f^{\text{ad}}]=-\frac{q}{m}\unicode[STIX]{x1D6FF}A_{\Vert }\int _{p_{\text{fin}}}\left.\frac{\unicode[STIX]{x2202}f_{\text{M}}}{\unicode[STIX]{x2202}v_{\Vert }}\right|_{v_{\Vert }=\tilde{p}_{\Vert }}B_{\Vert }^{\ast \text{h}}\,\text{d}^{3}p\nonumber\\ \displaystyle & = & \displaystyle -\frac{q}{m}\unicode[STIX]{x1D6FF}A_{\Vert }\int _{p_{\text{fin}}}\left(\left.\frac{\unicode[STIX]{x2202}f_{\text{M}}}{\unicode[STIX]{x2202}v_{\Vert }}\right|_{v_{\Vert }=\tilde{p}_{\Vert }}+\frac{m}{q}\frac{\boldsymbol{b}\boldsymbol{\cdot }(\unicode[STIX]{x1D735}\times \boldsymbol{b})}{B}\tilde{p}_{\Vert }\left.\frac{\unicode[STIX]{x2202}f_{\text{M}}}{\unicode[STIX]{x2202}v_{\Vert }}\right|_{v_{\Vert }=\tilde{p}_{\Vert }}\right)B\,\text{d}^{3}p\nonumber\\ \displaystyle & = & \displaystyle \frac{\boldsymbol{b}\boldsymbol{\cdot }(\unicode[STIX]{x1D735}\times \boldsymbol{b})}{B}\unicode[STIX]{x1D6FF}A_{\Vert }C_{\text{v}3}\hat{n}_{0},\end{eqnarray}$$
 $$\begin{eqnarray}\displaystyle \unicode[STIX]{x1D6FF}\tilde{j}_{\Vert }^{\text{ad}} & = & \displaystyle q\widetilde{{\mathcal{M}}}_{1}^{\text{h}}[\unicode[STIX]{x1D6FF}f^{\text{ad}}]=-\frac{q^{2}}{m}\unicode[STIX]{x1D6FF}A_{\Vert }\int _{p_{\text{fin}}}\tilde{p}_{\Vert }\left.\frac{\unicode[STIX]{x2202}f_{\text{M}}}{\unicode[STIX]{x2202}v_{\Vert }}\right|_{v_{\Vert }=\tilde{p}_{\Vert }}B_{\Vert }^{\ast \text{h}}\,\text{d}^{3}p\nonumber\\ \displaystyle & = & \displaystyle -\frac{q^{2}}{m}\unicode[STIX]{x1D6FF}A_{\Vert }\int _{p_{\text{fin}}}\left(\tilde{p}_{\Vert }\left.\frac{\unicode[STIX]{x2202}f_{\text{M}}}{\unicode[STIX]{x2202}v_{\Vert }}\right|_{v_{\Vert }=\tilde{p}_{\Vert }}+\frac{m}{q}\frac{\boldsymbol{b}\boldsymbol{\cdot }(\unicode[STIX]{x1D735}\times \boldsymbol{b})}{B}\tilde{p}_{\Vert }^{2}\left.\frac{\unicode[STIX]{x2202}f_{\text{M}}}{\unicode[STIX]{x2202}v_{\Vert }}\right|_{v_{\Vert }=\tilde{p}_{\Vert }}\right)B\,\text{d}^{3}p\nonumber\\ \displaystyle & = & \displaystyle \frac{q^{2}}{m}\unicode[STIX]{x1D6FF}A_{\Vert }C_{\text{v3}}n_{0}+q\frac{\boldsymbol{b}\boldsymbol{\cdot }(\unicode[STIX]{x1D735}\times \boldsymbol{b})}{B}\unicode[STIX]{x1D6FF}A_{\Vert }C_{\text{v3}}\hat{n}_{0}\hat{u} _{0},\end{eqnarray}$$
where we used (3.21). As expected, this leads to the same result as (4.49) and (4.50):
 $$\begin{eqnarray}\displaystyle & \displaystyle \unicode[STIX]{x1D6FF}{\tilde{n}}^{\text{s},\text{lin}}=\unicode[STIX]{x1D6FF}{\tilde{n}}^{\text{h},\text{lin}}-\unicode[STIX]{x1D6FF}{\tilde{n}}^{\text{ad}}, & \displaystyle\end{eqnarray}$$
 $$\begin{eqnarray}\displaystyle & \displaystyle \unicode[STIX]{x1D6FF}\tilde{j}_{\Vert }^{\text{s},\text{lin}}=\unicode[STIX]{x1D6FF}\tilde{j}_{\Vert }^{\text{h},\text{lin}}-\unicode[STIX]{x1D6FF}\tilde{j}_{\Vert }^{\text{ad}}. & \displaystyle\end{eqnarray}$$
Taking the gyro-averaging into account (4.61) and (4.62) can be generalised:
 $$\begin{eqnarray}\displaystyle \unicode[STIX]{x1D6FF}\tilde{\bar{n}}^{\text{ad}} & = & \displaystyle \int _{p_{\text{fin}}}\frac{\boldsymbol{b}\boldsymbol{\cdot }(\unicode[STIX]{x1D735}\times \boldsymbol{b})}{B}\frac{\tilde{p}_{\Vert }(\,\tilde{p}_{\Vert }-\hat{u} _{0})}{v_{\text{th}}^{2}}f_{\text{M}}\langle \unicode[STIX]{x1D6FF}A_{\Vert }\rangle \,\unicode[STIX]{x1D6FF}(\boldsymbol{R}+\unicode[STIX]{x1D746}-\boldsymbol{x})\,B\,\text{d}\boldsymbol{R}\,\text{d}^{3}p,\end{eqnarray}$$
 $$\begin{eqnarray}\displaystyle \unicode[STIX]{x1D6FF}\tilde{\bar{j}}_{\Vert }^{\text{ad}} & = & \displaystyle \frac{q^{2}}{m}\int _{p_{\text{fin}}}\frac{\tilde{p}_{\Vert }(\,\tilde{p}_{\Vert }-\hat{u} _{0})}{v_{\text{th}}^{2}}f_{\text{M}}\langle \unicode[STIX]{x1D6FF}A_{\Vert }\rangle \,\unicode[STIX]{x1D6FF}(\boldsymbol{R}+\unicode[STIX]{x1D746}-\boldsymbol{x})\,B_{\Vert }^{\ast \text{h}}\,\text{d}\boldsymbol{R}\,\text{d}^{3}p\nonumber\\ \displaystyle & & \displaystyle +\,q\int _{p_{\text{fin}}}\hat{u} _{0}\frac{\boldsymbol{b}\boldsymbol{\cdot }(\unicode[STIX]{x1D735}\times \boldsymbol{b})}{B}\frac{\tilde{p}_{\Vert }(\,\tilde{p}_{\Vert }-\hat{u} _{0})}{v_{\text{th}}^{2}}f_{\text{M}}\langle \unicode[STIX]{x1D6FF}A_{\Vert }\rangle \,\unicode[STIX]{x1D6FF}(\boldsymbol{R}+\unicode[STIX]{x1D746}-\boldsymbol{x})\,B\,\text{d}\boldsymbol{R}\,\text{d}^{3}p.\end{eqnarray}$$
4.5 Marker representation of the symplectic moments
For our PIC algorithm we need the moments in the symplectic formulation to be discretised by the weights (we neglect gyro-averaging):
 $$\begin{eqnarray}{\mathcal{M}}_{k}^{\text{s}}[f^{\text{s}}]=\int v_{\Vert }^{k}\frac{f^{\text{s}}}{g^{\text{s}}}\,g^{\text{s}}B_{\Vert }^{\ast \text{s}}\,\text{d}^{3}v\simeq \frac{1}{N_{\text{p}}}\mathop{\sum }_{p=1}^{N_{\text{p}}}v_{\Vert p}^{k}w_{p}^{\text{s}}(v_{\Vert p}).\end{eqnarray}$$
Taking the coordinate transformation (3.28) and the invariance of the weights, equation (3.36), into account this can be rewritten as
 $$\begin{eqnarray}{\mathcal{M}}_{k}^{\text{s}}[f^{\text{s}}]\simeq \frac{1}{N_{\text{p}}}\mathop{\sum }_{p=1}^{N_{\text{p}}}\left(\,\tilde{p}_{\Vert p}-\frac{q}{m}\unicode[STIX]{x1D6FF}A_{\Vert p}\right)^{k}w_{p}^{\text{h}}(\,\tilde{p}_{\Vert p}).\end{eqnarray}$$
For simplicity we have neglected the spatial binning of the weights by a test or shape function, respectively (see § 7.1). This would be needed to resolve the spatial dependency of the moments by a Monte Carlo approach.
The first moment contains an extra term depending on
 $\unicode[STIX]{x1D6FF}A_{\Vert }$
which is the so-called ‘skin term’:
$\unicode[STIX]{x1D6FF}A_{\Vert }$
which is the so-called ‘skin term’:
 $$\begin{eqnarray}{\mathcal{M}}_{1}^{\text{s}}[f^{\text{s}}]\simeq \frac{1}{N_{\text{p}}}\mathop{\sum }_{p=1}^{N_{\text{p}}}\left[\tilde{p}_{\Vert p}w_{p}^{\text{h}}(\,\tilde{p}_{\Vert p})-\frac{q}{m}\unicode[STIX]{x1D6FF}A_{\Vert p}w_{p}^{\text{h}}(\,\tilde{p}_{\Vert p})\right]=\frac{1}{N_{\text{p}}}\mathop{\sum }_{p=1}^{N_{\text{p}}}\left(\tilde{p}_{\Vert p}-\frac{q}{m}\unicode[STIX]{x1D6FF}A_{\Vert p}\right)w_{p}^{\text{h}}(\,\tilde{p}_{\Vert p}).\end{eqnarray}$$
This equation is of key importance. It shows that two terms with relatively large statistical errors are highly statistically correlated so that the error of their difference is smaller. We can speak about a cancellation of statistical error. Thus, the purpose of the skin term is twofold: it is needed to keep the first moment invariant under the coordinate transformation (3.28) and in its marker representation to cancel statistical error.
For simplicity we assume an infinite velocity sphere and choose the background to be a shifted Maxwellian (3.10), i.e.
 $f_{0}=f_{\text{M}}$
. In addition, we use the
$f_{0}=f_{\text{M}}$
. In addition, we use the
 $\unicode[STIX]{x1D6FF}f$
-ansatz to diminish the statistical error of the first moment (compare with (4.17)):
$\unicode[STIX]{x1D6FF}f$
-ansatz to diminish the statistical error of the first moment (compare with (4.17)):
 $$\begin{eqnarray}q{\mathcal{M}}_{1}^{\text{s}}[f^{\text{s}}]\simeq j_{0\Vert }-\frac{q^{2}}{m}\unicode[STIX]{x1D6FF}A_{\Vert }n_{0}+\frac{q}{N_{\text{p}}}\mathop{\sum }_{p=1}^{N_{\text{p}}}\left[\tilde{p}_{\Vert p}\unicode[STIX]{x1D6FF}w_{p}^{\text{h}}(\,\tilde{p}_{\Vert p})-\frac{q}{m}\unicode[STIX]{x1D6FF}A_{\Vert p}\unicode[STIX]{x1D6FF}w_{p}^{\text{h}}(\,\tilde{p}_{\Vert p})\right].\end{eqnarray}$$
On the one hand, the statistical error is reduced by separating the background current
 $j_{0\Vert }$
as an analytic expression but, on the other hand, the cancellation of statistical noise by the now analytic background part of the skin term (second term on the right-hand side) is excluded. So the
$j_{0\Vert }$
as an analytic expression but, on the other hand, the cancellation of statistical noise by the now analytic background part of the skin term (second term on the right-hand side) is excluded. So the
 $\unicode[STIX]{x1D6FF}f$
-ansatz is not fully compatible with the cancellation of the statistical error of the skin term (see § 3.2.1). This is the key problem of the Hamiltonian formulation.
$\unicode[STIX]{x1D6FF}f$
-ansatz is not fully compatible with the cancellation of the statistical error of the skin term (see § 3.2.1). This is the key problem of the Hamiltonian formulation.
The linearised form of (4.70) neglects the nonlinear skin term (last term on the right-hand side):
 $$\begin{eqnarray}q{\mathcal{M}}_{1}^{\text{s},\text{lin}}[f^{\text{s}}]\simeq j_{0\Vert }-\frac{q^{2}}{m}\unicode[STIX]{x1D6FF}A_{\Vert }n_{0}+\frac{q}{N_{\text{p}}}\mathop{\sum }_{p=1}^{N_{\text{p}}}\tilde{p}_{\Vert p}\,\unicode[STIX]{x1D6FF}w_{p}^{\text{h}}(\,\tilde{p}_{\Vert p})\end{eqnarray}$$
and should be only used in linearised PIC simulations.
4.6 Statistical error of the moments of the distribution function
In this section, we will focus again on the statistical error when evaluating the first two moments of the perturbation to the distribution function,
 $\unicode[STIX]{x1D6FF}f^{\text{h}}$
. In the following, we want to calculate approximately the statistical error of both moments if there would be just the adiabatic part of the distribution function. To make the calculation simpler we approximate
$\unicode[STIX]{x1D6FF}f^{\text{h}}$
. In the following, we want to calculate approximately the statistical error of both moments if there would be just the adiabatic part of the distribution function. To make the calculation simpler we approximate
 $B_{\Vert }^{\ast \text{h}}\simeq B$
and neglect the gyro-averaging. Relying on the definitions given in § 2, the integration is performed just over velocity space (using
$B_{\Vert }^{\ast \text{h}}\simeq B$
and neglect the gyro-averaging. Relying on the definitions given in § 2, the integration is performed just over velocity space (using
 ${\mathcal{J}}_{p}\,\text{d}^{3}p\simeq B\,\text{d}\tilde{p}_{\Vert }\,\text{d}\tilde{\unicode[STIX]{x1D707}}\,\text{d}\unicode[STIX]{x1D6FC}$
) and can be formulated as calculating an expected value with respect to the marker probability density
${\mathcal{J}}_{p}\,\text{d}^{3}p\simeq B\,\text{d}\tilde{p}_{\Vert }\,\text{d}\tilde{\unicode[STIX]{x1D707}}\,\text{d}\unicode[STIX]{x1D6FC}$
) and can be formulated as calculating an expected value with respect to the marker probability density
 $g_{\text{M}s}$
simplified by
$g_{\text{M}s}$
simplified by
 $$\begin{eqnarray}g_{\text{M}s}=\frac{f_{\text{M}s}}{n_{0s}}.\end{eqnarray}$$
Thus, the expected value of the adiabatic density is
 $$\begin{eqnarray}\unicode[STIX]{x1D6FF}n_{s}^{\text{ad}}=\text{E}_{g_{\text{M}}}[\unicode[STIX]{x1D6FF}Y_{\text{n}s}^{\text{ad}}]=\int \unicode[STIX]{x1D6FF}Y_{\text{n}s}^{\text{ad}}\,g_{\text{M}s}{\mathcal{J}}_{p}\,\text{d}^{3}p=0,\end{eqnarray}$$
where
 $$\begin{eqnarray}\unicode[STIX]{x1D6FF}Y_{\text{n}s}^{\text{ad}}\stackrel{\text{def}}{=}\frac{q_{s}n_{0s}\unicode[STIX]{x1D6FF}A_{\Vert }}{k_{\text{B}}T_{s}}(\,\tilde{p}_{\Vert }-\hat{u} _{0s}).\end{eqnarray}$$
The variance is given by (see (2.4)):
 $$\begin{eqnarray}\text{Var}_{g_{\text{M}}}[\unicode[STIX]{x1D6FF}Y_{\text{n}s}^{\text{ad}}]=\int (\unicode[STIX]{x1D6FF}Y_{\text{n}s}^{\text{ad}}-\text{E}_{g_{\text{M}}}[\unicode[STIX]{x1D6FF}Y_{\text{n}s}^{\text{ad}}])^{2}\,g_{\text{M}s}{\mathcal{J}}_{p}\,\text{d}^{3}p=\int (\unicode[STIX]{x1D6FF}Y_{\text{n}s}^{\text{ad}})^{2}\,g_{\text{M}s}{\mathcal{J}}_{p}\,\text{d}^{3}p.\end{eqnarray}$$
The variance and thus the standard deviation follows directly as
 $$\begin{eqnarray}\unicode[STIX]{x1D700}_{\text{n}}^{\text{ad}}\propto \unicode[STIX]{x1D70E}_{\text{n}}^{\text{ad}}=\sqrt{\mathop{\sum }_{s=\text{i},\text{e}}\text{Var}_{g_{\text{M}}}[\unicode[STIX]{x1D6FF}Y_{\text{n}s}^{\text{ad}}]}=\unicode[STIX]{x1D6FF}A_{\Vert }\sqrt{\mathop{\sum }_{s=\text{i},\text{e}}\left(\frac{q_{s}n_{0s}}{\sqrt{m_{s}k_{\text{B}}T_{s}}}\right)^{2}}.\end{eqnarray}$$
This means, although the expected value of the adiabatic density is zero, there is a total statistical error
 $\unicode[STIX]{x1D700}_{\text{n}}^{\text{ad}}$
which can be quantified.
$\unicode[STIX]{x1D700}_{\text{n}}^{\text{ad}}$
which can be quantified.
In a similar way the expected value of the adiabatic current can be formulated with a redefined random variable
 $$\begin{eqnarray}\unicode[STIX]{x1D6FF}j_{\Vert s}^{\text{ad}}=\text{E}_{g_{\text{M}}}[\unicode[STIX]{x1D6FF}Y_{\text{j}s}^{\text{ad}}]=\int \unicode[STIX]{x1D6FF}Y_{\text{j}s}^{\text{ad}}\,g_{\text{M}s}{\mathcal{J}}_{p}\,\text{d}^{3}p=\frac{q_{s}^{2}n_{0s}\unicode[STIX]{x1D6FF}A_{\Vert }}{m_{s}},\end{eqnarray}$$
where
 $$\begin{eqnarray}\unicode[STIX]{x1D6FF}Y_{\text{j}s}^{\text{ad}}\stackrel{\text{def}}{=}\frac{q_{s}^{2}n_{0s}\unicode[STIX]{x1D6FF}A_{\Vert }}{k_{\text{B}}T_{s}}\tilde{p}_{\Vert }(\,\tilde{p}_{\Vert }-\hat{u} _{0s}).\end{eqnarray}$$
Since the expected value does not vanish this time, it gives a contribution to the variance:
 $$\begin{eqnarray}\unicode[STIX]{x1D700}_{\text{j}}^{\text{ad}}\propto \unicode[STIX]{x1D70E}_{\text{j}}^{\text{ad}}=\sqrt{\mathop{\sum }_{s=\text{i},\text{e}}\text{Var}_{g_{\text{M}}}[\unicode[STIX]{x1D6FF}Y_{\text{j}s}^{\text{ad}}]}=\unicode[STIX]{x1D6FF}A_{\Vert }\sqrt{\mathop{\sum }_{s=\text{i},\text{e}}\left[2+\left(\frac{\hat{u} _{0s}}{v_{\text{th}s}}\right)^{2}\right]\left(\frac{q_{s}^{2}n_{0s}}{m_{s}}\right)^{2}}.\end{eqnarray}$$
From a comparison of (4.76) and (4.79) it follows that the total statistical errors are both proportional to
 $\unicode[STIX]{x1D6FF}A_{\Vert }$
and thus the relative errors are independent of
$\unicode[STIX]{x1D6FF}A_{\Vert }$
and thus the relative errors are independent of
 $\unicode[STIX]{x1D6FF}A_{\Vert }$
. However, there are also differences. The dependence of the errors
$\unicode[STIX]{x1D6FF}A_{\Vert }$
. However, there are also differences. The dependence of the errors
 $\unicode[STIX]{x1D700}_{\text{n}s}^{\text{ad}}$
and
$\unicode[STIX]{x1D700}_{\text{n}s}^{\text{ad}}$
and
 $\unicode[STIX]{x1D700}_{\text{j}s}^{\text{ad}}$
on the temperature profile is as follows: there is a dependence for
$\unicode[STIX]{x1D700}_{\text{j}s}^{\text{ad}}$
on the temperature profile is as follows: there is a dependence for
 $\unicode[STIX]{x1D700}_{\text{n}s}^{\text{ad}}$
, there is no dependence for
$\unicode[STIX]{x1D700}_{\text{n}s}^{\text{ad}}$
, there is no dependence for
 $\unicode[STIX]{x1D700}_{\text{j}s}^{\text{ad}}$
as long as
$\unicode[STIX]{x1D700}_{\text{j}s}^{\text{ad}}$
as long as
 $\hat{u} _{0s}=0$
and there is only a weak dependence for
$\hat{u} _{0s}=0$
and there is only a weak dependence for
 $\unicode[STIX]{x1D700}_{\text{j}s}^{\text{ad}}$
as soon as
$\unicode[STIX]{x1D700}_{\text{j}s}^{\text{ad}}$
as soon as
 $\hat{u} _{0s}\neq 0$
(note that
$\hat{u} _{0s}\neq 0$
(note that
 $\hat{u} _{0s}\ll v_{\text{th}s}$
). In addition, the dependence on the mass ratio is less distinct for the error
$\hat{u} _{0s}\ll v_{\text{th}s}$
). In addition, the dependence on the mass ratio is less distinct for the error
 $\unicode[STIX]{x1D700}_{\text{n}s}^{\text{ad}}$
compared to
$\unicode[STIX]{x1D700}_{\text{n}s}^{\text{ad}}$
compared to
 $\unicode[STIX]{x1D700}_{\text{j}s}^{\text{ad}}$
. The latter has the consequence, that the contribution of the ions to the total error is larger for the density moment (
$\unicode[STIX]{x1D700}_{\text{j}s}^{\text{ad}}$
. The latter has the consequence, that the contribution of the ions to the total error is larger for the density moment (
 $\unicode[STIX]{x1D700}_{\text{ni}}^{\text{ad}}/\unicode[STIX]{x1D700}_{\text{ne}}^{\text{ad}}\propto \sqrt{m_{\text{e}}/m_{\text{i}}}$
) than for the current moment (
$\unicode[STIX]{x1D700}_{\text{ni}}^{\text{ad}}/\unicode[STIX]{x1D700}_{\text{ne}}^{\text{ad}}\propto \sqrt{m_{\text{e}}/m_{\text{i}}}$
) than for the current moment (
 $\unicode[STIX]{x1D700}_{\text{ji}}^{\text{ad}}/\unicode[STIX]{x1D700}_{\text{je}}^{\text{ad}}\propto m_{\text{e}}/m_{\text{i}}$
). Hence, the need for variance reduction of the ion contribution is more important for the evaluation of the density moment as for the current moment.
$\unicode[STIX]{x1D700}_{\text{ji}}^{\text{ad}}/\unicode[STIX]{x1D700}_{\text{je}}^{\text{ad}}\propto m_{\text{e}}/m_{\text{i}}$
). Hence, the need for variance reduction of the ion contribution is more important for the evaluation of the density moment as for the current moment.
For an arbitrary marker distribution function
 $g(\boldsymbol{z})$
we can evaluate the variance of the Hamiltonian distribution function by using the unbiased estimator of the variance from (2.6). Especially for diagnostic purpose (see figure 2), we can derive the error of the total particle number
$g(\boldsymbol{z})$
we can evaluate the variance of the Hamiltonian distribution function by using the unbiased estimator of the variance from (2.6). Especially for diagnostic purpose (see figure 2), we can derive the error of the total particle number
 $$\begin{eqnarray}\unicode[STIX]{x1D700}_{\text{n}_{\text{tot}}}\propto \unicode[STIX]{x1D70E}_{\text{n}_{\text{tot}}}=\sqrt{\mathop{\sum }_{s=\text{i},\text{e}}\frac{1}{N_{\text{p}s}-1}\left[\mathop{\sum }_{p=1}^{N_{\text{p}s}}(\unicode[STIX]{x1D6FF}w_{s,p})^{2}-\frac{1}{N_{\text{p}s}}\left(\mathop{\sum }_{p=1}^{N_{\text{p}s}}\unicode[STIX]{x1D6FF}w_{s,p}\right)^{2}\right]}\end{eqnarray}$$
and the error of the total current
 $$\begin{eqnarray}\unicode[STIX]{x1D700}_{\text{j}_{\text{tot}}}\propto \unicode[STIX]{x1D70E}_{\text{j}_{\text{tot}}}=\sqrt{\mathop{\sum }_{s=\text{i},\text{e}}\frac{q_{s}^{2}}{N_{\text{p}s}-1}\left[\mathop{\sum }_{p=1}^{N_{\text{p}s}}(\tilde{p}_{\Vert }\unicode[STIX]{x1D6FF}w_{s,p})^{2}-\frac{1}{N_{\text{p}s}}\left(\mathop{\sum }_{p=1}^{N_{\text{p}s}}\tilde{p}_{\Vert }\unicode[STIX]{x1D6FF}w_{s,p}\right)^{2}\right]}.\end{eqnarray}$$
4.7 The cancellation problem
In the previous section, we have seen that the adiabatic part of the perturbation to the distribution function,
 $\unicode[STIX]{x1D6FF}f^{\text{h}}$
, contributes to the statistical error in both the evaluation of the particle and current number density. In some simulations, the statistical error becomes the dominant part of the perturbation to the distribution function. This was pointed out by Hatzky et al. (Reference Hatzky, Könies and Mishchenko2007) and the term ‘inaccuracy problem’ was coined. However, historically the problem was seen more restricted as the so-called ‘problem of inexact cancellation’ or ‘cancellation problem’ in Ampère’s law (Chen & Parker Reference Chen and Parker2003). It was not realised that the problem was of more general nature and also affecting the evaluation of the quasi-neutrality equation. Although the inaccuracy problem should be discussed in terms of statistical error, the understanding of the cancellation problem gives a qualitative measure of the ratio between the adiabatic and non-adiabatic part of the current. And at least in case of a Maxwellian marker loading, the adiabatic part of the current for a given species is proportional to its statistical error (see (4.79)).
$\unicode[STIX]{x1D6FF}f^{\text{h}}$
, contributes to the statistical error in both the evaluation of the particle and current number density. In some simulations, the statistical error becomes the dominant part of the perturbation to the distribution function. This was pointed out by Hatzky et al. (Reference Hatzky, Könies and Mishchenko2007) and the term ‘inaccuracy problem’ was coined. However, historically the problem was seen more restricted as the so-called ‘problem of inexact cancellation’ or ‘cancellation problem’ in Ampère’s law (Chen & Parker Reference Chen and Parker2003). It was not realised that the problem was of more general nature and also affecting the evaluation of the quasi-neutrality equation. Although the inaccuracy problem should be discussed in terms of statistical error, the understanding of the cancellation problem gives a qualitative measure of the ratio between the adiabatic and non-adiabatic part of the current. And at least in case of a Maxwellian marker loading, the adiabatic part of the current for a given species is proportional to its statistical error (see (4.79)).
If we approximate
 $B_{\Vert }^{\ast \text{h}}\simeq B$
and
$B_{\Vert }^{\ast \text{h}}\simeq B$
and
 $C_{\text{v}3}=1$
, the linearised skin term is proportional to the adiabatic current term (see (4.62)):
$C_{\text{v}3}=1$
, the linearised skin term is proportional to the adiabatic current term (see (4.62)):
 $$\begin{eqnarray}\frac{\unicode[STIX]{x1D6FD}_{0}}{\unicode[STIX]{x1D70C}_{0}^{2}}\overline{\langle \unicode[STIX]{x1D6FF}A_{\Vert }\rangle }^{\text{h},\text{lin}}=\frac{\unicode[STIX]{x1D707}_{0}q^{2}n_{0}}{m}\overline{\langle \unicode[STIX]{x1D6FF}A_{\Vert }\rangle }^{\text{h},\text{lin}}\simeq \unicode[STIX]{x1D707}_{0}\unicode[STIX]{x1D6FF}\bar{j}_{\Vert }^{\text{ad}}.\end{eqnarray}$$
So the skin terms cancel the adiabatic current terms, and Ampère’s law (3.64) in the Hamiltonian formulation simplifies to the form
 $$\begin{eqnarray}-\unicode[STIX]{x1D735}\boldsymbol{\cdot }\unicode[STIX]{x1D735}_{\bot }\unicode[STIX]{x1D6FF}A_{\Vert }\simeq \unicode[STIX]{x1D707}_{0}\left(\unicode[STIX]{x1D6FF}\bar{j}_{\Vert \text{i}}^{\text{nonad}}+\unicode[STIX]{x1D6FF}j_{\Vert \text{e}}^{\text{nonad}}\right),\end{eqnarray}$$
where the splitting
 $\unicode[STIX]{x1D6FF}\bar{j}_{\Vert }=\unicode[STIX]{x1D6FF}\bar{j}_{\Vert }^{\text{ad}}+\unicode[STIX]{x1D6FF}\bar{j}_{\Vert }^{\text{nonad}}$
was used. Note that in the Hamiltonian formulation the weights express the time evolution of both the adiabatic and non-adiabatic part of the distribution function, which is the reason why we need e.g. the control variates method to separate both parts.
$\unicode[STIX]{x1D6FF}\bar{j}_{\Vert }=\unicode[STIX]{x1D6FF}\bar{j}_{\Vert }^{\text{ad}}+\unicode[STIX]{x1D6FF}\bar{j}_{\Vert }^{\text{nonad}}$
was used. Note that in the Hamiltonian formulation the weights express the time evolution of both the adiabatic and non-adiabatic part of the distribution function, which is the reason why we need e.g. the control variates method to separate both parts.
Applying the long-wavelength approximation and neglecting the finite gyroradius effects for the electrons, we compare now
 $\unicode[STIX]{x1D6FF}j_{\Vert }^{\text{ad}}$
to
$\unicode[STIX]{x1D6FF}j_{\Vert }^{\text{ad}}$
to
 $\unicode[STIX]{x1D6FF}j_{\Vert }^{\text{nonad}}$
:
$\unicode[STIX]{x1D6FF}j_{\Vert }^{\text{nonad}}$
:
 $$\begin{eqnarray}\frac{\unicode[STIX]{x1D6FF}\bar{j}_{\Vert \text{i}}^{\text{ad}}+\unicode[STIX]{x1D6FF}j_{\Vert \text{e}}^{\text{ad}}}{\unicode[STIX]{x1D6FF}\bar{j}_{\Vert \text{i}}^{\text{nonad}}+\unicode[STIX]{x1D6FF}j_{\Vert \text{e}}^{\text{nonad}}}\stackrel{m_{\text{i}}\gg m_{\text{e}}}{{\approx}}\frac{\unicode[STIX]{x1D6FF}j_{\Vert \text{e}}^{\text{ad}}}{\unicode[STIX]{x1D6FF}\bar{j}_{\Vert \text{i}}^{\text{nonad}}+\unicode[STIX]{x1D6FF}j_{\Vert \text{e}}^{\text{nonad}}}\stackrel{\unicode[STIX]{x1D6FD}_{0\text{i}}\ll 1}{{\approx}}\frac{\unicode[STIX]{x1D707}_{0}q_{\text{e}}^{2}n_{0\text{e}}\unicode[STIX]{x1D6FF}A_{\Vert }}{m_{\text{e}}\unicode[STIX]{x1D6FB}_{\bot }^{2}\unicode[STIX]{x1D6FF}A_{\Vert }}\stackrel{\text{cylinder}}{=}\frac{\unicode[STIX]{x1D707}_{0}q_{\text{e}}^{2}n_{0\text{e}}}{m_{\text{e}}k_{\bot }^{2}}.\end{eqnarray}$$
The ratio scales with
 $n_{0}$
but the non-adiabatic part can become quite small depending on
$n_{0}$
but the non-adiabatic part can become quite small depending on
 $$\begin{eqnarray}k_{\bot }^{2}=k_{r}^{2}+k_{\unicode[STIX]{x1D717}}^{2}=\left\{\begin{array}{@{}ll@{}}\left({\displaystyle \frac{\unicode[STIX]{x03C0}}{2a}}\right)^{2}\quad \quad & \text{for }m=0\\ \frac{\unicode[STIX]{x03C0}^{2}+\left({\displaystyle \frac{m}{r/a}}\right)^{2}}{a^{2}}\quad \quad & \text{for }m\neq 0,\end{array}\right.\end{eqnarray}$$
where
 $m$
is the poloidal mode number and
$m$
is the poloidal mode number and
 $a$
the minor radius. We have assumed the minimal value of
$a$
the minor radius. We have assumed the minimal value of
 $k_{\bot }$
within a cylinder, giving
$k_{\bot }$
within a cylinder, giving
 $k_{r}=\unicode[STIX]{x03C0}/(2a)$
for
$k_{r}=\unicode[STIX]{x03C0}/(2a)$
for
 $m=0$
and
$m=0$
and
 $k_{r}=\unicode[STIX]{x03C0}/a$
for
$k_{r}=\unicode[STIX]{x03C0}/a$
for
 $m\neq 0$
. It is obvious that
$m\neq 0$
. It is obvious that
 $k_{\bot }^{2}$
scales with
$k_{\bot }^{2}$
scales with
 $\propto 1/a^{2}$
, i.e. for larger minor radii the non-adiabatic part becomes very small. Especially in the MHD limit
$\propto 1/a^{2}$
, i.e. for larger minor radii the non-adiabatic part becomes very small. Especially in the MHD limit
 $k_{\bot }\unicode[STIX]{x1D70C}\rightarrow 0$
the non-adiabatic part becomes arbitrarily small, which makes it so hard to simulate MHD modes within the gyrokinetic model. In such a case, the non-adiabatic part, the signal, is quite small compared to the adiabatic part which gives no contribution to the evaluation of
$k_{\bot }\unicode[STIX]{x1D70C}\rightarrow 0$
the non-adiabatic part becomes arbitrarily small, which makes it so hard to simulate MHD modes within the gyrokinetic model. In such a case, the non-adiabatic part, the signal, is quite small compared to the adiabatic part which gives no contribution to the evaluation of
 $\unicode[STIX]{x1D6FF}A_{\Vert }$
in Ampère’s law as it cancels on both sides. Nevertheless, it produces a statistical error, the noise, as we have seen in the previous section. Hence, one can speak about a problem of inexact cancellation as the noise remains.
$\unicode[STIX]{x1D6FF}A_{\Vert }$
in Ampère’s law as it cancels on both sides. Nevertheless, it produces a statistical error, the noise, as we have seen in the previous section. Hence, one can speak about a problem of inexact cancellation as the noise remains.
A simulation of a shear Alfvén wave in a slab using exclusively electrons. (a,b) The standard deviation of the total particle number
 $\unicode[STIX]{x1D70E}_{\text{n}_{\text{tot}}}$
and the standard deviation of the total current
$\unicode[STIX]{x1D70E}_{\text{n}_{\text{tot}}}$
and the standard deviation of the total current
 $\unicode[STIX]{x1D70E}_{\text{j}_{\Vert \text{tot}}}$
as a function of time. The standard deviation of the perturbed electron markers in the Hamiltonian formulation (dashed red line) and in the symplectic formulation (solid blue line). The simulation has been performed with
$\unicode[STIX]{x1D70E}_{\text{j}_{\Vert \text{tot}}}$
as a function of time. The standard deviation of the perturbed electron markers in the Hamiltonian formulation (dashed red line) and in the symplectic formulation (solid blue line). The simulation has been performed with
 $N_{\text{pe}}=10^{6}$
electron markers and
$N_{\text{pe}}=10^{6}$
electron markers and
 $N_{z}=16$
B-splines in the parallel field direction (see § 12.1).
$N_{z}=16$
B-splines in the parallel field direction (see § 12.1).
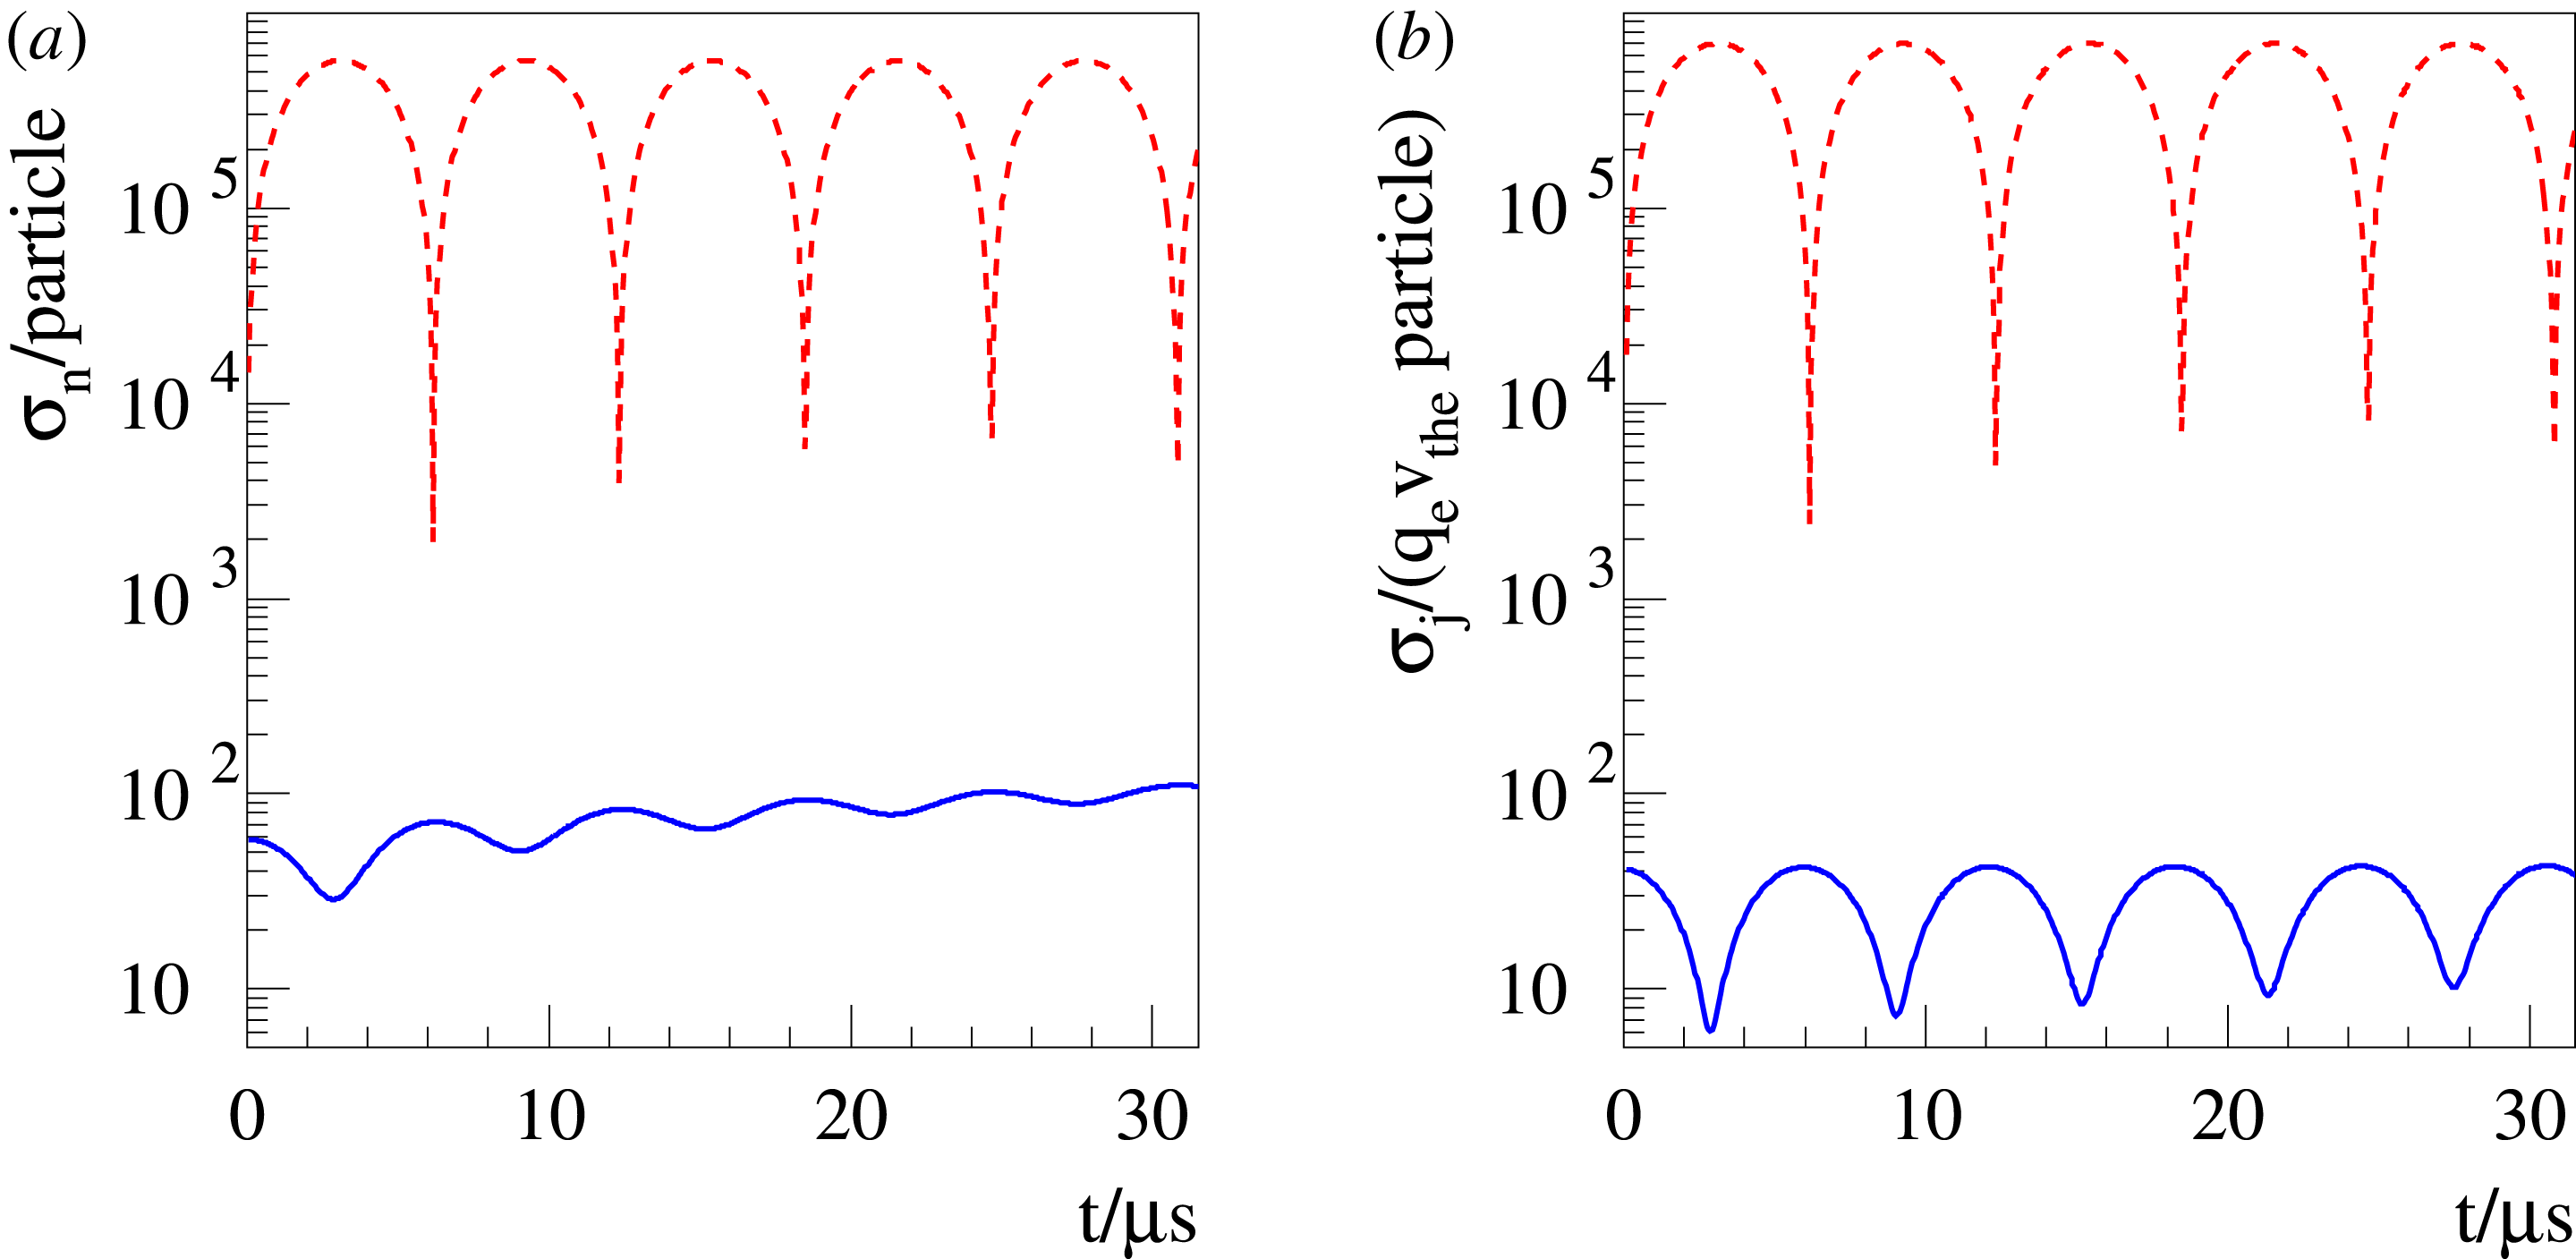
The quantity
 $1/(ak_{\bot })^{2}$
for various poloidal modes
$1/(ak_{\bot })^{2}$
for various poloidal modes
 $m$
as a function of the normalised minor radius
$m$
as a function of the normalised minor radius
 $r/a$
.
$r/a$
.

How pronounced the cancellation problem is for a given configuration depends on the poloidal Fourier mode
 $m$
and the radial position
$m$
and the radial position
 $r$
under consideration. A quantitative estimate can be given by the factor
$r$
under consideration. A quantitative estimate can be given by the factor
 $1/(ak_{\bot })^{2}$
. It can be of the order of a million for an ITER-like configuration. In figure 3, we depict
$1/(ak_{\bot })^{2}$
. It can be of the order of a million for an ITER-like configuration. In figure 3, we depict
 $1/(ak_{\bot })^{2}$
for various poloidal modes as a function of the normalised minor radius. The cancellation problem is most pronounced for the
$1/(ak_{\bot })^{2}$
for various poloidal modes as a function of the normalised minor radius. The cancellation problem is most pronounced for the
 $m=0$
mode since
$m=0$
mode since
 $k_{\unicode[STIX]{x1D717}}$
vanishes. As the
$k_{\unicode[STIX]{x1D717}}$
vanishes. As the
 $m=0$
mode plays a major role in the formation of the zonal flow, it is of key importance to diminish the statistical error when evaluating the density and current terms. For the other poloidal modes having
$m=0$
mode plays a major role in the formation of the zonal flow, it is of key importance to diminish the statistical error when evaluating the density and current terms. For the other poloidal modes having
 $m\neq 0$
the situation is less severe. In contrast to the
$m\neq 0$
the situation is less severe. In contrast to the
 $m=0$
case where
$m=0$
case where
 $k_{\bot }$
is independent of the radial position,
$k_{\bot }$
is independent of the radial position,
 $1/k_{\bot }^{2}$
is zero at the centre and ascends to its largest value at the edge.
$1/k_{\bot }^{2}$
is zero at the centre and ascends to its largest value at the edge.
However, for the quasi-neutrality equation the contribution of the adiabatic part vanishes and the inaccuracy problem is not as obvious as for Ampère’s law where the skin terms are proportional to the statistical error.
5 The control variates method in gyrokinetic PIC simulation
The
 $\unicode[STIX]{x1D6FF}f$
-PIC method is a control variates method (see Aydemir (Reference Aydemir1994) and appendix A) with the restriction
$\unicode[STIX]{x1D6FF}f$
-PIC method is a control variates method (see Aydemir (Reference Aydemir1994) and appendix A) with the restriction
 $\tilde{\unicode[STIX]{x1D6FC}}=1$
in (A 1), when it comes to the evaluation of the moments of the distribution function. Whenever a small deviation from an equilibrium state should be calculated the knowledge about the initial state
$\tilde{\unicode[STIX]{x1D6FC}}=1$
in (A 1), when it comes to the evaluation of the moments of the distribution function. Whenever a small deviation from an equilibrium state should be calculated the knowledge about the initial state
 $f(t_{0})=f_{0}$
of the system can be used to construct an effective control variate as long as the system does not evolve too far from its initial state, i.e.
$f(t_{0})=f_{0}$
of the system can be used to construct an effective control variate as long as the system does not evolve too far from its initial state, i.e.
 $|\unicode[STIX]{x1D6FF}f|\ll |f_{0}|$
. For such situations the use of a control variate is a valuable enhancement of the full-
$|\unicode[STIX]{x1D6FF}f|\ll |f_{0}|$
. For such situations the use of a control variate is a valuable enhancement of the full-
 $f$
PIC method, which has naturally a problem in resolving relatively small changes of the system. In such a case, the discretisation of the perturbation to the distribution function,
$f$
PIC method, which has naturally a problem in resolving relatively small changes of the system. In such a case, the discretisation of the perturbation to the distribution function,
 $\unicode[STIX]{x1D6FF}f$
, is achieved by the perturbed weights
$\unicode[STIX]{x1D6FF}f$
, is achieved by the perturbed weights
 $\unicode[STIX]{x1D6FF}w=(f-f_{0})/g=\unicode[STIX]{x1D6FF}f/g$
. For nonlinear PIC simulation, without collisions (with collisions see Sonnendrücker et al. (Reference Sonnendrücker, Wacher, Hatzky and Kleiber2015)) and in absence of sinks and sources, the perturbed weight
$\unicode[STIX]{x1D6FF}w=(f-f_{0})/g=\unicode[STIX]{x1D6FF}f/g$
. For nonlinear PIC simulation, without collisions (with collisions see Sonnendrücker et al. (Reference Sonnendrücker, Wacher, Hatzky and Kleiber2015)) and in absence of sinks and sources, the perturbed weight
 $\unicode[STIX]{x1D6FF}w_{p}$
can easily be calculated by the direct
$\unicode[STIX]{x1D6FF}w_{p}$
can easily be calculated by the direct
 $\unicode[STIX]{x1D6FF}f$
-method (Allfrey & Hatzky Reference Allfrey and Hatzky2003)
$\unicode[STIX]{x1D6FF}f$
-method (Allfrey & Hatzky Reference Allfrey and Hatzky2003)
 $$\begin{eqnarray}\unicode[STIX]{x1D6FF}w_{p}(\boldsymbol{z}_{p}(t))=w_{p}-\frac{f_{0}(\boldsymbol{z}_{p}(t))}{g_{p}}\end{eqnarray}$$
as
 $w_{p}$
and
$w_{p}$
and
 $g_{p}$
do not change in time. This holds for both the symplectic and the Hamiltonian formulation.
$g_{p}$
do not change in time. This holds for both the symplectic and the Hamiltonian formulation.
Note that the local Maxwellian described in (3.10) corresponds to a kinetic equilibrium with collisions but it is not necessarily a solution of the unperturbed Vlasov equation. Therefore, when a local Maxwellian is used, the zonal components of the perturbed electrostatic potential could evolve strongly in the initial phase of the simulation (Idomura, Tokuda & Kishimoto Reference Idomura, Tokuda and Kishimoto2005). In the worst case, these fields could become so strong that they would prevent e.g. ion temperature gradient (ITG) mode growth (see Angelino et al.
Reference Angelino, Bottino, Hatzky, Jolliet, Sauter, Tran and Villard2006) and would complicate the interpretation of the physical results. There are two possibilities to simplify matters. First, one could use an equilibrium distribution function which does not correspond to a real neoclassical equilibrium e.g. in a tokamak a ‘canonical Maxwellian’ (Angelino et al.
Reference Angelino, Bottino, Hatzky, Jolliet, Sauter, Tran and Villard2006). Second, one could introduce a source term
 ${\mathcal{S}}$
on the right-hand side of our gyrokinetic evolution equations, equations (3.1) and (3.51). In the following, we choose the second approach using the source (see Kleiber et al.
Reference Kleiber, Hatzky, Könies, Kauffmann and Helander2011, (31))
${\mathcal{S}}$
on the right-hand side of our gyrokinetic evolution equations, equations (3.1) and (3.51). In the following, we choose the second approach using the source (see Kleiber et al.
Reference Kleiber, Hatzky, Könies, Kauffmann and Helander2011, (31))
 $$\begin{eqnarray}{\mathcal{S}}=\left.\frac{\text{d}}{\text{d}t}\right|_{0}f_{0}=\unicode[STIX]{x1D735}f_{0}\boldsymbol{\cdot }\frac{\text{d}\boldsymbol{R}^{(0)}}{\text{d}t}+\frac{\unicode[STIX]{x2202}f_{0}}{\unicode[STIX]{x2202}v_{\Vert }}\frac{\text{d}v_{\Vert }^{(0)}}{\text{d}t},\end{eqnarray}$$
which compensates for the contribution from
 $f_{0}$
not being a kinetic equilibrium. This results in a generalised form of (5.1):
$f_{0}$
not being a kinetic equilibrium. This results in a generalised form of (5.1):
 $$\begin{eqnarray}\unicode[STIX]{x1D6FF}w_{p}(\boldsymbol{z}_{p}(t))=w_{p}+w_{p}^{0}-\frac{f_{0}(\boldsymbol{z}_{p}(t))}{g_{p}},\end{eqnarray}$$
where the weights
 $w_{p}^{0}$
are given by integrating the equation
$w_{p}^{0}$
are given by integrating the equation
 $$\begin{eqnarray}\frac{\text{d}w_{p}^{0}}{\text{d}t}=\frac{{\mathcal{S}}_{p}}{g_{p}}\quad \text{with }w_{p}^{0}(t_{0})=0\end{eqnarray}$$
along the perturbed trajectories of the markers in time.
6 Sources of errors in PIC simulation
6.1 The sampling error vs. the statistical error
We would like to point out that there are further sources of error beside the statistical error being inherent to the PIC method. One source of error comes from the sampling of the distribution function which is done at the position of the markers. Initially, the markers are distributed in phase space according to the marker distribution function
 $g(\boldsymbol{z}(t_{0}))$
. This is equivalent to assigning each marker a certain phase-space volume
$g(\boldsymbol{z}(t_{0}))$
. This is equivalent to assigning each marker a certain phase-space volume
 $\unicode[STIX]{x1D6FA}_{p}$
(see (2.10)), which does not change in time as long as the simulation is collisionless (Liouville’s theorem). Thus, one should favour volume preserving time integration schemes to implement this property at the numerical level. Nevertheless, the shape of
$\unicode[STIX]{x1D6FA}_{p}$
(see (2.10)), which does not change in time as long as the simulation is collisionless (Liouville’s theorem). Thus, one should favour volume preserving time integration schemes to implement this property at the numerical level. Nevertheless, the shape of
 $\unicode[STIX]{x1D6FA}_{p}$
can evolve and be deformed to very elongated structures, so-called ‘filaments’. However, the motion of the whole filament is evolved just by its marker position although parts of the filament might be too remote to be correctly represented by the motion of the marker position. In such a case of phase mixing, the distribution function can become under resolved.
$\unicode[STIX]{x1D6FA}_{p}$
can evolve and be deformed to very elongated structures, so-called ‘filaments’. However, the motion of the whole filament is evolved just by its marker position although parts of the filament might be too remote to be correctly represented by the motion of the marker position. In such a case of phase mixing, the distribution function can become under resolved.
Thus, the markers supply two essential features. First, they sufficiently resolve the dynamics of the evolution of the distribution function (sampling of the characteristics) and second, they reduce the statistical error when evaluating the moments of the distribution function. These two purposes do not lead necessarily to the same optimisation strategy for the marker distribution function. Although a certain marker distribution might be optimal to minimise the statistical variance and hence the statistical error of a particular moment, it might not be optimal for another one. And in addition, it could lead to under- or over-resolving the dynamics of the distribution function in some parts of phase space.
Although the gyrokinetic simulation resolves only the two-dimensional reduced velocity space, the integral of e.g. the particle number density, equation (3.13), is a three-dimensional integral over velocity space. To minimise the statistical error it is advantageous to sample also the coordinate
 $\unicode[STIX]{x1D6FC}$
by markers. Otherwise the statistical variance of the zeroth moment would become large. However, from the point of view of resolving the dynamics, it makes little sense to resolve a velocity coordinate which has no dynamics at all. So it is not obvious what would be optimal in such a situation. Especially, as there is also a big difference in the dynamic evolution of a linear and a nonlinear simulation.
$\unicode[STIX]{x1D6FC}$
by markers. Otherwise the statistical variance of the zeroth moment would become large. However, from the point of view of resolving the dynamics, it makes little sense to resolve a velocity coordinate which has no dynamics at all. So it is not obvious what would be optimal in such a situation. Especially, as there is also a big difference in the dynamic evolution of a linear and a nonlinear simulation.
6.2 The accuracy of the equilibrium quantities
Special care has to be taken when the quantities of the equilibrium magnetic field are provided. These quantities are either calculated from an ad hoc equilibrium which is usually costly or they are imported from the mesh of an equilibrium solver. Hence, it is common to precalculate these quantities and to store them on a grid. Whenever needed they can be extrapolated at the position of the markers. However, problems can occur e.g. in a tokamak when magnetic coordinates (see appendix C) are used to discretise the potential solver. In this case, the mesh of the potential solver will resolve very fine structures close to the origin, as the magnetic coordinates behave there more or less like polar coordinates. Thus, it is important that the mesh of the equilibrium quantities also uses magnetic coordinates to be consistent with the discretisation of the potential equations (see § 7.2). Only then will both meshes show the same high resolution close to the origin. In addition, the explicit mesh size of the equilibrium grid has to be adjusted in a convergence study.
6.3 Further sources of error
Another source of error is the discretisation error when integrating the equations of motion of the markers, equations (3.53) and (3.54), in time (marker pushing). Electromagnetic PIC simulations are already quite complex, which makes time integrators of higher order, like the fourth-order Runge–Kutta method, appropriate.
Last but not least there is the discretisation error due to the discretisation of the potential equations which could be e.g. a finite difference or finite element discretisation (see § 7).
7 Finite element discretisation of the potential equations
In the following, we want to consider the discretisation of a function
 $h(\boldsymbol{x},t)$
with
$h(\boldsymbol{x},t)$
with
 $K$
finite elements by using Galerkin’s method (for a more detailed introduction see Höllig (Reference Höllig2003)). The function
$K$
finite elements by using Galerkin’s method (for a more detailed introduction see Höllig (Reference Höllig2003)). The function
 $h(\boldsymbol{x},t)$
is approximated by
$h(\boldsymbol{x},t)$
is approximated by
 $\tilde{h}(\boldsymbol{x},t)$
which is a linear combination of finite element basis functions
$\tilde{h}(\boldsymbol{x},t)$
which is a linear combination of finite element basis functions
 $\unicode[STIX]{x1D6EC}(\boldsymbol{x})$
. The discretisation of
$\unicode[STIX]{x1D6EC}(\boldsymbol{x})$
. The discretisation of
 $h(\boldsymbol{x},t)$
is given by the ansatz
$h(\boldsymbol{x},t)$
is given by the ansatz
 $$\begin{eqnarray}h(\boldsymbol{x},t)\simeq \tilde{h}(\boldsymbol{x},t)=\mathop{\sum }_{j=1}^{K}\tilde{c}_{j}(t)\,\unicode[STIX]{x1D6EC}_{j}(\boldsymbol{x}),\end{eqnarray}$$
where the finite element basis consists of the elements
 $\unicode[STIX]{x1D6EC}_{j}(\boldsymbol{x})$
(where
$\unicode[STIX]{x1D6EC}_{j}(\boldsymbol{x})$
(where
 $j$
is a multi-index). In order to solve the equation
$j$
is a multi-index). In order to solve the equation
 ${\mathcal{L}}h=f$
with
${\mathcal{L}}h=f$
with
 ${\mathcal{L}}$
being a linear operator one defines a scalar product by
${\mathcal{L}}$
being a linear operator one defines a scalar product by
 $$\begin{eqnarray}(u,v)\stackrel{\text{def}}{=}\int u(\boldsymbol{x})v(\boldsymbol{x})\,{\mathcal{J}}_{x}\,\text{d}^{3}x,\end{eqnarray}$$
and the Galerkin approach requires
 $$\begin{eqnarray}({\mathcal{L}}\tilde{h}-f,\unicode[STIX]{x1D6EC}_{j})=0\quad \Rightarrow \quad ({\mathcal{L}}\tilde{h},\unicode[STIX]{x1D6EC}_{j})=(f,\unicode[STIX]{x1D6EC}_{j})\quad \forall \unicode[STIX]{x1D6EC}_{j}.\end{eqnarray}$$
Note that the geometrical information is included in the Jacobian
 ${\mathcal{J}}_{x}$
which makes the method simple to use especially for complex coordinate systems.
${\mathcal{J}}_{x}$
which makes the method simple to use especially for complex coordinate systems.
One obtains the B-spline coefficients
 $\tilde{c}_{j}$
by solving the matrix equation
$\tilde{c}_{j}$
by solving the matrix equation
 $$\begin{eqnarray}\mathop{\sum }_{j=1}^{K}l_{kj}\tilde{c}_{j}=\tilde{b}_{k},\quad k=1,\ldots ,K,\end{eqnarray}$$
where
 $$\begin{eqnarray}l_{kj}\stackrel{\text{def}}{=}({\mathcal{L}}\unicode[STIX]{x1D6EC}_{j},\unicode[STIX]{x1D6EC}_{k})\end{eqnarray}$$
and the load vector
 $\tilde{\boldsymbol{b}}$
(the projection of
$\tilde{\boldsymbol{b}}$
(the projection of
 $f(\boldsymbol{x})$
onto the finite element basis functions):
$f(\boldsymbol{x})$
onto the finite element basis functions):
 $$\begin{eqnarray}\tilde{b}_{k}\stackrel{\text{def}}{=}(f,\unicode[STIX]{x1D6EC}_{k}).\end{eqnarray}$$
In the special case of
 ${\mathcal{L}}$
being the identity, the matrix of (7.4) is called the mass matrix labelled by
${\mathcal{L}}$
being the identity, the matrix of (7.4) is called the mass matrix labelled by
 $\unicode[STIX]{x1D648}$
. As the support of the finite elements is finite, the mass matrix
$\unicode[STIX]{x1D648}$
. As the support of the finite elements is finite, the mass matrix
 $\unicode[STIX]{x1D648}$
has a sparse structure. Accordingly, the matrix equations can usually be solved by sparse linear algebra packages.
$\unicode[STIX]{x1D648}$
has a sparse structure. Accordingly, the matrix equations can usually be solved by sparse linear algebra packages.
After solving the Galerkin matrix equation for
 $\tilde{\boldsymbol{c}}$
, the function
$\tilde{\boldsymbol{c}}$
, the function
 $\tilde{h}(\boldsymbol{x})$
is well defined at every point in configuration space. Operators like integrals and derivatives acting on
$\tilde{h}(\boldsymbol{x})$
is well defined at every point in configuration space. Operators like integrals and derivatives acting on
 $h(\boldsymbol{x})$
can be performed by letting them act on the elements
$h(\boldsymbol{x})$
can be performed by letting them act on the elements
 $\unicode[STIX]{x1D6EC}_{j}(\boldsymbol{x})$
of the finite element basis. Complex geometrical issues are easily handled by the corresponding calculus of the finite elements
$\unicode[STIX]{x1D6EC}_{j}(\boldsymbol{x})$
of the finite element basis. Complex geometrical issues are easily handled by the corresponding calculus of the finite elements
 $\unicode[STIX]{x1D6EC}_{j}(\boldsymbol{x})$
. As mentioned in § A.1, an advantage of the finite element discretisation in combination with a variational principle is that it gives an energy-conserving scheme (Lewis Reference Lewis1970) for the full-
$\unicode[STIX]{x1D6EC}_{j}(\boldsymbol{x})$
. As mentioned in § A.1, an advantage of the finite element discretisation in combination with a variational principle is that it gives an energy-conserving scheme (Lewis Reference Lewis1970) for the full-
 $f$
method.
$f$
method.
For our discretisation, we choose B-splines as finite elements. The three dimensional B-spline
 $\unicode[STIX]{x1D6EC}_{j}^{d}(\boldsymbol{x})$
is a product of one-dimensional (1-D) B-splines of order
$\unicode[STIX]{x1D6EC}_{j}^{d}(\boldsymbol{x})$
is a product of one-dimensional (1-D) B-splines of order
 $d$
(tensor product B-splines, see e.g. Höllig Reference Höllig2003). The B-spline sequence
$d$
(tensor product B-splines, see e.g. Höllig Reference Höllig2003). The B-spline sequence
 $(\unicode[STIX]{x1D6EC}_{j}^{d})$
consists of non-negative functions which sum to one, i.e. in mathematical terms,
$(\unicode[STIX]{x1D6EC}_{j}^{d})$
consists of non-negative functions which sum to one, i.e. in mathematical terms,
 $(\unicode[STIX]{x1D6EC}_{j}^{d})$
provides a partition of unity (DeBoor Reference DeBoor1978, p. 111), which is important for the conservation of the particle and current number density.
$(\unicode[STIX]{x1D6EC}_{j}^{d})$
provides a partition of unity (DeBoor Reference DeBoor1978, p. 111), which is important for the conservation of the particle and current number density.
7.1 Discretisation of the charge and current assignments
In the charge and current assignments the weights of the markers of species
 $s$
are projected onto the finite element basis. Using the unbiased Monte Carlo estimator of the expected value, equation (2.5), one can derive the charge- and current-assignment vectors without gyro-averaging
$s$
are projected onto the finite element basis. Using the unbiased Monte Carlo estimator of the expected value, equation (2.5), one can derive the charge- and current-assignment vectors without gyro-averaging
 $$\begin{eqnarray}\displaystyle n_{s,k}^{\text{h}} & \stackrel{\text{def}}{=} & \displaystyle q_{s}\int f_{s}^{\text{h}}\,\unicode[STIX]{x1D6FF}(\boldsymbol{R}-\boldsymbol{x})\unicode[STIX]{x1D6EC}_{k}^{d}(\boldsymbol{x})B_{\Vert }^{\ast \text{h}}\,\text{d}\boldsymbol{R}\,\text{d}^{3}p\,\text{d}\boldsymbol{x}\nonumber\\ \displaystyle & = & \displaystyle q_{s}\int \frac{f_{s}^{\text{h}}}{g_{s}^{\text{h}}}\unicode[STIX]{x1D6EC}_{k}^{d}(\boldsymbol{R})\,g_{s}^{\text{h}}B_{\Vert }^{\ast \text{h}}\,\text{d}\boldsymbol{R}\,\text{d}^{3}p\simeq \frac{q_{s}}{N_{\text{p}s}}\mathop{\sum }_{p=1}^{N_{\text{p}s}}w_{s,p}\unicode[STIX]{x1D6EC}_{k}^{d}(\boldsymbol{R}_{p}),\end{eqnarray}$$
 $$\begin{eqnarray}\displaystyle j_{\Vert s,k}^{\text{h}} & \stackrel{\text{def}}{=} & \displaystyle \unicode[STIX]{x1D707}_{0}q_{s}\int \tilde{p}_{\Vert }\,f_{s}^{\text{h}}\,\unicode[STIX]{x1D6FF}(\boldsymbol{R}-\boldsymbol{x})\unicode[STIX]{x1D6EC}_{k}^{d}(\boldsymbol{x})B_{\Vert }^{\ast \text{h}}\,\text{d}\boldsymbol{R}\,\text{d}^{3}p\,\text{d}\boldsymbol{x}\nonumber\\ \displaystyle & \simeq & \displaystyle \frac{\unicode[STIX]{x1D707}_{0}q_{s}}{N_{\text{p}s}}\mathop{\sum }_{p=1}^{N_{\text{p}s}}\tilde{p}_{\Vert p}w_{s,p}\unicode[STIX]{x1D6EC}_{k}^{d}(\boldsymbol{R}_{p})\end{eqnarray}$$
and with gyro-averaging (Fivaz et al. Reference Fivaz, Brunner, de Ridder, Sauter, Tran, Vaclavik and Villard1998; Hatzky et al. Reference Hatzky, Tran, Könies, Kleiber and Allfrey2002)
 $$\begin{eqnarray}\displaystyle \bar{n}_{s,k}^{\text{h}} & \stackrel{\text{def}}{=} & \displaystyle q_{s}\int f_{s}^{\text{h}}\,\unicode[STIX]{x1D6FF}(\boldsymbol{R}+\unicode[STIX]{x1D746}-\boldsymbol{x})\unicode[STIX]{x1D6EC}_{k}^{d}(\boldsymbol{x})B_{\Vert }^{\ast \text{h}}\,\text{d}\boldsymbol{R}\,\text{d}\tilde{p}_{\Vert }\,\text{d}\tilde{\unicode[STIX]{x1D707}}\,\text{d}\unicode[STIX]{x1D6FC}\,\text{d}\boldsymbol{x}\nonumber\\ \displaystyle & = & \displaystyle q_{s}\int \frac{f_{s}^{\text{h}}}{g_{s}^{\text{h}}}\left(\frac{1}{2\unicode[STIX]{x03C0}}\mathop{\oint }_{0}^{2\unicode[STIX]{x03C0}}\unicode[STIX]{x1D6EC}_{k}^{d}(\boldsymbol{R}+\unicode[STIX]{x1D746})\,\text{d}\unicode[STIX]{x1D6FC}\right)\,g_{s}^{\text{h}}B_{\Vert }^{\ast \text{h}}\,\text{d}\boldsymbol{R}\,\text{d}\tilde{p}_{\Vert }\,\text{d}\tilde{\unicode[STIX]{x1D707}}\,\text{d}\hat{\unicode[STIX]{x1D6FC}}\nonumber\\ \displaystyle & \simeq & \displaystyle \frac{q_{s}}{N_{\text{p}s}}\mathop{\sum }_{p=1}^{N_{\text{p}s}}w_{s,p}\,\frac{1}{2\unicode[STIX]{x03C0}}\mathop{\oint }_{0}^{2\unicode[STIX]{x03C0}}\unicode[STIX]{x1D6EC}_{k}^{d}(\boldsymbol{R}_{p}+\unicode[STIX]{x1D746}_{s,p})\,\text{d}\unicode[STIX]{x1D6FC},\end{eqnarray}$$
 $$\begin{eqnarray}\displaystyle \bar{j}_{\Vert s,k}^{\text{h}} & \stackrel{\text{def}}{=} & \displaystyle \unicode[STIX]{x1D707}_{0}q_{s}\int \tilde{p}_{\Vert }\,f_{s}^{\text{h}}\,\unicode[STIX]{x1D6FF}(\boldsymbol{R}+\unicode[STIX]{x1D746}-\boldsymbol{x})\unicode[STIX]{x1D6EC}_{k}^{d}(\boldsymbol{x})B_{\Vert }^{\ast \text{h}}\,\text{d}\boldsymbol{R}\,\text{d}\tilde{p}_{\Vert }\,\text{d}\tilde{\unicode[STIX]{x1D707}}\,\text{d}\unicode[STIX]{x1D6FC}\,\text{d}\boldsymbol{x}\nonumber\\ \displaystyle & \simeq & \displaystyle \frac{\unicode[STIX]{x1D707}_{0}q_{s}}{N_{\text{p}s}}\mathop{\sum }_{p=1}^{N_{\text{p}s}}\tilde{p}_{\Vert p}w_{s,p}\,\frac{1}{2\unicode[STIX]{x03C0}}\mathop{\oint }_{0}^{2\unicode[STIX]{x03C0}}\unicode[STIX]{x1D6EC}_{k}^{d}(\boldsymbol{R}_{p}+\unicode[STIX]{x1D746}_{s,p})\,\text{d}\unicode[STIX]{x1D6FC},\end{eqnarray}$$
which results in the finite element load vectors
 $\boldsymbol{n}_{s}^{\text{h}}$
,
$\boldsymbol{n}_{s}^{\text{h}}$
,
 $\boldsymbol{j}_{\Vert s}^{\text{h}}$
and
$\boldsymbol{j}_{\Vert s}^{\text{h}}$
and
 $\bar{\boldsymbol{n}}_{s}^{\text{h}}$
,
$\bar{\boldsymbol{n}}_{s}^{\text{h}}$
,
 $\bar{\boldsymbol{j}}_{\Vert s}^{\,\text{h}}$
. Analogously the charge- and current-assignment vectors for the background
$\bar{\boldsymbol{j}}_{\Vert s}^{\,\text{h}}$
. Analogously the charge- and current-assignment vectors for the background
 $f_{0}$
and perturbation to the distribution function,
$f_{0}$
and perturbation to the distribution function,
 $\unicode[STIX]{x1D6FF}f^{\text{h}}$
, can be defined. Finally, all these definitions can be extended to the symplectic case.
$\unicode[STIX]{x1D6FF}f^{\text{h}}$
, can be defined. Finally, all these definitions can be extended to the symplectic case.
The integral over the gyro-phase angle
 $\unicode[STIX]{x1D6FC}$
is usually discretised with an
$\unicode[STIX]{x1D6FC}$
is usually discretised with an
 $N_{\text{g}}$
-point discrete sum of gyro-points distributed equidistantly over the gyro-ring (for
$N_{\text{g}}$
-point discrete sum of gyro-points distributed equidistantly over the gyro-ring (for
 $N_{\text{g}}=4$
, see Lee Reference Lee1987). We follow here the more elaborate adaptive gyro-averaging method of Hatzky et al. (Reference Hatzky, Tran, Könies, Kleiber and Allfrey2002):
$N_{\text{g}}=4$
, see Lee Reference Lee1987). We follow here the more elaborate adaptive gyro-averaging method of Hatzky et al. (Reference Hatzky, Tran, Könies, Kleiber and Allfrey2002):
 $$\begin{eqnarray}\frac{1}{2\unicode[STIX]{x03C0}}\mathop{\oint }_{0}^{2\unicode[STIX]{x03C0}}\unicode[STIX]{x1D6EC}_{k}^{d}(\boldsymbol{R}_{p}+\unicode[STIX]{x1D746}_{p})\,\text{d}\unicode[STIX]{x1D6FC}\simeq \frac{1}{N_{\text{g}}}\mathop{\sum }_{\unicode[STIX]{x1D708}=1}^{N_{\text{g}}}\unicode[STIX]{x1D6EC}_{k}^{d}(\boldsymbol{R}_{p}+\unicode[STIX]{x1D746}_{p}^{(\unicode[STIX]{x1D708})}),\end{eqnarray}$$
with
 $$\begin{eqnarray}\unicode[STIX]{x1D746}_{p}^{(\unicode[STIX]{x1D708})}\stackrel{\text{def}}{=}\unicode[STIX]{x1D70C}[\cos (\unicode[STIX]{x1D6FC}_{p}^{(\unicode[STIX]{x1D708})})\boldsymbol{e}_{\bot 1}-\sin (\unicode[STIX]{x1D6FC}_{p}^{(\unicode[STIX]{x1D708})})\boldsymbol{e}_{\bot 2}]\quad \text{where }\unicode[STIX]{x1D6FC}_{p}^{(\unicode[STIX]{x1D708})}\stackrel{\text{def}}{=}\frac{2\unicode[STIX]{x03C0}\unicode[STIX]{x1D708}}{N_{\text{g}}}+\unicode[STIX]{x0394}\unicode[STIX]{x1D6FC}_{p}.\end{eqnarray}$$
The
 $N_{\text{g}}$
gyro-points are equidistantly distributed over the gyro-ring and rotated for each particle
$N_{\text{g}}$
gyro-points are equidistantly distributed over the gyro-ring and rotated for each particle
 $p$
by a random gyro-phase shift
$p$
by a random gyro-phase shift
 $\unicode[STIX]{x0394}\unicode[STIX]{x1D6FC}_{p}$
. The number of gyro-points
$\unicode[STIX]{x0394}\unicode[STIX]{x1D6FC}_{p}$
. The number of gyro-points
 $N_{\text{g}}$
used for the gyro-average of each marker is a linear increasing function of the gyro-radius
$N_{\text{g}}$
used for the gyro-average of each marker is a linear increasing function of the gyro-radius
 $\unicode[STIX]{x1D70C}_{p}$
with a minimum of
$\unicode[STIX]{x1D70C}_{p}$
with a minimum of
 $N_{\text{g}}=4$
for
$N_{\text{g}}=4$
for
 $\unicode[STIX]{x1D70C}_{p}\leqslant \unicode[STIX]{x1D70C}_{0}$
where
$\unicode[STIX]{x1D70C}_{p}\leqslant \unicode[STIX]{x1D70C}_{0}$
where
 $\unicode[STIX]{x1D70C}_{0}$
is the thermal gyro-radius.
$\unicode[STIX]{x1D70C}_{0}$
is the thermal gyro-radius.
Note that (7.7)–(7.10) are estimators of the scalar products (integrals) being inherent to the finite element method. Hence, it is possible to calculate for each coefficient vector also the corresponding variance vector and thus, the statistical error of each of the integrals performed over a certain finite element (see § 2).
7.2 Discretisation of the matrix operators
The solutions of the discretised potential equations are the B-spline coefficient vector
 $\boldsymbol{c}$
of
$\boldsymbol{c}$
of
 $\unicode[STIX]{x1D6FF}\unicode[STIX]{x1D719}$
for the quasi-neutrality equation and
$\unicode[STIX]{x1D6FF}\unicode[STIX]{x1D719}$
for the quasi-neutrality equation and
 $\boldsymbol{d}$
of
$\boldsymbol{d}$
of
 $\unicode[STIX]{x1D6FF}A_{\Vert }$
for Ampère’s law. To make the discussion easier, we describe the discretised potential equations by their matrix operators which have been derived using the Galerkin method. The corresponding matrices
$\unicode[STIX]{x1D6FF}A_{\Vert }$
for Ampère’s law. To make the discussion easier, we describe the discretised potential equations by their matrix operators which have been derived using the Galerkin method. The corresponding matrices
 $\unicode[STIX]{x1D64C}$
and
$\unicode[STIX]{x1D64C}$
and
 $\boldsymbol{A}$
will have again a sparse structure.
$\boldsymbol{A}$
will have again a sparse structure.
The discretised quasi-neutrality equation (compare with (4.39) and (4.53)) can be written in the symplectic and Hamiltonian formulation:
 $$\begin{eqnarray}\displaystyle & \displaystyle \unicode[STIX]{x1D64C}\boldsymbol{c}=\unicode[STIX]{x1D739}\bar{\boldsymbol{n}}_{\text{i}}^{\text{s}}+\unicode[STIX]{x1D739}\boldsymbol{n}_{\text{e}}^{\text{s}}+(\bar{\unicode[STIX]{x1D64F}}_{2\text{i}}+C_{\text{v}2\text{e}}\unicode[STIX]{x1D64F}_{\text{e}})\boldsymbol{d}, & \displaystyle\end{eqnarray}$$
 $$\begin{eqnarray}\displaystyle & \displaystyle \unicode[STIX]{x1D64C}\boldsymbol{c}=\unicode[STIX]{x1D739}\bar{\boldsymbol{n}}_{\text{i}}^{\text{h},\text{lin}}+\unicode[STIX]{x1D739}\boldsymbol{n}_{\text{e}}^{\text{h},\text{lin}}+(\bar{\unicode[STIX]{x1D64F}}_{1\text{i}}+C_{\text{v1e}}\unicode[STIX]{x1D64F}_{\text{e}})\boldsymbol{d}, & \displaystyle\end{eqnarray}$$
where
 $\boldsymbol{d}$
is the B-spline coefficient vector of the solution of the discretised Ampère’s law, equations (7.20) and (7.21). The elements of the matrices
$\boldsymbol{d}$
is the B-spline coefficient vector of the solution of the discretised Ampère’s law, equations (7.20) and (7.21). The elements of the matrices
 $\unicode[STIX]{x1D64C}$
,
$\unicode[STIX]{x1D64C}$
,
 $\bar{\unicode[STIX]{x1D64F}}_{1\text{i}}$
,
$\bar{\unicode[STIX]{x1D64F}}_{1\text{i}}$
,
 $\bar{\unicode[STIX]{x1D64F}}_{2\text{i}}$
,
$\bar{\unicode[STIX]{x1D64F}}_{2\text{i}}$
,
 $\bar{\unicode[STIX]{x1D64F}}_{3\text{i}}$
and
$\bar{\unicode[STIX]{x1D64F}}_{3\text{i}}$
and
 $\unicode[STIX]{x1D64F}_{\text{e}}$
are defined as
$\unicode[STIX]{x1D64F}_{\text{e}}$
are defined as
 $$\begin{eqnarray}\displaystyle q_{kj} & \stackrel{\text{def}}{=} & \displaystyle \int \left(\frac{q_{\text{i}}^{2}n_{0\text{i}}}{k_{\text{B}}T_{\text{i}}}\unicode[STIX]{x1D70C}_{0\text{i}}^{2}\unicode[STIX]{x1D735}_{\bot }\unicode[STIX]{x1D6EC}_{k}^{d}\boldsymbol{\cdot }\unicode[STIX]{x1D735}_{\bot }\unicode[STIX]{x1D6EC}_{j}^{d}\right){\mathcal{J}}_{x}\,\text{d}^{3}x,\end{eqnarray}$$
 $$\begin{eqnarray}\displaystyle \bar{\unicode[STIX]{x1D64F}}_{1\text{i}} & \stackrel{\text{def}}{=} & \displaystyle \bar{\unicode[STIX]{x1D64F}}_{2\text{i}}-\bar{\unicode[STIX]{x1D64F}}_{3\text{i}}\end{eqnarray}$$
 $$\begin{eqnarray}\displaystyle \bar{t}_{\text{2i},kj} & \stackrel{\text{def}}{=} & \displaystyle q_{\text{i}}\int _{v_{\text{fin}}}\frac{\boldsymbol{b}\boldsymbol{\cdot }(\unicode[STIX]{x1D735}\times \boldsymbol{b})}{B}f_{\text{Mi}}\nonumber\\ \displaystyle & & \displaystyle \times \,\frac{1}{2\unicode[STIX]{x03C0}}\mathop{\oint }_{0}^{2\unicode[STIX]{x03C0}}\unicode[STIX]{x1D6EC}_{k}^{d}(\boldsymbol{R}+\unicode[STIX]{x1D746})\,\text{d}\unicode[STIX]{x1D6FC}\,\frac{1}{2\unicode[STIX]{x03C0}}\mathop{\oint }_{0}^{2\unicode[STIX]{x03C0}}\unicode[STIX]{x1D6EC}_{j}^{d}(\boldsymbol{R}+\unicode[STIX]{x1D746})\,\text{d}\hat{\unicode[STIX]{x1D6FC}}\,B\,\text{d}\boldsymbol{R}\,\text{d}v_{\Vert }\,\text{d}\tilde{\unicode[STIX]{x1D707}},\end{eqnarray}$$
 $$\begin{eqnarray}\displaystyle \bar{t}_{\text{3i},kj} & \stackrel{\text{def}}{=} & \displaystyle q_{\text{i}}\int _{p_{\text{fin}}}\frac{\boldsymbol{b}\boldsymbol{\cdot }(\unicode[STIX]{x1D735}\times \boldsymbol{b})}{B}\frac{\tilde{p}_{\Vert }^{2}}{v_{\text{thi}}^{2}}f_{\text{Mi}}\nonumber\\ \displaystyle & & \displaystyle \times \frac{1}{2\unicode[STIX]{x03C0}}\mathop{\oint }_{0}^{2\unicode[STIX]{x03C0}}\unicode[STIX]{x1D6EC}_{k}^{d}(\boldsymbol{R}+\unicode[STIX]{x1D746})\,\text{d}\unicode[STIX]{x1D6FC}\,\frac{1}{2\unicode[STIX]{x03C0}}\mathop{\oint }_{0}^{2\unicode[STIX]{x03C0}}\unicode[STIX]{x1D6EC}_{j}^{d}(\boldsymbol{R}+\unicode[STIX]{x1D746})\,\text{d}\hat{\unicode[STIX]{x1D6FC}}\,B\,\text{d}\boldsymbol{R}\,\text{d}\tilde{p}_{\Vert }\,\text{d}\tilde{\unicode[STIX]{x1D707}},\end{eqnarray}$$
 $$\begin{eqnarray}\displaystyle t_{\text{e},kj} & \stackrel{\text{def}}{=} & \displaystyle q_{\text{e}}\int \frac{\boldsymbol{b}\boldsymbol{\cdot }(\unicode[STIX]{x1D735}\times \boldsymbol{b})}{B}\hat{n}_{0\text{e}}\,\unicode[STIX]{x1D6EC}_{k}^{d}\,\unicode[STIX]{x1D6EC}_{j}^{d}\,{\mathcal{J}}_{x}\,\text{d}^{3}x.\end{eqnarray}$$
The discretised Ampère’s law (compare with (4.40) and (4.54)) can be written in the symplectic and Hamiltonian formulation:
 $$\begin{eqnarray}\displaystyle & \displaystyle \boldsymbol{A}^{\text{s}}\boldsymbol{d}=\unicode[STIX]{x1D739}\bar{\boldsymbol{j}}_{\Vert \text{i}}^{\text{s}}+\unicode[STIX]{x1D739}\boldsymbol{j}_{\Vert \text{e}}^{\text{s}}, & \displaystyle\end{eqnarray}$$
 $$\begin{eqnarray}\displaystyle & \displaystyle \boldsymbol{A}^{\text{h},\text{lin}}\boldsymbol{d}=\unicode[STIX]{x1D739}\bar{\boldsymbol{j}}_{\Vert \text{i}}^{\,\text{h},\text{lin}}+\unicode[STIX]{x1D739}\boldsymbol{j}_{\Vert \text{e}}^{\text{h},\text{lin}}, & \displaystyle\end{eqnarray}$$
where
 $$\begin{eqnarray}\displaystyle \boldsymbol{A}^{\text{s}} & \stackrel{\text{def}}{=} & \displaystyle \unicode[STIX]{x1D647}-C_{\text{v}2\text{e}}\unicode[STIX]{x1D650}_{\text{e}},\end{eqnarray}$$
 $$\begin{eqnarray}\displaystyle \boldsymbol{A}^{\text{h},\text{lin}} & \stackrel{\text{def}}{=} & \displaystyle \unicode[STIX]{x1D647}+\bar{\unicode[STIX]{x1D64E}}_{\text{i}}+\unicode[STIX]{x1D64E}_{\text{e}}-C_{\text{v1e}}\unicode[STIX]{x1D650}_{\text{e}},\end{eqnarray}$$
 $$\begin{eqnarray}\displaystyle l_{kj} & \stackrel{\text{def}}{=} & \displaystyle \int \unicode[STIX]{x1D735}_{\bot }\unicode[STIX]{x1D6EC}_{k}^{d}\boldsymbol{\cdot }\unicode[STIX]{x1D735}_{\bot }\unicode[STIX]{x1D6EC}_{j}^{d}\,{\mathcal{J}}_{x}\,\text{d}^{3}x,\end{eqnarray}$$
 $$\begin{eqnarray}\displaystyle \bar{s}_{\text{i},kj} & \stackrel{\text{def}}{=} & \displaystyle \frac{q_{\text{i}}^{2}}{m_{\text{i}}}\int _{p_{\text{fin}}}\frac{\tilde{p}_{\Vert }^{2}}{v_{\text{thi}}^{2}}f_{\text{Mi}}\nonumber\\ \displaystyle & & \displaystyle \times \,\frac{1}{2\unicode[STIX]{x03C0}}\mathop{\oint }_{0}^{2\unicode[STIX]{x03C0}}\unicode[STIX]{x1D6EC}_{k}^{d}(\boldsymbol{R}+\unicode[STIX]{x1D746})\,\text{d}\unicode[STIX]{x1D6FC}\,\frac{1}{2\unicode[STIX]{x03C0}}\mathop{\oint }_{0}^{2\unicode[STIX]{x03C0}}\unicode[STIX]{x1D6EC}_{j}^{d}(\boldsymbol{R}+\unicode[STIX]{x1D746})\,\text{d}\hat{\unicode[STIX]{x1D6FC}}\,B\,\text{d}\boldsymbol{R}\,\text{d}\tilde{p}_{\Vert }\,\text{d}\tilde{\unicode[STIX]{x1D707}},\end{eqnarray}$$
 $$\begin{eqnarray}\displaystyle s_{\text{e},kj} & \stackrel{\text{def}}{=} & \displaystyle C_{\text{v}3\text{e}}\int \frac{\unicode[STIX]{x1D6FD}_{0\text{e}}}{\unicode[STIX]{x1D70C}_{0\text{e}}^{2}}\unicode[STIX]{x1D6EC}_{k}^{d}\,\unicode[STIX]{x1D6EC}_{j}^{d}\,{\mathcal{J}}_{x}\,\text{d}^{3}x,\end{eqnarray}$$
 $$\begin{eqnarray}\displaystyle u_{\text{e},kj} & \stackrel{\text{def}}{=} & \displaystyle \unicode[STIX]{x1D707}_{0}q_{\text{e}}\int \frac{\boldsymbol{b}\boldsymbol{\cdot }(\unicode[STIX]{x1D735}\times \boldsymbol{b})}{B}\hat{n}_{0\text{e}}\hat{u} _{0\text{e}}\,\unicode[STIX]{x1D6EC}_{k}^{d}\,\unicode[STIX]{x1D6EC}_{j}^{d}\,{\mathcal{J}}_{x}\,\text{d}^{3}x.\end{eqnarray}$$
We have linearised the skin terms and have inserted into (7.21) the exact ion skin term matrix
 $\bar{\unicode[STIX]{x1D64E}}_{\text{i}}$
for the gyro-averaging. In the following, we will also need its long-wavelength approximation
$\bar{\unicode[STIX]{x1D64E}}_{\text{i}}$
for the gyro-averaging. In the following, we will also need its long-wavelength approximation
 $\check{\unicode[STIX]{x1D64E}}_{\text{i}}$
defined by
$\check{\unicode[STIX]{x1D64E}}_{\text{i}}$
defined by
 $$\begin{eqnarray}{\check{s}}_{\text{i},kj}\stackrel{\text{def}}{=}C_{\text{v}3\text{i}}\int \left(\frac{\unicode[STIX]{x1D6FD}_{0\text{i}}}{\unicode[STIX]{x1D70C}_{0\text{i}}^{2}}\unicode[STIX]{x1D6EC}_{k}^{d}\,\unicode[STIX]{x1D6EC}_{j}^{d}-\unicode[STIX]{x1D6FD}_{0\text{i}}\unicode[STIX]{x1D735}_{\bot }\unicode[STIX]{x1D6EC}_{k}^{d}\boldsymbol{\cdot }\unicode[STIX]{x1D735}_{\bot }\unicode[STIX]{x1D6EC}_{j}^{d}\right)\,{\mathcal{J}}_{x}\,\text{d}^{3}x.\end{eqnarray}$$
Accordingly, a long-wavelength approximation can be done for the matrices
 $\bar{\unicode[STIX]{x1D64F}}_{1\text{i}}$
,
$\bar{\unicode[STIX]{x1D64F}}_{1\text{i}}$
,
 $\bar{\unicode[STIX]{x1D64F}}_{2\text{i}}$
and
$\bar{\unicode[STIX]{x1D64F}}_{2\text{i}}$
and
 $\bar{\unicode[STIX]{x1D64F}}_{3\text{i}}$
(see (4.56)).
$\bar{\unicode[STIX]{x1D64F}}_{3\text{i}}$
(see (4.56)).
The set of discretised symplectic potential equations, equations (7.13) and (7.20), holds for both the linear and nonlinear case (see § 4.3.1). However, when using the Hamiltonian formulation in case of a finite velocity sphere, we have only a linearised form of the quasi-neutrality equation and Ampère’s law, equations (7.14) and (7.21), at our disposal (see § 4.3.2).
7.2.1 Boundary conditions
We choose radially a homogeneous Dirichlet boundary condition at the outer boundary. At the origin of our simulation domain we choose a homogeneous Neumann boundary condition for the poloidal
 $m=0$
mode and homogeneous Dirichlet boundary conditions for the poloidal
$m=0$
mode and homogeneous Dirichlet boundary conditions for the poloidal
 $m\neq 0$
modes. As we want to simulate a torus, as e.g. a tokamak, we choose periodic boundary conditions for the remaining angular coordinates. All these boundary conditions can be implemented within the finite element formalism (see e.g. DeBoor Reference DeBoor1978). It is important that we impose identical boundary conditions on the matrices being used. Only then will our operators act in the same subspace spanned by the finite element basis.
$m\neq 0$
modes. As we want to simulate a torus, as e.g. a tokamak, we choose periodic boundary conditions for the remaining angular coordinates. All these boundary conditions can be implemented within the finite element formalism (see e.g. DeBoor Reference DeBoor1978). It is important that we impose identical boundary conditions on the matrices being used. Only then will our operators act in the same subspace spanned by the finite element basis.
However, special care has to be taken when implementing the inner boundary condition at the centre of our magnetic coordinate grid (see appendix C). For the weak variational form the natural boundary condition is the homogeneous Neumann boundary condition for the poloidal
 $m=0$
mode. Unfortunately, the typical B-spline discretisation will not guarantee that all B-splines which meet at the centre will have the same value. Hence, at the centre the numerical solution is not
$m=0$
mode. Unfortunately, the typical B-spline discretisation will not guarantee that all B-splines which meet at the centre will have the same value. Hence, at the centre the numerical solution is not
 ${\mathcal{C}}^{0}$
. In other words, a marker which would cross the centre would suffer a jump in the potential. To avoid this, we replace all B-splines at the centre by just one B-spline which is constant in its poloidal direction. With this step we impose unicity at the axis, i.e. the solution is guaranteed to have the regularity of
${\mathcal{C}}^{0}$
. In other words, a marker which would cross the centre would suffer a jump in the potential. To avoid this, we replace all B-splines at the centre by just one B-spline which is constant in its poloidal direction. With this step we impose unicity at the axis, i.e. the solution is guaranteed to have the regularity of
 ${\mathcal{C}}^{0}$
. Another positive side effect is that we have reduced the degrees of freedom in the centre and thus have diminished the statistical error: the constant B-spline covers more volume than the individual B-splines which meet at the centre and therefore has a smaller statistical error as it collects more markers. Further improvement is possible by demanding that the solution has the regularity of at least
${\mathcal{C}}^{0}$
. Another positive side effect is that we have reduced the degrees of freedom in the centre and thus have diminished the statistical error: the constant B-spline covers more volume than the individual B-splines which meet at the centre and therefore has a smaller statistical error as it collects more markers. Further improvement is possible by demanding that the solution has the regularity of at least
 ${\mathcal{C}}^{1}$
for B-splines of order
${\mathcal{C}}^{1}$
for B-splines of order
 $d>2$
(see Toshniwal et al.
Reference Toshniwal, Speleers, Hiemstra and Hughes2017). This would avoid jumps when calculating the gradient of the potentials.
$d>2$
(see Toshniwal et al.
Reference Toshniwal, Speleers, Hiemstra and Hughes2017). This would avoid jumps when calculating the gradient of the potentials.
8 Alternative discretisation of the potential equations
It is not feasible to solve the potential equations in the Hamiltonian formulation due to the large statistical error of the moments of the distribution function. Instead we have to use the potential equations in the symplectic formulation which implies to calculate the symplectic moments directly from the Hamiltonian weights. Therefore, we have to perform the according pullback transformation of the perturbed Hamiltonian weights which is done in the linear case by (3.49) and in the nonlinear case by (3.47) or (3.48).
8.1 The linear case
8.1.1 The linear pull-back transformation of the charge- and current-assignment vectors
Analogous to the definition of the charge- and current-assignment vectors, equations (7.7)–(7.10), we define the adiabatic charge- and current-assignment vectors
 $\unicode[STIX]{x1D739}\bar{\boldsymbol{n}}_{\text{i}}^{\text{ad}}$
,
$\unicode[STIX]{x1D739}\bar{\boldsymbol{n}}_{\text{i}}^{\text{ad}}$
,
 $\unicode[STIX]{x1D739}\boldsymbol{n}_{\text{e}}^{\text{ad}}$
and
$\unicode[STIX]{x1D739}\boldsymbol{n}_{\text{e}}^{\text{ad}}$
and
 $\unicode[STIX]{x1D739}\bar{\boldsymbol{j}}_{\Vert \text{i}}^{\text{ad}}$
,
$\unicode[STIX]{x1D739}\bar{\boldsymbol{j}}_{\Vert \text{i}}^{\text{ad}}$
,
 $\unicode[STIX]{x1D739}\boldsymbol{j}_{\Vert \text{e}}^{\text{ad}}$
(with and without gyro-averaging) of the linearised adiabatic weights
$\unicode[STIX]{x1D739}\boldsymbol{j}_{\Vert \text{e}}^{\text{ad}}$
(with and without gyro-averaging) of the linearised adiabatic weights
 $\unicode[STIX]{x1D6FF}w_{p}^{\text{ad}}$
defined in (4.60). These vectors can be calculated by the following matrix equations (for details see appendix E):
$\unicode[STIX]{x1D6FF}w_{p}^{\text{ad}}$
defined in (4.60). These vectors can be calculated by the following matrix equations (for details see appendix E):
 $$\begin{eqnarray}\unicode[STIX]{x1D739}\bar{\boldsymbol{n}}_{\text{i}}^{\text{ad}}=\bar{\unicode[STIX]{x1D649}}_{\text{i}}^{\text{ad}}\boldsymbol{d},\quad \unicode[STIX]{x1D739}\boldsymbol{n}_{\text{e}}^{\text{ad}}=\unicode[STIX]{x1D649}_{\text{e}}^{\text{ad}}\boldsymbol{d},\end{eqnarray}$$
 $$\begin{eqnarray}\unicode[STIX]{x1D739}\bar{\boldsymbol{j}}_{\Vert \text{i}}^{\text{ad}}=\bar{\unicode[STIX]{x1D645}}_{\text{i}}^{\text{ad}}\boldsymbol{d},\quad \unicode[STIX]{x1D739}\boldsymbol{j}_{\Vert \text{e}}^{\text{ad}}=\unicode[STIX]{x1D645}_{\text{e}}^{\text{ad}}\boldsymbol{d},\end{eqnarray}$$
where
 $\boldsymbol{d}$
is again the B-spline coefficient vector of the solution of the discretised Ampère’s law.
$\boldsymbol{d}$
is again the B-spline coefficient vector of the solution of the discretised Ampère’s law.
In the linear case, the transformation of the perturbed weights
 $\unicode[STIX]{x1D6FF}w^{\text{s,lin}}$
is defined by (4.59). Instead of performing the pull-back transformation marker-wise, we can perform the pull-back transformation of the charge- and current-assignment vectors by using the adiabatic charge- and current-assignment vectors (compare with (4.63) and (4.64)):
$\unicode[STIX]{x1D6FF}w^{\text{s,lin}}$
is defined by (4.59). Instead of performing the pull-back transformation marker-wise, we can perform the pull-back transformation of the charge- and current-assignment vectors by using the adiabatic charge- and current-assignment vectors (compare with (4.63) and (4.64)):
 $$\begin{eqnarray}\displaystyle \unicode[STIX]{x1D739}\bar{\boldsymbol{n}}_{\text{i}}^{\text{s},\text{lin}}+\unicode[STIX]{x1D739}\boldsymbol{n}_{\text{e}}^{\text{s},\text{lin}} & = & \displaystyle \unicode[STIX]{x1D739}\bar{\boldsymbol{n}}_{\text{i}}^{\text{h},\text{lin}}-\unicode[STIX]{x1D739}\bar{\boldsymbol{n}}_{\text{i}}^{\text{ad}}+\unicode[STIX]{x1D739}\boldsymbol{n}_{\text{e}}^{\text{h},\text{lin}}-\unicode[STIX]{x1D739}\boldsymbol{n}_{\text{e}}^{\text{ad}}\nonumber\\ \displaystyle & = & \displaystyle \unicode[STIX]{x1D739}\bar{\boldsymbol{n}}_{\text{i}}^{\text{h},\text{lin}}+\unicode[STIX]{x1D739}\boldsymbol{n}_{\text{e}}^{\text{h},\text{lin}}-(\bar{\unicode[STIX]{x1D649}}_{\text{i}}^{\text{ad}}+\unicode[STIX]{x1D649}_{\text{e}}^{\text{ad}})\boldsymbol{d},\end{eqnarray}$$
 $$\begin{eqnarray}\displaystyle \unicode[STIX]{x1D739}\bar{\boldsymbol{j}}_{\Vert \text{i}}^{\text{s},\text{lin}}+\unicode[STIX]{x1D739}\boldsymbol{j}_{\Vert \text{e}}^{\text{s},\text{lin}} & = & \displaystyle \unicode[STIX]{x1D739}\bar{\boldsymbol{j}}_{\Vert \text{i}}^{\,\text{h},\text{lin}}-\unicode[STIX]{x1D739}\bar{\boldsymbol{j}}_{\Vert \text{i}}^{\text{ad}}+\unicode[STIX]{x1D739}\boldsymbol{j}_{\Vert \text{e}}^{\text{h},\text{lin}}-\unicode[STIX]{x1D739}\boldsymbol{j}_{\Vert \text{e}}^{\text{ad}}\nonumber\\ \displaystyle & = & \displaystyle \unicode[STIX]{x1D739}\bar{\boldsymbol{j}}_{\Vert \text{i}}^{\,\text{h},\text{lin}}+\unicode[STIX]{x1D739}\boldsymbol{j}_{\Vert \text{e}}^{\text{h},\text{lin}}-(\bar{\unicode[STIX]{x1D645}}_{\text{i}}^{\text{ad}}+\unicode[STIX]{x1D645}_{\text{e}}^{\text{ad}})\boldsymbol{d}.\end{eqnarray}$$
The matrices
 $\bar{\unicode[STIX]{x1D649}}_{\text{i}}^{\text{ad}}$
,
$\bar{\unicode[STIX]{x1D649}}_{\text{i}}^{\text{ad}}$
,
 $\unicode[STIX]{x1D649}_{\text{e}}^{\text{ad}}$
and
$\unicode[STIX]{x1D649}_{\text{e}}^{\text{ad}}$
and
 $\bar{\unicode[STIX]{x1D645}}_{\text{i}}^{\text{ad}}$
,
$\bar{\unicode[STIX]{x1D645}}_{\text{i}}^{\text{ad}}$
,
 $\unicode[STIX]{x1D645}_{\text{e}}^{\text{ad}}$
are estimators of the expected values given by (compare with (4.61)–(4.62) and (4.65)–(4.66)):
$\unicode[STIX]{x1D645}_{\text{e}}^{\text{ad}}$
are estimators of the expected values given by (compare with (4.61)–(4.62) and (4.65)–(4.66)):
 $$\begin{eqnarray}\lim _{N_{\text{pi}}\rightarrow \infty }\bar{\unicode[STIX]{x1D649}}_{\text{i}}^{\text{ad}}=\bar{\unicode[STIX]{x1D64F}}_{3\text{i}},\quad \lim _{N_{\text{pe}}\rightarrow \infty }\unicode[STIX]{x1D649}_{\text{e}}^{\text{ad}}=C_{\text{v3e}}\unicode[STIX]{x1D64F}_{\text{e}},\end{eqnarray}$$
 $$\begin{eqnarray}\lim _{N_{\text{pi}}\rightarrow \infty }\bar{\unicode[STIX]{x1D645}}_{\text{i}}^{\text{ad}}=\bar{\unicode[STIX]{x1D64E}}_{\text{i}},\quad \lim _{N_{\text{pe}}\rightarrow \infty }\unicode[STIX]{x1D645}_{\text{e}}^{\text{ad}}=\unicode[STIX]{x1D64E}_{\text{e}}+C_{\text{v3e}}\unicode[STIX]{x1D650}_{\text{e}}.\end{eqnarray}$$
8.1.2 Alternative formulation of the potential equations
Using (8.3) and (8.4), we can rewrite the symplectic equations (7.13) and (7.20) in the alternative form:
 $$\begin{eqnarray}\displaystyle & \displaystyle \unicode[STIX]{x1D64C}\boldsymbol{c}=\unicode[STIX]{x1D739}\bar{\boldsymbol{n}}_{\text{i}}^{\text{h},\text{lin}}+\unicode[STIX]{x1D739}\boldsymbol{n}_{\text{e}}^{\text{h},\text{lin}}-(\bar{\unicode[STIX]{x1D649}}_{\text{i}}^{\text{ad}}+\unicode[STIX]{x1D649}_{\text{e}}^{\text{ad}}-\bar{\unicode[STIX]{x1D64F}}_{2\text{i}}-C_{\text{v}2\text{e}}\unicode[STIX]{x1D64F}_{\text{e}})\boldsymbol{d}, & \displaystyle\end{eqnarray}$$
 $$\begin{eqnarray}\displaystyle & \displaystyle (\unicode[STIX]{x1D647}+\bar{\unicode[STIX]{x1D645}}_{\text{i}}^{\text{ad}}+\unicode[STIX]{x1D645}_{\text{e}}^{\text{ad}}-C_{\text{v}2\text{e}}\unicode[STIX]{x1D650}_{\text{e}})\boldsymbol{d}=\unicode[STIX]{x1D739}\bar{\boldsymbol{j}}_{\Vert \text{i}}^{\,\text{h},\text{lin}}+\unicode[STIX]{x1D739}\boldsymbol{j}_{\Vert \text{e}}^{\text{h},\text{lin}}. & \displaystyle\end{eqnarray}$$
This set of potential equations combines two steps: the transformation of the weights from the Hamiltonian to the symplectic formulation and the solution of the potential equations in the symplectic formulation.
Equation (8.8) has been also derived in Mishchenko, Könies & Hatzky (Reference Mishchenko, Könies, Hatzky, Sauter and Sindoni2004b
) albeit in a reduced form without the
 $\unicode[STIX]{x1D650}_{\text{e}}$
term. An alternative approach to derive (8.7) and (8.8) – again in a reduced form without the
$\unicode[STIX]{x1D650}_{\text{e}}$
term. An alternative approach to derive (8.7) and (8.8) – again in a reduced form without the
 $\bar{\unicode[STIX]{x1D64F}}_{2\text{i}}$
,
$\bar{\unicode[STIX]{x1D64F}}_{2\text{i}}$
,
 $\unicode[STIX]{x1D64F}_{\text{e}}$
and
$\unicode[STIX]{x1D64F}_{\text{e}}$
and
 $\unicode[STIX]{x1D650}_{\text{e}}$
terms – was given in Hatzky et al. (Reference Hatzky, Könies and Mishchenko2007). This approach was based on a control variates method which can be generalised to derive the exact equations (8.7) and (8.8).
$\unicode[STIX]{x1D650}_{\text{e}}$
terms – was given in Hatzky et al. (Reference Hatzky, Könies and Mishchenko2007). This approach was based on a control variates method which can be generalised to derive the exact equations (8.7) and (8.8).
8.1.3 Solving of Ampère’s law
It can be very costly to build up especially the matrix
 $\bar{\unicode[STIX]{x1D645}}_{\text{i}}^{\text{ad}}$
(see also Mishchenko, Könies & Hatzky Reference Mishchenko, Könies and Hatzky2005) due to the ‘double’ gyro-averaging (see (E 12)) which results in a lot of matrix entries. The solving of the resulting matrix equation is quite costly. Fortunately, in an iterative solving procedure it is not necessary to build up the matrices
$\bar{\unicode[STIX]{x1D645}}_{\text{i}}^{\text{ad}}$
(see also Mishchenko, Könies & Hatzky Reference Mishchenko, Könies and Hatzky2005) due to the ‘double’ gyro-averaging (see (E 12)) which results in a lot of matrix entries. The solving of the resulting matrix equation is quite costly. Fortunately, in an iterative solving procedure it is not necessary to build up the matrices
 $\bar{\unicode[STIX]{x1D645}}_{\text{i}}^{\text{ad}}$
and
$\bar{\unicode[STIX]{x1D645}}_{\text{i}}^{\text{ad}}$
and
 $\unicode[STIX]{x1D645}_{\text{e}}^{\text{ad}}$
. Instead a current assignment of the adiabatic weights
$\unicode[STIX]{x1D645}_{\text{e}}^{\text{ad}}$
. Instead a current assignment of the adiabatic weights
 $\unicode[STIX]{x1D6FF}w^{\text{ad}}$
, equations (E 10) and (E 4), is sufficient to compute
$\unicode[STIX]{x1D6FF}w^{\text{ad}}$
, equations (E 10) and (E 4), is sufficient to compute
 $\unicode[STIX]{x1D739}\bar{\boldsymbol{j}}_{\Vert \text{i}}^{\text{ad}}$
and
$\unicode[STIX]{x1D739}\bar{\boldsymbol{j}}_{\Vert \text{i}}^{\text{ad}}$
and
 $\unicode[STIX]{x1D739}\boldsymbol{j}_{\Vert \text{e}}^{\text{ad}}$
directly whenever these quantities are needed. Therefore, equation (8.8) is rewritten in the equivalent form:
$\unicode[STIX]{x1D739}\boldsymbol{j}_{\Vert \text{e}}^{\text{ad}}$
directly whenever these quantities are needed. Therefore, equation (8.8) is rewritten in the equivalent form:
 $$\begin{eqnarray}(\unicode[STIX]{x1D647}+\check{\unicode[STIX]{x1D64E}}_{\text{i}}+\unicode[STIX]{x1D64E}_{\text{e}}-C_{\text{v1e}}\unicode[STIX]{x1D650}_{\text{e}})\boldsymbol{d}=\unicode[STIX]{x1D739}\bar{\boldsymbol{j}}_{\Vert \text{i}}^{\,\text{h},\text{lin}}+\unicode[STIX]{x1D739}\boldsymbol{j}_{\Vert \text{e}}^{\text{h},\text{lin}}+(\check{\unicode[STIX]{x1D64E}}_{\text{i}}-\bar{\unicode[STIX]{x1D645}}_{\text{i}}^{\text{ad}}+\unicode[STIX]{x1D64E}_{\text{e}}+C_{\text{v3e}}\unicode[STIX]{x1D650}_{\text{e}}-\unicode[STIX]{x1D645}_{\text{e}}^{\text{ad}})\boldsymbol{d}.\end{eqnarray}$$
In this form Ampère’s law can be solved by the iterative method presented in § F.1. Its key idea is to use the expected values in (8.6) as approximating matrices for
 $\bar{\unicode[STIX]{x1D645}}_{\text{i}}^{\text{ad}}$
and
$\bar{\unicode[STIX]{x1D645}}_{\text{i}}^{\text{ad}}$
and
 $\unicode[STIX]{x1D645}_{\text{e}}^{\text{ad}}$
, which gives us the chance to construct a well-suited preconditioner to solve (8.9) efficiently.
$\unicode[STIX]{x1D645}_{\text{e}}^{\text{ad}}$
, which gives us the chance to construct a well-suited preconditioner to solve (8.9) efficiently.
8.1.4 Solving of quasi-neutrality equation
After solving Ampère’s law the coefficient vector
 $\boldsymbol{d}$
is known and it is possible to solve the quasi-neutrality equation (8.7). Again, it is not necessary to build up the matrices of
$\boldsymbol{d}$
is known and it is possible to solve the quasi-neutrality equation (8.7). Again, it is not necessary to build up the matrices of
 $\bar{\unicode[STIX]{x1D649}}_{\text{i}}^{\text{ad}}$
and
$\bar{\unicode[STIX]{x1D649}}_{\text{i}}^{\text{ad}}$
and
 $\unicode[STIX]{x1D649}_{\text{e}}^{\text{ad}}$
. Instead a charge assignment of the adiabatic weights
$\unicode[STIX]{x1D649}_{\text{e}}^{\text{ad}}$
. Instead a charge assignment of the adiabatic weights
 $\unicode[STIX]{x1D6FF}w^{\text{ad}}$
, equations (E 7) and (E 1), suffices to compute
$\unicode[STIX]{x1D6FF}w^{\text{ad}}$
, equations (E 7) and (E 1), suffices to compute
 $\unicode[STIX]{x1D739}\bar{\boldsymbol{n}}_{\text{i}}^{\text{ad}}$
and
$\unicode[STIX]{x1D739}\bar{\boldsymbol{n}}_{\text{i}}^{\text{ad}}$
and
 $\unicode[STIX]{x1D739}\boldsymbol{n}_{\text{e}}^{\text{ad}}$
whenever these quantities are needed.
$\unicode[STIX]{x1D739}\boldsymbol{n}_{\text{e}}^{\text{ad}}$
whenever these quantities are needed.
8.2 The nonlinear case
8.2.1 Solving of Ampère’s law
In the nonlinear case, the pull-back transformation of the weights is simply given by (3.36), i.e. the weights are shifted from the
 $\tilde{p}_{\Vert }$
-coordinates to the
$\tilde{p}_{\Vert }$
-coordinates to the
 $v_{\Vert }$
-coordinates. Formally we can introduce the effect of the pull-back transformation on the current-assignment vector
$v_{\Vert }$
-coordinates. Formally we can introduce the effect of the pull-back transformation on the current-assignment vector
 $\unicode[STIX]{x1D739}\bar{\boldsymbol{j}}^{\text{h}}$
by subtracting a nonlinear transformation operator
$\unicode[STIX]{x1D739}\bar{\boldsymbol{j}}^{\text{h}}$
by subtracting a nonlinear transformation operator
 $\unicode[STIX]{x1D645}(\boldsymbol{d})$
which consists of a linear and nonlinear part:
$\unicode[STIX]{x1D645}(\boldsymbol{d})$
which consists of a linear and nonlinear part:
 $$\begin{eqnarray}\unicode[STIX]{x1D645}(\boldsymbol{d})=\unicode[STIX]{x1D645}^{\text{ad}}\boldsymbol{d}+\unicode[STIX]{x1D645}^{\text{nonlin}}(\boldsymbol{d}).\end{eqnarray}$$
As a generalisation of (8.4) it follows that:
 $$\begin{eqnarray}\unicode[STIX]{x1D739}\bar{\boldsymbol{j}}_{\Vert \text{i}}^{\text{s}}+\unicode[STIX]{x1D739}\boldsymbol{j}_{\Vert \text{e}}^{\text{s}}=\unicode[STIX]{x1D739}\bar{\boldsymbol{j}}_{\Vert \text{i}}^{\,\text{h}}-\bar{\unicode[STIX]{x1D645}}_{\text{i}}(\boldsymbol{d})+\unicode[STIX]{x1D739}\boldsymbol{j}_{\Vert \text{e}}^{\text{h}}-\unicode[STIX]{x1D645}_{\text{e}}(\boldsymbol{d}).\end{eqnarray}$$
And from (8.8) we can derive the discretised Ampère’s law for the nonlinear case:
 $$\begin{eqnarray}(\unicode[STIX]{x1D647}-C_{\text{v}2\text{e}}\unicode[STIX]{x1D650}_{\text{e}})\boldsymbol{d}+\bar{\unicode[STIX]{x1D645}}_{\text{i}}(\boldsymbol{d})+\unicode[STIX]{x1D645}_{\text{e}}(\boldsymbol{d})=\unicode[STIX]{x1D739}\bar{\boldsymbol{j}}_{\Vert \text{i}}^{\,\text{h}}+\unicode[STIX]{x1D739}\boldsymbol{j}_{\Vert \text{e}}^{\text{h}}.\end{eqnarray}$$
This equation can be solved by the iterative scheme proposed in § F.2. The scheme conserves the total particle number as the pull-back transformation of the weights does not change the weights themselves.
8.2.2 Solving of quasi-neutrality equation
After solving Ampère’s law with the iterative scheme from § F.2 the coefficient vector
 $\boldsymbol{d}$
is known. Thus, the pull-back transformation of each weight can be done to compute the charge-assignment vectors
$\boldsymbol{d}$
is known. Thus, the pull-back transformation of each weight can be done to compute the charge-assignment vectors
 $\unicode[STIX]{x1D739}\bar{\boldsymbol{n}}_{\text{i}}^{\text{s}}$
and
$\unicode[STIX]{x1D739}\bar{\boldsymbol{n}}_{\text{i}}^{\text{s}}$
and
 $\unicode[STIX]{x1D739}\boldsymbol{n}_{\text{e}}^{\text{s}}$
. Finally, the quasi-neutrality equation is solved in its symplectic form, equation (7.13).
$\unicode[STIX]{x1D739}\boldsymbol{n}_{\text{e}}^{\text{s}}$
. Finally, the quasi-neutrality equation is solved in its symplectic form, equation (7.13).
9 Fourier filter in PIC
To further reduce the statistical error a low pass filter is used to suppress the non-physical high-frequency modes which are polluted by statistical noise. In practice the coefficient vector of the charge or current assignment is first Fourier transformed via an fast Fourier transform (FFT), then the high-frequency modes are suppressed and finally the result is transformed back via a backward FFT. We will denote such a filter operation by the symbol
 ${\mathcal{F}}$
acting on the periodic coordinates of a B-spline coefficient vector.
${\mathcal{F}}$
acting on the periodic coordinates of a B-spline coefficient vector.
It is important to note that if the Fourier filter is applied directly on the charge- and current-assignment vectors
 $\boldsymbol{n}$
and
$\boldsymbol{n}$
and
 $\boldsymbol{j}_{\Vert }$
spurious modes can be excited. This can be understood by the following simple example: let us suppose that the density is constant over the poloidal plane and we want to filter out any other mode except the constant one, i.e. the
$\boldsymbol{j}_{\Vert }$
spurious modes can be excited. This can be understood by the following simple example: let us suppose that the density is constant over the poloidal plane and we want to filter out any other mode except the constant one, i.e. the
 $m=0$
mode. In the case of a toroidal geometry, the Jacobian depends on the angular
$m=0$
mode. In the case of a toroidal geometry, the Jacobian depends on the angular
 $\unicode[STIX]{x1D717}$
-coordinate. This results in a poloidal
$\unicode[STIX]{x1D717}$
-coordinate. This results in a poloidal
 $m=1$
structure of the charge- or current-assignment vector although the density is constant. Therefore, filtering out the
$m=1$
structure of the charge- or current-assignment vector although the density is constant. Therefore, filtering out the
 $m=1$
mode on these vectors is non-physical and will, after applying the inverse mass matrix, lead in addition to the
$m=1$
mode on these vectors is non-physical and will, after applying the inverse mass matrix, lead in addition to the
 $m=0$
mode to spurious modes in the coefficient vector of the charge or current number density. Therefore, the filtering has to be done on the physical quantities obtained by applying
$m=0$
mode to spurious modes in the coefficient vector of the charge or current number density. Therefore, the filtering has to be done on the physical quantities obtained by applying
 $\unicode[STIX]{x1D648}^{-1}$
to the charge- or current-assignment vector. So we define a filter operator for load vectors by
$\unicode[STIX]{x1D648}^{-1}$
to the charge- or current-assignment vector. So we define a filter operator for load vectors by
 $$\begin{eqnarray}\hat{{\mathcal{F}}}[\,\boldsymbol{\cdot }\,]\stackrel{\text{def}}{=}\unicode[STIX]{x1D648}{\mathcal{F}}[\unicode[STIX]{x1D648}^{-1}\,\boldsymbol{\cdot }\,].\end{eqnarray}$$
Apart from the necessary additional matrix solve, we have to cope with another disadvantage: applying the
 ${\mathcal{F}}$
filter to
${\mathcal{F}}$
filter to
 $\boldsymbol{n}$
and
$\boldsymbol{n}$
and
 $\boldsymbol{j}_{\Vert }$
does not affect particle number and total current conservation as long as the
$\boldsymbol{j}_{\Vert }$
does not affect particle number and total current conservation as long as the
 $n=0,m=0$
mode is untouched. This is not the case when applying
$n=0,m=0$
mode is untouched. This is not the case when applying
 $\hat{{\mathcal{F}}}$
.
$\hat{{\mathcal{F}}}$
.
We consistently apply the Fourier filter on both sides of the discretised quasi-neutrality equation and Ampère’s law, e.g. in the Hamiltonian formulation (compare with (7.14) and (7.21)) we solve
 $$\begin{eqnarray}\displaystyle & \displaystyle \unicode[STIX]{x1D64C}\boldsymbol{c}=\hat{{\mathcal{F}}}[\unicode[STIX]{x1D739}\bar{\boldsymbol{n}}_{\text{i}}^{\text{h},\text{lin}}]+\hat{{\mathcal{F}}}[\unicode[STIX]{x1D739}\boldsymbol{n}_{\text{e}}^{\text{h},\text{lin}}]+(\bar{\unicode[STIX]{x1D64F}}_{1\text{i}}+C_{\text{v1e}}\unicode[STIX]{x1D64F}_{\text{e}})\hat{\boldsymbol{d}}, & \displaystyle\end{eqnarray}$$
 $$\begin{eqnarray}\displaystyle & \displaystyle \boldsymbol{A}^{\text{h},\text{lin}}\boldsymbol{d}=\hat{{\mathcal{F}}}[\unicode[STIX]{x1D739}\bar{\boldsymbol{j}}_{\Vert \text{i}}^{\,\text{h},\text{lin}}]+\hat{{\mathcal{F}}}[\unicode[STIX]{x1D739}\boldsymbol{j}_{\Vert \text{e}}^{\text{h},\text{lin}}] & \displaystyle\end{eqnarray}$$
and then apply the Fourier filter on the solution vectors
 $\boldsymbol{c}$
and
$\boldsymbol{c}$
and
 $\boldsymbol{d}$
:
$\boldsymbol{d}$
:
 $$\begin{eqnarray}\hat{\boldsymbol{c}}={\mathcal{F}}[\boldsymbol{c}],\quad \hat{\boldsymbol{d}}={\mathcal{F}}[\boldsymbol{d}].\end{eqnarray}$$
The filtering on the right-hand side is done to suppress especially noise which stems from the charge and current assignments. In addition, the filtering on the left-hand side should suppress modes outside the filter which have been formed during the solving of the matrix equation by geometric coupling. Although the Fourier filter can significantly suppress the noise, it is not able to filter out any noise which has found its way into the physical modes via the unavoidable geometrical coupling or via aliasing among the unfiltered modes. Regarding the last point, the larger the extent of the B-splines and thus their order, the smaller the aliasing effect becomes. At last the orthogonal Fourier basis would completely suppress aliasing between Fourier modes for the price of having global basis functions. Although the Fourier filtering of the coefficient vector of the density and current is not equivalent to Fourier filtering the density and current itself, it is an easy way to suppress most of the contribution of the high-frequency modes.
Note that the so-called ‘Fourier solver’ proposed in McMillan et al. (Reference McMillan, Jolliet, Bottino, Angelino, Tran and Villard2010) includes the Fourier filter in a natural way and does not need special handling of the charge- and current-assignment vectors. Thus, there is no problem due to filtering with the particle number conservation.
10 Marker discretisation of reduced phase space
At initialisation we draw the independent random sample to locate our
 $N_{\text{p}}$
markers within reduced phase space by a low-discrepancy sequence, i.e. the Hammersley sequence (Hammersley Reference Hammersley1960).
$N_{\text{p}}$
markers within reduced phase space by a low-discrepancy sequence, i.e. the Hammersley sequence (Hammersley Reference Hammersley1960).
As discussed in § 2, the variance and thus the statistical error depends on the marker distribution function
 $g$
. Many PIC codes choose a so called ‘importance sampling’ where the marker distribution function is proportional to the background distribution function
$g$
. Many PIC codes choose a so called ‘importance sampling’ where the marker distribution function is proportional to the background distribution function
 $f_{0}$
. As a consequence, the weights of the markers are constant. However, in our situation importance sampling is not optimal for two reasons. It reduces explicitly the statistical error of the charge assignment, but not of the current assignment (see § 6.1). And it is not in alignment with the control variates method, where the perturbed weights of the markers depend implicitly on time (see (5.1)) and thus are not constant.
$f_{0}$
. As a consequence, the weights of the markers are constant. However, in our situation importance sampling is not optimal for two reasons. It reduces explicitly the statistical error of the charge assignment, but not of the current assignment (see § 6.1). And it is not in alignment with the control variates method, where the perturbed weights of the markers depend implicitly on time (see (5.1)) and thus are not constant.
10.1 Marker distribution in the velocity sphere
As already mentioned in § 4.3, the markers are distributed in reduced velocity space
 $(v_{\Vert },v_{\bot })$
initially within the limits of a semicircle parametrised by the coordinates. For each species
$(v_{\Vert },v_{\bot })$
initially within the limits of a semicircle parametrised by the coordinates. For each species
 $s$
a semicircle is centred around
$s$
a semicircle is centred around
 $(\hat{u} _{0s},0)$
and its radius is given by
$(\hat{u} _{0s},0)$
and its radius is given by
 $v_{\text{max}s}$
. At initialisation we have
$v_{\text{max}s}$
. At initialisation we have
 $\unicode[STIX]{x1D6FF}A_{\Vert }(t_{0})=0$
and therefore do not make the distinction between
$\unicode[STIX]{x1D6FF}A_{\Vert }(t_{0})=0$
and therefore do not make the distinction between
 $v_{\Vert }$
- and
$v_{\Vert }$
- and
 $\tilde{p}_{\Vert }$
-coordinates as it is
$\tilde{p}_{\Vert }$
-coordinates as it is
 $\tilde{p}_{\Vert }(t_{0})=v_{\Vert }(t_{0})$
.
$\tilde{p}_{\Vert }(t_{0})=v_{\Vert }(t_{0})$
.
The Jacobian
 ${\mathcal{J}}_{\text{red}}$
of the reduced velocity space
${\mathcal{J}}_{\text{red}}$
of the reduced velocity space
 $(\,\tilde{p}_{\Vert },v_{\bot })$
 $$\begin{eqnarray}{\mathcal{J}}_{\text{red}}\stackrel{\text{def}}{=}2\unicode[STIX]{x03C0}\frac{B_{\Vert }^{\ast \text{h}}}{B}v_{\bot }\end{eqnarray}$$
can be derived from
 $$\begin{eqnarray}B_{\Vert }^{\ast \text{h}}\,\text{d}^{3}p=B_{\Vert }^{\ast \text{h}}\,\text{d}\tilde{p}_{\Vert }\,\text{d}\tilde{\unicode[STIX]{x1D707}}\,\text{d}\unicode[STIX]{x1D6FC}\simeq 2\unicode[STIX]{x03C0}\frac{B_{\Vert }^{\ast \text{h}}}{B}v_{\bot }\,\text{d}\tilde{p}_{\Vert }\,\text{d}v_{\bot }={\mathcal{J}}_{\text{red}}\,\text{d}\tilde{p}_{\Vert }\,\text{d}v_{\bot }.\end{eqnarray}$$
For the marker distribution function
 $g$
it is convenient to use the following ansatz:
$g$
it is convenient to use the following ansatz:
 $$\begin{eqnarray}g=\frac{1}{{\mathcal{J}}_{\text{red}}}g_{1}(\boldsymbol{R})g_{2}(\,\tilde{p}_{\Vert },v_{\bot }).\end{eqnarray}$$
If this ansatz is set into the normalisation condition of the marker distribution function, equation (2.2), we get:
 $$\begin{eqnarray}\int _{\unicode[STIX]{x1D6FA}}g\,{\mathcal{J}}_{\text{red}}\,\text{d}\boldsymbol{R}\,\text{d}\tilde{p}_{\Vert }\,\text{d}v_{\bot }=\int g_{1}(\boldsymbol{R})\,\text{d}\boldsymbol{R}\int g_{2}(\,\tilde{p}_{\Vert },v_{\bot })\,\text{d}\tilde{p}_{\Vert }\,\text{d}v_{\bot }=1.\end{eqnarray}$$
For
 $g_{2}=1$
we achieve a uniform loading in the reduced velocity space and for
$g_{2}=1$
we achieve a uniform loading in the reduced velocity space and for
 $g_{2}=v_{\bot }$
a uniform loading in the whole velocity sphere (Hatzky et al.
Reference Hatzky, Tran, Könies, Kleiber and Allfrey2002).
$g_{2}=v_{\bot }$
a uniform loading in the whole velocity sphere (Hatzky et al.
Reference Hatzky, Tran, Könies, Kleiber and Allfrey2002).
The ansatz, equation (10.3), gives us the opportunity to fulfil the normalisation condition by normalising the integral over
 $g_{1}(\boldsymbol{R})$
and
$g_{1}(\boldsymbol{R})$
and
 $g_{2}(\,\tilde{p}_{\Vert },v_{\bot })$
separately to one. This makes the loading procedure of the markers much easier as the markers can be distributed separately in configuration and reduced velocity space. The distribution of the markers in reduced velocity space
$g_{2}(\,\tilde{p}_{\Vert },v_{\bot })$
separately to one. This makes the loading procedure of the markers much easier as the markers can be distributed separately in configuration and reduced velocity space. The distribution of the markers in reduced velocity space
 $g_{2}$
does not depend on
$g_{2}$
does not depend on
 ${\mathcal{J}}_{\text{red}}$
any more. Due to (2.10), the phase-space volume
${\mathcal{J}}_{\text{red}}$
any more. Due to (2.10), the phase-space volume
 $\unicode[STIX]{x1D6FA}_{p}$
of each marker
$\unicode[STIX]{x1D6FA}_{p}$
of each marker
 $p$
is proportional to
$p$
is proportional to
 ${\mathcal{J}}_{\text{red}}$
. Vice versa, an ansatz of the marker distribution function without the factor
${\mathcal{J}}_{\text{red}}$
. Vice versa, an ansatz of the marker distribution function without the factor
 $1/{\mathcal{J}}_{\text{red}}$
would lead to a more complex distribution procedure of the markers, but for the benefit of having the phase-space volumes of the markers being independent of
$1/{\mathcal{J}}_{\text{red}}$
would lead to a more complex distribution procedure of the markers, but for the benefit of having the phase-space volumes of the markers being independent of
 ${\mathcal{J}}_{\text{red}}$
.
${\mathcal{J}}_{\text{red}}$
.
10.2 Marker distribution in configuration space
In configuration space, the markers are distributed by
 $g_{1}(\boldsymbol{R})$
within the limits of the physical device. However, there are two issues which are addressed in the following subsections.
$g_{1}(\boldsymbol{R})$
within the limits of the physical device. However, there are two issues which are addressed in the following subsections.
10.2.1 Linear tokamak simulation
For linear tokamak simulation the markers are only distributed within the poloidal
 $(R,Z)$
-plane (see appendix C). In such a case, the reduced phase space is only four-dimensional with the corresponding Jacobian
$(R,Z)$
-plane (see appendix C). In such a case, the reduced phase space is only four-dimensional with the corresponding Jacobian
 $$\begin{eqnarray}\tilde{{\mathcal{J}}}_{\text{red}}\stackrel{\text{def}}{=}(2\unicode[STIX]{x03C0})^{2}R\frac{B_{\Vert }^{\ast \text{h}}}{B}v_{\bot }.\end{eqnarray}$$
However, we use instead the reduced Jacobian
 ${\mathcal{J}}_{\text{red}}$
being defined by (10.1) for the definition of our marker distribution function, as it is done in (10.3). Hence, for a spatially uniform marker distribution, i.e.
${\mathcal{J}}_{\text{red}}$
being defined by (10.1) for the definition of our marker distribution function, as it is done in (10.3). Hence, for a spatially uniform marker distribution, i.e.
 $g_{1}(\boldsymbol{R})=1$
, the phase-space volume
$g_{1}(\boldsymbol{R})=1$
, the phase-space volume
 $\unicode[STIX]{x1D6FA}_{p}$
of each marker
$\unicode[STIX]{x1D6FA}_{p}$
of each marker
 $p$
is independent of the spatial position, i.e. the factor
$p$
is independent of the spatial position, i.e. the factor
 $R$
, when loading the markers. As a result, more markers are distributed at the outer side (low field side) of the poloidal plane. This has the advantage that the weights originating from the outer side do not have a systematically larger phase-space volume and thus larger weights when calculating the moments of the distribution function. So finally, the variance of the weight distribution and with it the statistical error are diminished.
$R$
, when loading the markers. As a result, more markers are distributed at the outer side (low field side) of the poloidal plane. This has the advantage that the weights originating from the outer side do not have a systematically larger phase-space volume and thus larger weights when calculating the moments of the distribution function. So finally, the variance of the weight distribution and with it the statistical error are diminished.
10.2.2 Marker distribution close to the origin
In case of e.g. a tokamak, the magnetic coordinates
 $(s,\unicode[STIX]{x1D717})$
(see appendix C) can be approximated close to the origin by a polar coordinate system. For the finite element discretisation of the potential equations, which uses the magnetic coordinates (Fivaz et al.
Reference Fivaz, Brunner, de Ridder, Sauter, Tran, Vaclavik and Villard1998), the Jacobian can be approximated by
$(s,\unicode[STIX]{x1D717})$
(see appendix C) can be approximated close to the origin by a polar coordinate system. For the finite element discretisation of the potential equations, which uses the magnetic coordinates (Fivaz et al.
Reference Fivaz, Brunner, de Ridder, Sauter, Tran, Vaclavik and Villard1998), the Jacobian can be approximated by
 ${\mathcal{J}}_{x}\approx s$
close to the origin. Hence, the area which the finite elements cover becomes smaller and smaller the closer they are located to the origin. This goes hand in hand with a smaller number of markers being projected onto these B-splines in the charge and current assignments. Naturally, the statistical error increases. In other words, due to the coordinate system we try to resolve very fine structures close to the origin which are not well enough resolved by the markers. This has especially a negative effect on the precision of the transformation of the weights (see § 3.2) which relies on a low statistical error of
${\mathcal{J}}_{x}\approx s$
close to the origin. Hence, the area which the finite elements cover becomes smaller and smaller the closer they are located to the origin. This goes hand in hand with a smaller number of markers being projected onto these B-splines in the charge and current assignments. Naturally, the statistical error increases. In other words, due to the coordinate system we try to resolve very fine structures close to the origin which are not well enough resolved by the markers. This has especially a negative effect on the precision of the transformation of the weights (see § 3.2) which relies on a low statistical error of
 $\unicode[STIX]{x1D6FF}A_{\Vert }$
. Thus, a large statistical error would limit the resolution of the transformation. In addition, the convergence of the iterative solver would suffer too.
$\unicode[STIX]{x1D6FF}A_{\Vert }$
. Thus, a large statistical error would limit the resolution of the transformation. In addition, the convergence of the iterative solver would suffer too.
Therefore, we modify the spatial part of the marker distribution function in the following way:
 $$\begin{eqnarray}\tilde{g}_{1}(s,\unicode[STIX]{x1D717})=\left\{\begin{array}{@{}ll@{}}g_{1}(s,\unicode[STIX]{x1D717}) & \text{for }s\geqslant s_{0}\\ g_{1}(s,\unicode[STIX]{x1D717}){\mathcal{J}}_{x}(s_{0},\unicode[STIX]{x1D717})/{\mathcal{J}}_{x}(s,\unicode[STIX]{x1D717}) & \text{for }s<s_{0}\quad \text{and}\quad s\geqslant \unicode[STIX]{x1D716}\\ g_{1}(s,\unicode[STIX]{x1D717}){\mathcal{J}}_{x}(s_{0},\unicode[STIX]{x1D717})/{\mathcal{J}}_{x}(\unicode[STIX]{x1D716},\unicode[STIX]{x1D717}) & \text{for }s<\unicode[STIX]{x1D716}\end{array}\right.\end{eqnarray}$$
in order to keep the number of markers per B-spline more constant as soon as
 $s<s_{0}$
. For
$s<s_{0}$
. For
 $\unicode[STIX]{x1D717}$
-pinch and tokamak simulations typical numerical parameters are
$\unicode[STIX]{x1D717}$
-pinch and tokamak simulations typical numerical parameters are
 $s_{0}=0.3$
and
$s_{0}=0.3$
and
 $\unicode[STIX]{x1D716}=10^{-9}$
.
$\unicode[STIX]{x1D716}=10^{-9}$
.
10.3 Marker initialisation
An appropriate initialisation of the simulation is especially important when damped modes as e.g. MHD modes should be simulated within the gyrokinetic model. In such a case, it is beneficial if the envisaged MHD mode can be precalculated within a pure MHD model. In one approach, we use the obtained information of the electrostatic and magnetic potentials as an initial guess of
 $\unicode[STIX]{x1D6FF}\unicode[STIX]{x1D719}(t_{0})$
and
$\unicode[STIX]{x1D6FF}\unicode[STIX]{x1D719}(t_{0})$
and
 $\unicode[STIX]{x1D6FF}A_{\Vert }(t_{0})$
to push the markers at the initial pushing step.
$\unicode[STIX]{x1D6FF}A_{\Vert }(t_{0})$
to push the markers at the initial pushing step.
In another approach, we set
 $\unicode[STIX]{x1D6FF}w_{\text{i}}(t_{0})=0$
and initialise only the perturbed weights
$\unicode[STIX]{x1D6FF}w_{\text{i}}(t_{0})=0$
and initialise only the perturbed weights
 $\unicode[STIX]{x1D6FF}w_{\text{e}}(t_{0})$
of the electrons by using the unshifted Maxwellian (3.10) where
$\unicode[STIX]{x1D6FF}w_{\text{e}}(t_{0})$
of the electrons by using the unshifted Maxwellian (3.10) where
 $\hat{u} _{0}=0$
. With this choice we imply
$\hat{u} _{0}=0$
. With this choice we imply
 $\unicode[STIX]{x1D6FF}A_{\Vert }(t_{0})=0$
. As perturbed density
$\unicode[STIX]{x1D6FF}A_{\Vert }(t_{0})=0$
. As perturbed density
 $\unicode[STIX]{x1D6FF}n_{\text{e}}$
we use the electrostatic potential of the MHD mode obtained by the pure MHD model. Usually, it is sufficient to use just its dominant Fourier mode. It is important that initially the perturbed weights of the ions are set to zero. So they can adjust themselves in the first pushing step to the potential being calculated initially from the perturbed weights of the electrons. A bad choice seems to be to initialise also the perturbed weights of the ions by the unshifted Maxwellian. Such simulations need a very long time to evolve a damped mode if at all.
$\unicode[STIX]{x1D6FF}n_{\text{e}}$
we use the electrostatic potential of the MHD mode obtained by the pure MHD model. Usually, it is sufficient to use just its dominant Fourier mode. It is important that initially the perturbed weights of the ions are set to zero. So they can adjust themselves in the first pushing step to the potential being calculated initially from the perturbed weights of the electrons. A bad choice seems to be to initialise also the perturbed weights of the ions by the unshifted Maxwellian. Such simulations need a very long time to evolve a damped mode if at all.
The initialisation for unstable modes is usually uncritical as the mode can evolve directly out of the noise if necessary. Under these circumstances the mode is not likely to be swamped by the inherent statistical noise of the PIC simulation.
10.4 Boundary conditions for the weights of the markers
In a physical picture the phase space is divided into phase-space volumes
 $\unicode[STIX]{x1D6FA}_{p}$
defined by (2.10) which are carried around by each marker
$\unicode[STIX]{x1D6FA}_{p}$
defined by (2.10) which are carried around by each marker
 $p$
. Unfortunately, markers can leave the configuration and velocity space and take their phase-space volume with them. Such a marker has to be replaced in a consistent way to guarantee a constant in- and outflow of phase-space volumes
$p$
. Unfortunately, markers can leave the configuration and velocity space and take their phase-space volume with them. Such a marker has to be replaced in a consistent way to guarantee a constant in- and outflow of phase-space volumes
 $\unicode[STIX]{x1D6FA}_{p}$
over the surface of our simulation domain (Hamiltonian flow) to ensure that no ‘holes’ evolve in phase space, i.e. the total phase-space volume is conserved. In other words, the integral of the marker distribution function
$\unicode[STIX]{x1D6FA}_{p}$
over the surface of our simulation domain (Hamiltonian flow) to ensure that no ‘holes’ evolve in phase space, i.e. the total phase-space volume is conserved. In other words, the integral of the marker distribution function
 $g$
over phase space always has to give unity as we assume in (2.2).
$g$
over phase space always has to give unity as we assume in (2.2).
10.4.1 Initialisation of the position of a replacement marker
Where to insert a ‘replacement marker’ for a marker which has left the configuration space depends on a lot of numerical parameters like e.g. the accuracy of the equilibrium magnetic field. To do it in an optimal way is a complex issue. We want to give here only a few guidelines. In principle, a replacement marker should be inserted at a phase-space position which conserves the magnetic moment per unit mass
 $\tilde{\unicode[STIX]{x1D707}}$
and the energy per unit mass
$\tilde{\unicode[STIX]{x1D707}}$
and the energy per unit mass
 $\tilde{E}$
of the lost marker. In addition, the marker should be inserted close to the edge but should not get immediately lost again. To achieve this goal certain symmetries of the configuration might be beneficial. For tokamaks some equilibria have the so-called ‘up–down symmetry’ which has to be taken into account when inserting the replacement marker. And for stellarators the so-called ‘stellarator symmetry’ can be exploited for the initial position of the replacement marker.
$\tilde{E}$
of the lost marker. In addition, the marker should be inserted close to the edge but should not get immediately lost again. To achieve this goal certain symmetries of the configuration might be beneficial. For tokamaks some equilibria have the so-called ‘up–down symmetry’ which has to be taken into account when inserting the replacement marker. And for stellarators the so-called ‘stellarator symmetry’ can be exploited for the initial position of the replacement marker.
10.4.2 Initialisation of the weight of a replacement marker
In the symplectic formulation, the weight of a replacement marker is chosen to be consistent with the background distribution function
 $f_{0}$
at its initial position
$f_{0}$
at its initial position
 $\boldsymbol{z}_{\text{init}}$
. Consequently, in a full-
$\boldsymbol{z}_{\text{init}}$
. Consequently, in a full-
 $f$
scheme the value of the weight of a replacement marker has to be:
$f$
scheme the value of the weight of a replacement marker has to be:
 $$\begin{eqnarray}w_{\text{rep}}^{\text{s}}(\boldsymbol{z}_{\text{init}})=\frac{f_{0}(v_{\Vert })}{g^{\text{s}}}.\end{eqnarray}$$
From this, it follows for the perturbed weight of the replacement marker:
 $$\begin{eqnarray}\unicode[STIX]{x1D6FF}w_{\text{rep}}^{\text{s}}(\boldsymbol{z}_{\text{init}})=0.\end{eqnarray}$$
However, particle number conservation will be violated as in general it is
 $\unicode[STIX]{x1D6FF}w_{\text{lost}}^{\text{s}}\neq 0$
.
$\unicode[STIX]{x1D6FF}w_{\text{lost}}^{\text{s}}\neq 0$
.
In the Hamiltonian formulation, equation (10.7) translates to
 $$\begin{eqnarray}w_{\text{rep}}^{\text{h}}(\boldsymbol{z}_{\text{init}})=\frac{f_{0}\left(\,\tilde{p}_{\Vert }-{\displaystyle \frac{q}{m}}\langle \unicode[STIX]{x1D6FF}A_{\Vert }\rangle \right)}{g^{\text{h}}},\end{eqnarray}$$
which gives a non-zero perturbed weight of
 $$\begin{eqnarray}\unicode[STIX]{x1D6FF}w_{\text{rep}}^{\text{h}}(\boldsymbol{z}_{\text{init}})=\frac{f_{0}\left(\,\tilde{p}_{\Vert }-{\displaystyle \frac{q}{m}}\langle \unicode[STIX]{x1D6FF}A_{\Vert }\rangle \right)-f_{0}(\,\tilde{p}_{\Vert })}{g^{\text{h}}}.\end{eqnarray}$$
Instead of resetting the weight of the replacement marker, we can just keep it from the lost marker if certain symmetry conditions are given as pointed out in the previous section.
11 The MHD limit
As MHD limit we understand here the limit of
 $k_{\bot }\unicode[STIX]{x1D70C}\rightarrow 0$
.
$k_{\bot }\unicode[STIX]{x1D70C}\rightarrow 0$
.
11.1 Implementation of MHD limit
The parallel dynamics in the symplectic formulation, equation (3.4), contains in the first line a linearised expression for the parallel electric field perturbation:
 $$\begin{eqnarray}\frac{\unicode[STIX]{x2202}\langle \unicode[STIX]{x1D6FF}A_{\Vert }\rangle }{\unicode[STIX]{x2202}t}+\boldsymbol{b}\boldsymbol{\cdot }\unicode[STIX]{x1D735}\langle \unicode[STIX]{x1D6FF}\unicode[STIX]{x1D719}\rangle =\langle \unicode[STIX]{x1D6FF}\boldsymbol{E}_{\Vert }^{\text{lin}}\rangle .\end{eqnarray}$$
The resulting acceleration in the parallel dynamics scales with the charge to mass ratio and is much more pronounced for the electrons than for the ions. However, there is no gyro-averaging for the electrons in our model equations.
In the MHD limit, the parallel electric field perturbation vanishes, i.e.
 $\unicode[STIX]{x1D6FF}\boldsymbol{E}_{\Vert }=0$
, which is also called the ideal Ohm’s law:
$\unicode[STIX]{x1D6FF}\boldsymbol{E}_{\Vert }=0$
, which is also called the ideal Ohm’s law:
 $$\begin{eqnarray}\frac{\unicode[STIX]{x2202}\unicode[STIX]{x1D6FF}A_{\Vert }}{\unicode[STIX]{x2202}t}+\boldsymbol{b}\boldsymbol{\cdot }\unicode[STIX]{x1D735}\unicode[STIX]{x1D6FF}\unicode[STIX]{x1D719}=0.\end{eqnarray}$$
This means that both terms on the left-hand side cancel exactly, which has to be kept by the discretisation. If not, a spurious parallel electric field is introduced. Nevertheless, it is also present for the parallel dynamics in the Hamiltonian formulation as it is inherited by (3.32).
For general coordinate systems – like magnetic coordinates – the gradient of
 $\unicode[STIX]{x1D6FF}\unicode[STIX]{x1D719}$
is expressed in the contravariant basis
$\unicode[STIX]{x1D6FF}\unicode[STIX]{x1D719}$
is expressed in the contravariant basis
 $\{\unicode[STIX]{x1D735}s,\unicode[STIX]{x1D735}\unicode[STIX]{x1D711},\unicode[STIX]{x1D735}\unicode[STIX]{x1D717}\}$
as
$\{\unicode[STIX]{x1D735}s,\unicode[STIX]{x1D735}\unicode[STIX]{x1D711},\unicode[STIX]{x1D735}\unicode[STIX]{x1D717}\}$
as
 $$\begin{eqnarray}\unicode[STIX]{x1D735}\unicode[STIX]{x1D6FF}\unicode[STIX]{x1D719}=\frac{\unicode[STIX]{x2202}\unicode[STIX]{x1D6FF}\unicode[STIX]{x1D719}}{\unicode[STIX]{x2202}s}\unicode[STIX]{x1D735}s+\frac{\unicode[STIX]{x2202}\unicode[STIX]{x1D6FF}\unicode[STIX]{x1D719}}{\unicode[STIX]{x2202}\unicode[STIX]{x1D717}}\unicode[STIX]{x1D735}\unicode[STIX]{x1D717}+\frac{\unicode[STIX]{x2202}\unicode[STIX]{x1D6FF}\unicode[STIX]{x1D719}}{\unicode[STIX]{x2202}\unicode[STIX]{x1D711}}\unicode[STIX]{x1D735}\unicode[STIX]{x1D711}.\end{eqnarray}$$
In § 7 we have introduced B-splines as finite elements to represent e.g. the perturbed electrostatic or magnetic potential (compare with (7.1)):
 $$\begin{eqnarray}\displaystyle & \displaystyle \unicode[STIX]{x1D6FF}\unicode[STIX]{x1D719}(\boldsymbol{R})=\mathop{\sum }_{ijk}c_{ijk}\unicode[STIX]{x1D6EC}_{i}^{d}(s)\unicode[STIX]{x1D6EC}_{j}^{d}(\unicode[STIX]{x1D717})\unicode[STIX]{x1D6EC}_{k}^{d}(\unicode[STIX]{x1D711}), & \displaystyle\end{eqnarray}$$
 $$\begin{eqnarray}\displaystyle & \displaystyle \unicode[STIX]{x1D6FF}A_{\Vert }(\boldsymbol{R})=\mathop{\sum }_{ijk}d_{ijk}\unicode[STIX]{x1D6EC}_{i}^{d}(s)\unicode[STIX]{x1D6EC}_{j}^{d}(\unicode[STIX]{x1D717})\unicode[STIX]{x1D6EC}_{k}^{d}(\unicode[STIX]{x1D711})\quad \text{with }d\geqslant 1. & \displaystyle\end{eqnarray}$$
From this, it is straightforward to discretise the first term of (11.2):
 $$\begin{eqnarray}\frac{\unicode[STIX]{x2202}\unicode[STIX]{x1D6FF}A_{\Vert }}{\unicode[STIX]{x2202}t}\simeq \mathop{\sum }_{ijk}\frac{\unicode[STIX]{x2202}d_{ijk}}{\unicode[STIX]{x2202}t}\unicode[STIX]{x1D6EC}_{i}^{d}(s)\unicode[STIX]{x1D6EC}_{j}^{d}(\unicode[STIX]{x1D717})\unicode[STIX]{x1D6EC}_{k}^{d}(\unicode[STIX]{x1D711}).\end{eqnarray}$$
In magnetic coordinates the unit vector of the magnetic field
 $\boldsymbol{b}$
has no component in the
$\boldsymbol{b}$
has no component in the
 $s$
-direction, i.e.
$s$
-direction, i.e.
 $\boldsymbol{b}\boldsymbol{\cdot }\unicode[STIX]{x1D735}s=0$
. Thus, the B-spline representation of the parallel gradient
$\boldsymbol{b}\boldsymbol{\cdot }\unicode[STIX]{x1D735}s=0$
. Thus, the B-spline representation of the parallel gradient
 $\unicode[STIX]{x1D735}_{\Vert }\unicode[STIX]{x1D6FF}\unicode[STIX]{x1D719}$
is encoded only in the following two components:
$\unicode[STIX]{x1D735}_{\Vert }\unicode[STIX]{x1D6FF}\unicode[STIX]{x1D719}$
is encoded only in the following two components:
 $$\begin{eqnarray}\displaystyle & \displaystyle \frac{\unicode[STIX]{x2202}\unicode[STIX]{x1D6FF}\unicode[STIX]{x1D719}}{\unicode[STIX]{x2202}\unicode[STIX]{x1D717}}=\mathop{\sum }_{ijk}\frac{c_{ijk}-c_{ij-1k}}{\unicode[STIX]{x0394}\unicode[STIX]{x1D717}}\unicode[STIX]{x1D6EC}_{i}^{d}(s)\unicode[STIX]{x1D6EC}_{j}^{d-1}(\unicode[STIX]{x1D717})\unicode[STIX]{x1D6EC}_{k}^{d}(\unicode[STIX]{x1D711}), & \displaystyle\end{eqnarray}$$
 $$\begin{eqnarray}\displaystyle & \displaystyle \frac{\unicode[STIX]{x2202}\unicode[STIX]{x1D6FF}\unicode[STIX]{x1D719}}{\unicode[STIX]{x2202}\unicode[STIX]{x1D711}}=\mathop{\sum }_{ijk}\frac{c_{ijk}-c_{ijk-1}}{\unicode[STIX]{x0394}\unicode[STIX]{x1D711}}\unicode[STIX]{x1D6EC}_{i}^{d}(s)\unicode[STIX]{x1D6EC}_{j}^{d}(\unicode[STIX]{x1D717})\unicode[STIX]{x1D6EC}_{k}^{d-1}(\unicode[STIX]{x1D711}). & \displaystyle\end{eqnarray}$$
Note that the B-spline order is decremented in the direction of the partial derivative of the gradient. So the B-spline discretisation of the second term of (11.2) is:
 $$\begin{eqnarray}\displaystyle \boldsymbol{b}\boldsymbol{\cdot }\unicode[STIX]{x1D735}\unicode[STIX]{x1D6FF}\unicode[STIX]{x1D719} & = & \displaystyle \mathop{\sum }_{ijk}\frac{c_{ijk}-c_{ij-1k}}{\unicode[STIX]{x0394}\unicode[STIX]{x1D717}}\boldsymbol{b}\boldsymbol{\cdot }\unicode[STIX]{x1D735}\unicode[STIX]{x1D717}\,\unicode[STIX]{x1D6EC}_{i}^{d}(s)\unicode[STIX]{x1D6EC}_{j}^{d-1}(\unicode[STIX]{x1D717})\unicode[STIX]{x1D6EC}_{k}^{d}(\unicode[STIX]{x1D711})\nonumber\\ \displaystyle & & \displaystyle +\,\mathop{\sum }_{ijk}\frac{c_{ijk}-c_{ijk-1}}{\unicode[STIX]{x0394}\unicode[STIX]{x1D711}}\boldsymbol{b}\boldsymbol{\cdot }\unicode[STIX]{x1D735}\unicode[STIX]{x1D711}\,\unicode[STIX]{x1D6EC}_{i}^{d}(s)\unicode[STIX]{x1D6EC}_{j}^{d}(\unicode[STIX]{x1D717})\unicode[STIX]{x1D6EC}_{k}^{d-1}(\unicode[STIX]{x1D711}).\end{eqnarray}$$
One sees immediately that the approximating B-spline spaces of the terms (11.6) and (11.9) do not match. Thus, equation (11.2) will not be correctly implemented in the MHD limit due to not matching residuals in the B-spline approximation. However, the B-spline approximation of the term (11.9) can be represented as such by the B-spline basis
 $\unicode[STIX]{x1D6EC}_{i}^{d}(s)\unicode[STIX]{x1D6EC}_{j}^{d}(\unicode[STIX]{x1D717})\unicode[STIX]{x1D6EC}_{k}^{d}(\unicode[STIX]{x1D711})$
again. To do so, it is projected via scalar product onto the B-spline basis to construct the load vector
$\unicode[STIX]{x1D6EC}_{i}^{d}(s)\unicode[STIX]{x1D6EC}_{j}^{d}(\unicode[STIX]{x1D717})\unicode[STIX]{x1D6EC}_{k}^{d}(\unicode[STIX]{x1D711})$
again. To do so, it is projected via scalar product onto the B-spline basis to construct the load vector
 $\tilde{\boldsymbol{b}}_{\text{Ohm}}$
(compare with (7.6))
$\tilde{\boldsymbol{b}}_{\text{Ohm}}$
(compare with (7.6))
 $$\begin{eqnarray}\tilde{b}_{ijk\text{Ohm}}=(\boldsymbol{b}\boldsymbol{\cdot }\unicode[STIX]{x1D735}\unicode[STIX]{x1D6FF}\unicode[STIX]{x1D719},\unicode[STIX]{x1D6EC}_{i}^{d}(s)\unicode[STIX]{x1D6EC}_{j}^{d}(\unicode[STIX]{x1D717})\unicode[STIX]{x1D6EC}_{k}^{d}(\unicode[STIX]{x1D711}))\end{eqnarray}$$
and to solve for the B-spline coefficient vector
 $\boldsymbol{e}$
by the matrix equation:
$\boldsymbol{e}$
by the matrix equation:
 $$\begin{eqnarray}\boldsymbol{e}=\unicode[STIX]{x1D648}^{-1}\tilde{\boldsymbol{b}}_{\text{Ohm}}.\end{eqnarray}$$
As a result, the B-spline discretisation of (11.2) is now consistent in the same B-spline space:
 $$\begin{eqnarray}\mathop{\sum }_{ijk}\left(\frac{\unicode[STIX]{x2202}d_{ijk}}{\unicode[STIX]{x2202}t}+e_{ijk}\right)\unicode[STIX]{x1D6EC}_{i}^{d}(s)\unicode[STIX]{x1D6EC}_{j}^{d}(\unicode[STIX]{x1D717})\unicode[STIX]{x1D6EC}_{k}^{d}(\unicode[STIX]{x1D711})=0.\end{eqnarray}$$
Thus, we can implement our physical requirement, which is a vanishing parallel electric field in the MHD limit, on the numerical level. Otherwise, we would risk the build-up of an artificial parallel electric field on the spatial scale of the residual, i.e. the spatial scale of the B-splines themselves. This would excite spurious modes. To avoid this, we have to add a correction term to the discretised parallel dynamics in the symplectic formulation, equation (3.4), and also in the Hamiltonian formulation, equations (3.54) and (3.72). The additional term is given by
 $$\begin{eqnarray}\displaystyle \unicode[STIX]{x0394}E_{\Vert s} & = & \displaystyle -\frac{q_{s}}{m_{s}}\left[\mathop{\sum }_{ijk}e_{ijk}\unicode[STIX]{x1D6EC}_{i}^{d}(s)\unicode[STIX]{x1D6EC}_{j}^{d}(\unicode[STIX]{x1D717})\unicode[STIX]{x1D6EC}_{k}^{d}(\unicode[STIX]{x1D711})\right.\nonumber\\ \displaystyle & & \displaystyle -\,\mathop{\sum }_{ijk}\frac{c_{ijk}-c_{ij-1k}}{\unicode[STIX]{x0394}\unicode[STIX]{x1D717}}\boldsymbol{b}\boldsymbol{\cdot }\unicode[STIX]{x1D735}\unicode[STIX]{x1D717}\,\unicode[STIX]{x1D6EC}_{i}^{d}(s)\unicode[STIX]{x1D6EC}_{j}^{d-1}(\unicode[STIX]{x1D717})\unicode[STIX]{x1D6EC}_{k}^{d}(\unicode[STIX]{x1D711})\nonumber\\ \displaystyle & & \displaystyle \left.-\,\mathop{\sum }_{ijk}\frac{c_{ijk}-c_{ijk-1}}{\unicode[STIX]{x0394}\unicode[STIX]{x1D711}}\boldsymbol{b}\boldsymbol{\cdot }\unicode[STIX]{x1D735}\unicode[STIX]{x1D711}\,\unicode[STIX]{x1D6EC}_{i}^{d}(s)\unicode[STIX]{x1D6EC}_{j}^{d}(\unicode[STIX]{x1D717})\unicode[STIX]{x1D6EC}_{k}^{d-1}(\unicode[STIX]{x1D711})\right].\end{eqnarray}$$
If the correction term also improves the energy conservation property in nonlinear simulation has to be further investigated.
11.2 Special case of an unsheared slab
A field aligned coordinate system is easy to establish for an unsheared slab geometry. In our case, we choose the
 $z$
-axis to be aligned with the magnetic field vector
$z$
-axis to be aligned with the magnetic field vector
 $\boldsymbol{b}$
. Thus, it becomes possible to discretise the ideal Ohm’s law without using the projection introduced in the previous section (see (11.11)). To achieve this goal we choose two different B-spline representations for the perturbed electrostatic and magnetic potentials:
$\boldsymbol{b}$
. Thus, it becomes possible to discretise the ideal Ohm’s law without using the projection introduced in the previous section (see (11.11)). To achieve this goal we choose two different B-spline representations for the perturbed electrostatic and magnetic potentials:
 $$\begin{eqnarray}\displaystyle & \displaystyle \unicode[STIX]{x1D6FF}\unicode[STIX]{x1D719}(\boldsymbol{R})=\mathop{\sum }_{ijk}c_{ijk}\unicode[STIX]{x1D6EC}_{i}^{d}(x)\unicode[STIX]{x1D6EC}_{j}^{d}(y)\unicode[STIX]{x1D6EC}_{k}^{d+1}(z), & \displaystyle\end{eqnarray}$$
 $$\begin{eqnarray}\displaystyle & \displaystyle \unicode[STIX]{x1D6FF}A_{\Vert }(\boldsymbol{R})=\mathop{\sum }_{ijk}d_{ijk}\unicode[STIX]{x1D6EC}_{i}^{d}(x)\unicode[STIX]{x1D6EC}_{j}^{d}(y)\unicode[STIX]{x1D6EC}_{k}^{d}(z). & \displaystyle\end{eqnarray}$$
As a result of the differing B-spline order in the
 $z$
-direction we get
$z$
-direction we get
 $$\begin{eqnarray}\boldsymbol{b}\boldsymbol{\cdot }\unicode[STIX]{x1D735}\unicode[STIX]{x1D6FF}\unicode[STIX]{x1D719}=\mathop{\sum }_{ijk}\frac{c_{ijk}-c_{ijk-1}}{\unicode[STIX]{x0394}z}\,\unicode[STIX]{x1D6EC}_{i}^{d}(x)\unicode[STIX]{x1D6EC}_{j}^{d}(y)\unicode[STIX]{x1D6EC}_{k}^{d}(z)\end{eqnarray}$$
and
 $$\begin{eqnarray}\mathop{\sum }_{ijk}\left(\frac{\unicode[STIX]{x2202}d_{ijk}}{\unicode[STIX]{x2202}t}+\frac{c_{ijk}-c_{ijk-1}}{\unicode[STIX]{x0394}z}\right)\unicode[STIX]{x1D6EC}_{i}^{d}(x)\unicode[STIX]{x1D6EC}_{j}^{d}(y)\unicode[STIX]{x1D6EC}_{k}^{d}(z)=0.\end{eqnarray}$$
As long as the slab is unsheared, it follows that
 $\boldsymbol{b}\boldsymbol{\cdot }(\unicode[STIX]{x1D735}\times \boldsymbol{b})/B=0$
so that the
$\boldsymbol{b}\boldsymbol{\cdot }(\unicode[STIX]{x1D735}\times \boldsymbol{b})/B=0$
so that the
 $\unicode[STIX]{x1D6FF}A_{\Vert }$
-terms in the quasi-neutrality equation in both formulations (see (4.39) and (4.53)) vanish. Therefore, the different orders in the B-spline discretisation of the potentials in (11.14) and (11.15) do not cause any additional problem when discretising the quasi-neutrality equation.
$\unicode[STIX]{x1D6FF}A_{\Vert }$
-terms in the quasi-neutrality equation in both formulations (see (4.39) and (4.53)) vanish. Therefore, the different orders in the B-spline discretisation of the potentials in (11.14) and (11.15) do not cause any additional problem when discretising the quasi-neutrality equation.
We would like to point out that the Fourier basis functions represent an appropriate alternative to the B-spline discretisation of the
 $z$
-component in (11.14) and (11.15). This is due to the fact that the derivatives of the Fourier basis functions are again Fourier basis functions. Thus in case of an unsheared slab, all terms of (11.17) would again be discretised in the same function space.
$z$
-component in (11.14) and (11.15). This is due to the fact that the derivatives of the Fourier basis functions are again Fourier basis functions. Thus in case of an unsheared slab, all terms of (11.17) would again be discretised in the same function space.
12 Numerical test cases
As we have mentioned in the introduction, MHD mode simulations with a gyrokinetic model are very challenging. To test our algorithm we will perform a sequence of four linear MHD simulations with an increasing degree of numerical difficulty. In addition, a fifth test case consists of a nonlinear simulation. We have selected our test cases for verification and not validation purpose. For the time integration a low-storage fourth-order Runge–Kutta scheme (Blum Reference Blum1962) is used. In case of a tokamak, the magnetic field
 $\boldsymbol{B}$
is axisymmetric and divergence free and can be described by
$\boldsymbol{B}$
is axisymmetric and divergence free and can be described by
 $$\begin{eqnarray}\boldsymbol{B}(\boldsymbol{x})=T(\unicode[STIX]{x1D6F9})\unicode[STIX]{x1D735}\unicode[STIX]{x1D711}+\unicode[STIX]{x1D735}\unicode[STIX]{x1D6F9}\times \unicode[STIX]{x1D735}\unicode[STIX]{x1D711},\end{eqnarray}$$
where
 $\unicode[STIX]{x1D6F9}(R,Z)$
is the poloidal flux (see also appendix C) and
$\unicode[STIX]{x1D6F9}(R,Z)$
is the poloidal flux (see also appendix C) and
 $T(\unicode[STIX]{x1D6F9})$
is the poloidal current flux function. For each test case, we use ad hoc equilibria which will be defined in the following subsections.
$T(\unicode[STIX]{x1D6F9})$
is the poloidal current flux function. For each test case, we use ad hoc equilibria which will be defined in the following subsections.
12.1 Shear Alfvén wave in an unsheared slab
Our first and simplest test case consists of a linear damped shear Alfvén wave being simulated in an unsheared slab where only the electron dynamics is considered, i.e. by setting
 $\unicode[STIX]{x1D6FF}f_{\text{i}}^{\text{h}}=0$
the ions only provide a neutralising background
$\unicode[STIX]{x1D6FF}f_{\text{i}}^{\text{h}}=0$
the ions only provide a neutralising background
 $f_{0\text{i}}$
.
$f_{0\text{i}}$
.
The mode wavenumbers are
 $k_{x}\unicode[STIX]{x1D70C}_{0\text{i}}=0.023339$
,
$k_{x}\unicode[STIX]{x1D70C}_{0\text{i}}=0.023339$
,
 $k_{y}\unicode[STIX]{x1D70C}_{0\text{i}}=0.014858$
and
$k_{y}\unicode[STIX]{x1D70C}_{0\text{i}}=0.014858$
and
 $k_{z}\unicode[STIX]{x1D70C}_{0\text{i}}=7.4290\times 10^{-4}$
. The box size is given by
$k_{z}\unicode[STIX]{x1D70C}_{0\text{i}}=7.4290\times 10^{-4}$
. The box size is given by
 $L_{x}/\unicode[STIX]{x1D70C}_{0\text{i}}=134.61$
,
$L_{x}/\unicode[STIX]{x1D70C}_{0\text{i}}=134.61$
,
 $L_{y}/\unicode[STIX]{x1D70C}_{0\text{i}}=422.88$
and
$L_{y}/\unicode[STIX]{x1D70C}_{0\text{i}}=422.88$
and
 $L_{z}/\unicode[STIX]{x1D70C}_{0\text{i}}=8457.6$
. The ratio of the ion mass (deuteron) to the electron mass is
$L_{z}/\unicode[STIX]{x1D70C}_{0\text{i}}=8457.6$
. The ratio of the ion mass (deuteron) to the electron mass is
 $m_{\text{i}}/m_{\text{e}}=3670.5$
. We consider a homogeneous plasma without any density or temperature gradients and with equal ion and electron temperatures
$m_{\text{i}}/m_{\text{e}}=3670.5$
. We consider a homogeneous plasma without any density or temperature gradients and with equal ion and electron temperatures
 $T_{\text{i}}=T_{\text{e}}=5$
keV, and a high beta of
$T_{\text{i}}=T_{\text{e}}=5$
keV, and a high beta of
 $\unicode[STIX]{x1D6FD}_{0\text{e}}=3.0442\,\%$
corresponding to a number density of
$\unicode[STIX]{x1D6FD}_{0\text{e}}=3.0442\,\%$
corresponding to a number density of
 $n_{0\text{e}}=1.89\times 10^{20}~\text{particles}~\text{m}^{-3}$
and a constant magnetic field of
$n_{0\text{e}}=1.89\times 10^{20}~\text{particles}~\text{m}^{-3}$
and a constant magnetic field of
 $B=2.5$
T.
$B=2.5$
T.
Assuming a time dependency
 $\exp (-\text{i}\unicode[STIX]{x1D714}t)$
and normalising (denoted by a bar)
$\exp (-\text{i}\unicode[STIX]{x1D714}t)$
and normalising (denoted by a bar)
 $k_{\bot }$
and
$k_{\bot }$
and
 $\unicode[STIX]{x1D714}$
to
$\unicode[STIX]{x1D714}$
to
 $\unicode[STIX]{x1D70C}_{0\text{e}}$
and
$\unicode[STIX]{x1D70C}_{0\text{e}}$
and
 $k_{\Vert }v_{\text{the}}$
, the dispersion relation we need to solve for the shear Alfvén wave is (Kleiber et al.
Reference Kleiber, Hatzky, Könies, Mishchenko and Sonnendrücker2016):
$k_{\Vert }v_{\text{the}}$
, the dispersion relation we need to solve for the shear Alfvén wave is (Kleiber et al.
Reference Kleiber, Hatzky, Könies, Mishchenko and Sonnendrücker2016):
 $$\begin{eqnarray}D(\bar{\unicode[STIX]{x1D714}})=1-\frac{4\unicode[STIX]{x1D6FD}_{0\text{e}}}{\bar{k}_{\bot }^{2}}\left(\bar{\unicode[STIX]{x1D714}}^{2}-\frac{m_{\text{e}}}{2\unicode[STIX]{x1D6FD}_{0\text{e}}m_{\text{i}}}\right)[1+\bar{\unicode[STIX]{x1D714}}Z(\bar{\unicode[STIX]{x1D714}})]=0.\end{eqnarray}$$
For our parameters we retrieve
 $\unicode[STIX]{x1D6FE}_{\text{A}}=-23.132~\text{s}^{-1}$
and
$\unicode[STIX]{x1D6FE}_{\text{A}}=-23.132~\text{s}^{-1}$
and
 $\unicode[STIX]{x1D714}_{A}=510\,266~\text{rad}~\text{s}^{-1}$
. The latter will be used to normalise the damping rate and angular frequency depicted in figures 4 and 5.
$\unicode[STIX]{x1D714}_{A}=510\,266~\text{rad}~\text{s}^{-1}$
. The latter will be used to normalise the damping rate and angular frequency depicted in figures 4 and 5.
The perpendicular
 $x$
- and
$x$
- and
 $y$
-directions of the potential equations are discretised by four B-splines of quadratic order
$y$
-directions of the potential equations are discretised by four B-splines of quadratic order
 $d=3$
in the
$d=3$
in the
 $x$
-direction, i.e.
$x$
-direction, i.e.
 $N_{x}=4$
, while a Fourier ansatz is used in the
$N_{x}=4$
, while a Fourier ansatz is used in the
 $y$
-direction. In the
$y$
-direction. In the
 $z$
-direction, we use
$z$
-direction, we use
 $N_{z}$
quadratic B-splines for the discretisation of the potential equations. In addition, we also use the mixed discretisation (see (11.14) and (11.15)) with cubic B-splines of order
$N_{z}$
quadratic B-splines for the discretisation of the potential equations. In addition, we also use the mixed discretisation (see (11.14) and (11.15)) with cubic B-splines of order
 $d=4$
for the quasi-neutrality equation and quadratic B-splines for Ampère’s law.
$d=4$
for the quasi-neutrality equation and quadratic B-splines for Ampère’s law.
We introduce a homogeneous Dirichlet boundary condition in the
 $x$
-direction and periodic boundary conditions in the
$x$
-direction and periodic boundary conditions in the
 $y$
- and
$y$
- and
 $z$
-directions. Fourier filters are applied in the
$z$
-directions. Fourier filters are applied in the
 $x$
- and
$x$
- and
 $z$
-directions. The Fourier filter in the
$z$
-directions. The Fourier filter in the
 $x$
-direction filters only a half-wave. The loading of the electron markers is done by a half-sine, i.e.
$x$
-direction filters only a half-wave. The loading of the electron markers is done by a half-sine, i.e.
 $g_{1}=\sin (k_{x}x)$
in the
$g_{1}=\sin (k_{x}x)$
in the
 $x$
-direction and is uniform in the reduced velocity space, i.e.
$x$
-direction and is uniform in the reduced velocity space, i.e.
 $g_{2}=1$
, with
$g_{2}=1$
, with
 $\unicode[STIX]{x1D705}_{\text{ve}}=4$
(see § 10.1) and consequently guarantees, in contrast to a Maxwellian loading, a good sampling rate at high velocities. The time-step size has been converged to
$\unicode[STIX]{x1D705}_{\text{ve}}=4$
(see § 10.1) and consequently guarantees, in contrast to a Maxwellian loading, a good sampling rate at high velocities. The time-step size has been converged to
 $\unicode[STIX]{x0394}t=5\times 10^{-10}$
s. We initialise the recursion of the iterative solver with
$\unicode[STIX]{x0394}t=5\times 10^{-10}$
s. We initialise the recursion of the iterative solver with
 $\boldsymbol{d}^{(0)}=0$
and set the number of iterations to one (see § F.1). The simulation of the shear Alfvén wave runs up to the time
$\boldsymbol{d}^{(0)}=0$
and set the number of iterations to one (see § F.1). The simulation of the shear Alfvén wave runs up to the time
 $t_{\max }=3.16\times 10^{-5}$
s. Due to the Fourier ansatz in the
$t_{\max }=3.16\times 10^{-5}$
s. Due to the Fourier ansatz in the
 $y$
-direction the simulation uses complex numbers. We fitted the time sequence of the real part of the electrostatic potential in order to determine the damping rate
$y$
-direction the simulation uses complex numbers. We fitted the time sequence of the real part of the electrostatic potential in order to determine the damping rate
 $\unicode[STIX]{x1D6FE}$
and angular frequency
$\unicode[STIX]{x1D6FE}$
and angular frequency
 $\unicode[STIX]{x1D714}$
.
$\unicode[STIX]{x1D714}$
.
(a,b) The damping rate and the angular frequency of a shear Alfvén wave in a slab as a function of the number of electron markers
 $N_{\text{pe}}$
(solid line). For comparison, the result of the dispersion relation (dashed-dotted horizontal line). Discretisation of
$N_{\text{pe}}$
(solid line). For comparison, the result of the dispersion relation (dashed-dotted horizontal line). Discretisation of
 $\unicode[STIX]{x1D6FF}\unicode[STIX]{x1D719}$
and
$\unicode[STIX]{x1D6FF}\unicode[STIX]{x1D719}$
and
 $\unicode[STIX]{x1D6FF}A_{\Vert }$
uses quadratic B-splines including the correction term
$\unicode[STIX]{x1D6FF}A_{\Vert }$
uses quadratic B-splines including the correction term
 $\unicode[STIX]{x0394}E_{\Vert }$
. The simulation has been performed with
$\unicode[STIX]{x0394}E_{\Vert }$
. The simulation has been performed with
 $N_{z}=16$
B-splines in the parallel
$N_{z}=16$
B-splines in the parallel
 $z$
-direction.
$z$
-direction.

(a,b) The damping rate and the angular frequency of a shear Alfvén wave in a slab as a function of the number of B-splines
 $N_{z}$
. Discretisation of
$N_{z}$
. Discretisation of
 $\unicode[STIX]{x1D6FF}\unicode[STIX]{x1D719}$
and
$\unicode[STIX]{x1D6FF}\unicode[STIX]{x1D719}$
and
 $\unicode[STIX]{x1D6FF}A_{\Vert }$
with quadratic B-splines (dashed blue line), including the correction term
$\unicode[STIX]{x1D6FF}A_{\Vert }$
with quadratic B-splines (dashed blue line), including the correction term
 $\unicode[STIX]{x0394}E_{\Vert \text{e}}$
(solid red line), with cubic B-splines for discretisation of
$\unicode[STIX]{x0394}E_{\Vert \text{e}}$
(solid red line), with cubic B-splines for discretisation of
 $\unicode[STIX]{x1D6FF}\unicode[STIX]{x1D719}$
and quadratic B-splines for discretisation of
$\unicode[STIX]{x1D6FF}\unicode[STIX]{x1D719}$
and quadratic B-splines for discretisation of
 $\unicode[STIX]{x1D6FF}A_{\Vert }$
(dotted green line). For comparison, the result of the dispersion relation (dashed-dotted horizontal line). The simulation has been performed with
$\unicode[STIX]{x1D6FF}A_{\Vert }$
(dotted green line). For comparison, the result of the dispersion relation (dashed-dotted horizontal line). The simulation has been performed with
 $N_{\text{pe}}=10^{6}$
electron markers.
$N_{\text{pe}}=10^{6}$
electron markers.
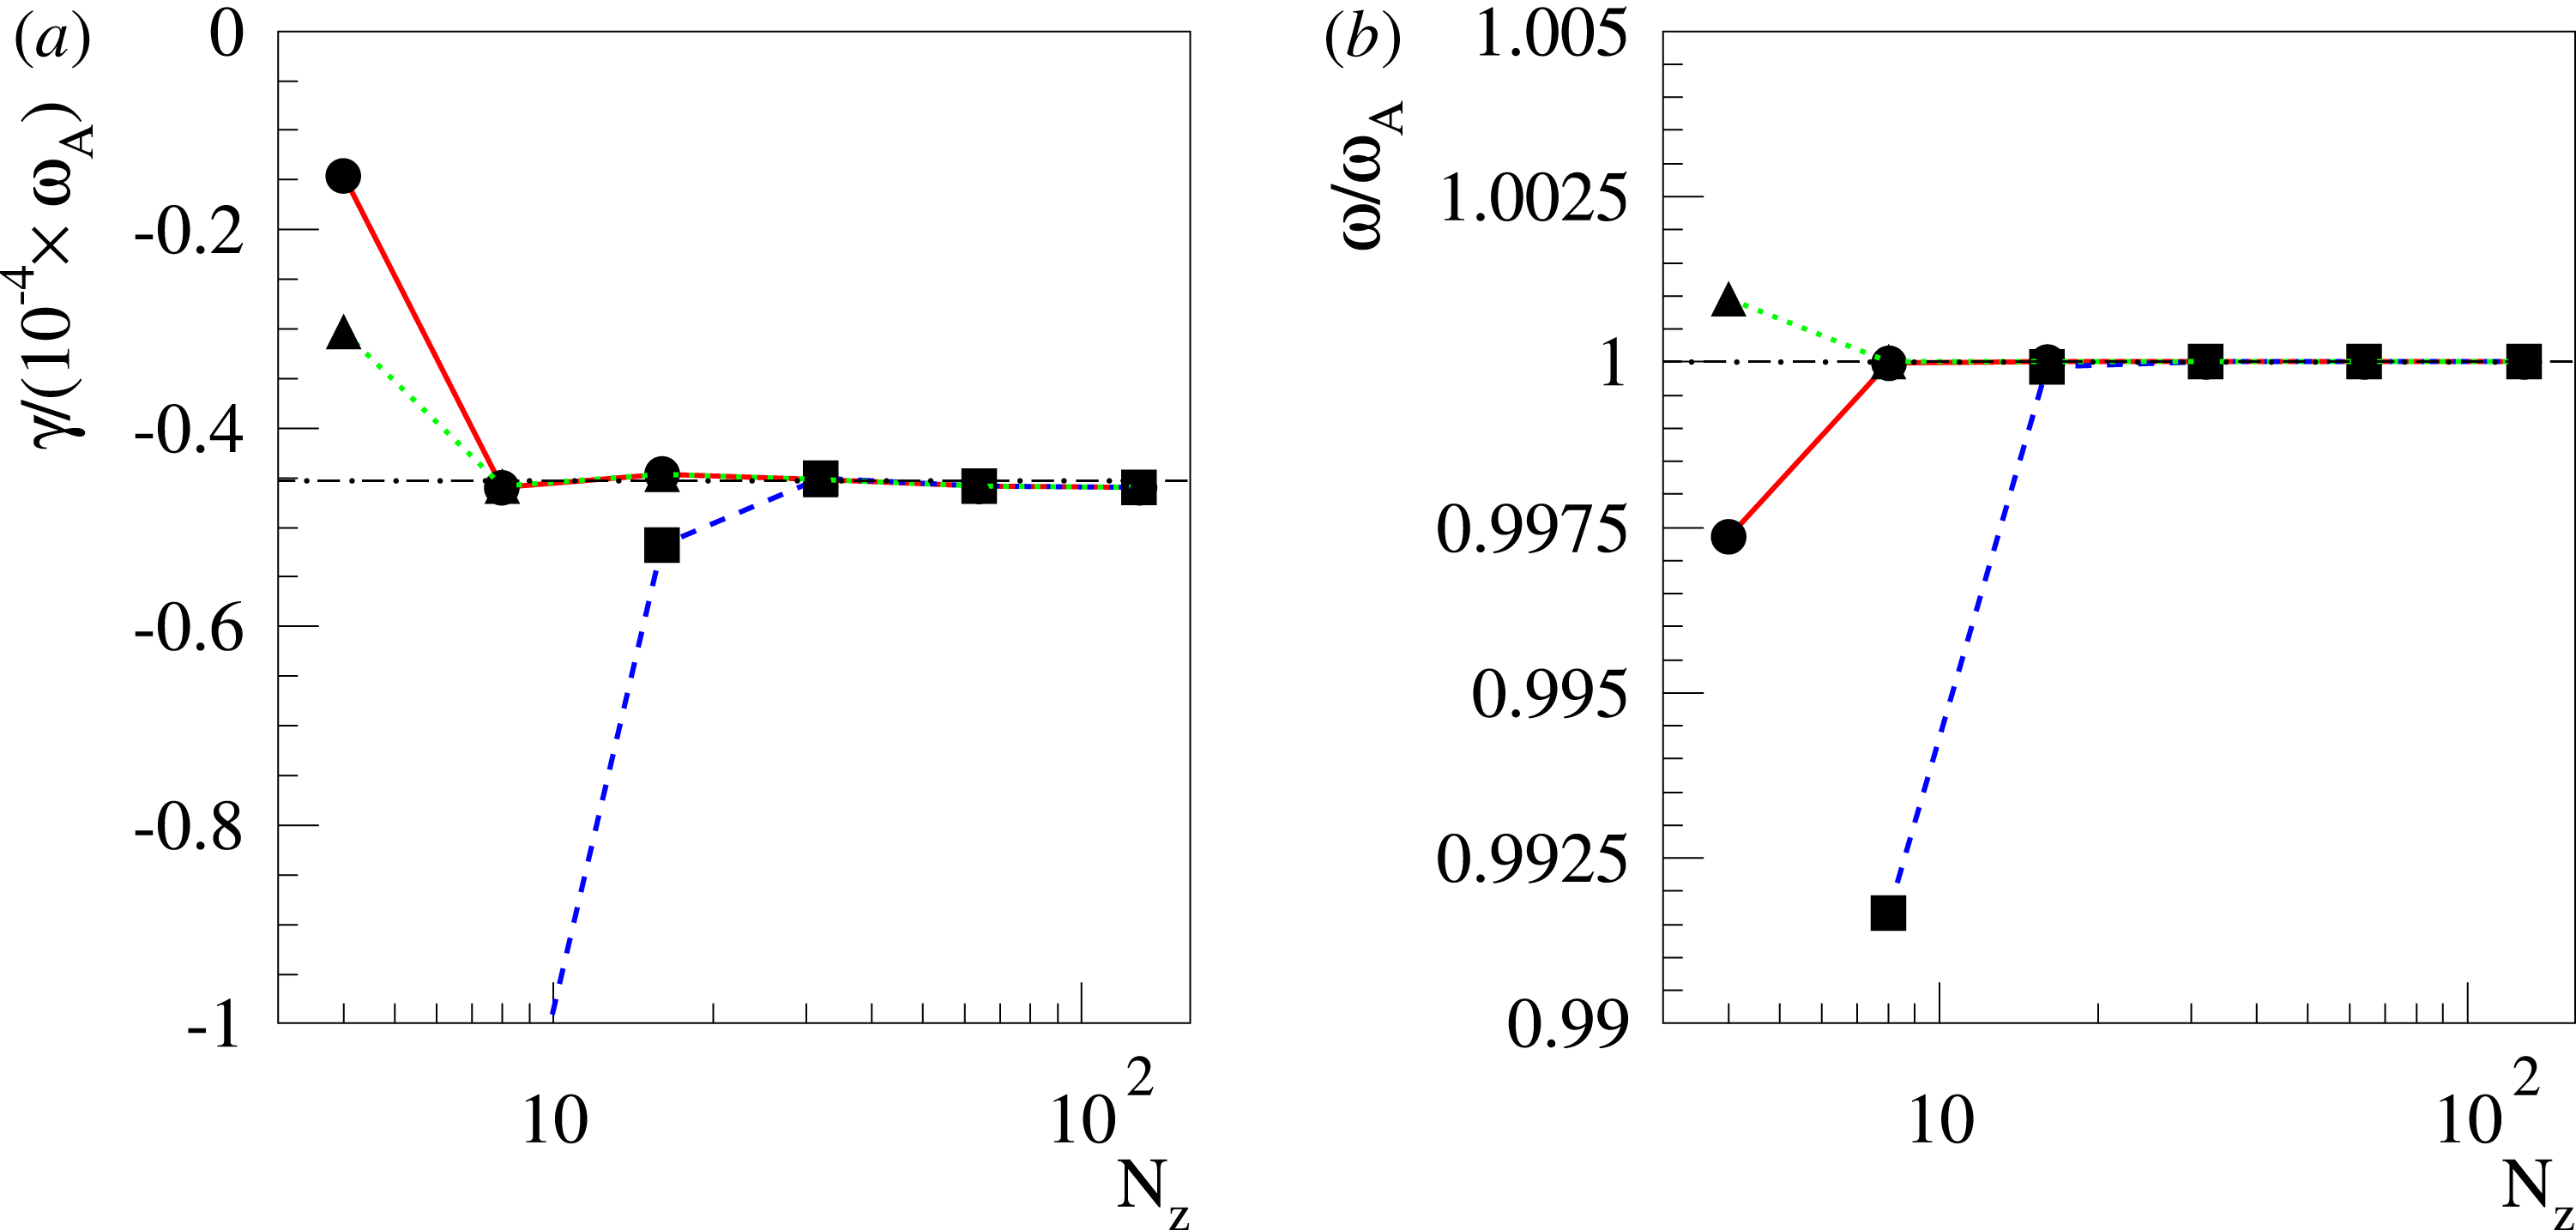
12.1.1 Numerical results
For all our simulation we use the GYGLES code originally written for electrostatic linear gyrokinetic
 $\unicode[STIX]{x1D6FF}f$
PIC simulations in a toroidal geometry (Fivaz et al.
Reference Fivaz, Brunner, de Ridder, Sauter, Tran, Vaclavik and Villard1998), which has been extended to electromagnetic perturbations (Mishchenko et al.
Reference Mishchenko, Hatzky and Könies2004a
). In the following, we show the result of a shear Alfvén wave simulation in an unsheared slab with a constant magnetic field. The numerical model is reduced to electron markers only.
$\unicode[STIX]{x1D6FF}f$
PIC simulations in a toroidal geometry (Fivaz et al.
Reference Fivaz, Brunner, de Ridder, Sauter, Tran, Vaclavik and Villard1998), which has been extended to electromagnetic perturbations (Mishchenko et al.
Reference Mishchenko, Hatzky and Könies2004a
). In the following, we show the result of a shear Alfvén wave simulation in an unsheared slab with a constant magnetic field. The numerical model is reduced to electron markers only.
First, we want to show how efficient in terms of error reduction the calculation of the moments of the perturbation to the distribution function in the symplectic formulation is. In figure 2, we show the standard deviation of two quantities, the total particle number
 $\unicode[STIX]{x1D70E}_{\text{n}_{\text{tot}}}$
and the total current
$\unicode[STIX]{x1D70E}_{\text{n}_{\text{tot}}}$
and the total current
 $\unicode[STIX]{x1D70E}_{\text{j}_{\Vert \text{tot}}}$
(see (4.80) and (4.81)) as a function of time
$\unicode[STIX]{x1D70E}_{\text{j}_{\Vert \text{tot}}}$
(see (4.80) and (4.81)) as a function of time
 $t$
. The simulation has been performed with
$t$
. The simulation has been performed with
 $N_{\text{pe}}=10^{6}$
electron markers and
$N_{\text{pe}}=10^{6}$
electron markers and
 $N_{z}=16$
B-splines in the parallel direction to the magnetic field
$N_{z}=16$
B-splines in the parallel direction to the magnetic field
 $\boldsymbol{b}$
. If we compare the standard deviation of the perturbed weights of the electron markers in the Hamiltonian formulation (dashed line) with the one in the symplectic formulation (solid line), we can see a reduction of approximately four orders of magnitude for the total particle number
$\boldsymbol{b}$
. If we compare the standard deviation of the perturbed weights of the electron markers in the Hamiltonian formulation (dashed line) with the one in the symplectic formulation (solid line), we can see a reduction of approximately four orders of magnitude for the total particle number
 $n_{\text{tot}}$
and the total current
$n_{\text{tot}}$
and the total current
 $j_{\text{tot}}$
. This is an impressive confirmation of the proposed evaluation of the moments in the symplectic formulation.
$j_{\text{tot}}$
. This is an impressive confirmation of the proposed evaluation of the moments in the symplectic formulation.
For our test case the damping rate is smaller by a factor of approximately
 $5\times 10^{-5}$
compared to the angular frequency of the mode. Due to statistical error it is challenging for a PIC simulation to resolve such a small quantity within a small relative error. In figure 4(a,b), we show the damping rate
$5\times 10^{-5}$
compared to the angular frequency of the mode. Due to statistical error it is challenging for a PIC simulation to resolve such a small quantity within a small relative error. In figure 4(a,b), we show the damping rate
 $\unicode[STIX]{x1D6FE}$
and the angular frequency
$\unicode[STIX]{x1D6FE}$
and the angular frequency
 $\unicode[STIX]{x1D714}$
as a function of the number of electron markers
$\unicode[STIX]{x1D714}$
as a function of the number of electron markers
 $N_{\text{pe}}$
. The discretisation of
$N_{\text{pe}}$
. The discretisation of
 $\unicode[STIX]{x1D6FF}\unicode[STIX]{x1D719}$
and
$\unicode[STIX]{x1D6FF}\unicode[STIX]{x1D719}$
and
 $\unicode[STIX]{x1D6FF}A_{\Vert }$
has been done with quadratic B-splines including the correction term
$\unicode[STIX]{x1D6FF}A_{\Vert }$
has been done with quadratic B-splines including the correction term
 $\unicode[STIX]{x0394}E_{\Vert }$
from (11.13). The number of B-splines in the parallel direction is
$\unicode[STIX]{x0394}E_{\Vert }$
from (11.13). The number of B-splines in the parallel direction is
 $N_{z}=16$
. A large number of
$N_{z}=16$
. A large number of
 $N_{\text{pe}}\simeq 10^{6}$
electron markers is necessary to achieve an approximately one per cent relative error of the damping rate. The relative error of the much larger angular frequency is approximately
$N_{\text{pe}}\simeq 10^{6}$
electron markers is necessary to achieve an approximately one per cent relative error of the damping rate. The relative error of the much larger angular frequency is approximately
 $10^{-5}$
for the same number of electron markers.
$10^{-5}$
for the same number of electron markers.
The smallness of the damping rate is caused by the fact that the numerical model parameters are already quite close to the MHD limit in which the shear Alfvén wave becomes marginally stable. This goes hand in hand with a vanishing parallel electric field as we have discussed in § 11.1. Thus, our numerical model problem, and with it the relatively small damping rate are sensitive to the correct discretisation of the parallel electric field. This effect is illustrated in figure 5, in which we depict results of a simulation with
 $N_{\text{pe}}=10^{6}$
electron markers. In (a,b), we show the damping rate
$N_{\text{pe}}=10^{6}$
electron markers. In (a,b), we show the damping rate
 $\unicode[STIX]{x1D6FE}$
and the angular frequency
$\unicode[STIX]{x1D6FE}$
and the angular frequency
 $\unicode[STIX]{x1D714}$
as a function of the number of B-splines
$\unicode[STIX]{x1D714}$
as a function of the number of B-splines
 $N_{z}$
in the parallel direction. The standard discretisation of
$N_{z}$
in the parallel direction. The standard discretisation of
 $\unicode[STIX]{x1D6FF}\unicode[STIX]{x1D719}$
and
$\unicode[STIX]{x1D6FF}\unicode[STIX]{x1D719}$
and
 $\unicode[STIX]{x1D6FF}A_{\Vert }$
with quadratic B-splines (dashed line) needs already a large number of B-splines
$\unicode[STIX]{x1D6FF}A_{\Vert }$
with quadratic B-splines (dashed line) needs already a large number of B-splines
 $N_{z}\simeq 32$
to converge. The proposed schemes only converge because we apply a Fourier filter and use a sufficient number of B-splines. If we add the correction term
$N_{z}\simeq 32$
to converge. The proposed schemes only converge because we apply a Fourier filter and use a sufficient number of B-splines. If we add the correction term
 $\unicode[STIX]{x0394}E_{\Vert }$
(solid line) from (11.13) we can speed up the convergence rate so that convergence is already achieved with
$\unicode[STIX]{x0394}E_{\Vert }$
(solid line) from (11.13) we can speed up the convergence rate so that convergence is already achieved with
 $N_{z}\simeq 8$
. This is nearly as good as the convergence rate of the mixed discretisation with cubic B-splines for
$N_{z}\simeq 8$
. This is nearly as good as the convergence rate of the mixed discretisation with cubic B-splines for
 $\unicode[STIX]{x1D6FF}\unicode[STIX]{x1D719}$
and quadratic B-splines for
$\unicode[STIX]{x1D6FF}\unicode[STIX]{x1D719}$
and quadratic B-splines for
 $\unicode[STIX]{x1D6FF}A_{\Vert }$
(dotted line). That the mixed discretisation gives slightly better results is expectable as the discretisation of
$\unicode[STIX]{x1D6FF}A_{\Vert }$
(dotted line). That the mixed discretisation gives slightly better results is expectable as the discretisation of
 $\unicode[STIX]{x1D6FF}\unicode[STIX]{x1D719}$
uses B-splines of one order higher than the other two schemes, i.e. cubic instead of quadratic B-splines. Also in the case of a non-aligned coordinate system, the correction term
$\unicode[STIX]{x1D6FF}\unicode[STIX]{x1D719}$
uses B-splines of one order higher than the other two schemes, i.e. cubic instead of quadratic B-splines. Also in the case of a non-aligned coordinate system, the correction term
 $\unicode[STIX]{x0394}E_{\Vert }$
has the positive effect of improving the convergence rate with the grid size. This effect is only significant when the simulation is close to the MHD limit. In case of a tokamak, it is more pronounced for
$\unicode[STIX]{x0394}E_{\Vert }$
has the positive effect of improving the convergence rate with the grid size. This effect is only significant when the simulation is close to the MHD limit. In case of a tokamak, it is more pronounced for
 $N_{\unicode[STIX]{x1D711}}$
than for
$N_{\unicode[STIX]{x1D711}}$
than for
 $N_{\unicode[STIX]{x1D717}}$
.
$N_{\unicode[STIX]{x1D717}}$
.
12.2 Global Alfvén eigenmode (GAE) in a screw pinch
Our second test case consists of a linear GAE simulation in a screw pinch (Mishchenko, Hatzky & Könies Reference Mishchenko, Hatzky and Könies2008) with a minor radius of
 $a=0.55$
m and a major radius of
$a=0.55$
m and a major radius of
 $R_{0}=5.5$
m. The length of the cylinder is
$R_{0}=5.5$
m. The length of the cylinder is
 $L_{\text{cyl}}=2\unicode[STIX]{x03C0}R_{0}$
. The magnetic field
$L_{\text{cyl}}=2\unicode[STIX]{x03C0}R_{0}$
. The magnetic field
 $\boldsymbol{B}$
is defined by
$\boldsymbol{B}$
is defined by
 $$\begin{eqnarray}\unicode[STIX]{x1D6F9}(R)=\frac{B_{0}}{2}R^{2}\quad \text{and}\quad T(R)=\frac{1}{q}\frac{R}{R_{0}}\frac{\unicode[STIX]{x2202}\unicode[STIX]{x1D6F9}}{\unicode[STIX]{x2202}R}=\frac{B_{0}}{q}\frac{R^{2}}{R_{0}}.\end{eqnarray}$$
If we substitute these quantities into (12.1), we get
 $$\begin{eqnarray}\boldsymbol{B}=\frac{B_{0}}{q}\frac{R}{R_{0}}\boldsymbol{e}_{\unicode[STIX]{x1D717}}+B_{0}\boldsymbol{e}_{\unicode[STIX]{x1D711}},\end{eqnarray}$$
where
 $B_{0}=2.5$
T and
$B_{0}=2.5$
T and
 $\boldsymbol{e}_{\unicode[STIX]{x1D711}}$
points along the cylinder axis. The safety factor
$\boldsymbol{e}_{\unicode[STIX]{x1D711}}$
points along the cylinder axis. The safety factor
 $q$
-profile, measuring the helicity of the field lines, is defined by
$q$
-profile, measuring the helicity of the field lines, is defined by
 $$\begin{eqnarray}q(\unicode[STIX]{x1D6F9})\stackrel{\text{def}}{=}\frac{1}{2\unicode[STIX]{x03C0}}\int _{0}^{2\unicode[STIX]{x03C0}}\frac{\boldsymbol{B}\boldsymbol{\cdot }\unicode[STIX]{x1D735}\unicode[STIX]{x1D719}}{\boldsymbol{B}\boldsymbol{\cdot }\unicode[STIX]{x1D735}\unicode[STIX]{x1D717}}\text{d}\unicode[STIX]{x1D717}.\end{eqnarray}$$
For the screw pinch we choose the following
 $q$
-profile which can be given as a function of the radial coordinate
$q$
-profile which can be given as a function of the radial coordinate
 $r$
(see also appendix C)
$r$
(see also appendix C)
 $$\begin{eqnarray}q(r)=1.05+3.25\left(\frac{r}{a}\right)^{2}.\end{eqnarray}$$
The cylinder can be seen as a topological torus. Hence, we will use the toroidal mode number
 $n$
for characterising Fourier modes along the direction of the cylinder axis and the poloidal mode number
$n$
for characterising Fourier modes along the direction of the cylinder axis and the poloidal mode number
 $m$
for modes along the
$m$
for modes along the
 $\unicode[STIX]{x1D717}$
-direction within the
$\unicode[STIX]{x1D717}$
-direction within the
 $RZ$
-plane (see figure 14 in appendix C). For our simulation we select the
$RZ$
-plane (see figure 14 in appendix C). For our simulation we select the
 $n=1$
and
$n=1$
and
 $m=2$
mode. As
$m=2$
mode. As
 $m\neq 0$
, the GAE can only be properly simulated with a shifted Maxwellian, i.e.
$m\neq 0$
, the GAE can only be properly simulated with a shifted Maxwellian, i.e.
 $\hat{u} _{0\text{e}}\neq 0$
. Otherwise an important part of the physics constituting the mode would be missing. The
$\hat{u} _{0\text{e}}\neq 0$
. Otherwise an important part of the physics constituting the mode would be missing. The
 $\hat{u} _{0\text{e}}$
-profile is chosen to be consistent with the parallel background current
$\hat{u} _{0\text{e}}$
-profile is chosen to be consistent with the parallel background current
 $$\begin{eqnarray}\boldsymbol{j}_{0\Vert }=\frac{1}{\unicode[STIX]{x1D707}_{0}}\boldsymbol{b}\boldsymbol{\cdot }\unicode[STIX]{x1D735}\times \boldsymbol{B}\end{eqnarray}$$
of the equilibrium magnetic field
 $\boldsymbol{B}$
:
$\boldsymbol{B}$
:
 $$\begin{eqnarray}\hat{u} _{0\text{e}}(R)=\frac{1}{\unicode[STIX]{x1D707}_{0}q_{\text{e}}\hat{n}_{0\text{e}}}\frac{1}{R}\frac{\unicode[STIX]{x2202}T}{\unicode[STIX]{x2202}\unicode[STIX]{x1D6F9}}\frac{\unicode[STIX]{x2202}\unicode[STIX]{x1D6F9}}{\unicode[STIX]{x2202}R}=\frac{2B_{0}}{\unicode[STIX]{x1D707}_{0}q_{\text{e}}\hat{n}_{0\text{e}}R_{0}}.\end{eqnarray}$$
The ratio of the ion mass (deuteron) to the electron mass is
 $m_{\text{i}}/m_{\text{e}}=3670.5$
. We consider a homogeneous plasma without any density or temperature gradients, with equal ion and electron temperatures
$m_{\text{i}}/m_{\text{e}}=3670.5$
. We consider a homogeneous plasma without any density or temperature gradients, with equal ion and electron temperatures
 $T_{\text{i}}=T_{\text{e}}=5$
keV, and a moderate beta of
$T_{\text{i}}=T_{\text{e}}=5$
keV, and a moderate beta of
 $\unicode[STIX]{x1D6FD}_{0\text{e}}=0.493\,\%$
corresponding to a number density of
$\unicode[STIX]{x1D6FD}_{0\text{e}}=0.493\,\%$
corresponding to a number density of
 $\hat{n}_{0\text{i}}=\hat{n}_{0\text{e}}=1\times 10^{19}~\text{particles}~\text{m}^{-3}$
.
$\hat{n}_{0\text{i}}=\hat{n}_{0\text{e}}=1\times 10^{19}~\text{particles}~\text{m}^{-3}$
.
The radial
 $s$
-direction of the potential equations is discretised by 64 B-splines of quadratic order, while a Fourier ansatz is used in the
$s$
-direction of the potential equations is discretised by 64 B-splines of quadratic order, while a Fourier ansatz is used in the
 $\unicode[STIX]{x1D717}$
-direction. In the direction of the cylinder axis, we use eight quadratic B-splines for the discretisation of the potential equations.
$\unicode[STIX]{x1D717}$
-direction. In the direction of the cylinder axis, we use eight quadratic B-splines for the discretisation of the potential equations.
We introduce a homogeneous Dirichlet boundary condition at
 $s=0$
and
$s=0$
and
 $s=1$
and a periodic boundary condition in the
$s=1$
and a periodic boundary condition in the
 $\unicode[STIX]{x1D717}$
- and the toroidal direction. A Fourier filter is applied in the toroidal direction. The loading of the ion and electron markers is done uniformly in the configuration and reduced velocity space, i.e.
$\unicode[STIX]{x1D717}$
- and the toroidal direction. A Fourier filter is applied in the toroidal direction. The loading of the ion and electron markers is done uniformly in the configuration and reduced velocity space, i.e.
 $g_{1}=1$
and
$g_{1}=1$
and
 $g_{2}=1$
, with
$g_{2}=1$
, with
 $\unicode[STIX]{x1D705}_{\text{vi}}=\unicode[STIX]{x1D705}_{\text{ve}}=4.75$
(see § 10.1). We initialise the recursion of the iterative solver with
$\unicode[STIX]{x1D705}_{\text{vi}}=\unicode[STIX]{x1D705}_{\text{ve}}=4.75$
(see § 10.1). We initialise the recursion of the iterative solver with
 $\boldsymbol{d}^{(0)}=0$
and set the number of iterations to two. However, we do not perform any iterations for the ions, i.e. we skip the term
$\boldsymbol{d}^{(0)}=0$
and set the number of iterations to two. However, we do not perform any iterations for the ions, i.e. we skip the term
 $(\check{\unicode[STIX]{x1D64E}}_{\text{i}}-\bar{\unicode[STIX]{x1D645}}_{\text{i}}^{\text{ad}})\boldsymbol{d}^{(n)}$
on the right-hand side of (F 12) (see § F.1). The simulation of the GAE runs up to the time
$(\check{\unicode[STIX]{x1D64E}}_{\text{i}}-\bar{\unicode[STIX]{x1D645}}_{\text{i}}^{\text{ad}})\boldsymbol{d}^{(n)}$
on the right-hand side of (F 12) (see § F.1). The simulation of the GAE runs up to the time
 $t_{\max }=5\times 10^{-5}$
s. Due to the Fourier ansatz in the
$t_{\max }=5\times 10^{-5}$
s. Due to the Fourier ansatz in the
 $\unicode[STIX]{x1D717}$
-direction the simulation uses complex numbers. We fitted the time sequence of the real part of the electrostatic potential in the time interval
$\unicode[STIX]{x1D717}$
-direction the simulation uses complex numbers. We fitted the time sequence of the real part of the electrostatic potential in the time interval
 $t\in [4.5\times 10^{-5},5\times 10^{-5}]$
s in order to determine the damping rate
$t\in [4.5\times 10^{-5},5\times 10^{-5}]$
s in order to determine the damping rate
 $\unicode[STIX]{x1D6FE}$
and angular frequency
$\unicode[STIX]{x1D6FE}$
and angular frequency
 $\unicode[STIX]{x1D714}$
.
$\unicode[STIX]{x1D714}$
.
12.2.1 Numerical results
First we perform a convergence study over the time-step size
 $\unicode[STIX]{x0394}t$
. In figure 6(a,b), we can see the damping rate and the angular frequency of the GAE as a function of the time-step size
$\unicode[STIX]{x0394}t$
. In figure 6(a,b), we can see the damping rate and the angular frequency of the GAE as a function of the time-step size
 $\unicode[STIX]{x0394}t$
. Both quantities are well converged for time-step sizes smaller than
$\unicode[STIX]{x0394}t$
. Both quantities are well converged for time-step sizes smaller than
 $\unicode[STIX]{x0394}t\approx 10^{-9}$
s.
$\unicode[STIX]{x0394}t\approx 10^{-9}$
s.
(a,b) The damping rate and the angular frequency of the GAE in a screw pinch as a function of the time-step size
 $\unicode[STIX]{x0394}t$
. The simulation has been performed with
$\unicode[STIX]{x0394}t$
. The simulation has been performed with
 $N_{\text{pi}}=N_{\text{pe}}=4\times 10^{6}$
ion and electron markers.
$N_{\text{pi}}=N_{\text{pe}}=4\times 10^{6}$
ion and electron markers.
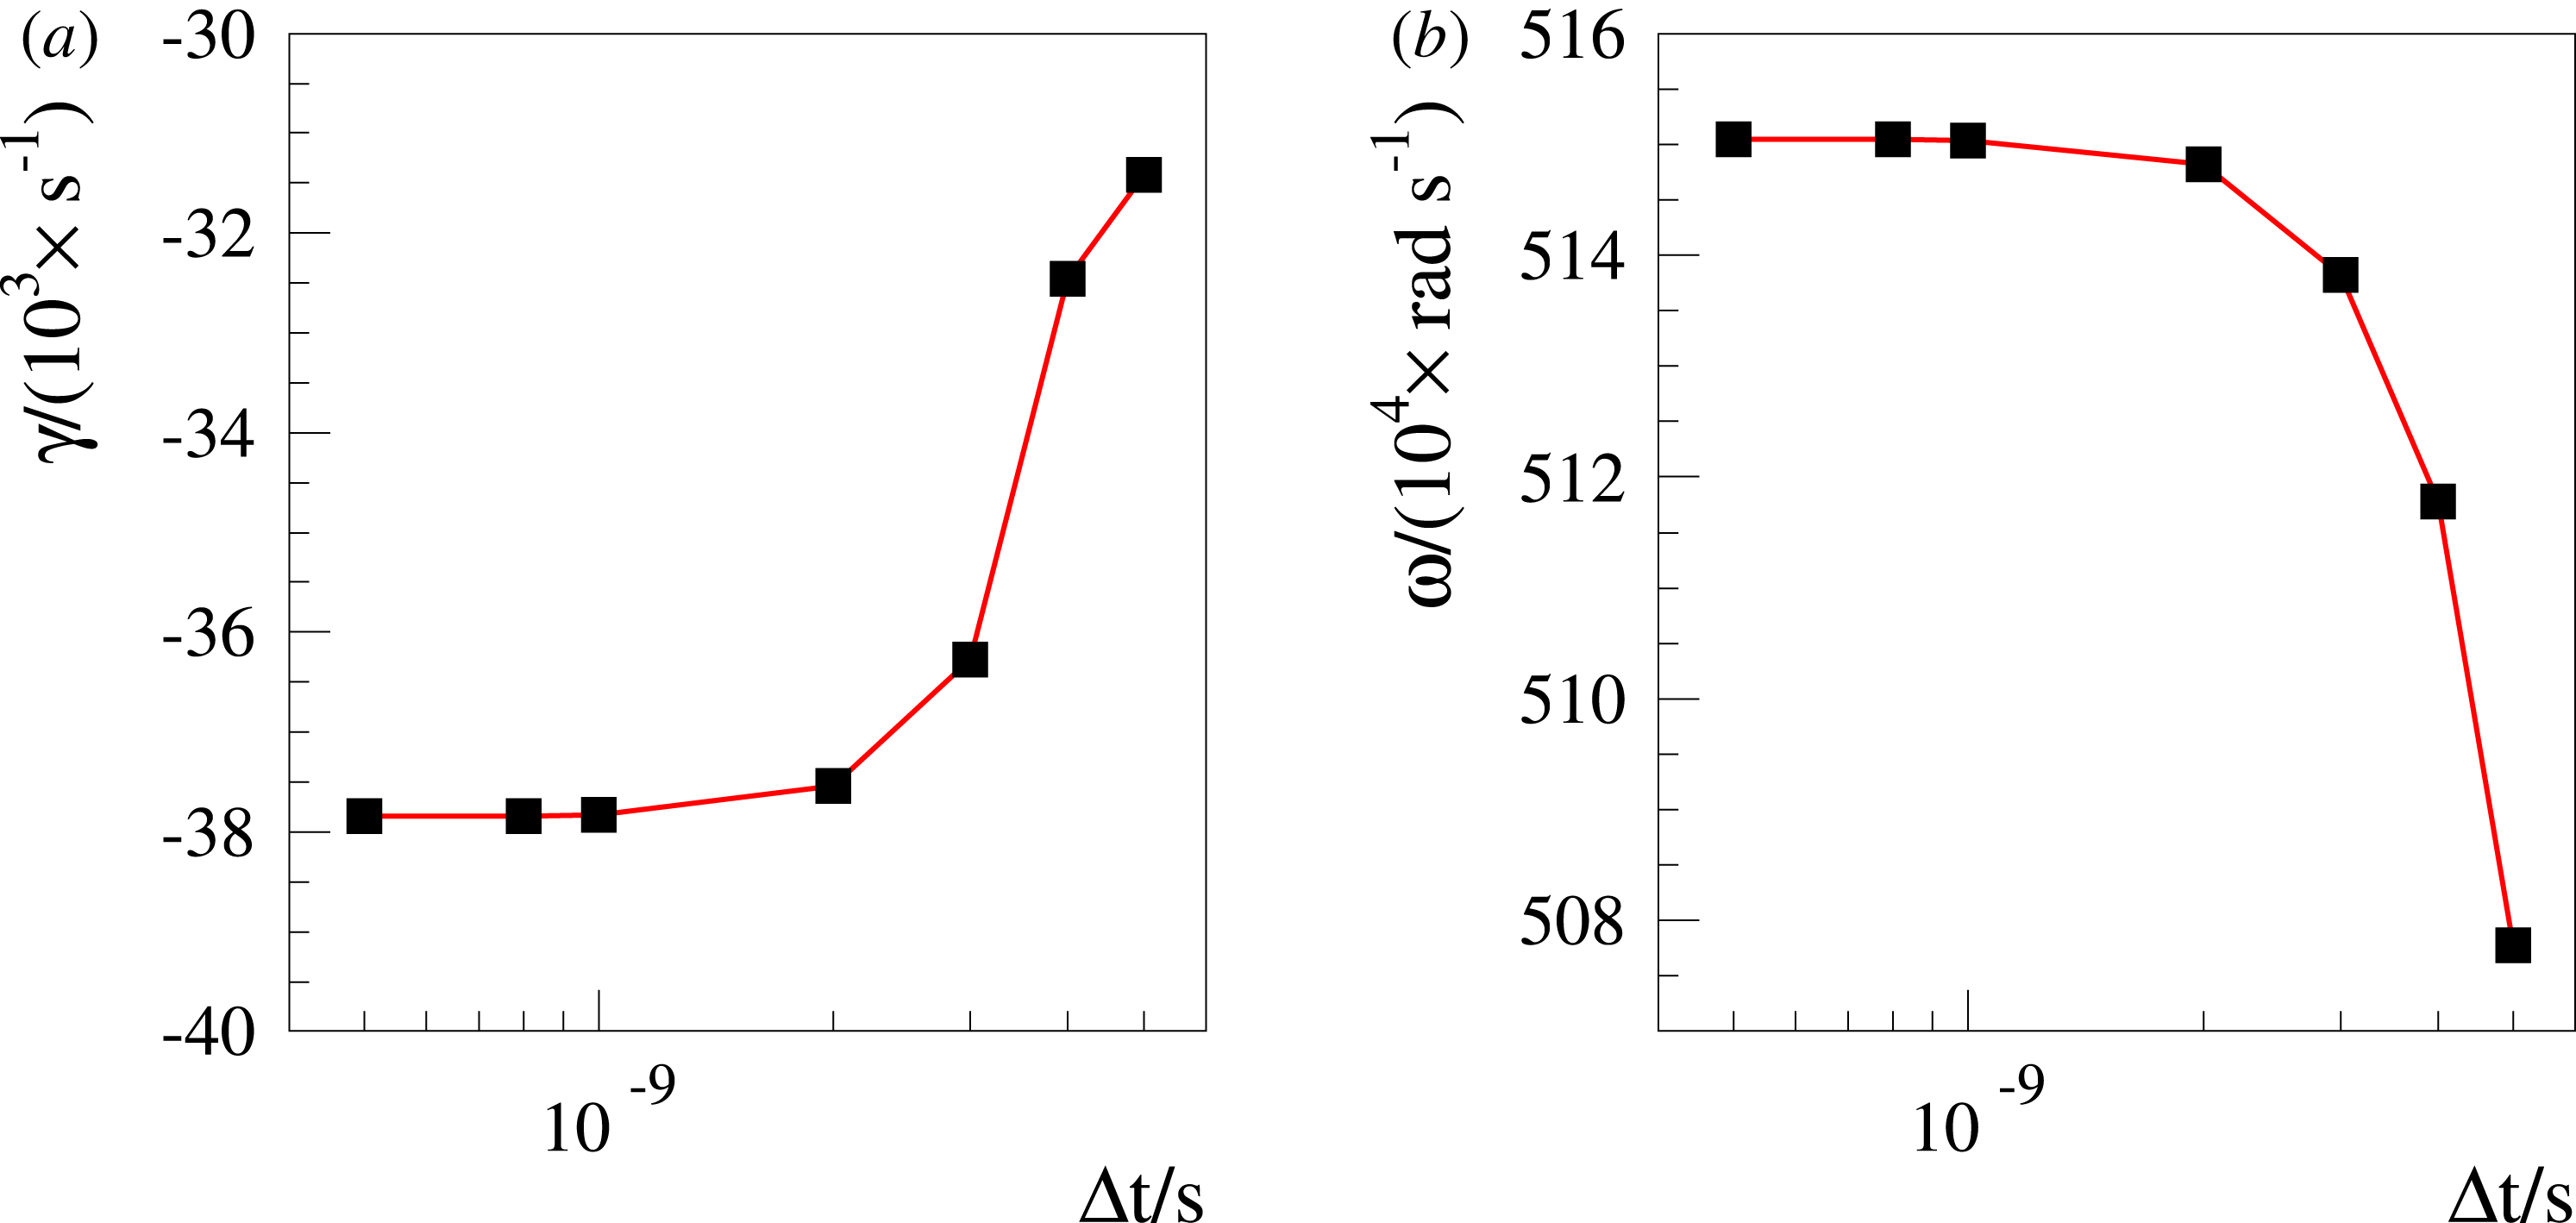
The number of ion and electron markers affects convergence as well. In figure 7(a,b), we can see the damping rate and the angular frequency of the GAE as a function of the ion markers
 $N_{\text{pi}}$
and in figure 8 as a function of the electron markers
$N_{\text{pi}}$
and in figure 8 as a function of the electron markers
 $N_{\text{pe}}$
. The simulation of the GAE is well resolved with
$N_{\text{pe}}$
. The simulation of the GAE is well resolved with
 $N_{\text{pi}}\approx 5\times 10^{5}$
ion markers. However, much more electron markers are needed for convergence. In figure 8, we show the result for both, a simulation without gyro-rings (dashed line), i.e. with a vanishing gyro-ring in the charge and current assignments and in the equations of motion respectively, and a simulation with gyro-rings (solid line). In both cases we need
$N_{\text{pi}}\approx 5\times 10^{5}$
ion markers. However, much more electron markers are needed for convergence. In figure 8, we show the result for both, a simulation without gyro-rings (dashed line), i.e. with a vanishing gyro-ring in the charge and current assignments and in the equations of motion respectively, and a simulation with gyro-rings (solid line). In both cases we need
 $N_{\text{pe}}\approx 32\times 10^{6}$
electron markers to have good convergence.
$N_{\text{pe}}\approx 32\times 10^{6}$
electron markers to have good convergence.
(a,b) The damping rate and the angular frequency of the GAE in a screw pinch as a function of the ion markers
 $N_{\text{pi}}$
. The simulation has been performed with a time-step size of
$N_{\text{pi}}$
. The simulation has been performed with a time-step size of
 $\unicode[STIX]{x0394}t=10^{-9}$
s and
$\unicode[STIX]{x0394}t=10^{-9}$
s and
 $N_{\text{pe}}=32\times 10^{6}$
electron markers.
$N_{\text{pe}}=32\times 10^{6}$
electron markers.

It is interesting to see that the number of electron markers has to be significantly higher than the number of ion markers. In the case of a GAE in a screw pinch it is a factor of approximately 60 higher, which is approximately the same as the square root of the mass ratio
 $m_{\text{i}}/m_{\text{e}}$
between ions and electrons. As the electrons are faster than the ions by the same factor, their contribution to the current density is typically much more pronounced. The same should hold for the statistical error of the current density of each species which can be assumed to be proportional to the absolute value of the current density. Thus, we need much more electron markers than ion markers primarily to diminish the much larger statistical error of the electron markers. Only then do the statistical errors of the current density of the ions and electrons on the right-hand side of Ampère’s law become comparable.
$m_{\text{i}}/m_{\text{e}}$
between ions and electrons. As the electrons are faster than the ions by the same factor, their contribution to the current density is typically much more pronounced. The same should hold for the statistical error of the current density of each species which can be assumed to be proportional to the absolute value of the current density. Thus, we need much more electron markers than ion markers primarily to diminish the much larger statistical error of the electron markers. Only then do the statistical errors of the current density of the ions and electrons on the right-hand side of Ampère’s law become comparable.
Finally, it is important to note that the gyro-averaging of the gyro-rings has a significant impact on the absolute value of the damping rate. Due to the large scale of the mode one might have expected the opposite to be true. For
 $N_{\text{pe}}=128\times 10^{6}$
electron markers and no gyro-averaging the damping rate becomes
$N_{\text{pe}}=128\times 10^{6}$
electron markers and no gyro-averaging the damping rate becomes
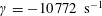 $\unicode[STIX]{x1D6FE}=-10\,772~\text{s}^{-1}$
and the angular frequency is
$\unicode[STIX]{x1D6FE}=-10\,772~\text{s}^{-1}$
and the angular frequency is
 $\unicode[STIX]{x1D714}=5150\,246~\text{rad}~\text{s}^{-1}$
. In contrast in the case of gyro-averaging, the damping rate becomes
$\unicode[STIX]{x1D714}=5150\,246~\text{rad}~\text{s}^{-1}$
. In contrast in the case of gyro-averaging, the damping rate becomes
 $\unicode[STIX]{x1D6FE}=-31\,088~\text{s}^{-1}$
and the angular frequency becomes
$\unicode[STIX]{x1D6FE}=-31\,088~\text{s}^{-1}$
and the angular frequency becomes
 $\unicode[STIX]{x1D714}=5150\,689~\text{rad}~\text{s}^{-1}$
. Although the gyro-rings are relatively small compared to the large scale GAE we clearly see that the damping rate becomes larger by a factor of three when gyro-averaging is included in the numerical model. The small damping rate is a pure kinetic effect which would not be seen in an MHD model. As this effect is so small it seems to be sensitive to other small effects.
$\unicode[STIX]{x1D714}=5150\,689~\text{rad}~\text{s}^{-1}$
. Although the gyro-rings are relatively small compared to the large scale GAE we clearly see that the damping rate becomes larger by a factor of three when gyro-averaging is included in the numerical model. The small damping rate is a pure kinetic effect which would not be seen in an MHD model. As this effect is so small it seems to be sensitive to other small effects.
(a,b) The damping rate and the angular frequency of the GAE in a screw pinch as a function of the electron markers
 $N_{\text{pe}}$
. The dashed blue lines depict simulations without gyro-averaging, i.e. with a vanishing gyro-ring in the charge and current assignments and in the equations of motion respectively, and the solid red lines depicts simulations with gyro-averaging. The simulation has been performed with a time-step size of
$N_{\text{pe}}$
. The dashed blue lines depict simulations without gyro-averaging, i.e. with a vanishing gyro-ring in the charge and current assignments and in the equations of motion respectively, and the solid red lines depicts simulations with gyro-averaging. The simulation has been performed with a time-step size of
 $\unicode[STIX]{x0394}t=10^{-9}$
s and
$\unicode[STIX]{x0394}t=10^{-9}$
s and
 $N_{\text{pi}}=4\times 10^{6}$
ion markers.
$N_{\text{pi}}=4\times 10^{6}$
ion markers.
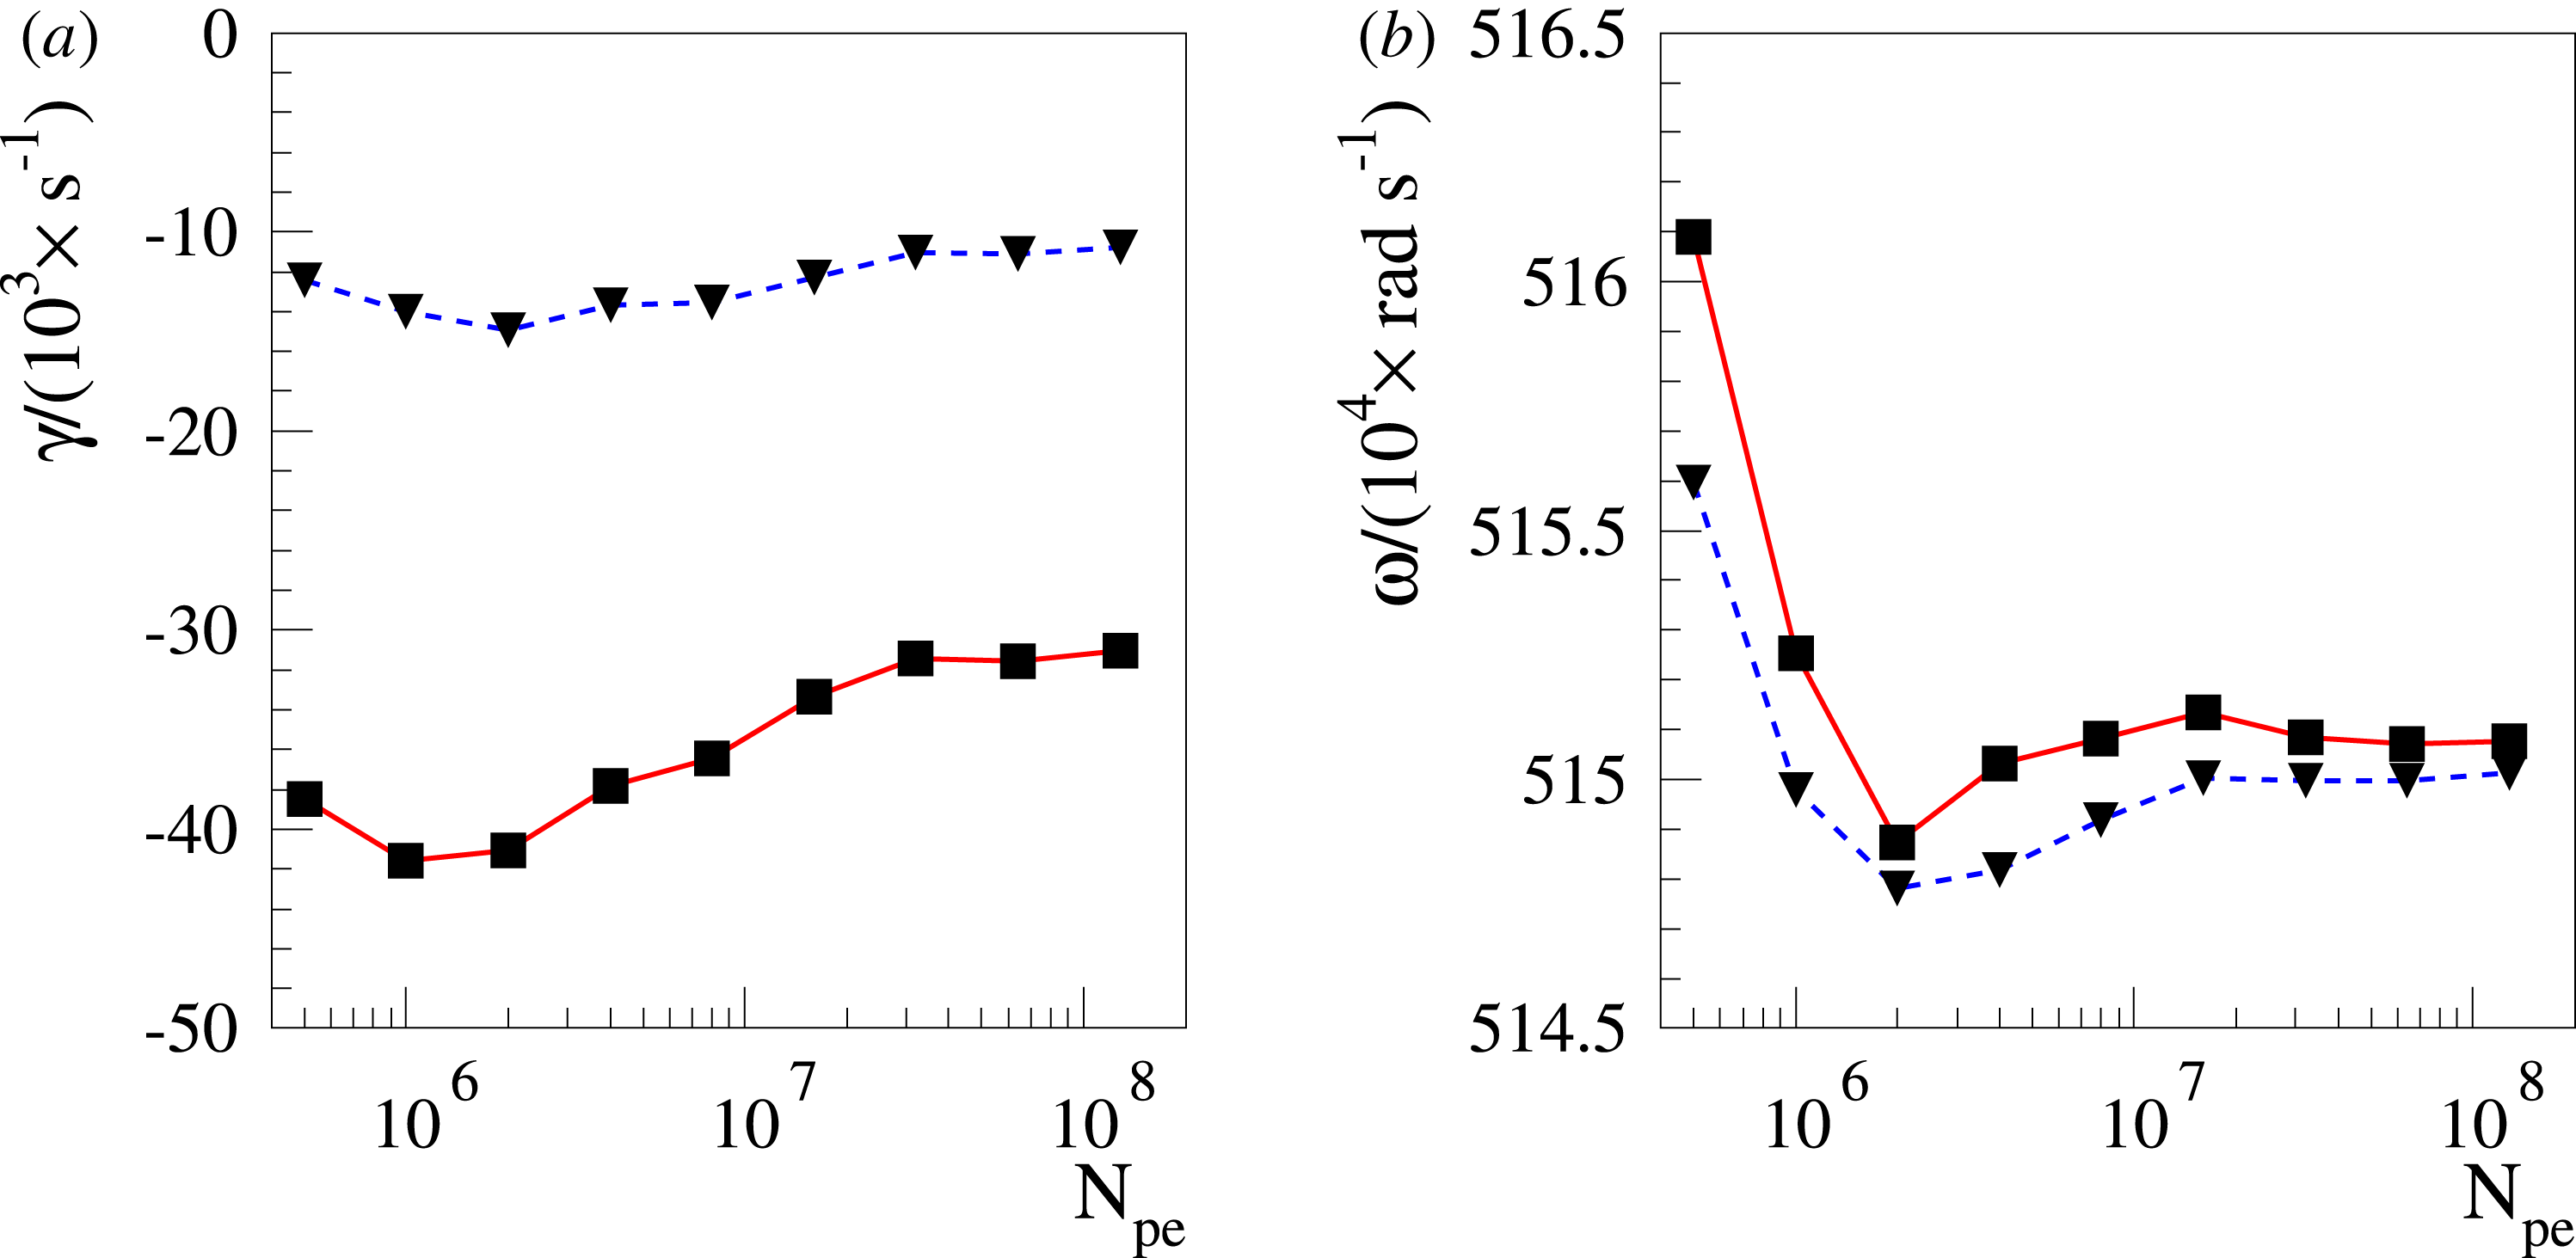
12.3 Toroidal Alfvén eigenmode (TAE) in a tokamak
Our third test case consists of a linear TAE simulation in a circular tokamak (Mishchenko, Könies & Hatzky Reference Mishchenko, Könies and Hatzky2009; Könies et al.
Reference Könies, Briguglio, Gorelenkov, Fehèr, Fu, Isaev, Lauber, Mishchenko, Spong and Todo2018) with a minor radius of
 $a=1$
m and a major radius of
$a=1$
m and a major radius of
 $R_{0}=10$
m. Thus, the aspect ratio
$R_{0}=10$
m. Thus, the aspect ratio
 $A=R_{0}/a$
is ten. The magnetic field
$A=R_{0}/a$
is ten. The magnetic field
 $\boldsymbol{B}$
with circular and concentric magnetic surfaces is given by
$\boldsymbol{B}$
with circular and concentric magnetic surfaces is given by
 $$\begin{eqnarray}\unicode[STIX]{x1D6F9}(r)=\int _{0}^{r}\frac{r^{\prime }B_{0}}{\bar{q}(r^{\prime })}\text{d}r^{\prime }\quad \text{and}\quad T=B_{0}R_{0},\end{eqnarray}$$
where
 $r$
is the radial coordinate of the polar coordinates
$r$
is the radial coordinate of the polar coordinates
 $(r,\unicode[STIX]{x1D717})$
(see appendix C) and
$(r,\unicode[STIX]{x1D717})$
(see appendix C) and
 $B_{0}=3$
T. The pseudo-safety factor (see also Jolliet (Reference Jolliet2009)(p. 31)) is defined by
$B_{0}=3$
T. The pseudo-safety factor (see also Jolliet (Reference Jolliet2009)(p. 31)) is defined by
 $$\begin{eqnarray}\bar{q}(r)\stackrel{\text{def}}{=}q(r)\sqrt{1-\left(\frac{r}{R_{0}}\right)^{2}}.\end{eqnarray}$$
The safety factor
 $q$
as a function of the radial coordinate
$q$
as a function of the radial coordinate
 $r$
is given by
$r$
is given by
 $$\begin{eqnarray}q(r)=\left[1.71+0.16\left(\frac{r}{a}\right)^{2}\right]\left[1-\left(\frac{r}{R_{0}}\right)^{2}\right].\end{eqnarray}$$
(a,b) The damping rate and the angular frequency of the TAE in a tokamak as a function of the time-step size
 $\unicode[STIX]{x0394}t$
. The simulation has been performed with
$\unicode[STIX]{x0394}t$
. The simulation has been performed with
 $N_{\text{pi}}=4\times 10^{6}$
ion markers and
$N_{\text{pi}}=4\times 10^{6}$
ion markers and
 $N_{\text{pe}}=64\times 10^{6}$
electron markers.
$N_{\text{pe}}=64\times 10^{6}$
electron markers.
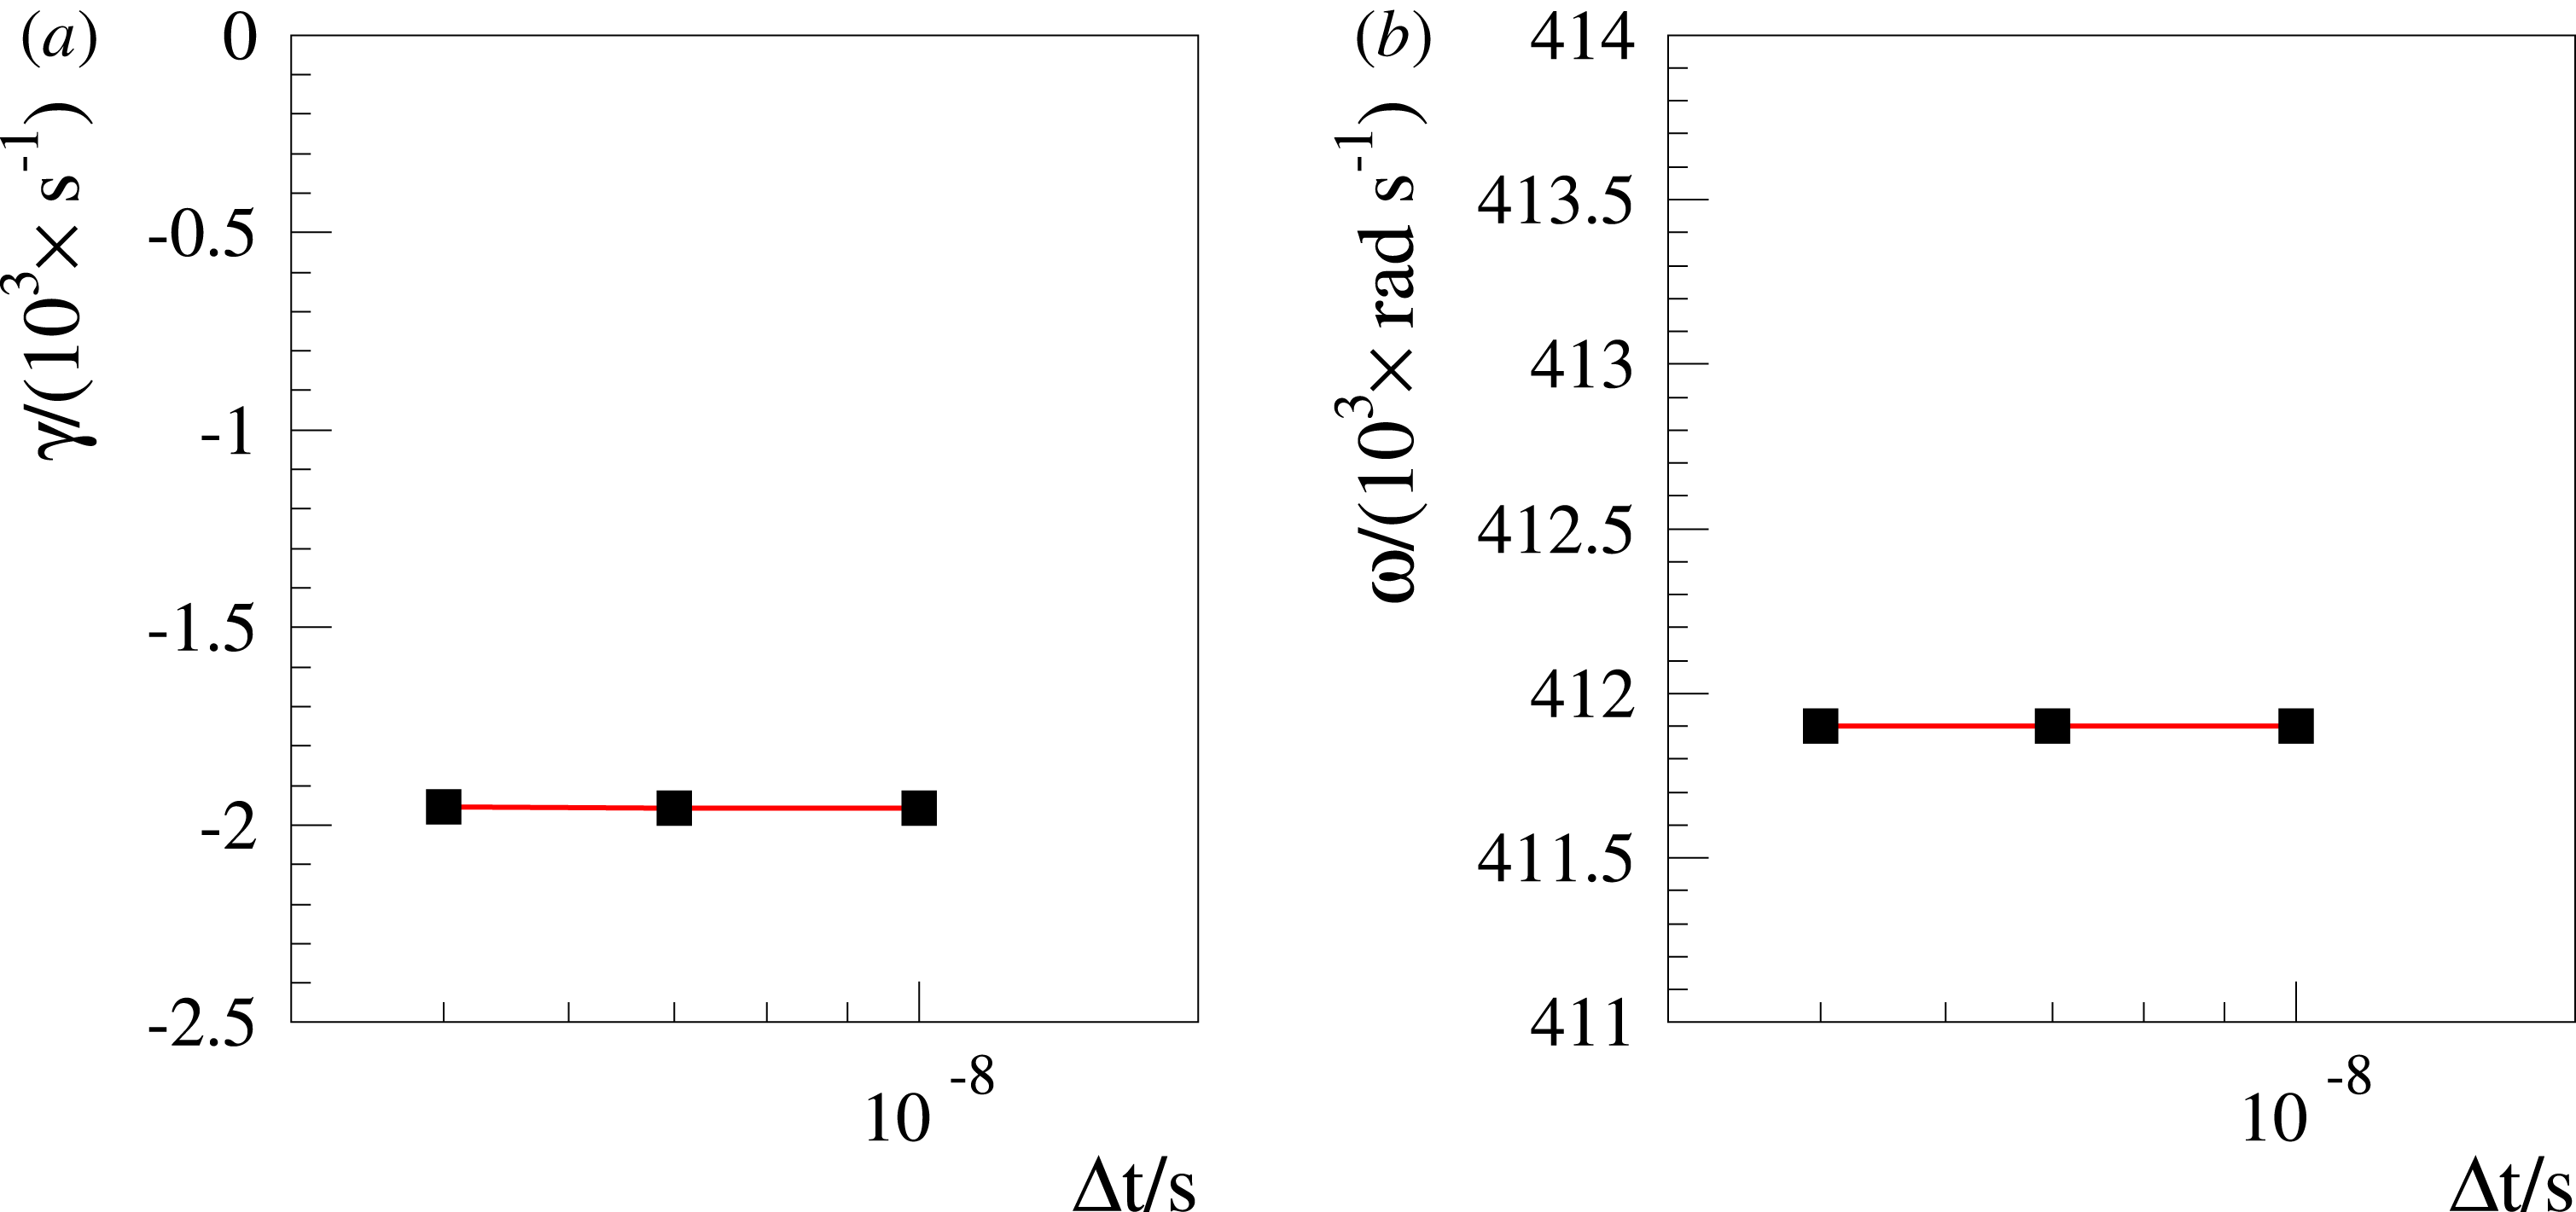
For our TAE simulation we select the
 $n=-6$
and
$n=-6$
and
 $m\in [7,14]$
modes and use a phase factor transformation (Fivaz et al.
Reference Fivaz, Brunner, de Ridder, Sauter, Tran, Vaclavik and Villard1998) of
$m\in [7,14]$
modes and use a phase factor transformation (Fivaz et al.
Reference Fivaz, Brunner, de Ridder, Sauter, Tran, Vaclavik and Villard1998) of
 $\unicode[STIX]{x0394}m=-10$
in the poloidal direction. As a result, the shifted poloidal modes are in the range of
$\unicode[STIX]{x0394}m=-10$
in the poloidal direction. As a result, the shifted poloidal modes are in the range of
 $m_{\text{shift}}\in [-3,4]$
. By doing this, we avoid to resolve numerically fine structures in the poloidal direction. Therefore, we need fewer markers and a lower grid resolution. For the discretisation of the radial
$m_{\text{shift}}\in [-3,4]$
. By doing this, we avoid to resolve numerically fine structures in the poloidal direction. Therefore, we need fewer markers and a lower grid resolution. For the discretisation of the radial
 $s$
-direction we use 100 B-splines while we use only 32 B-splines for the discretisation of the poloidal direction. In each case, the B-splines are of quadratic order. A Fourier ansatz is used in the toroidal direction. Our simulation domain is restricted to an annulus with
$s$
-direction we use 100 B-splines while we use only 32 B-splines for the discretisation of the poloidal direction. In each case, the B-splines are of quadratic order. A Fourier ansatz is used in the toroidal direction. Our simulation domain is restricted to an annulus with
 $s\in [0.1,1]$
. We introduce homogeneous Dirichlet boundary conditions at
$s\in [0.1,1]$
. We introduce homogeneous Dirichlet boundary conditions at
 $s=0.1$
and
$s=0.1$
and
 $s=1$
and periodic boundary conditions in the
$s=1$
and periodic boundary conditions in the
 $\unicode[STIX]{x1D717}$
and toroidal directions. A Fourier filter is applied in the poloidal direction.
$\unicode[STIX]{x1D717}$
and toroidal directions. A Fourier filter is applied in the poloidal direction.
In contrast to the screw pinch simulation, we use an unshifted Maxwellian, i.e.
 $\hat{u} _{0\text{e}}=0$
. The ratio of the ion mass (hydrogen) to the electron mass is
$\hat{u} _{0\text{e}}=0$
. The ratio of the ion mass (hydrogen) to the electron mass is
 $m_{\text{i}}/m_{\text{e}}=1836.2$
. We consider a homogeneous plasma without any density or temperature gradients, with equal ion and electron temperatures
$m_{\text{i}}/m_{\text{e}}=1836.2$
. We consider a homogeneous plasma without any density or temperature gradients, with equal ion and electron temperatures
 $T_{\text{i}}=T_{\text{e}}=1$
keV, and a moderate beta of
$T_{\text{i}}=T_{\text{e}}=1$
keV, and a moderate beta of
 $\unicode[STIX]{x1D6FD}_{0\text{e}}=0.179\,\%$
corresponding to a number density of
$\unicode[STIX]{x1D6FD}_{0\text{e}}=0.179\,\%$
corresponding to a number density of
 $\hat{n}_{0\text{i}}=\hat{n}_{0\text{e}}=2\times 10^{19}~\text{particles}~\text{m}^{-3}$
.
$\hat{n}_{0\text{i}}=\hat{n}_{0\text{e}}=2\times 10^{19}~\text{particles}~\text{m}^{-3}$
.
The loading of the ion and electron markers is done uniformly in the configuration and reduced velocity space, i.e.
 $g_{1}=1$
and
$g_{1}=1$
and
 $g_{2}=1$
, with
$g_{2}=1$
, with
 $\unicode[STIX]{x1D705}_{\text{vi}}=5$
and
$\unicode[STIX]{x1D705}_{\text{vi}}=5$
and
 $\unicode[STIX]{x1D705}_{\text{ve}}=4.75$
(see § 10.1). We initialise the recursion of the iterative solver with
$\unicode[STIX]{x1D705}_{\text{ve}}=4.75$
(see § 10.1). We initialise the recursion of the iterative solver with
 $\boldsymbol{d}^{(0)}=0$
and set the number of iterations to three. However, we do not perform any iterations for the ions. The simulation of the TAE runs up to the time
$\boldsymbol{d}^{(0)}=0$
and set the number of iterations to three. However, we do not perform any iterations for the ions. The simulation of the TAE runs up to the time
 $t_{\max }=5\times 10^{-4}$
s. We fitted the time sequence of the real part of the electrostatic potential in the time interval
$t_{\max }=5\times 10^{-4}$
s. We fitted the time sequence of the real part of the electrostatic potential in the time interval
 $t\in [4\times 10^{-4},5\times 10^{-4}]$
s in order to determine the damping rate
$t\in [4\times 10^{-4},5\times 10^{-4}]$
s in order to determine the damping rate
 $\unicode[STIX]{x1D6FE}$
and angular frequency
$\unicode[STIX]{x1D6FE}$
and angular frequency
 $\unicode[STIX]{x1D714}$
.
$\unicode[STIX]{x1D714}$
.
12.3.1 Numerical results
First we perform a convergence study over the time-step size
 $\unicode[STIX]{x0394}t$
. In figure 9(a,b), we can see the damping rate and the angular frequency of the TAE as a function of the time-step size
$\unicode[STIX]{x0394}t$
. In figure 9(a,b), we can see the damping rate and the angular frequency of the TAE as a function of the time-step size
 $\unicode[STIX]{x0394}t$
. Both quantities are well converged for time-step sizes smaller than
$\unicode[STIX]{x0394}t$
. Both quantities are well converged for time-step sizes smaller than
 $\unicode[STIX]{x0394}t\approx 10^{-8}$
s. If we further reduce the time-step size there is hardly any gain in accuracy. This is due to the phase factor transformation which makes the time integration stiff, i.e. convergence comes quite sudden and only after the time-step size has fallen below a critical value.
$\unicode[STIX]{x0394}t\approx 10^{-8}$
s. If we further reduce the time-step size there is hardly any gain in accuracy. This is due to the phase factor transformation which makes the time integration stiff, i.e. convergence comes quite sudden and only after the time-step size has fallen below a critical value.
Also the number of ion and electron markers are relevant for convergence. In figure 10(a,b), we can see the damping rate and the angular frequency of the TAE as a function of the electron markers
 $N_{\text{pe}}$
. We distinguish between the results of a simulation without gyro-rings (dashed line) and a simulation with gyro-rings (solid line). The simulation of the TAE is well resolved with
$N_{\text{pe}}$
. We distinguish between the results of a simulation without gyro-rings (dashed line) and a simulation with gyro-rings (solid line). The simulation of the TAE is well resolved with
 $N_{\text{pe}}\approx 64\times 10^{6}$
electron markers. For
$N_{\text{pe}}\approx 64\times 10^{6}$
electron markers. For
 $N_{\text{pe}}=256\times 10^{6}$
electron markers and no gyro-averaging the damping rate becomes
$N_{\text{pe}}=256\times 10^{6}$
electron markers and no gyro-averaging the damping rate becomes
 $\unicode[STIX]{x1D6FE}=-1223~\text{s}^{-1}$
and the angular frequency becomes
$\unicode[STIX]{x1D6FE}=-1223~\text{s}^{-1}$
and the angular frequency becomes
 $\unicode[STIX]{x1D714}=413\,267~\text{rad}~\text{s}^{-1}$
. In contrast in the case of gyro-averaging, the damping rate becomes
$\unicode[STIX]{x1D714}=413\,267~\text{rad}~\text{s}^{-1}$
. In contrast in the case of gyro-averaging, the damping rate becomes
 $\unicode[STIX]{x1D6FE}=-2184~\text{s}^{-1}$
and the angular frequency becomes
$\unicode[STIX]{x1D6FE}=-2184~\text{s}^{-1}$
and the angular frequency becomes
 $\unicode[STIX]{x1D714}=411\,853~\text{rad}~\text{s}^{-1}$
. Again, we can clearly see that gyro-averaging increases the damping rate by a factor of approximately two.
$\unicode[STIX]{x1D714}=411\,853~\text{rad}~\text{s}^{-1}$
. Again, we can clearly see that gyro-averaging increases the damping rate by a factor of approximately two.
(a,b) The damping rate and the angular frequency of the TAE in a tokamak as a function of the electron markers
 $N_{\text{pe}}$
. The dashed blue lines depict simulations without gyro-averaging, i.e. with a vanishing gyro-ring in the charge and current assignments and in the equations of motion, respectively and the solid red lines simulations with gyro-averaging. The simulation has been performed with a time-step size of
$N_{\text{pe}}$
. The dashed blue lines depict simulations without gyro-averaging, i.e. with a vanishing gyro-ring in the charge and current assignments and in the equations of motion, respectively and the solid red lines simulations with gyro-averaging. The simulation has been performed with a time-step size of
 $\unicode[STIX]{x0394}t=5\times 10^{-9}$
s and
$\unicode[STIX]{x0394}t=5\times 10^{-9}$
s and
 $N_{\text{pi}}=4\times 10^{6}$
ion markers.
$N_{\text{pi}}=4\times 10^{6}$
ion markers.
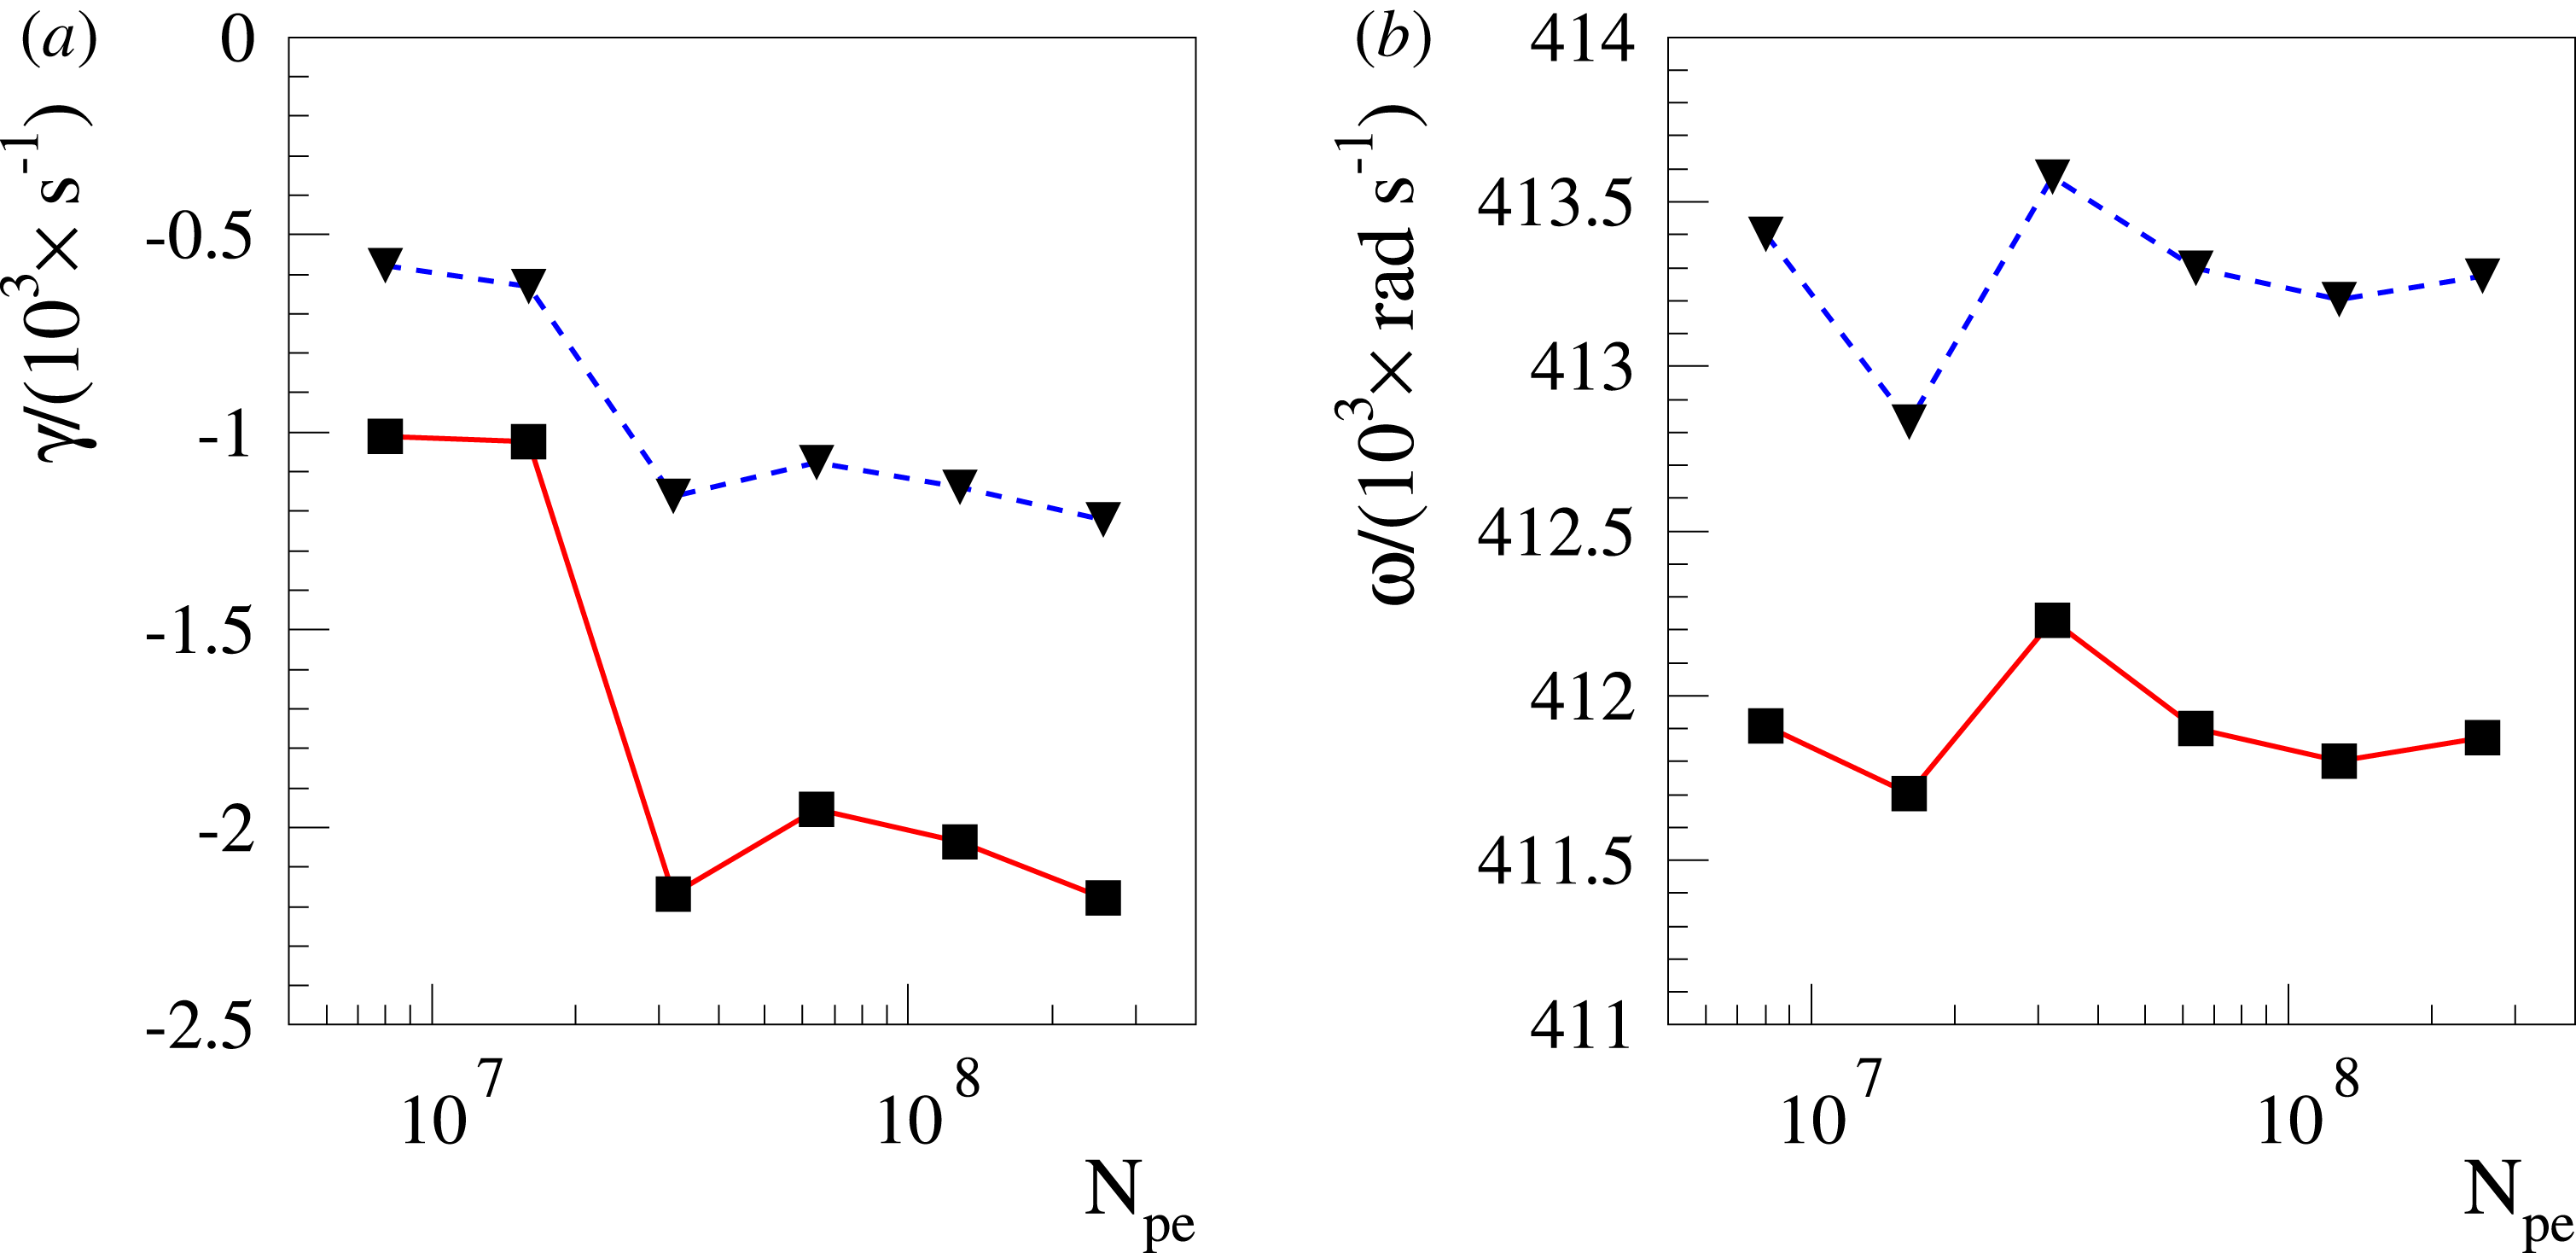
(a,b) The damping rate and the angular frequency of the GAE in a tokamak as a function of the time-step size
 $\unicode[STIX]{x0394}t$
. The simulation has been performed with
$\unicode[STIX]{x0394}t$
. The simulation has been performed with
 $N_{\text{pi}}=4\times 10^{6}$
ion markers and
$N_{\text{pi}}=4\times 10^{6}$
ion markers and
 $N_{\text{pe}}=32\times 10^{6}$
electron markers.
$N_{\text{pe}}=32\times 10^{6}$
electron markers.
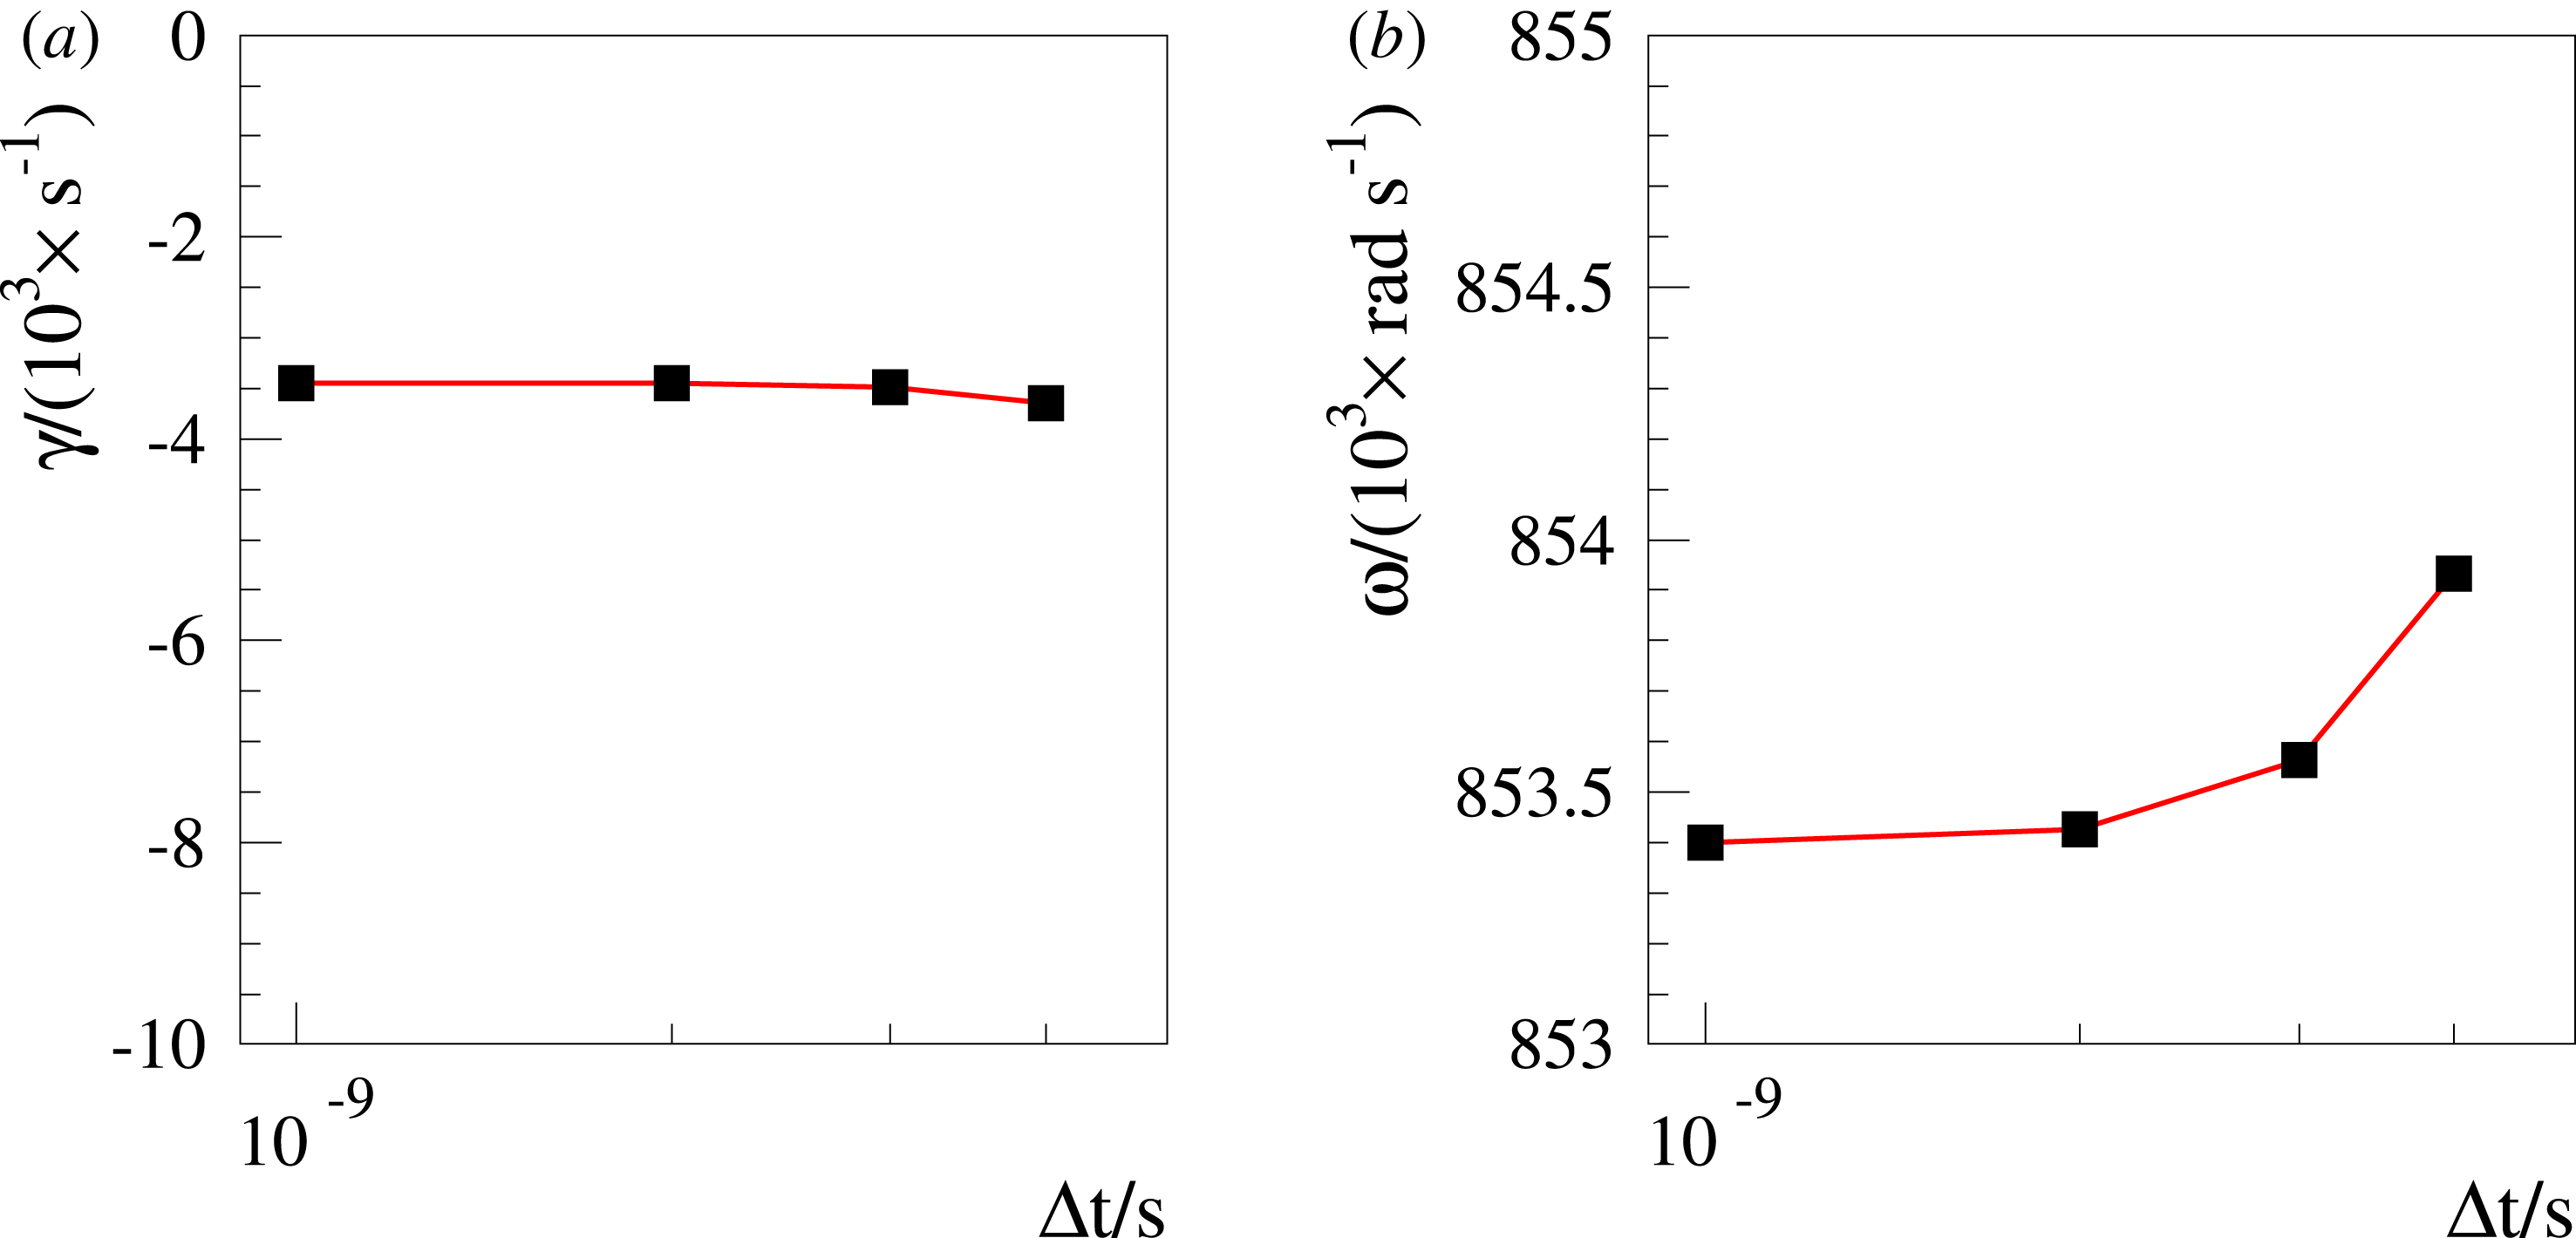
12.4 Global Alfvén eigenmode (GAE) in a tokamak
Our fourth and most ambitious test case consists of a linear GAE simulation in a circular tokamak with a minor radius of
 $a=1$
m and a major radius of
$a=1$
m and a major radius of
 $R_{0}=3$
m. Therefore, the aspect ratio is three which is much smaller than in the TAE test case. As a result, geometrical effects are much more pronounced. The magnetic field
$R_{0}=3$
m. Therefore, the aspect ratio is three which is much smaller than in the TAE test case. As a result, geometrical effects are much more pronounced. The magnetic field
 $\boldsymbol{B}$
is given by (12.9) with
$\boldsymbol{B}$
is given by (12.9) with
 $B_{0}=1$
T. It is of key importance that the equilibrium quantities are provided with a high accuracy (see § 6.2). The safety factor
$B_{0}=1$
T. It is of key importance that the equilibrium quantities are provided with a high accuracy (see § 6.2). The safety factor
 $q$
as a function of the radial coordinate
$q$
as a function of the radial coordinate
 $r$
is given by
$r$
is given by
 $$\begin{eqnarray}q(r)=\left[1.1+1.01268\left(\frac{r}{a}\right)^{1.66046}\right]\left[1-\left(\frac{r}{R_{0}}\right)^{2}\right].\end{eqnarray}$$
For our GAE simulation we select the
 $n=-1$
and
$n=-1$
and
 $m\in [-5,5]$
modes. Thus, the poloidal mode window is centred around the
$m\in [-5,5]$
modes. Thus, the poloidal mode window is centred around the
 $m=0$
mode which is by far the most dominant poloidal Fourier mode. For the discretisation of the radial
$m=0$
mode which is by far the most dominant poloidal Fourier mode. For the discretisation of the radial
 $s$
-direction and the poloidal direction we use 32 B-splines of quadratic order. It is significant to implement the correction term
$s$
-direction and the poloidal direction we use 32 B-splines of quadratic order. It is significant to implement the correction term
 $\unicode[STIX]{x0394}E_{\Vert }$
, equation (11.13). A Fourier ansatz is used in the toroidal direction. Our simulation domain covers the whole tokamak radius, i.e.
$\unicode[STIX]{x0394}E_{\Vert }$
, equation (11.13). A Fourier ansatz is used in the toroidal direction. Our simulation domain covers the whole tokamak radius, i.e.
 $s\in [0,1]$
. We introduce a homogeneous Dirichlet boundary condition at
$s\in [0,1]$
. We introduce a homogeneous Dirichlet boundary condition at
 $s=1$
and periodic boundary conditions in the
$s=1$
and periodic boundary conditions in the
 $\unicode[STIX]{x1D717}$
and toroidal directions. At the centre
$\unicode[STIX]{x1D717}$
and toroidal directions. At the centre
 $s=0$
we impose unicity (see § 7.2.1). A Fourier filter is applied in the poloidal direction.
$s=0$
we impose unicity (see § 7.2.1). A Fourier filter is applied in the poloidal direction.
In contrast to the GAE in a screw pinch simulation, we use an unshifted Maxwellian, i.e.
 $\hat{u} _{0\text{e}}=0$
. The ratio of the ion mass (deuteron) to the electron mass is
$\hat{u} _{0\text{e}}=0$
. The ratio of the ion mass (deuteron) to the electron mass is
 $m_{\text{i}}/m_{\text{e}}=3670.5$
. We consider a homogeneous plasma without any density or temperature gradients, with equal ion and electron temperatures
$m_{\text{i}}/m_{\text{e}}=3670.5$
. We consider a homogeneous plasma without any density or temperature gradients, with equal ion and electron temperatures
 $T_{\text{i}}=T_{\text{e}}=3.14$
keV, and a high beta of
$T_{\text{i}}=T_{\text{e}}=3.14$
keV, and a high beta of
 $\unicode[STIX]{x1D6FD}_{0\text{e}}=10.474\,\%$
corresponding to a number density of
$\unicode[STIX]{x1D6FD}_{0\text{e}}=10.474\,\%$
corresponding to a number density of
 $\hat{n}_{0\text{i}}=\hat{n}_{0\text{e}}=4.142\times 10^{19}~\text{particles}~\text{m}^{-3}$
. The relatively high density and the dominant
$\hat{n}_{0\text{i}}=\hat{n}_{0\text{e}}=4.142\times 10^{19}~\text{particles}~\text{m}^{-3}$
. The relatively high density and the dominant
 $m=0$
Fourier mode (see § 4.7) in combination with a small aspect ratio make the present GAE test case very challenging. It is far more demanding than the TAE test case from § 12.3 and hence justifies the very detailed description of the elaborate PIC algorithm.
$m=0$
Fourier mode (see § 4.7) in combination with a small aspect ratio make the present GAE test case very challenging. It is far more demanding than the TAE test case from § 12.3 and hence justifies the very detailed description of the elaborate PIC algorithm.
The loading of the ion and electron markers is done uniformly in the configuration and reduced velocity space, i.e.
 $g_{1}=1$
and
$g_{1}=1$
and
 $g_{2}=1$
, with
$g_{2}=1$
, with
 $\unicode[STIX]{x1D705}_{\text{vi}}=5$
and
$\unicode[STIX]{x1D705}_{\text{vi}}=5$
and
 $\unicode[STIX]{x1D705}_{\text{ve}}=4.5$
(see § 10.1). We initialise the recursion of the iterative solver with
$\unicode[STIX]{x1D705}_{\text{ve}}=4.5$
(see § 10.1). We initialise the recursion of the iterative solver with
 $\boldsymbol{d}^{(0)}=0$
and set the number of iterations to four. However, we perform only one iteration for the ions. The simulation of the GAE runs up to the time
$\boldsymbol{d}^{(0)}=0$
and set the number of iterations to four. However, we perform only one iteration for the ions. The simulation of the GAE runs up to the time
 $t_{\max }=2\times 10^{-4}$
s. We fitted the time sequence of the real part of the electrostatic potential in the time interval
$t_{\max }=2\times 10^{-4}$
s. We fitted the time sequence of the real part of the electrostatic potential in the time interval
 $t\in [1.7\times 10^{-4},2\times 10^{-4}]$
s in order to determine the damping rate
$t\in [1.7\times 10^{-4},2\times 10^{-4}]$
s in order to determine the damping rate
 $\unicode[STIX]{x1D6FE}$
and angular frequency
$\unicode[STIX]{x1D6FE}$
and angular frequency
 $\unicode[STIX]{x1D714}$
.
$\unicode[STIX]{x1D714}$
.
12.4.1 Numerical results
First we perform a convergence study over the time-step size
 $\unicode[STIX]{x0394}t$
. In figure 11(a,b), we can see the damping rate and the angular frequency of the GAE as a function of the time-step size
$\unicode[STIX]{x0394}t$
. In figure 11(a,b), we can see the damping rate and the angular frequency of the GAE as a function of the time-step size
 $\unicode[STIX]{x0394}t$
. Both quantities are well converged for time-step sizes smaller than
$\unicode[STIX]{x0394}t$
. Both quantities are well converged for time-step sizes smaller than
 $\unicode[STIX]{x0394}t\approx 2\times 10^{-9}$
s.
$\unicode[STIX]{x0394}t\approx 2\times 10^{-9}$
s.
Again, both the numbers of ion and electron markers are relevant for convergence. In figure 12(a,b), we can see the damping rate and the angular frequency of the GAE as a function of the electron markers
 $N_{\text{pe}}$
. We distinguish between the result of a simulation without gyro-rings (dashed line) and a simulation with gyro-rings (solid line). The simulation of the GAE is resolved for a number of
$N_{\text{pe}}$
. We distinguish between the result of a simulation without gyro-rings (dashed line) and a simulation with gyro-rings (solid line). The simulation of the GAE is resolved for a number of
 $N_{\text{pe}}\approx 128\times 10^{6}$
electron markers. For
$N_{\text{pe}}\approx 128\times 10^{6}$
electron markers. For
 $N_{\text{pe}}=256\times 10^{6}$
electron markers and no gyro-averaging the damping rate becomes
$N_{\text{pe}}=256\times 10^{6}$
electron markers and no gyro-averaging the damping rate becomes
 $\unicode[STIX]{x1D6FE}=-4815~\text{s}^{-1}$
and the angular frequency becomes
$\unicode[STIX]{x1D6FE}=-4815~\text{s}^{-1}$
and the angular frequency becomes
 $\unicode[STIX]{x1D714}=857\,309~\text{rad}~\text{s}^{-1}$
. In case of gyro-averaging, the damping rate becomes
$\unicode[STIX]{x1D714}=857\,309~\text{rad}~\text{s}^{-1}$
. In case of gyro-averaging, the damping rate becomes
 $\unicode[STIX]{x1D6FE}=-5559~\text{s}^{-1}$
and the angular frequency becomes
$\unicode[STIX]{x1D6FE}=-5559~\text{s}^{-1}$
and the angular frequency becomes
 $\unicode[STIX]{x1D714}=856\,901~\text{rad}~\text{s}^{-1}$
. Thus, the damping rate does not depend as much on the gyro-averaging of the gyro-rings as it does in the case of the previous two tests. An explanation might be that the dominant
$\unicode[STIX]{x1D714}=856\,901~\text{rad}~\text{s}^{-1}$
. Thus, the damping rate does not depend as much on the gyro-averaging of the gyro-rings as it does in the case of the previous two tests. An explanation might be that the dominant
 $m=0$
Fourier mode is hardly influenced by gyro-averaging.
$m=0$
Fourier mode is hardly influenced by gyro-averaging.
(a,b) The damping rate and the angular frequency of the GAE in a tokamak as a function of the electron markers
 $N_{\text{pe}}$
. The dashed blue lines depict simulations without gyro-averaging, i.e. with a vanishing gyro-ring in the charge and current assignments and in the equations of motion, respectively and the solid red lines simulations with gyro-averaging. The simulation has been performed with a time-step size of
$N_{\text{pe}}$
. The dashed blue lines depict simulations without gyro-averaging, i.e. with a vanishing gyro-ring in the charge and current assignments and in the equations of motion, respectively and the solid red lines simulations with gyro-averaging. The simulation has been performed with a time-step size of
 $\unicode[STIX]{x0394}t=2\times 10^{-9}$
s and
$\unicode[STIX]{x0394}t=2\times 10^{-9}$
s and
 $N_{\text{pi}}=4\times 10^{6}$
ion markers.
$N_{\text{pi}}=4\times 10^{6}$
ion markers.
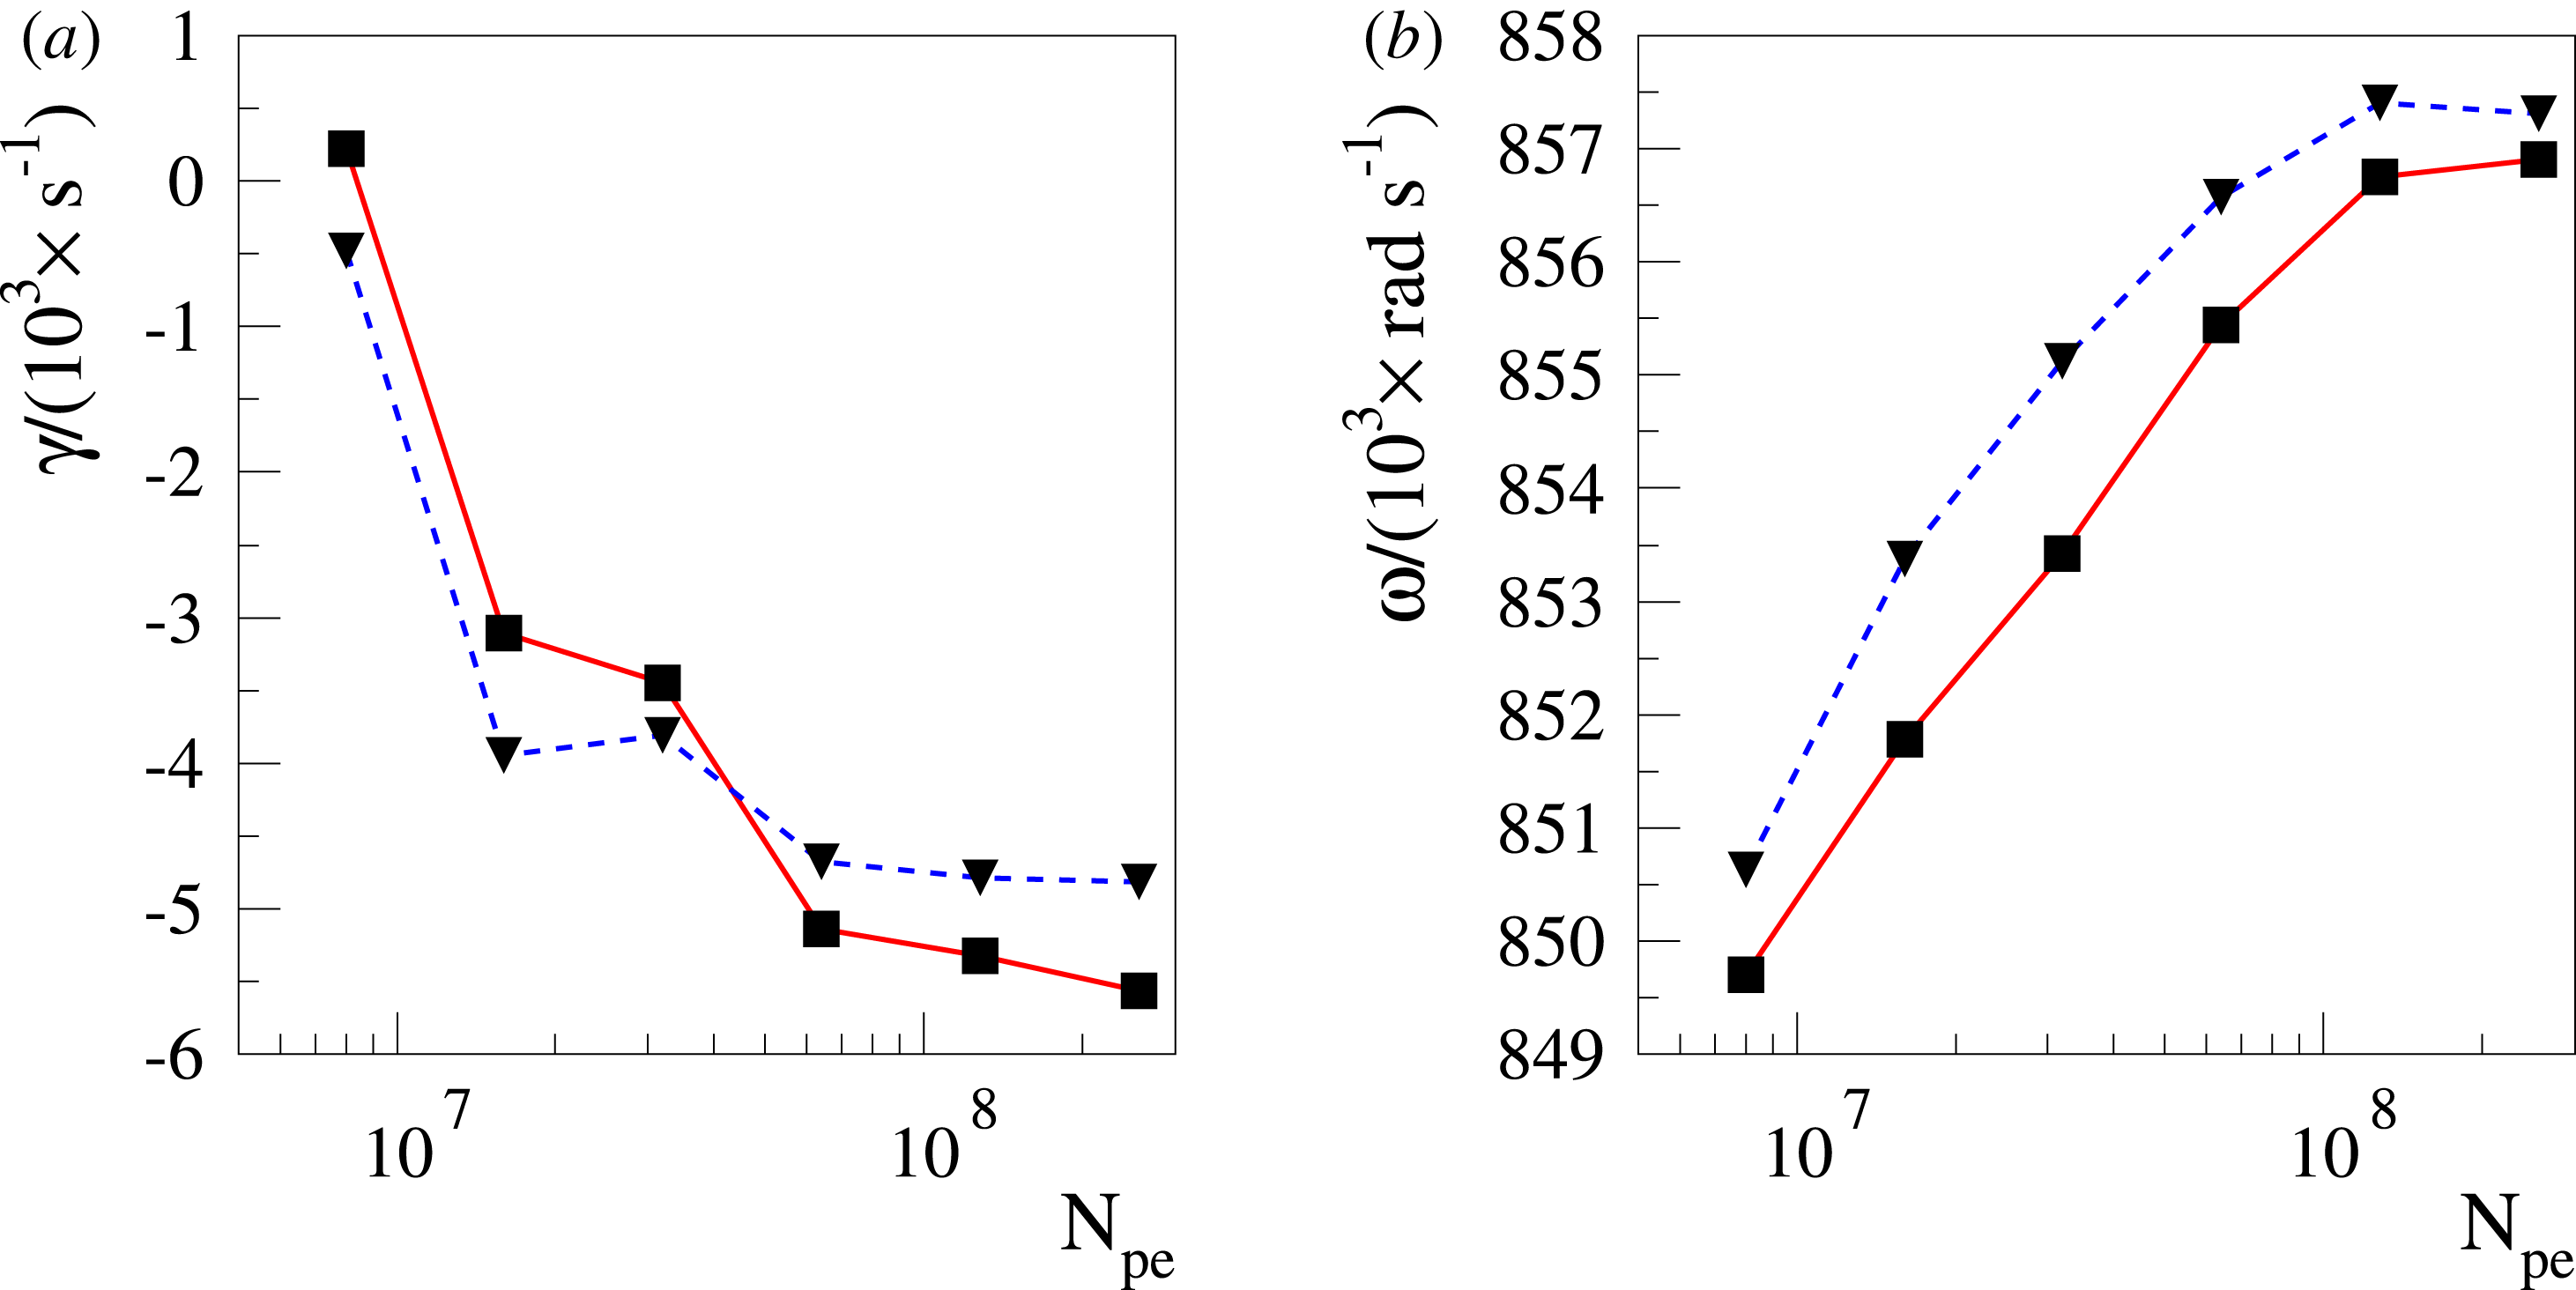
12.5 Nonlinear tearing mode in a sheared slab
Our nonlinear test case consists of a tearing mode being simulated in a sheared slab (Zacharias, Kleiber & Hatzky Reference Zacharias, Kleiber and Hatzky2012; Kleiber et al.
Reference Kleiber, Hatzky, Könies, Mishchenko and Sonnendrücker2016). The mode wavenumbers are
 $k_{y}\unicode[STIX]{x1D70C}_{0\text{i}}=0.62832$
and
$k_{y}\unicode[STIX]{x1D70C}_{0\text{i}}=0.62832$
and
 $k_{z}\unicode[STIX]{x1D70C}_{0\text{i}}=0$
. The box size is given by
$k_{z}\unicode[STIX]{x1D70C}_{0\text{i}}=0$
. The box size is given by
 $L_{x}/\unicode[STIX]{x1D70C}_{0\text{i}}=10$
,
$L_{x}/\unicode[STIX]{x1D70C}_{0\text{i}}=10$
,
 $L_{y}/\unicode[STIX]{x1D70C}_{0\text{i}}=10$
and
$L_{y}/\unicode[STIX]{x1D70C}_{0\text{i}}=10$
and
 $L_{z}/\unicode[STIX]{x1D70C}_{0\text{i}}=1391$
. The ratio of the ion mass (hydrogen) to the electron mass is
$L_{z}/\unicode[STIX]{x1D70C}_{0\text{i}}=1391$
. The ratio of the ion mass (hydrogen) to the electron mass is
 $m_{\text{i}}/m_{\text{e}}=1836.2$
. We consider a homogeneous plasma without any density or temperature gradients and with equal ion and electron temperatures
$m_{\text{i}}/m_{\text{e}}=1836.2$
. We consider a homogeneous plasma without any density or temperature gradients and with equal ion and electron temperatures
 $T_{\text{i}}=T_{\text{e}}=9.93$
keV, and a high beta of
$T_{\text{i}}=T_{\text{e}}=9.93$
keV, and a high beta of
 $\unicode[STIX]{x1D6FD}_{0\text{e}}=4\,\%$
, corresponding to a number density of
$\unicode[STIX]{x1D6FD}_{0\text{e}}=4\,\%$
, corresponding to a number density of
 $n_{0\text{e}}=7.22\times 10^{17}~\text{particles}~\text{m}^{-3}$
.
$n_{0\text{e}}=7.22\times 10^{17}~\text{particles}~\text{m}^{-3}$
.
The equilibrium magnetic field
 $\boldsymbol{B}$
consists of a strong guiding field
$\boldsymbol{B}$
consists of a strong guiding field
 $B_{z}$
in the
$B_{z}$
in the
 $z$
-direction and a sheared field
$z$
-direction and a sheared field
 $$\begin{eqnarray}B_{y}=B_{y,0}\,\text{erf}\left(\frac{x-\frac{1}{2}L_{x}}{L_{\text{s}}}\right)\end{eqnarray}$$
pointing in the
 $y$
-direction. The
$y$
-direction. The
 $\hat{u} _{0\text{e}}$
-profile is chosen to be consistent with the parallel background current of the
$\hat{u} _{0\text{e}}$
-profile is chosen to be consistent with the parallel background current of the
 $B_{y}$
component of the equilibrium magnetic field (compare with § 12.2). The parameters
$B_{y}$
component of the equilibrium magnetic field (compare with § 12.2). The parameters
 $B_{y,0}$
and
$B_{y,0}$
and
 $L_{\text{s}}$
determine the strength of the field and the shear length. They are given by
$L_{\text{s}}$
determine the strength of the field and the shear length. They are given by
 $L_{\text{s}}=0.5$
and
$L_{\text{s}}=0.5$
and
 $B_{y,0}/B_{z}=0.02$
.
$B_{y,0}/B_{z}=0.02$
.
The
 $x$
- and
$x$
- and
 $y$
-directions of the potential equations are discretised by B-splines of quadratic order. We use
$y$
-directions of the potential equations are discretised by B-splines of quadratic order. We use
 $N_{x}=128$
B-splines in the
$N_{x}=128$
B-splines in the
 $x$
-direction and
$x$
-direction and
 $N_{y}=8$
B-splines in the
$N_{y}=8$
B-splines in the
 $y$
-direction. We introduce a homogeneous Dirichlet boundary condition in the
$y$
-direction. We introduce a homogeneous Dirichlet boundary condition in the
 $x$
-direction and periodic boundary conditions in the
$x$
-direction and periodic boundary conditions in the
 $y$
- and
$y$
- and
 $z$
-directions. A Fourier filter is applied in the
$z$
-directions. A Fourier filter is applied in the
 $y$
-direction. The loading of the
$y$
-direction. The loading of the
 $N_{\text{pi}}=N_{\text{pe}}=4\times 10^{6}$
ion and electron markers is done uniformly in the configuration and reduced velocity space, i.e.
$N_{\text{pi}}=N_{\text{pe}}=4\times 10^{6}$
ion and electron markers is done uniformly in the configuration and reduced velocity space, i.e.
 $g_{1}=1$
and
$g_{1}=1$
and
 $g_{2}=1$
, with
$g_{2}=1$
, with
 $\unicode[STIX]{x1D705}_{\text{vi}}=\unicode[STIX]{x1D705}_{\text{ve}}=4.75$
(see § 10.1). The time-step size has been converged to
$\unicode[STIX]{x1D705}_{\text{vi}}=\unicode[STIX]{x1D705}_{\text{ve}}=4.75$
(see § 10.1). The time-step size has been converged to
 $\unicode[STIX]{x0394}t=10^{-8}$
s. We initialise the recursion of the iterative solver with
$\unicode[STIX]{x0394}t=10^{-8}$
s. We initialise the recursion of the iterative solver with
 $\boldsymbol{d}^{(0)}=0$
and set the number of iterations to one (see § F.1). However, we do not perform any iterations for the ions. The simulation of the nonlinear tearing mode runs for
$\boldsymbol{d}^{(0)}=0$
and set the number of iterations to one (see § F.1). However, we do not perform any iterations for the ions. The simulation of the nonlinear tearing mode runs for
 $t_{\max }=2\times 10^{-5}$
s.
$t_{\max }=2\times 10^{-5}$
s.
12.5.1 Numerical results
The result of the nonlinear tearing mode simulation is presented in figure 13. In (a,b), the radially averaged perturbed electrostatic and magnetic potential of the tearing mode are depicted as a function of time. We compare the result of the linearised pull-back transformation (solid blue line) of the charge- and current-assignment vectors (see § 8.1.1) with the result of the exact pull-back transformation of the vectors (dotted red line) (see § 8.2). Although the linearised pull-back transformation ignores the contribution of the nonlinear skin term (see § 4.5), there is only a very small difference between the curves. In the case of the tearing mode simulation, the linearised pull-back transformation of the moments seems to be a good approximation of the exact one. However, this changes for simulations of nonlinear modes where the nonlinear skin term is not negligible in comparison to the Laplacian in Ampère’s law.
(a,b) The radially averaged perturbed electrostatic and magnetic potential of the nonlinear tearing mode as a function of time. The linearised pull-back transformation of the moments (solid blue line) is compared with the consistent nonlinear one (dotted red line).
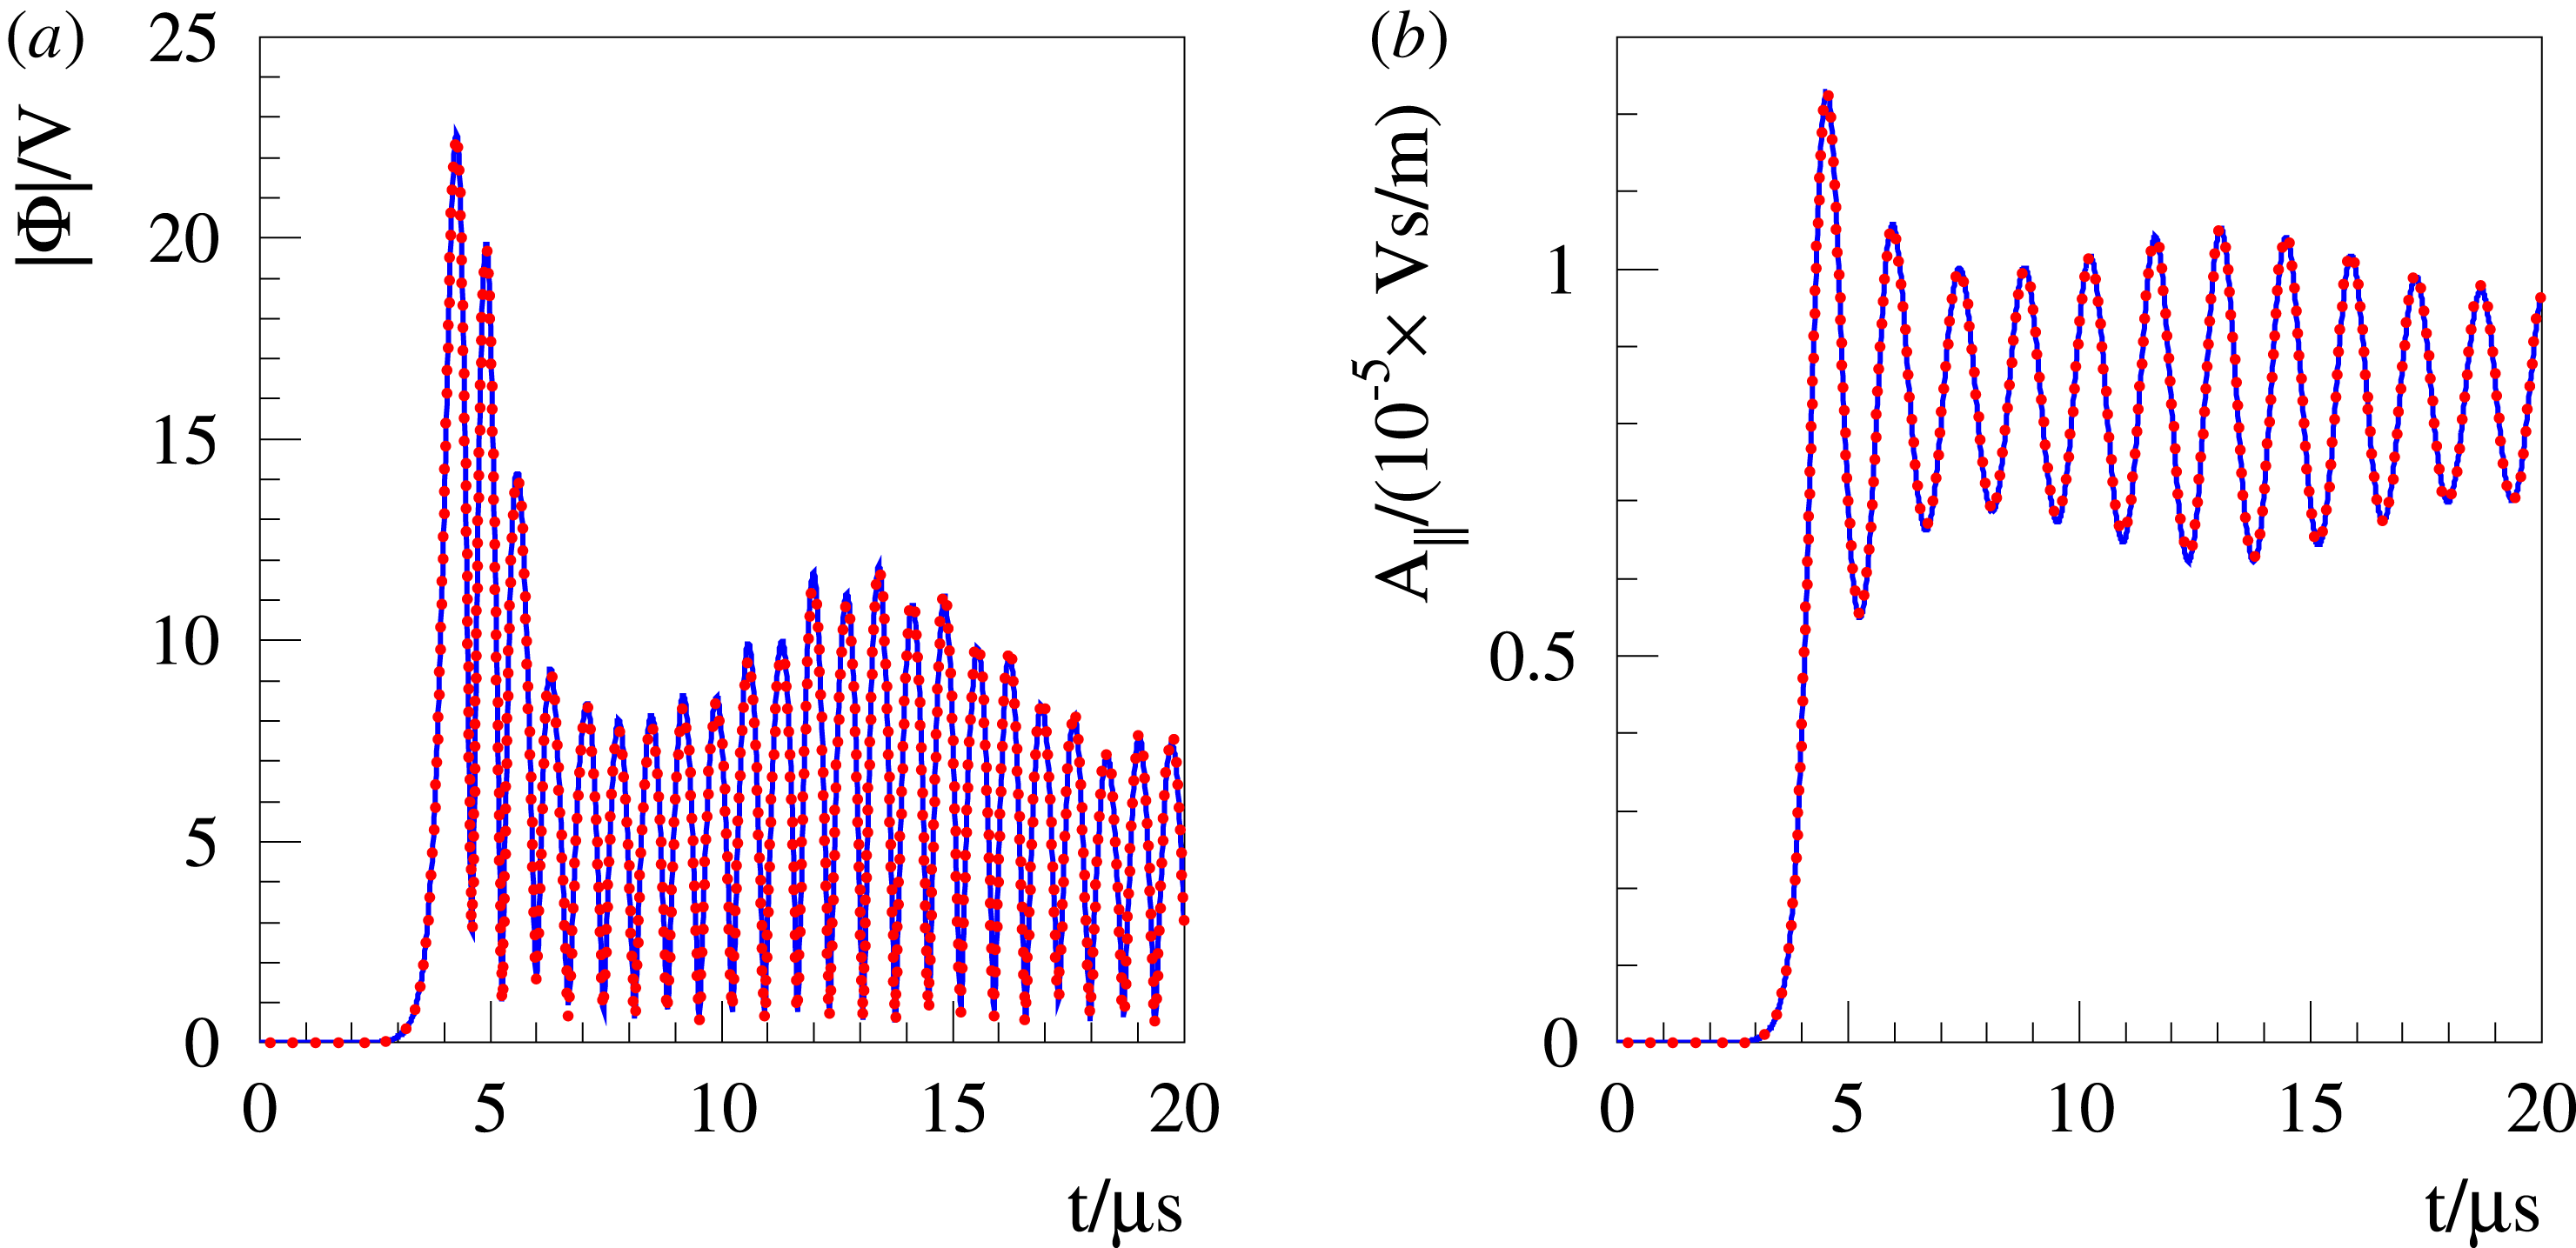
13 Conclusions
It is of key importance to understand that for our gyrokinetic model just a linear coordinate transformation in the parallel velocity coordinate links the symplectic with the Hamiltonian formulation. This implies certain dependencies between quantities in both formulations. One convenient result is that the weights of the markers are invariant under the coordinate transformation. This makes the transformation of the distribution function
 $f$
between the formulations relatively easy. Another important result is that in the symplectic formulation a partial time derivative of the perturbed magnetic potential
$f$
between the formulations relatively easy. Another important result is that in the symplectic formulation a partial time derivative of the perturbed magnetic potential
 $\unicode[STIX]{x1D6FF}A_{\Vert }$
occurs in the parallel dynamics which does not occur in the Hamiltonian formulation. Such a term makes it numerically very difficult to integrate the markers along the characteristics in time. Therefore, it is quite natural to evolve the phase-space positions of the markers in the Hamiltonian formulation.
$\unicode[STIX]{x1D6FF}A_{\Vert }$
occurs in the parallel dynamics which does not occur in the Hamiltonian formulation. Such a term makes it numerically very difficult to integrate the markers along the characteristics in time. Therefore, it is quite natural to evolve the phase-space positions of the markers in the Hamiltonian formulation.
Furthermore, the coordinate transformation has some implications on the potential equations. In the symplectic formulation, the quasi-neutrality equation and Ampère’s law have a relatively simple structure. Both are differential equations of second order. Unfortunately, the situation is much more complex in the Hamiltonian formulation. Already in the linear case Ampère’s law becomes an integro-differential equation. For each species an additional term – the so-called ‘skin term’ – appears, which due to the gyro-averaging of the ions, changes the character of the equation. In the nonlinear case, the problem is aggravated because the nonlinear skin terms depend on both the perturbed magnetic potential
 $\unicode[STIX]{x1D6FF}A_{\Vert }$
and the zeroth moment of the perturbation to the distribution function,
$\unicode[STIX]{x1D6FF}A_{\Vert }$
and the zeroth moment of the perturbation to the distribution function,
 $\unicode[STIX]{x1D6FF}f^{\text{h}}$
. Even in the linear case, the implementation of a direct solver is difficult and the resulting matrix equation is very costly to solve.
$\unicode[STIX]{x1D6FF}f^{\text{h}}$
. Even in the linear case, the implementation of a direct solver is difficult and the resulting matrix equation is very costly to solve.
In numerical simulation, we have to face the situation that the velocity sphere is typically finite due to limited compute resources. In the symplectic formulation, the consequences for the potential equations are limited. However, in the Hamiltonian formulation the
 $\tilde{p}_{\Vert }$
-velocity sphere is oscillating as a function of
$\tilde{p}_{\Vert }$
-velocity sphere is oscillating as a function of
 $\unicode[STIX]{x1D6FF}A_{\Vert }$
around the
$\unicode[STIX]{x1D6FF}A_{\Vert }$
around the
 $v_{\Vert }$
-velocity sphere which stays as a whole fixed. Thus, the integration limit of the moments of the distribution function
$v_{\Vert }$
-velocity sphere which stays as a whole fixed. Thus, the integration limit of the moments of the distribution function
 $f^{\text{h}}$
becomes a function of time. This also affects the moments of the background distribution function
$f^{\text{h}}$
becomes a function of time. This also affects the moments of the background distribution function
 $f_{0}$
which all develop a nonlinear dependency on
$f_{0}$
which all develop a nonlinear dependency on
 $\unicode[STIX]{x1D6FF}A_{\Vert }$
. Hence, in the nonlinear case a separation between background and perturbed quantities, done by the
$\unicode[STIX]{x1D6FF}A_{\Vert }$
. Hence, in the nonlinear case a separation between background and perturbed quantities, done by the
 $\unicode[STIX]{x1D6FF}f$
-ansatz, becomes impracticable.
$\unicode[STIX]{x1D6FF}f$
-ansatz, becomes impracticable.
In addition, the
 $\unicode[STIX]{x1D6FF}f$
-ansatz becomes less efficient as the background part
$\unicode[STIX]{x1D6FF}f$
-ansatz becomes less efficient as the background part
 $f_{0}$
, which stays fixed in relation to the
$f_{0}$
, which stays fixed in relation to the
 $\tilde{p}_{\Vert }$
-coordinate frame, becomes less aligned to the distribution function
$\tilde{p}_{\Vert }$
-coordinate frame, becomes less aligned to the distribution function
 $f^{\text{h}}$
. As a result, a spurious so-called ‘adiabatic’ part of the perturbation to the distribution function,
$f^{\text{h}}$
. As a result, a spurious so-called ‘adiabatic’ part of the perturbation to the distribution function,
 $\unicode[STIX]{x1D6FF}f^{\text{h}}$
, appears which causes a large statistical error. Under some assumptions we are able to quantify analytically the statistical error for the particle and current number density caused by the adiabatic part. We have explained how the ‘cancellation problem’ depends on the poloidal mode number
$\unicode[STIX]{x1D6FF}f^{\text{h}}$
, appears which causes a large statistical error. Under some assumptions we are able to quantify analytically the statistical error for the particle and current number density caused by the adiabatic part. We have explained how the ‘cancellation problem’ depends on the poloidal mode number
 $m$
and the radial position. It becomes clear that the
$m$
and the radial position. It becomes clear that the
 $m=0$
mode, which plays a major role in the formation of the zonal flow, is affected most.
$m=0$
mode, which plays a major role in the formation of the zonal flow, is affected most.
To avoid all these obstacles when solving the potential equations in the Hamiltonian formulation, we choose their symplectic formulation instead. We propose a hybrid scheme which evolves the markers along the characteristics in the Hamiltonian formulation, but solves the potential equations in the symplectic one. In the linear case, the corresponding coordinate transformation of the weights can be included in the discretised Ampère’s law. The resulting matrix equation can be solved efficiently by an iterative scheme. In the nonlinear case, an iterative procedure is necessary to solve Ampère’s law and to perform an iterative transformation of the weights to their symplectic discretisation at the same time. Special care has been taken to speed up the convergence of the iterative solver for the linear and nonlinear case. After Ampère’s law is solved, the markers can be transformed to the symplectic formulation and it becomes straightforward to solve the quasi-neutrality equation in the symplectic formulation.
An additional problem occurs when marginally damped MHD modes are to be simulated within a gyrokinetic model. The kinetic effects are usually very small and thus not easy to resolve within a PIC simulation. Special care has to be taken to avoid spurious modes caused by an improper discretisation of the parallel electric field on the marker level. Especially, in the MHD limit (
 $k_{\bot }\unicode[STIX]{x1D70C}\rightarrow 0$
) the parallel electric field has to vanish in the parallel dynamics of both the symplectic and Hamiltonian formulations. We solve the problem by a specific projection of the parallel gradient of
$k_{\bot }\unicode[STIX]{x1D70C}\rightarrow 0$
) the parallel electric field has to vanish in the parallel dynamics of both the symplectic and Hamiltonian formulations. We solve the problem by a specific projection of the parallel gradient of
 $\unicode[STIX]{x1D6FF}\unicode[STIX]{x1D719}$
onto the B-spline basis.
$\unicode[STIX]{x1D6FF}\unicode[STIX]{x1D719}$
onto the B-spline basis.
Finally, we presented a
 $\unicode[STIX]{x1D6FF}f$
-PIC method which is able to simulate electromagnetic modes with a reasonable numerical effort. The method is able to cope with realistic devices like e.g. large tokamaks with a small aspect ratio. This includes the simulation of marginally damped modes in the MHD limit. To prove this, we have presented the following four linear simulations: a shear Alfvén wave in an unsheared slab, a GAE in a screw pinch, a TAE in a tokamak and a GAE with a dominant
$\unicode[STIX]{x1D6FF}f$
-PIC method which is able to simulate electromagnetic modes with a reasonable numerical effort. The method is able to cope with realistic devices like e.g. large tokamaks with a small aspect ratio. This includes the simulation of marginally damped modes in the MHD limit. To prove this, we have presented the following four linear simulations: a shear Alfvén wave in an unsheared slab, a GAE in a screw pinch, a TAE in a tokamak and a GAE with a dominant
 $m=0$
Fourier mode in a tokamak. Especially, the last one is very challenging and motivated us to describe our numerical scheme in great detail which should make it easy to adopt it. In addition, we performed a nonlinear simulation of a tearing mode in a sheared slab. Therefore, our numerical method is capable of simulating both linear and nonlinear modes.
$m=0$
Fourier mode in a tokamak. Especially, the last one is very challenging and motivated us to describe our numerical scheme in great detail which should make it easy to adopt it. In addition, we performed a nonlinear simulation of a tearing mode in a sheared slab. Therefore, our numerical method is capable of simulating both linear and nonlinear modes.
14 Outlook
In our hybrid scheme we evolve the phase-space positions of the markers by integrating the equations of motions in the Hamiltonian formulation. As a consequence, the perturbed weights
 $\unicode[STIX]{x1D6FF}w^{\text{h}}$
evolve a large spurious adiabatic part. This imposes a very high accuracy when performing the pull-back transformation of the weights from the Hamiltonian to the symplectic formulation. However, it is a necessary step to be able to solve the potential equations in the symplectic formulation.
$\unicode[STIX]{x1D6FF}w^{\text{h}}$
evolve a large spurious adiabatic part. This imposes a very high accuracy when performing the pull-back transformation of the weights from the Hamiltonian to the symplectic formulation. However, it is a necessary step to be able to solve the potential equations in the symplectic formulation.
Hence, it would be much more efficient to split the perturbed magnetic potential
 $\unicode[STIX]{x1D6FF}A_{\Vert }$
in a symplectic
$\unicode[STIX]{x1D6FF}A_{\Vert }$
in a symplectic
 $\unicode[STIX]{x1D6FF}A_{\Vert }^{\text{s}}$
and a Hamiltonian part
$\unicode[STIX]{x1D6FF}A_{\Vert }^{\text{s}}$
and a Hamiltonian part
 $\unicode[STIX]{x1D6FF}A_{\Vert }^{\text{h}}$
. The equations of motions would become a superposition of the symplectic and Hamiltonian ones. During the integration over a time step we would keep
$\unicode[STIX]{x1D6FF}A_{\Vert }^{\text{h}}$
. The equations of motions would become a superposition of the symplectic and Hamiltonian ones. During the integration over a time step we would keep
 $\unicode[STIX]{x1D6FF}A_{\Vert }^{\text{s}}$
constant and only evolve
$\unicode[STIX]{x1D6FF}A_{\Vert }^{\text{s}}$
constant and only evolve
 $\unicode[STIX]{x1D6FF}A_{\Vert }^{\text{h}}$
. After every time step we could transform the markers back to the symplectic formulation. This would limit the evolution of
$\unicode[STIX]{x1D6FF}A_{\Vert }^{\text{h}}$
. After every time step we could transform the markers back to the symplectic formulation. This would limit the evolution of
 $\unicode[STIX]{x1D6FF}A_{\Vert }^{\text{h}}$
just to a time step and thus keep it and the spurious adiabatic part small. The potential equations would be still solved in the symplectic formulation but with the benefit of having a less pronounced pull-back transformation of the weights.
$\unicode[STIX]{x1D6FF}A_{\Vert }^{\text{h}}$
just to a time step and thus keep it and the spurious adiabatic part small. The potential equations would be still solved in the symplectic formulation but with the benefit of having a less pronounced pull-back transformation of the weights.
Such a scheme would be a reduced case of the scheme being proposed by Mishchenko et al. (Reference Mishchenko, Cole, Kleiber and Könies2014a
,Reference Mishchenko, Könies, Kleiber and Cole
b
) and generalised for the nonlinear case by Kleiber et al. (Reference Kleiber, Hatzky, Könies, Mishchenko and Sonnendrücker2016). Their efforts go even further by introducing the idealised Ohm’s law as a third potential equation to evolve
 $\unicode[STIX]{x1D6FF}A_{\Vert }^{\text{s}}$
during the time step. This allows them – in addition to a further reduction of the adiabatic part – to enlarge the time-step size significantly. Therefore, our solving of the potential equations in the symplectic formulation is a natural extension to their scheme. In future work, we plan to perform a benchmark between such an enhanced scheme and the hybrid scheme proposed here.
$\unicode[STIX]{x1D6FF}A_{\Vert }^{\text{s}}$
during the time step. This allows them – in addition to a further reduction of the adiabatic part – to enlarge the time-step size significantly. Therefore, our solving of the potential equations in the symplectic formulation is a natural extension to their scheme. In future work, we plan to perform a benchmark between such an enhanced scheme and the hybrid scheme proposed here.
Acknowledgements
This work has been carried out within the framework of the EUROfusion Consortium and has received funding from the Euratom research and training programme 2014–2018 and 2019–2020 under grant agreement No 633053. The views and opinions expressed herein do not necessarily reflect those of the European Commission. We thank G. Hammett, O. Maj, B. F. McMillan, S. Possanner, A. Ratnani, M. Restelli and N. Tronko for helpful discussions and T. Fehér and W. Nagel for carefully reading the manuscript. In addition, we thank B. Dingfelder for giving assistance with the Mathematica (Wolfram Research, Inc. 2015) computer algebra system. We would like to commemorate our dear colleague Trach-Minh Tran who passed away. He worked for many years on gyrokinetic PIC codes at Centre de Recherches en Physique des Plasmas (CRPP).
Appendix A. The control variates method for variance reduction
Variance reduction methods have in common that some additional knowledge about the problem at hand is used to reduce the variance. It is possible to use the control variates method to reduce the variance and therefore the statistical error
 $\unicode[STIX]{x1D700}_{\text{E}}$
of our Monte Carlo method in some cases dramatically.
$\unicode[STIX]{x1D700}_{\text{E}}$
of our Monte Carlo method in some cases dramatically.
The basic idea is to utilise (strong) correlation (or anticorrelation) between the observed random variable
 $X$
and some auxiliary variable
$X$
and some auxiliary variable
 $Y$
, the so-called ‘control variable’ whose expected value
$Y$
, the so-called ‘control variable’ whose expected value
 $\text{E}[Y]=\unicode[STIX]{x1D708}$
has to be known analytically. The task is to estimate the expected value
$\text{E}[Y]=\unicode[STIX]{x1D708}$
has to be known analytically. The task is to estimate the expected value
 $\text{E}[X]=\unicode[STIX]{x1D701}$
with a preferably smaller standard deviation than
$\text{E}[X]=\unicode[STIX]{x1D701}$
with a preferably smaller standard deviation than
 $\sqrt{\text{Var}_{g}[X]}$
. Hence, we define the random variable
$\sqrt{\text{Var}_{g}[X]}$
. Hence, we define the random variable
 $\hat{Z}$
which has the same expected value as
$\hat{Z}$
which has the same expected value as
 $\text{E}[X]$
by
$\text{E}[X]$
by
 $$\begin{eqnarray}\hat{Z}\stackrel{\text{def}}{=}X-\tilde{\unicode[STIX]{x1D6FC}}(Y-\unicode[STIX]{x1D708})=\tilde{Z}+\tilde{\unicode[STIX]{x1D6FC}}\unicode[STIX]{x1D708}\quad \text{where }\tilde{Z}\stackrel{\text{def}}{=}X-\tilde{\unicode[STIX]{x1D6FC}}Y,\end{eqnarray}$$
with (compare with Aydemir (Reference Aydemir1994))
 $$\begin{eqnarray}\text{E}[\hat{Z}]=\text{E}[\tilde{Z}]+\tilde{\unicode[STIX]{x1D6FC}}\unicode[STIX]{x1D708}=\text{E}[X]-\tilde{\unicode[STIX]{x1D6FC}}(\text{E}[Y]-\unicode[STIX]{x1D708})=\text{E}[X].\end{eqnarray}$$
Only the variable
 $\tilde{Z}$
will be discretised by our control variate scheme as the expected value
$\tilde{Z}$
will be discretised by our control variate scheme as the expected value
 $\unicode[STIX]{x1D708}$
is known analytically and can be added accordingly. The variance of
$\unicode[STIX]{x1D708}$
is known analytically and can be added accordingly. The variance of
 $\hat{Z}$
, i.e. of
$\hat{Z}$
, i.e. of
 $\tilde{Z}$
, differs from the variance of
$\tilde{Z}$
, differs from the variance of
 $X$
$X$
 $$\begin{eqnarray}\text{Var}_{g}[\hat{Z}]=\text{Var}_{g}[\tilde{Z}]=\text{Var}_{g}[X-\tilde{\unicode[STIX]{x1D6FC}}Y]=\text{Var}_{g}[X]-2\tilde{\unicode[STIX]{x1D6FC}}\text{Cov}_{g}[X,Y]+\tilde{\unicode[STIX]{x1D6FC}}^{2}\text{Var}_{g}[Y],\end{eqnarray}$$
where the covariance is defined by
 $$\begin{eqnarray}\text{Cov}_{g}[X,Y]\stackrel{\text{def}}{=}\text{E}[(X-\unicode[STIX]{x1D701})(Y-\unicode[STIX]{x1D708})].\end{eqnarray}$$
The auxiliary variable
 $Y$
is an effective control variate if the variance is diminished, i.e.
$Y$
is an effective control variate if the variance is diminished, i.e.
 $\text{Var}_{g}[\tilde{Z}]<\text{Var}_{g}[X]$
, which leads to the following condition:
$\text{Var}_{g}[\tilde{Z}]<\text{Var}_{g}[X]$
, which leads to the following condition:
 $$\begin{eqnarray}\frac{\text{Cov}_{g}[X,Y]}{\tilde{\unicode[STIX]{x1D6FC}}\text{Var}_{g}[Y]}>\frac{1}{2}.\end{eqnarray}$$
Otherwise the control variate can be counterproductive by enhancing the variance. Thus, the main purpose of the optimisation parameter
 $\tilde{\unicode[STIX]{x1D6FC}}$
is usually to quench the control variate if the correlation between
$\tilde{\unicode[STIX]{x1D6FC}}$
is usually to quench the control variate if the correlation between
 $X$
and
$X$
and
 $Y$
is weak (Kleiber et al.
Reference Kleiber, Hatzky, Könies, Kauffmann and Helander2011). In such a case, the full contribution of the control variate would cause an increase of the variance. On the contrary, if the control variate is already highly effective it is convenient to set
$Y$
is weak (Kleiber et al.
Reference Kleiber, Hatzky, Könies, Kauffmann and Helander2011). In such a case, the full contribution of the control variate would cause an increase of the variance. On the contrary, if the control variate is already highly effective it is convenient to set
 $\tilde{\unicode[STIX]{x1D6FC}}=1$
as it is only a scaling factor and it is unlikely to cause any further significant improvement.
$\tilde{\unicode[STIX]{x1D6FC}}=1$
as it is only a scaling factor and it is unlikely to cause any further significant improvement.
A.1 Caveats of the control variates method
Let us consider a physical model with certain conservation laws like particle number and energy conservation. In addition, we want to restrict the model to the collisionless case and we further exclude sinks and sources. Then
 $f(\boldsymbol{z}_{p}(t_{0}))$
and
$f(\boldsymbol{z}_{p}(t_{0}))$
and
 $g(\boldsymbol{z}_{p}(t_{0}))$
are kept constant along the characteristics (Hatzky et al.
Reference Hatzky, Tran, Könies, Kleiber and Allfrey2002), i.e. the trajectories of the markers. Hence, also the weights
$g(\boldsymbol{z}_{p}(t_{0}))$
are kept constant along the characteristics (Hatzky et al.
Reference Hatzky, Tran, Könies, Kleiber and Allfrey2002), i.e. the trajectories of the markers. Hence, also the weights
 $w_{p}$
are constant (full-
$w_{p}$
are constant (full-
 $f$
method) which is a reflection of the particle number conservation of the physical model in our numerical simulation. If further finite elements,
$f$
method) which is a reflection of the particle number conservation of the physical model in our numerical simulation. If further finite elements,
 $\unicode[STIX]{x1D6EC}(\boldsymbol{x})$
, are used to discretise the potential equations (see § 7) also energy conservation can be maintained (Lewis Reference Lewis1970).
$\unicode[STIX]{x1D6EC}(\boldsymbol{x})$
, are used to discretise the potential equations (see § 7) also energy conservation can be maintained (Lewis Reference Lewis1970).
Unfortunately, the situation changes when a control variate is introduced. In particular when the control variate
 $f_{0}(\boldsymbol{z})$
is used in the refinement of the estimator of the expected value defined by (2.5):
$f_{0}(\boldsymbol{z})$
is used in the refinement of the estimator of the expected value defined by (2.5):
 $$\begin{eqnarray}I(\tilde{\unicode[STIX]{x1D6EC}})=\frac{1}{N_{\text{p}}}\mathop{\sum }_{p=1}^{N_{\text{p}}}\tilde{\unicode[STIX]{x1D6EC}}(\boldsymbol{z}_{p})\,\unicode[STIX]{x1D6FF}w_{p}\,\pm \,\unicode[STIX]{x1D6FF}\unicode[STIX]{x1D700}_{\text{E}}+\tilde{\unicode[STIX]{x1D6FC}}\int _{\unicode[STIX]{x1D6FA}}\tilde{\unicode[STIX]{x1D6EC}}(\boldsymbol{z})f_{0}(\boldsymbol{z})\,{\mathcal{J}}_{z}\,\text{d}^{6}z,\end{eqnarray}$$
where
 $$\begin{eqnarray}\unicode[STIX]{x1D6FF}w_{p}\stackrel{\text{def}}{=}w_{p}-\tilde{\unicode[STIX]{x1D6FC}}w_{0p}\quad \text{and}\quad w_{0p}\stackrel{\text{def}}{=}\frac{f_{0}(\boldsymbol{z}_{p}(t))}{g(\boldsymbol{z}_{p}(t_{0}))}.\end{eqnarray}$$
The reduced weights
 $\unicode[STIX]{x1D6FF}w_{p}$
depend now implicitly on time. This results from the control variate which is sampled along the trajectories of the markers
$\unicode[STIX]{x1D6FF}w_{p}$
depend now implicitly on time. This results from the control variate which is sampled along the trajectories of the markers
 $\boldsymbol{z}_{p}(t)$
. Hence, it is not obvious (as for the full-
$\boldsymbol{z}_{p}(t)$
. Hence, it is not obvious (as for the full-
 $f$
method with its constant weights) that the sum of the reduced weights should keep constant. Indeed, the strict conservation of particle number and energy conservation is lost. This is definitely a disadvantage compared to the conservation properties of the full-
$f$
method with its constant weights) that the sum of the reduced weights should keep constant. Indeed, the strict conservation of particle number and energy conservation is lost. This is definitely a disadvantage compared to the conservation properties of the full-
 $f$
method. Nevertheless, in practice we can only approximate an expected value by its unbiased estimator (see (2.5) and (A 6)) which in the limit of an infinite marker number
$f$
method. Nevertheless, in practice we can only approximate an expected value by its unbiased estimator (see (2.5) and (A 6)) which in the limit of an infinite marker number
 $N_{\text{p}}$
converges to the expected value. Thus, the exact conservation laws of the physical model as e.g. particle number and energy conservation are only conserved in the limit
$N_{\text{p}}$
converges to the expected value. Thus, the exact conservation laws of the physical model as e.g. particle number and energy conservation are only conserved in the limit
 $N_{\text{p}}\rightarrow \infty$
as soon as a control variate is involved. However, an exact conservation would be still an advantage.
$N_{\text{p}}\rightarrow \infty$
as soon as a control variate is involved. However, an exact conservation would be still an advantage.
Appendix B. Gradient of the potential on the gyro-ring
In the following, we will investigate how to evaluate the gradient of a gyro-averaged potential, e.g.
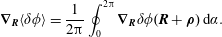 $$\begin{eqnarray}\unicode[STIX]{x1D735}_{\boldsymbol{R}}\langle \unicode[STIX]{x1D6FF}\unicode[STIX]{x1D719}\rangle =\frac{1}{2\unicode[STIX]{x03C0}}\mathop{\oint }_{0}^{2\unicode[STIX]{x03C0}}\unicode[STIX]{x1D735}_{\boldsymbol{R}}\unicode[STIX]{x1D6FF}\unicode[STIX]{x1D719}(\boldsymbol{R}+\unicode[STIX]{x1D746})\,\text{d}\unicode[STIX]{x1D6FC}.\end{eqnarray}$$
For the orientation of the cylindrical coordinate system
 $(R,\unicode[STIX]{x1D711},Z)$
in a tokamak see appendix C. It is assumed that the gyro-ring lies within the poloidal plane:
$(R,\unicode[STIX]{x1D711},Z)$
in a tokamak see appendix C. It is assumed that the gyro-ring lies within the poloidal plane:
 $$\begin{eqnarray}\unicode[STIX]{x1D746}=\unicode[STIX]{x1D70C}[\cos (\unicode[STIX]{x1D6FC})\boldsymbol{e}_{R}+\sin (\unicode[STIX]{x1D6FC})\boldsymbol{e}_{Z}].\end{eqnarray}$$
We introduce the coordinates
 $\bar{R},\bar{\unicode[STIX]{x1D711}}$
and
$\bar{R},\bar{\unicode[STIX]{x1D711}}$
and
 $\bar{Z}$
on the gyro-ring:
$\bar{Z}$
on the gyro-ring:
 $$\begin{eqnarray}\displaystyle & \displaystyle \bar{R}=|R+\unicode[STIX]{x1D70C}(R,\unicode[STIX]{x1D711},Z)\cos (\unicode[STIX]{x1D6FC})|, & \displaystyle\end{eqnarray}$$
 $$\begin{eqnarray}\displaystyle & \displaystyle \bar{\unicode[STIX]{x1D711}}=\left\{\begin{array}{@{}rl@{}}\unicode[STIX]{x1D711}+\unicode[STIX]{x03C0}\,:\, & R+\unicode[STIX]{x1D70C}\cos (\unicode[STIX]{x1D6FC})<0\\ \unicode[STIX]{x1D711}\,:\, & R+\unicode[STIX]{x1D70C}\cos (\unicode[STIX]{x1D6FC})\geqslant 0,\end{array}\right. & \displaystyle\end{eqnarray}$$
 $$\begin{eqnarray}\displaystyle & \displaystyle \bar{Z}=Z+\unicode[STIX]{x1D70C}(R,\unicode[STIX]{x1D711},Z)\sin (\unicode[STIX]{x1D6FC}), & \displaystyle\end{eqnarray}$$
so that we can write:
 $$\begin{eqnarray}\unicode[STIX]{x1D6FF}\unicode[STIX]{x1D719}(\boldsymbol{R}+\unicode[STIX]{x1D746})=\unicode[STIX]{x1D6FF}\unicode[STIX]{x1D719}(\bar{\boldsymbol{R}}).\end{eqnarray}$$
For the gradient of
 $\unicode[STIX]{x1D6FF}\unicode[STIX]{x1D719}(\boldsymbol{R}+\unicode[STIX]{x1D746})$
it follows using the chain rule of differentiation:
$\unicode[STIX]{x1D6FF}\unicode[STIX]{x1D719}(\boldsymbol{R}+\unicode[STIX]{x1D746})$
it follows using the chain rule of differentiation:
 $$\begin{eqnarray}\displaystyle \unicode[STIX]{x1D735}_{\boldsymbol{R}}\unicode[STIX]{x1D6FF}\unicode[STIX]{x1D719}(\boldsymbol{R}+\unicode[STIX]{x1D746}) & = & \displaystyle \unicode[STIX]{x1D735}_{\boldsymbol{R}}\unicode[STIX]{x1D6FF}\unicode[STIX]{x1D719}(\bar{R},\bar{\unicode[STIX]{x1D711}},\bar{Z})\nonumber\\ \displaystyle & = & \displaystyle \boldsymbol{e}_{R}\,\left[\frac{\unicode[STIX]{x2202}\unicode[STIX]{x1D6FF}\unicode[STIX]{x1D719}}{\unicode[STIX]{x2202}\bar{R}}\frac{\unicode[STIX]{x2202}\bar{R}}{\unicode[STIX]{x2202}R}+\frac{\unicode[STIX]{x2202}\unicode[STIX]{x1D6FF}\unicode[STIX]{x1D719}}{\unicode[STIX]{x2202}\bar{\unicode[STIX]{x1D711}}}\frac{\unicode[STIX]{x2202}\bar{\unicode[STIX]{x1D711}}}{\unicode[STIX]{x2202}R}+\frac{\unicode[STIX]{x2202}\unicode[STIX]{x1D6FF}\unicode[STIX]{x1D719}}{\unicode[STIX]{x2202}\bar{Z}}\frac{\unicode[STIX]{x2202}\bar{Z}}{\unicode[STIX]{x2202}R}\right]\nonumber\\ \displaystyle & & \displaystyle +\,\frac{\boldsymbol{e}_{\unicode[STIX]{x1D711}}}{R}\left[\frac{\unicode[STIX]{x2202}\unicode[STIX]{x1D6FF}\unicode[STIX]{x1D719}}{\unicode[STIX]{x2202}\bar{R}}\frac{\unicode[STIX]{x2202}\bar{R}}{\unicode[STIX]{x2202}\unicode[STIX]{x1D711}}+\frac{\unicode[STIX]{x2202}\unicode[STIX]{x1D6FF}\unicode[STIX]{x1D719}}{\unicode[STIX]{x2202}\bar{\unicode[STIX]{x1D711}}}\frac{\unicode[STIX]{x2202}\bar{\unicode[STIX]{x1D711}}}{\unicode[STIX]{x2202}\unicode[STIX]{x1D711}}+\frac{\unicode[STIX]{x2202}\unicode[STIX]{x1D6FF}\unicode[STIX]{x1D719}}{\unicode[STIX]{x2202}\bar{Z}}\frac{\unicode[STIX]{x2202}\bar{Z}}{\unicode[STIX]{x2202}\unicode[STIX]{x1D711}}\right]\nonumber\\ \displaystyle & & \displaystyle +\,\boldsymbol{e}_{Z}\,\left[\frac{\unicode[STIX]{x2202}\unicode[STIX]{x1D6FF}\unicode[STIX]{x1D719}}{\unicode[STIX]{x2202}\bar{R}}\frac{\unicode[STIX]{x2202}\bar{R}}{\unicode[STIX]{x2202}Z}+\frac{\unicode[STIX]{x2202}\unicode[STIX]{x1D6FF}\unicode[STIX]{x1D719}}{\unicode[STIX]{x2202}\bar{\unicode[STIX]{x1D711}}}\frac{\unicode[STIX]{x2202}\bar{\unicode[STIX]{x1D711}}}{\unicode[STIX]{x2202}Z}+\frac{\unicode[STIX]{x2202}\unicode[STIX]{x1D6FF}\unicode[STIX]{x1D719}}{\unicode[STIX]{x2202}\bar{Z}}\frac{\unicode[STIX]{x2202}\bar{Z}}{\unicode[STIX]{x2202}Z}\right]\nonumber\\ \displaystyle & = & \displaystyle \boldsymbol{e}_{R}\left[\frac{\unicode[STIX]{x2202}\unicode[STIX]{x1D6FF}\unicode[STIX]{x1D719}}{\unicode[STIX]{x2202}\bar{R}}-\frac{\unicode[STIX]{x1D70C}}{2B}\frac{\unicode[STIX]{x2202}B}{\unicode[STIX]{x2202}R}\left(\frac{\unicode[STIX]{x2202}\unicode[STIX]{x1D6FF}\unicode[STIX]{x1D719}}{\unicode[STIX]{x2202}\bar{R}}\cos (\unicode[STIX]{x1D6FC})+\frac{\unicode[STIX]{x2202}\unicode[STIX]{x1D6FF}\unicode[STIX]{x1D719}}{\unicode[STIX]{x2202}\bar{Z}}\sin (\unicode[STIX]{x1D6FC})\right)\right]\nonumber\\ \displaystyle & & \displaystyle +\,\boldsymbol{e}_{\unicode[STIX]{x1D711}}\left[\frac{1}{R}\frac{\unicode[STIX]{x2202}\unicode[STIX]{x1D6FF}\unicode[STIX]{x1D719}}{\unicode[STIX]{x2202}\bar{\unicode[STIX]{x1D711}}}-\frac{\unicode[STIX]{x1D70C}}{2B}\frac{1}{R}\frac{\unicode[STIX]{x2202}B}{\unicode[STIX]{x2202}\unicode[STIX]{x1D711}}\left(\frac{\unicode[STIX]{x2202}\unicode[STIX]{x1D6FF}\unicode[STIX]{x1D719}}{\unicode[STIX]{x2202}\bar{R}}\cos (\unicode[STIX]{x1D6FC})+\frac{\unicode[STIX]{x2202}\unicode[STIX]{x1D6FF}\unicode[STIX]{x1D719}}{\unicode[STIX]{x2202}\bar{Z}}\sin (\unicode[STIX]{x1D6FC})\right)\right]\nonumber\\ \displaystyle & & \displaystyle +\,\boldsymbol{e}_{Z}\left[\frac{\unicode[STIX]{x2202}\unicode[STIX]{x1D6FF}\unicode[STIX]{x1D719}}{\unicode[STIX]{x2202}\bar{Z}}-\frac{\unicode[STIX]{x1D70C}}{2B}\frac{\unicode[STIX]{x2202}B}{\unicode[STIX]{x2202}Z}\left(\frac{\unicode[STIX]{x2202}\unicode[STIX]{x1D6FF}\unicode[STIX]{x1D719}}{\unicode[STIX]{x2202}\bar{R}}\cos (\unicode[STIX]{x1D6FC})+\frac{\unicode[STIX]{x2202}\unicode[STIX]{x1D6FF}\unicode[STIX]{x1D719}}{\unicode[STIX]{x2202}\bar{Z}}\sin (\unicode[STIX]{x1D6FC})\right)\right]\nonumber\\ \displaystyle & = & \displaystyle \unicode[STIX]{x1D735}_{\bar{\boldsymbol{R}}}\unicode[STIX]{x1D6FF}\unicode[STIX]{x1D719}-\frac{\unicode[STIX]{x1D70C}}{2}\left(\frac{\unicode[STIX]{x2202}\unicode[STIX]{x1D6FF}\unicode[STIX]{x1D719}}{\unicode[STIX]{x2202}\bar{R}}\cos (\unicode[STIX]{x1D6FC})+\frac{\unicode[STIX]{x2202}\unicode[STIX]{x1D6FF}\unicode[STIX]{x1D719}}{\unicode[STIX]{x2202}\bar{Z}}\sin (\unicode[STIX]{x1D6FC})\right)\frac{\unicode[STIX]{x1D735}_{\boldsymbol{R}}B}{B}.\end{eqnarray}$$
By fixing the gyro-phase angle
 $\unicode[STIX]{x1D6FC}$
any point on the gyro-ring of radius
$\unicode[STIX]{x1D6FC}$
any point on the gyro-ring of radius
 $\unicode[STIX]{x1D70C}$
can be addressed. The quantities which have to be known are the relative gradient of the magnetic field at the gyro-centre position
$\unicode[STIX]{x1D70C}$
can be addressed. The quantities which have to be known are the relative gradient of the magnetic field at the gyro-centre position
 $(R,\unicode[STIX]{x1D711},Z)$
and the gradient of
$(R,\unicode[STIX]{x1D711},Z)$
and the gradient of
 $\unicode[STIX]{x1D6FF}\unicode[STIX]{x1D719}$
at the gyro-ring position
$\unicode[STIX]{x1D6FF}\unicode[STIX]{x1D719}$
at the gyro-ring position
 $(\bar{R},\bar{\unicode[STIX]{x1D711}},\bar{Z})$
.
$(\bar{R},\bar{\unicode[STIX]{x1D711}},\bar{Z})$
.
Appendix C. Coordinate system in a tokamak
Due to its axisymmetric equilibrium it is quite natural to describe a tokamak by a cylindrical coordinate system
 $(R,\unicode[STIX]{x1D711},Z)$
(Sauter & Medvedev Reference Sauter and Medvedev2013). The plasma device is centred around the
$(R,\unicode[STIX]{x1D711},Z)$
(Sauter & Medvedev Reference Sauter and Medvedev2013). The plasma device is centred around the
 $Z$
-axis, the vertical axis of symmetry. The poloidal plane is in the
$Z$
-axis, the vertical axis of symmetry. The poloidal plane is in the
 $(R,Z)$
-plane and the angle
$(R,Z)$
-plane and the angle
 $\unicode[STIX]{x1D711}$
points in the toroidal direction (see figure 14). The poloidal flux
$\unicode[STIX]{x1D711}$
points in the toroidal direction (see figure 14). The poloidal flux
 $\unicode[STIX]{x1D6F9}(R,Z)$
is the magnetic flux that goes through the disc
$\unicode[STIX]{x1D6F9}(R,Z)$
is the magnetic flux that goes through the disc
 $\{(R,\unicode[STIX]{x1D711},Z),\unicode[STIX]{x1D711}\in [0,2\unicode[STIX]{x03C0}]\}$
perpendicular to the
$\{(R,\unicode[STIX]{x1D711},Z),\unicode[STIX]{x1D711}\in [0,2\unicode[STIX]{x03C0}]\}$
perpendicular to the
 $Z$
-axis. It is chosen to give
$Z$
-axis. It is chosen to give
 $\unicode[STIX]{x1D6F9}(R_{0},0)=0$
on the magnetic axis. We define a magnetic coordinate system
$\unicode[STIX]{x1D6F9}(R_{0},0)=0$
on the magnetic axis. We define a magnetic coordinate system
 $(s,\unicode[STIX]{x1D711},\unicode[STIX]{x1D717})$
, such that
$(s,\unicode[STIX]{x1D711},\unicode[STIX]{x1D717})$
, such that
 $s$
acts as a radial variable and
$s$
acts as a radial variable and
 $\unicode[STIX]{x1D717}$
is a poloidal angle
$\unicode[STIX]{x1D717}$
is a poloidal angle
 $$\begin{eqnarray}s\stackrel{\text{def}}{=}\sqrt{\frac{\unicode[STIX]{x1D6F9}}{\unicode[STIX]{x1D6F9}_{\text{a}}}}\quad \text{and}\quad \unicode[STIX]{x1D717}\stackrel{\text{def}}{=}\arctan \left(\frac{Z}{R-R_{0}}\right),\end{eqnarray}$$
where
 $\unicode[STIX]{x1D6F9}_{\text{a}}$
is the value of
$\unicode[STIX]{x1D6F9}_{\text{a}}$
is the value of
 $\unicode[STIX]{x1D6F9}$
at the plasma edge, i.e.
$\unicode[STIX]{x1D6F9}$
at the plasma edge, i.e.
 $s=1$
. The contour lines for constant
$s=1$
. The contour lines for constant
 $s$
define the magnetic surfaces. For circular magnetic surfaces the coordinates
$s$
define the magnetic surfaces. For circular magnetic surfaces the coordinates
 $(s,\unicode[STIX]{x1D717})$
form a polar coordinate system and we have
$(s,\unicode[STIX]{x1D717})$
form a polar coordinate system and we have
 $$\begin{eqnarray}r=as,\end{eqnarray}$$
where
 $r$
is the radial coordinate and
$r$
is the radial coordinate and
 $a$
the minor radius.
$a$
the minor radius.
Poloidal view of a circular tokamak. A cylindrical coordinate system
 $(R,\unicode[STIX]{x1D711},Z)$
and a magnetic coordinate system
$(R,\unicode[STIX]{x1D711},Z)$
and a magnetic coordinate system
 $(s,\unicode[STIX]{x1D711},\unicode[STIX]{x1D717})$
are depicted. In case of the screw pinch, we have
$(s,\unicode[STIX]{x1D711},\unicode[STIX]{x1D717})$
are depicted. In case of the screw pinch, we have
 $R_{0}=0$
.
$R_{0}=0$
.
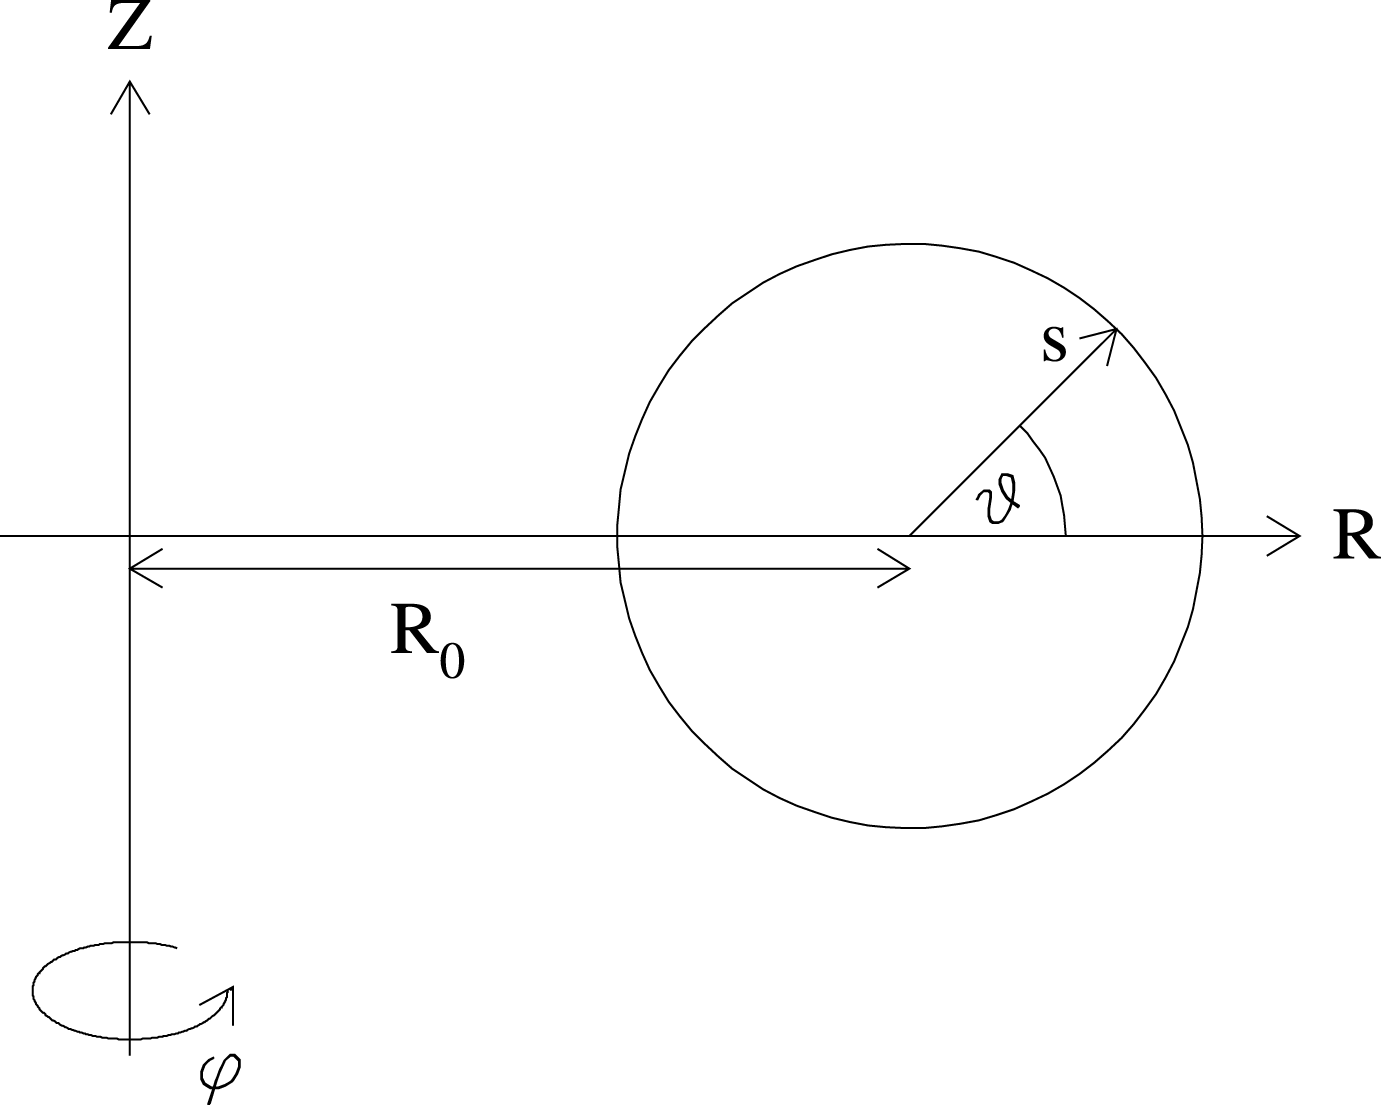
Appendix D. Some useful integrals
In this section, we define correction factors which reflect the effect of a finite velocity sphere on some integrals of the unshifted Maxwellian (3.10) where
 $\hat{u} _{0}=0$
. In the case of
$\hat{u} _{0}=0$
. In the case of
 $\tilde{p}_{\Vert }$
-coordinates, the finite velocity sphere is shifted compared to the
$\tilde{p}_{\Vert }$
-coordinates, the finite velocity sphere is shifted compared to the
 $v_{\Vert }$
-velocity sphere. Hence, we have defined the parameter
$v_{\Vert }$
-velocity sphere. Hence, we have defined the parameter
 $\unicode[STIX]{x1D6FE}$
, equation (4.29), to quantify the shift of the
$\unicode[STIX]{x1D6FE}$
, equation (4.29), to quantify the shift of the
 $\tilde{p}_{\Vert }$
-velocity sphere. In the limit of
$\tilde{p}_{\Vert }$
-velocity sphere. In the limit of
 $\unicode[STIX]{x1D6FE}\rightarrow 0$
, we approach the case of
$\unicode[STIX]{x1D6FE}\rightarrow 0$
, we approach the case of
 $v_{\Vert }$
-coordinates and in the limit of
$v_{\Vert }$
-coordinates and in the limit of
 $\unicode[STIX]{x1D705}_{\text{v}}\rightarrow \infty$
the case of an infinite velocity sphere. The limits of the integrals are defined by (4.26)–(4.28). As it is difficult to solve the following integrals by hand, we used the Mathematica (Wolfram Research, Inc. 2015) computer algebra system instead:
$\unicode[STIX]{x1D705}_{\text{v}}\rightarrow \infty$
the case of an infinite velocity sphere. The limits of the integrals are defined by (4.26)–(4.28). As it is difficult to solve the following integrals by hand, we used the Mathematica (Wolfram Research, Inc. 2015) computer algebra system instead:
 $$\begin{eqnarray}\displaystyle \tilde{C}_{\text{v}1}(\unicode[STIX]{x1D705}_{\text{v}},\unicode[STIX]{x1D6FE}) & \stackrel{\text{def}}{=} & \displaystyle \frac{1}{\hat{n}_{0}}\int _{0}^{2\unicode[STIX]{x03C0}}\int _{0}^{v_{\bot \text{max}}}\int _{\tilde{p}_{\Vert \text{min}}}^{\tilde{p}_{\Vert \text{max}}}\left(f_{\text{M}}+\tilde{p}_{\Vert }\left.\frac{\unicode[STIX]{x2202}f_{\text{M}}}{\unicode[STIX]{x2202}v_{\Vert }}\right|_{v_{\Vert }=\tilde{p}_{\Vert }}\right)\,\text{d}\tilde{p}_{\Vert }\,v_{\bot }\text{d}v_{\bot }\,\text{d}\unicode[STIX]{x1D6FC}\nonumber\\ \displaystyle & = & \displaystyle \tilde{C}_{\text{v}2}-\tilde{C}_{\text{v}3}\end{eqnarray}$$
 $$\begin{eqnarray}\displaystyle & = & \displaystyle \frac{1}{\hat{n}_{0}}\int _{0}^{2\unicode[STIX]{x03C0}}\int _{0}^{v_{\bot \text{max}}}\Bigl[\tilde{p}_{\Vert }\,f_{\text{M}}\Bigr]_{\tilde{p}_{\Vert \text{min}}}^{\tilde{p}_{\Vert \text{max}}}\,v_{\bot }\,\text{d}v_{\bot }\,\text{d}\unicode[STIX]{x1D6FC}\nonumber\\ \displaystyle & = & \displaystyle -\frac{1}{\sqrt{2\unicode[STIX]{x03C0}}}\frac{1}{\unicode[STIX]{x1D6FE}^{3}}\exp \left[-\frac{(\unicode[STIX]{x1D705}_{\text{v}}+\unicode[STIX]{x1D6FE})^{2}}{2}\right]\big\{[2+(1+\unicode[STIX]{x1D705}_{\text{v}}^{2})\unicode[STIX]{x1D6FE}^{2}][1-\exp (2\unicode[STIX]{x1D705}_{\text{v}}\unicode[STIX]{x1D6FE})]\nonumber\\ \displaystyle & & \displaystyle +\,[2\unicode[STIX]{x1D705}_{\text{v}}\unicode[STIX]{x1D6FE}+\unicode[STIX]{x1D705}_{\text{v}}\unicode[STIX]{x1D6FE}^{3}][1+\exp (2\unicode[STIX]{x1D705}_{\text{v}}\unicode[STIX]{x1D6FE})]\big\}\end{eqnarray}$$
 $$\begin{eqnarray}\displaystyle & = & \displaystyle \sqrt{\frac{2}{\unicode[STIX]{x03C0}}}\frac{\unicode[STIX]{x1D705}_{\text{v}}^{3}}{3}\exp \left(-\frac{\unicode[STIX]{x1D705}_{\text{v}}^{2}}{2}\right)+\text{O}(\unicode[STIX]{x1D6FE}^{2}),\end{eqnarray}$$
 $$\begin{eqnarray}\lim _{\unicode[STIX]{x1D705}_{\text{v}}\rightarrow \infty }\tilde{C}_{\text{v}1}(\unicode[STIX]{x1D705}_{\text{v}},\unicode[STIX]{x1D6FE})=0.\end{eqnarray}$$
 $$\begin{eqnarray}\displaystyle \tilde{C}_{\text{v}2}(\unicode[STIX]{x1D705}_{\text{v}},\unicode[STIX]{x1D6FE}) & \stackrel{\text{def}}{=} & \displaystyle \frac{1}{\hat{n}_{0}}\int _{0}^{2\unicode[STIX]{x03C0}}\int _{0}^{v_{\bot \text{max}}}\int _{\tilde{p}_{\Vert \text{min}}}^{\tilde{p}_{\Vert \text{max}}}f_{\text{M}}\,\text{d}\tilde{p}_{\Vert }\,v_{\bot }\,\text{d}v_{\bot }\,\text{d}\unicode[STIX]{x1D6FC}\nonumber\\ \displaystyle & = & \displaystyle \frac{1}{2}\left[\text{erf}\left(\frac{\unicode[STIX]{x1D705}_{\text{v}}+\unicode[STIX]{x1D6FE}}{\sqrt{2}}\right)-\text{erf}\left(-\frac{\unicode[STIX]{x1D705}_{\text{v}}-\unicode[STIX]{x1D6FE}}{\sqrt{2}}\right)\right]\nonumber\\ \displaystyle & & \displaystyle -\,\frac{1}{\sqrt{2\unicode[STIX]{x03C0}}}\frac{1}{\unicode[STIX]{x1D6FE}}\exp \left[-\frac{(\unicode[STIX]{x1D705}_{\text{v}}+\unicode[STIX]{x1D6FE})^{2}}{2}\right]\left[\exp \left(2\unicode[STIX]{x1D705}_{\text{v}}\unicode[STIX]{x1D6FE}\right)-1\right]\end{eqnarray}$$
 $$\begin{eqnarray}\displaystyle & = & \displaystyle \text{erf}\left(\frac{\unicode[STIX]{x1D705}_{\text{v}}}{\sqrt{2}}\right)-\sqrt{\frac{2}{\unicode[STIX]{x03C0}}}\unicode[STIX]{x1D705}_{\text{v}}\exp \left(-\frac{\unicode[STIX]{x1D705}_{\text{v}}^{2}}{2}\right)+\text{O}(\unicode[STIX]{x1D6FE}^{2}),\end{eqnarray}$$
 $$\begin{eqnarray}\lim _{\unicode[STIX]{x1D705}_{\text{v}}\rightarrow \infty }\tilde{C}_{\text{v}2}(\unicode[STIX]{x1D705}_{\text{v}},\unicode[STIX]{x1D6FE})=1.\end{eqnarray}$$
 $$\begin{eqnarray}\displaystyle \tilde{C}_{\text{v}3}(\unicode[STIX]{x1D705}_{\text{v}},\unicode[STIX]{x1D6FE}) & \stackrel{\text{def}}{=} & \displaystyle -\frac{1}{\hat{n}_{0}}\int _{0}^{2\unicode[STIX]{x03C0}}\int _{0}^{v_{\bot \text{max}}}\int _{\tilde{p}_{\Vert \text{min}}}^{\tilde{p}_{\Vert \text{max}}}\tilde{p}_{\Vert }\left.\frac{\unicode[STIX]{x2202}f_{\text{M}}}{\unicode[STIX]{x2202}v_{\Vert }}\right|_{v_{\Vert }=\tilde{p}_{\Vert }}\,\text{d}\tilde{p}_{\Vert }\,v_{\bot }\,\text{d}v_{\bot }\,\text{d}\unicode[STIX]{x1D6FC}\nonumber\\ \displaystyle & = & \displaystyle \text{erf}\left(\frac{\unicode[STIX]{x1D705}_{\text{v}}}{\sqrt{2}}\right)-\sqrt{\frac{2}{\unicode[STIX]{x03C0}}}\left(\unicode[STIX]{x1D705}_{\text{v}}+\frac{\unicode[STIX]{x1D705}_{\text{v}}^{3}}{3}\right)\exp \left(-\frac{\unicode[STIX]{x1D705}_{\text{v}}^{2}}{2}\right)+\text{O}(\unicode[STIX]{x1D6FE}^{2}),\end{eqnarray}$$
 $$\begin{eqnarray}\lim _{\unicode[STIX]{x1D705}_{\text{v}}\rightarrow \infty }\tilde{C}_{\text{v}3}(\unicode[STIX]{x1D705}_{\text{v}},\unicode[STIX]{x1D6FE})=1.\end{eqnarray}$$
 $$\begin{eqnarray}\displaystyle \tilde{C}_{\text{v}4}(\unicode[STIX]{x1D705}_{\text{v}},\unicode[STIX]{x1D6FE}) & \stackrel{\text{def}}{=} & \displaystyle \frac{1}{\hat{n}_{0}}\int _{0}^{2\unicode[STIX]{x03C0}}\int _{0}^{v_{\bot \text{max}}}\int _{\tilde{p}_{\Vert \text{min}}}^{\tilde{p}_{\Vert \text{max}}}\tilde{p}_{\Vert }\,f_{\text{M}}\,\text{d}\tilde{p}_{\Vert }\,v_{\bot }\,\text{d}v_{\bot }\,\text{d}\unicode[STIX]{x1D6FC}\nonumber\\ \displaystyle & = & \displaystyle \sqrt{\frac{2}{\unicode[STIX]{x03C0}}}\frac{v_{\text{th}}}{\unicode[STIX]{x1D6FE}^{2}}[\unicode[STIX]{x1D705}_{\text{v}}\unicode[STIX]{x1D6FE}\cosh (\unicode[STIX]{x1D705}_{\text{v}}\unicode[STIX]{x1D6FE})-\sinh (\unicode[STIX]{x1D705}_{\text{v}}\unicode[STIX]{x1D6FE})]\exp \left(-\frac{\unicode[STIX]{x1D705}_{\text{v}}^{2}+\unicode[STIX]{x1D6FE}^{2}}{2}\right)\end{eqnarray}$$
 $$\begin{eqnarray}\displaystyle & = & \displaystyle \unicode[STIX]{x1D6FE}v_{\text{th}}\sqrt{\frac{2}{\unicode[STIX]{x03C0}}}\frac{\unicode[STIX]{x1D705}_{\text{v}}^{3}}{3}\exp \left(-\frac{\unicode[STIX]{x1D705}_{\text{v}}^{2}}{2}\right)+\text{O}(\unicode[STIX]{x1D6FE}^{3}),\end{eqnarray}$$
 $$\begin{eqnarray}\displaystyle \tilde{C}_{\text{v}4}^{\text{lin}}(\unicode[STIX]{x1D705}_{\text{v}},\unicode[STIX]{x1D6FE}) & \stackrel{\text{def}}{=} & \displaystyle \frac{q}{m}\langle \unicode[STIX]{x1D6FF}A_{\Vert }\rangle \sqrt{\frac{2}{\unicode[STIX]{x03C0}}}\frac{\unicode[STIX]{x1D705}_{\text{v}}^{3}}{3}\exp \left(-\frac{\unicode[STIX]{x1D705}_{\text{v}}^{2}}{2}\right)\nonumber\\ \displaystyle & = & \displaystyle \frac{q}{m}\langle \unicode[STIX]{x1D6FF}A_{\Vert }\rangle \tilde{C}_{\text{v}1}(\unicode[STIX]{x1D705}_{\text{v}},0)=\frac{q}{m}\langle \unicode[STIX]{x1D6FF}A_{\Vert }\rangle C_{\text{v}1},\end{eqnarray}$$
 $$\begin{eqnarray}\lim _{\unicode[STIX]{x1D705}_{\text{v}}\rightarrow \infty }\tilde{C}_{\text{v}4}(\unicode[STIX]{x1D705}_{\text{v}},\unicode[STIX]{x1D6FE})=0.\end{eqnarray}$$
Appendix E. Definition of the adiabatic charge- and current-assignment vectors
In the following, we define for each species
 $s$
the adiabatic charge- and current-assignment vectors without gyro-averaging
$s$
the adiabatic charge- and current-assignment vectors without gyro-averaging
 $\unicode[STIX]{x1D739}\boldsymbol{n}_{s}^{\text{ad}}$
,
$\unicode[STIX]{x1D739}\boldsymbol{n}_{s}^{\text{ad}}$
,
 $\unicode[STIX]{x1D739}\boldsymbol{j}_{\Vert s}^{\text{ad}}$
and with gyro-averaging
$\unicode[STIX]{x1D739}\boldsymbol{j}_{\Vert s}^{\text{ad}}$
and with gyro-averaging
 $\unicode[STIX]{x1D739}\bar{\boldsymbol{n}}_{s}^{\text{ad}}$
,
$\unicode[STIX]{x1D739}\bar{\boldsymbol{n}}_{s}^{\text{ad}}$
,
 $\unicode[STIX]{x1D739}\bar{\boldsymbol{j}}_{\Vert s}^{\text{ad}}$
. Alternatively, these vectors can be calculated by using the matrices
$\unicode[STIX]{x1D739}\bar{\boldsymbol{j}}_{\Vert s}^{\text{ad}}$
. Alternatively, these vectors can be calculated by using the matrices
 $\unicode[STIX]{x1D649}_{s}^{\text{ad}}$
,
$\unicode[STIX]{x1D649}_{s}^{\text{ad}}$
,
 $\unicode[STIX]{x1D645}_{s}^{\text{ad}}$
and
$\unicode[STIX]{x1D645}_{s}^{\text{ad}}$
and
 $\bar{\unicode[STIX]{x1D649}}_{s}^{\text{ad}}$
,
$\bar{\unicode[STIX]{x1D649}}_{s}^{\text{ad}}$
,
 $\bar{\unicode[STIX]{x1D645}}_{s}^{\text{ad}}$
:
$\bar{\unicode[STIX]{x1D645}}_{s}^{\text{ad}}$
:
 $$\begin{eqnarray}\displaystyle \unicode[STIX]{x1D6FF}n_{s,k}^{\text{ad}} & \stackrel{\text{def}}{=} & \displaystyle \frac{q_{s}}{N_{\text{p}s}}\mathop{\sum }_{p=1}^{N_{\text{p}s}}\unicode[STIX]{x1D6FF}w_{s,p}^{\text{ad}}\unicode[STIX]{x1D6EC}_{k}^{d}(\boldsymbol{x}_{p})\nonumber\\ \displaystyle & = & \displaystyle \frac{q_{s}^{2}}{m_{s}}\frac{1}{N_{\text{p}s}}\mathop{\sum }_{p=1}^{N_{\text{p}s}}\mathop{\sum }_{j}d_{j}\,\frac{\tilde{p}_{\Vert p}-\hat{u} _{0s,p}}{v_{\text{th}s,p}^{2}}\frac{f_{\text{M}s,p}}{g_{p}^{\text{h}}}\unicode[STIX]{x1D6EC}_{k}^{d}(\boldsymbol{x}_{p})\,\unicode[STIX]{x1D6EC}_{j}^{d}(\boldsymbol{x}_{p})\end{eqnarray}$$
 $$\begin{eqnarray}\displaystyle & = & \displaystyle \mathop{\sum }_{j}n_{s,kj}^{\text{ad}}\,d_{j},\end{eqnarray}$$
where
 $$\begin{eqnarray}\displaystyle n_{s,kj}^{\text{ad}} & \stackrel{\text{def}}{=} & \displaystyle \frac{q_{s}^{2}}{m_{s}}\frac{1}{N_{\text{p}s}}\mathop{\sum }_{p=1}^{N_{\text{p}s}}\frac{\tilde{p}_{\Vert p}-\hat{u} _{0s,p}}{v_{\text{th}s,p}^{2}}\frac{f_{\text{M}s,p}}{g_{p}^{\text{h}}}\unicode[STIX]{x1D6EC}_{k}^{d}(\boldsymbol{x}_{p})\,\unicode[STIX]{x1D6EC}_{j}^{d}(\boldsymbol{x}_{p}).\end{eqnarray}$$
 $$\begin{eqnarray}\displaystyle \unicode[STIX]{x1D6FF}j_{\Vert s,k}^{\text{ad}} & \stackrel{\text{def}}{=} & \displaystyle \frac{\unicode[STIX]{x1D707}_{0}q_{s}}{N_{\text{p}s}}\mathop{\sum }_{p=1}^{N_{\text{p}s}}\tilde{p}_{\Vert p}\,\unicode[STIX]{x1D6FF}w_{s,p}^{\text{ad}}\unicode[STIX]{x1D6EC}_{k}^{d}(\boldsymbol{x}_{p})\nonumber\\ \displaystyle & = & \displaystyle \frac{\unicode[STIX]{x1D707}_{0}q_{s}^{2}}{m_{s}}\frac{1}{N_{\text{p}s}}\mathop{\sum }_{p=1}^{N_{\text{p}s}}\mathop{\sum }_{j}d_{j}\,\tilde{p}_{\Vert p}\frac{\tilde{p}_{\Vert p}-\hat{u} _{0s,p}}{v_{\text{th}s,p}^{2}}\frac{f_{\text{M}s,p}}{g_{p}^{\text{h}}}\unicode[STIX]{x1D6EC}_{k}^{d}(\boldsymbol{x}_{p})\,\unicode[STIX]{x1D6EC}_{j}^{d}(\boldsymbol{x}_{p})\end{eqnarray}$$
 $$\begin{eqnarray}\displaystyle & = & \displaystyle \mathop{\sum }_{j}j_{s,kj}^{\text{ad}}\,d_{j},\end{eqnarray}$$
where
 $$\begin{eqnarray}\displaystyle j_{s,kj}^{\text{ad}} & \stackrel{\text{def}}{=} & \displaystyle \frac{\unicode[STIX]{x1D707}_{0}q_{s}^{2}}{m_{s}}\frac{1}{N_{\text{p}s}}\mathop{\sum }_{p=1}^{N_{\text{p}s}}\tilde{p}_{\Vert p}\frac{\tilde{p}_{\Vert p}-\hat{u} _{0s,p}}{v_{\text{th}s,p}^{2}}\frac{f_{\text{M}s,p}}{g_{p}^{\text{h}}}\unicode[STIX]{x1D6EC}_{k}^{d}(\boldsymbol{x}_{p})\,\unicode[STIX]{x1D6EC}_{j}^{d}(\boldsymbol{x}_{p}).\end{eqnarray}$$
 $$\begin{eqnarray}\displaystyle \unicode[STIX]{x1D6FF}\bar{n}_{s,k}^{\text{ad}} & \stackrel{\text{def}}{=} & \displaystyle \frac{q_{s}}{N_{\text{p}s}}\mathop{\sum }_{p=1}^{N_{\text{p}s}}\unicode[STIX]{x1D6FF}w_{s,p}^{\text{ad}}\frac{1}{2\unicode[STIX]{x03C0}}\mathop{\oint }_{0}^{2\unicode[STIX]{x03C0}}\unicode[STIX]{x1D6EC}_{k}^{d}(\boldsymbol{R}_{p}+\unicode[STIX]{x1D746}_{s,p})\,\text{d}\unicode[STIX]{x1D6FC}\nonumber\\ \displaystyle & = & \displaystyle \frac{q_{s}^{2}}{m_{s}}\frac{1}{N_{\text{p}s}}\mathop{\sum }_{p=1}^{N_{\text{p}s}}\mathop{\sum }_{j}d_{j}\,\frac{\tilde{p}_{\Vert p}-\hat{u} _{0s,p}}{v_{\text{th}s,p}^{2}}\frac{f_{\text{M}s,p}}{g_{p}^{\text{h}}}\nonumber\\ \displaystyle & & \displaystyle \times \,\frac{1}{2\unicode[STIX]{x03C0}}\mathop{\oint }_{0}^{2\unicode[STIX]{x03C0}}\unicode[STIX]{x1D6EC}_{k}^{d}(\boldsymbol{R}_{p}+\unicode[STIX]{x1D746}_{s,p})\,\text{d}\unicode[STIX]{x1D6FC}\,\frac{1}{2\unicode[STIX]{x03C0}}\mathop{\oint }_{0}^{2\unicode[STIX]{x03C0}}\unicode[STIX]{x1D6EC}_{j}^{d}(\boldsymbol{R}_{p}+\unicode[STIX]{x1D746}_{s,p})\,\text{d}\hat{\unicode[STIX]{x1D6FC}}\end{eqnarray}$$
 $$\begin{eqnarray}\displaystyle & = & \displaystyle \mathop{\sum }_{j}\bar{n}_{s,kj}^{\text{ad}}\,d_{j},\end{eqnarray}$$
where
 $$\begin{eqnarray}\displaystyle \bar{n}_{s,kj}^{\text{ad}} & \stackrel{\text{def}}{=} & \displaystyle \frac{q_{s}^{2}}{m_{s}}\frac{1}{N_{\text{p}s}}\mathop{\sum }_{p=1}^{N_{\text{p}s}}\frac{\tilde{p}_{\Vert p}-\hat{u} _{0s,p}}{v_{\text{th}s,p}^{2}}\frac{f_{\text{M}s,p}}{g_{p}^{\text{h}}}\nonumber\\ \displaystyle & & \displaystyle \times \,\frac{1}{2\unicode[STIX]{x03C0}}\mathop{\oint }_{0}^{2\unicode[STIX]{x03C0}}\unicode[STIX]{x1D6EC}_{k}^{d}(\boldsymbol{R}_{p}+\unicode[STIX]{x1D746}_{s,p})\,\text{d}\unicode[STIX]{x1D6FC}\,\frac{1}{2\unicode[STIX]{x03C0}}\mathop{\oint }_{0}^{2\unicode[STIX]{x03C0}}\unicode[STIX]{x1D6EC}_{j}^{d}(\boldsymbol{R}_{p}+\unicode[STIX]{x1D746}_{s,p})\,\text{d}\hat{\unicode[STIX]{x1D6FC}}.\end{eqnarray}$$
 $$\begin{eqnarray}\displaystyle \unicode[STIX]{x1D6FF}\bar{j}_{\Vert s,k}^{\text{ad}} & \stackrel{\text{def}}{=} & \displaystyle \frac{\unicode[STIX]{x1D707}_{0}q_{s}}{N_{\text{p}s}}\mathop{\sum }_{p=1}^{N_{\text{p}s}}\tilde{p}_{\Vert p}\,\unicode[STIX]{x1D6FF}w_{s,p}^{\text{ad}}\frac{1}{2\unicode[STIX]{x03C0}}\mathop{\oint }_{0}^{2\unicode[STIX]{x03C0}}\,\unicode[STIX]{x1D6EC}_{k}^{d}(\boldsymbol{R}_{p}+\unicode[STIX]{x1D746}_{s,p})\,\text{d}\unicode[STIX]{x1D6FC}\nonumber\\ \displaystyle & = & \displaystyle \frac{\unicode[STIX]{x1D707}_{0}q_{s}^{2}}{m_{s}}\frac{1}{N_{\text{p}s}}\mathop{\sum }_{p=1}^{N_{\text{p}s}}\mathop{\sum }_{j}d_{j}\,\tilde{p}_{\Vert p}\frac{\tilde{p}_{\Vert p}-\hat{u} _{0s,p}}{v_{\text{th}s,p}^{2}}\frac{f_{\text{M}s,p}}{g_{p}^{\text{h}}}\nonumber\\ \displaystyle & & \displaystyle \times \,\frac{1}{2\unicode[STIX]{x03C0}}\mathop{\oint }_{0}^{2\unicode[STIX]{x03C0}}\unicode[STIX]{x1D6EC}_{k}^{d}(\boldsymbol{R}_{p}+\unicode[STIX]{x1D746}_{s,p})\,\text{d}\unicode[STIX]{x1D6FC}\,\frac{1}{2\unicode[STIX]{x03C0}}\mathop{\oint }_{0}^{2\unicode[STIX]{x03C0}}\unicode[STIX]{x1D6EC}_{j}^{d}(\boldsymbol{R}_{p}+\unicode[STIX]{x1D746}_{s,p})\,\text{d}\hat{\unicode[STIX]{x1D6FC}}\end{eqnarray}$$
 $$\begin{eqnarray}\displaystyle & = & \displaystyle \mathop{\sum }_{j}\bar{j}_{s,kj}^{\text{ad}}\,d_{j},\end{eqnarray}$$
where
 $$\begin{eqnarray}\displaystyle \bar{j}_{s,kj}^{\text{ad}} & \stackrel{\text{def}}{=} & \displaystyle \frac{\unicode[STIX]{x1D707}_{0}q_{s}^{2}}{m_{s}}\frac{1}{N_{\text{p}s}}\mathop{\sum }_{p=1}^{N_{\text{p}s}}\tilde{p}_{\Vert p}\frac{\tilde{p}_{\Vert p}-\hat{u} _{0s,p}}{v_{\text{th}s,p}^{2}}\frac{f_{\text{M}s,p}}{g_{p}^{\text{h}}}\nonumber\\ \displaystyle & & \displaystyle \times \,\frac{1}{2\unicode[STIX]{x03C0}}\mathop{\oint }_{0}^{2\unicode[STIX]{x03C0}}\unicode[STIX]{x1D6EC}_{k}^{d}(\boldsymbol{R}_{p}+\unicode[STIX]{x1D746}_{s,p})\,\text{d}\unicode[STIX]{x1D6FC}\,\frac{1}{2\unicode[STIX]{x03C0}}\mathop{\oint }_{0}^{2\unicode[STIX]{x03C0}}\unicode[STIX]{x1D6EC}_{j}^{d}(\boldsymbol{R}_{p}+\unicode[STIX]{x1D746}_{s,p})\,\text{d}\hat{\unicode[STIX]{x1D6FC}}.\end{eqnarray}$$
Appendix F. An iterative method for solving Ampère’s law
F.1 The linear case
In the following, we will present an iterative scheme to solve Ampère’s law (8.8). We start by solving the matrix equation for the solution vector
 $\boldsymbol{d}$
and introducing an arbitrary matrix
$\boldsymbol{d}$
and introducing an arbitrary matrix
 $\unicode[STIX]{x1D64B}$
:
$\unicode[STIX]{x1D64B}$
:
 $$\begin{eqnarray}\displaystyle \boldsymbol{d} & = & \displaystyle (\unicode[STIX]{x1D647}+\unicode[STIX]{x1D645}^{\text{ad}}-C_{\text{v}2\text{e}}\unicode[STIX]{x1D650}_{\text{e}})^{-1}\tilde{\boldsymbol{b}}=[\unicode[STIX]{x1D647}+\unicode[STIX]{x1D64B}-C_{\text{v}2\text{e}}\unicode[STIX]{x1D650}_{\text{e}}-(\unicode[STIX]{x1D64B}-\unicode[STIX]{x1D645}^{\text{ad}})]^{-1}\tilde{\boldsymbol{b}}\nonumber\\ \displaystyle & = & \displaystyle \big\{[\unicode[STIX]{x1D644}-(\unicode[STIX]{x1D64B}-\unicode[STIX]{x1D645}^{\text{ad}})(\unicode[STIX]{x1D647}+\unicode[STIX]{x1D64B}-C_{\text{v}2\text{e}}\unicode[STIX]{x1D650}_{\text{e}})^{-1}](\unicode[STIX]{x1D647}+\unicode[STIX]{x1D64B}-C_{\text{v}2\text{e}}\unicode[STIX]{x1D650}_{\text{e}})\big\}^{-1}\tilde{\boldsymbol{b}}\nonumber\\ \displaystyle & = & \displaystyle [(\unicode[STIX]{x1D644}-\unicode[STIX]{x1D649})(\unicode[STIX]{x1D647}+\unicode[STIX]{x1D64B}-C_{\text{v}2\text{e}}\unicode[STIX]{x1D650}_{\text{e}})]^{-1}\tilde{\boldsymbol{b}}=(\unicode[STIX]{x1D647}+\unicode[STIX]{x1D64B}-C_{\text{v}2\text{e}}\unicode[STIX]{x1D650}_{\text{e}})^{-1}(\unicode[STIX]{x1D644}-\unicode[STIX]{x1D649})^{-1}\tilde{\boldsymbol{b}}\nonumber\\ \displaystyle & = & \displaystyle (\unicode[STIX]{x1D647}+\unicode[STIX]{x1D64B}-C_{\text{v}2\text{e}}\unicode[STIX]{x1D650}_{\text{e}})^{-1}\mathop{\sum }_{i=0}^{\infty }\unicode[STIX]{x1D649}^{i}\tilde{\boldsymbol{b}}=(\unicode[STIX]{x1D647}+\unicode[STIX]{x1D64B}-C_{\text{v}2\text{e}}\unicode[STIX]{x1D650}_{\text{e}})^{-1}\mathop{\sum }_{i=0}^{\infty }\tilde{\boldsymbol{b}}^{(i)},\end{eqnarray}$$
where
 $$\begin{eqnarray}\tilde{\boldsymbol{b}}^{(i)}\stackrel{\text{def}}{=}\unicode[STIX]{x1D649}^{i}\tilde{\boldsymbol{b}},\quad \tilde{\boldsymbol{b}}^{(0)}=\tilde{\boldsymbol{b}}\stackrel{\text{def}}{=}\unicode[STIX]{x1D739}\bar{\boldsymbol{j}}_{\Vert \text{i}}^{\,\text{h}}+\unicode[STIX]{x1D739}\boldsymbol{j}_{\Vert \text{e}}^{\text{h}},\end{eqnarray}$$
 $$\begin{eqnarray}\displaystyle & \displaystyle \unicode[STIX]{x1D649}\stackrel{\text{def}}{=}(\unicode[STIX]{x1D64B}-\unicode[STIX]{x1D645}^{\text{ad}})(\unicode[STIX]{x1D647}+\unicode[STIX]{x1D64B}-C_{\text{v}2\text{e}}\unicode[STIX]{x1D650}_{\text{e}})^{-1}, & \displaystyle\end{eqnarray}$$
 $$\begin{eqnarray}\displaystyle & \displaystyle \unicode[STIX]{x1D645}^{\text{ad}}\stackrel{\text{def}}{=}\bar{\unicode[STIX]{x1D645}}_{\text{i}}^{\text{ad}}+\unicode[STIX]{x1D645}_{\text{e}}^{\text{ad}}. & \displaystyle\end{eqnarray}$$
We used here the Neumann series
 $$\begin{eqnarray}(\unicode[STIX]{x1D644}-\unicode[STIX]{x1D649})^{-1}=\mathop{\sum }_{i=0}^{\infty }\unicode[STIX]{x1D649}^{i},\end{eqnarray}$$
which can be especially useful for the approximate inversion of matrices. It has the necessary and sufficient convergence condition that
 $\unicode[STIX]{x1D649}$
has the norm
$\unicode[STIX]{x1D649}$
has the norm
 $\Vert \unicode[STIX]{x1D649}\Vert <1$
. From this, the convergence criterion follows:
$\Vert \unicode[STIX]{x1D649}\Vert <1$
. From this, the convergence criterion follows:
 $$\begin{eqnarray}||(\unicode[STIX]{x1D64B}-\bar{\unicode[STIX]{x1D645}}_{\text{i}}^{\text{ad}}-\unicode[STIX]{x1D645}_{\text{e}}^{\text{ad}})(\unicode[STIX]{x1D647}+\unicode[STIX]{x1D64B}-C_{\text{v}2\text{e}}\unicode[STIX]{x1D650}_{\text{e}})^{-1}||<1.\end{eqnarray}$$
The convergence becomes faster the closer the preconditioner
 $(\unicode[STIX]{x1D647}+\unicode[STIX]{x1D64B}-C_{\text{v}2\text{e}}\unicode[STIX]{x1D650}_{\text{e}})$
is to the matrix
$(\unicode[STIX]{x1D647}+\unicode[STIX]{x1D64B}-C_{\text{v}2\text{e}}\unicode[STIX]{x1D650}_{\text{e}})$
is to the matrix
 $(\unicode[STIX]{x1D647}+\bar{\unicode[STIX]{x1D645}}_{\text{i}}^{\text{ad}}+\unicode[STIX]{x1D645}_{\text{e}}^{\text{ad}}-C_{\text{v}2\text{e}}\unicode[STIX]{x1D650}_{\text{e}})$
, i.e. the closer
$(\unicode[STIX]{x1D647}+\bar{\unicode[STIX]{x1D645}}_{\text{i}}^{\text{ad}}+\unicode[STIX]{x1D645}_{\text{e}}^{\text{ad}}-C_{\text{v}2\text{e}}\unicode[STIX]{x1D650}_{\text{e}})$
, i.e. the closer
 $\unicode[STIX]{x1D64B}$
is to the matrix (
$\unicode[STIX]{x1D64B}$
is to the matrix (
 $\bar{\unicode[STIX]{x1D645}}_{\text{i}}^{\text{ad}}+\unicode[STIX]{x1D645}_{\text{e}}^{\text{ad}}$
). In principle we are free in choosing the matrix
$\bar{\unicode[STIX]{x1D645}}_{\text{i}}^{\text{ad}}+\unicode[STIX]{x1D645}_{\text{e}}^{\text{ad}}$
). In principle we are free in choosing the matrix
 $\unicode[STIX]{x1D64B}$
as long as it speeds up the convergence of the iterative method. However, we already have a very efficient approximating matrix at hand by setting (see (8.6)):
$\unicode[STIX]{x1D64B}$
as long as it speeds up the convergence of the iterative method. However, we already have a very efficient approximating matrix at hand by setting (see (8.6)):
 $$\begin{eqnarray}\unicode[STIX]{x1D64B}_{1}\stackrel{\text{def}}{=}\bar{\unicode[STIX]{x1D64E}}_{\text{i}}+\unicode[STIX]{x1D64E}_{\text{e}}+C_{\text{v3e}}\unicode[STIX]{x1D650}_{\text{e}}.\end{eqnarray}$$
For a sufficiently large number of markers the convergence condition will be fulfilled and finally in the limit
 $N_{\text{p}}\rightarrow \infty$
the sum of the matrices
$N_{\text{p}}\rightarrow \infty$
the sum of the matrices
 $\bar{\unicode[STIX]{x1D645}}_{\text{i}}^{\text{ad}}$
and
$\bar{\unicode[STIX]{x1D645}}_{\text{i}}^{\text{ad}}$
and
 $\unicode[STIX]{x1D645}_{\text{e}}^{\text{ad}}$
will become identical with the matrix
$\unicode[STIX]{x1D645}_{\text{e}}^{\text{ad}}$
will become identical with the matrix
 $\unicode[STIX]{x1D64B}_{1}$
. A slightly less efficient but rather more simple structured approximating matrix is
$\unicode[STIX]{x1D64B}_{1}$
. A slightly less efficient but rather more simple structured approximating matrix is
 $$\begin{eqnarray}\unicode[STIX]{x1D64B}_{2}\stackrel{\text{def}}{=}\check{\unicode[STIX]{x1D64E}}_{\text{i}}+\unicode[STIX]{x1D64E}_{\text{e}}+C_{\text{v3e}}\unicode[STIX]{x1D650}_{\text{e}},\end{eqnarray}$$
where we have approximated
 $\bar{\unicode[STIX]{x1D64E}}_{\text{i}}\approx \check{\unicode[STIX]{x1D64E}}_{\text{i}}$
, i.e. the gyro-averaging is approximated by its long-wavelength approximation (compare (7.25) and (7.28)). For the price of a further loss of efficiency we might even assume an infinite velocity sphere by setting
$\bar{\unicode[STIX]{x1D64E}}_{\text{i}}\approx \check{\unicode[STIX]{x1D64E}}_{\text{i}}$
, i.e. the gyro-averaging is approximated by its long-wavelength approximation (compare (7.25) and (7.28)). For the price of a further loss of efficiency we might even assume an infinite velocity sphere by setting
 $C_{\text{v3}}=1$
for all the right-hand side terms of (F 8).
$C_{\text{v3}}=1$
for all the right-hand side terms of (F 8).
Using (F 1) and selecting
 $\unicode[STIX]{x1D64B}=\unicode[STIX]{x1D64B}_{2}$
, we define the
$\unicode[STIX]{x1D64B}=\unicode[STIX]{x1D64B}_{2}$
, we define the
 $n$
-term approximation of
$n$
-term approximation of
 $\boldsymbol{d}$
by
$\boldsymbol{d}$
by
 $$\begin{eqnarray}\boldsymbol{d}^{(n)}\stackrel{\text{def}}{=}(\unicode[STIX]{x1D647}+\check{\unicode[STIX]{x1D64E}}_{\text{i}}+\unicode[STIX]{x1D64E}_{\text{e}}-C_{\text{v1e}}\unicode[STIX]{x1D650}_{\text{e}})^{-1}\mathop{\sum }_{i=0}^{n}\tilde{\boldsymbol{b}}^{(i)}.\end{eqnarray}$$
A recursive relation for evaluating
 $\boldsymbol{d}^{(n)}$
can be formulated:
$\boldsymbol{d}^{(n)}$
can be formulated:
 $$\begin{eqnarray}\boldsymbol{d}^{(n)}=(\unicode[STIX]{x1D647}+\check{\unicode[STIX]{x1D64E}}_{\text{i}}+\unicode[STIX]{x1D64E}_{\text{e}}-C_{\text{v1e}}\unicode[STIX]{x1D650}_{\text{e}})^{-1}[(\check{\unicode[STIX]{x1D64E}}_{\text{i}}+\unicode[STIX]{x1D64E}_{\text{e}}-C_{\text{v3e}}\unicode[STIX]{x1D650}_{\text{e}}-\bar{\unicode[STIX]{x1D645}}_{\text{i}}^{\text{ad}}-\unicode[STIX]{x1D645}_{\text{e}}^{\text{ad}})\boldsymbol{d}^{(n-1)}+\tilde{\boldsymbol{b}}],\end{eqnarray}$$
where we used
 $$\begin{eqnarray}\displaystyle \mathop{\sum }_{i=0}^{n}\tilde{\boldsymbol{b}}^{(i)} & = & \displaystyle \mathop{\sum }_{i=0}^{n}\unicode[STIX]{x1D649}^{i}\tilde{\boldsymbol{b}}=\mathop{\sum }_{i=1}^{n}\unicode[STIX]{x1D649}^{i}\tilde{\boldsymbol{b}}+\tilde{\boldsymbol{b}}=\unicode[STIX]{x1D649}\mathop{\sum }_{i=0}^{n-1}\unicode[STIX]{x1D649}^{i}\tilde{\boldsymbol{b}}+\tilde{\boldsymbol{b}}=\unicode[STIX]{x1D649}\mathop{\sum }_{i=0}^{n-1}\tilde{\boldsymbol{b}}^{(i)}+\tilde{\boldsymbol{b}}\nonumber\\ \displaystyle & = & \displaystyle \unicode[STIX]{x1D649}(\unicode[STIX]{x1D647}+\check{\unicode[STIX]{x1D64E}}_{\text{i}}+\unicode[STIX]{x1D64E}_{\text{e}}-C_{\text{v1e}}\unicode[STIX]{x1D650}_{\text{e}})\boldsymbol{d}^{(n-1)}+\tilde{\boldsymbol{b}}\nonumber\\ \displaystyle & = & \displaystyle (\check{\unicode[STIX]{x1D64E}}_{\text{i}}+\unicode[STIX]{x1D64E}_{\text{e}}-C_{\text{v3e}}\unicode[STIX]{x1D650}_{\text{e}}-\bar{\unicode[STIX]{x1D645}}_{\text{i}}^{\text{ad}}-\unicode[STIX]{x1D645}_{\text{e}}^{\text{ad}})\boldsymbol{d}^{(n-1)}+\tilde{\boldsymbol{b}}.\end{eqnarray}$$
To initialise the recursion
 $\boldsymbol{d}^{(0)}=0$
can be chosen. However, if the solution
$\boldsymbol{d}^{(0)}=0$
can be chosen. However, if the solution
 $\boldsymbol{d}^{(n)}(t_{n-1})$
from the previous time step
$\boldsymbol{d}^{(n)}(t_{n-1})$
from the previous time step
 $t_{n-1}$
of the simulation is available, it is superior to use this as an initial guess. To perform the recursion we have to store only the load vector
$t_{n-1}$
of the simulation is available, it is superior to use this as an initial guess. To perform the recursion we have to store only the load vector
 $\tilde{\boldsymbol{b}}$
and the coefficient vector
$\tilde{\boldsymbol{b}}$
and the coefficient vector
 $\boldsymbol{d}^{(n-1)}$
of the previous iteration.
$\boldsymbol{d}^{(n-1)}$
of the previous iteration.
In addition, the iterative scheme in the form of the recursion, equation (F 10), has the advantage that the Fourier filters introduced in § 9 can now be easily applied by imposing:
 $$\begin{eqnarray}\boldsymbol{d}^{(n)}=(\unicode[STIX]{x1D647}+\check{\unicode[STIX]{x1D64E}}_{\text{i}}+\unicode[STIX]{x1D64E}_{\text{e}}-C_{\text{v1e}}\unicode[STIX]{x1D650}_{\text{e}})^{-1}\hat{{\mathcal{F}}}[(\check{\unicode[STIX]{x1D64E}}_{\text{i}}+\unicode[STIX]{x1D64E}_{\text{e}}-C_{\text{v3e}}\unicode[STIX]{x1D650}_{\text{e}}-\bar{\unicode[STIX]{x1D645}}_{\text{i}}^{\text{ad}}-\unicode[STIX]{x1D645}_{\text{e}}^{\text{ad}})\hat{\boldsymbol{d}}^{(n-1)}+\tilde{\boldsymbol{b}}]\end{eqnarray}$$
and
 $$\begin{eqnarray}\hat{\boldsymbol{d}}^{(n-1)}={\mathcal{F}}[\boldsymbol{d}^{(n-1)}].\end{eqnarray}$$
This improves the convergence of the iterative scheme significantly because the high-frequency part of the solution – mainly caused by the statistical noise of the markers – is filtered out and does not have to be converged in the iterative scheme. The convergence rate of the scheme can be monitored by the evaluation of the statistical error of the total current, equation (4.81), after each iteration. In practice it has been shown that, depending on the number of markers
 $N_{\text{p}}$
, the iterative scheme, equation (F 12), typically converges after a few iterations.
$N_{\text{p}}$
, the iterative scheme, equation (F 12), typically converges after a few iterations.
To save computational time the term
 $(\check{\unicode[STIX]{x1D64E}}_{\text{i}}-\bar{\unicode[STIX]{x1D645}}_{\text{i}}^{\text{ad}})\boldsymbol{d}^{(n)}$
for the ions or
$(\check{\unicode[STIX]{x1D64E}}_{\text{i}}-\bar{\unicode[STIX]{x1D645}}_{\text{i}}^{\text{ad}})\boldsymbol{d}^{(n)}$
for the ions or
 $(\unicode[STIX]{x1D64E}_{\text{e}}-C_{\text{v3e}}\unicode[STIX]{x1D650}_{\text{e}}-\unicode[STIX]{x1D645}_{\text{e}}^{\text{ad}})\boldsymbol{d}^{(n)}$
for the electrons respectively can be fixed at a certain iteration level if convergence has been reached for this species. Typically the convergence rate for the ions is much faster than for the electrons. In many cases it is not necessary to perform an iteration for the ions at all to diminish the statistical error unless to achieve the full gyro-averaging instead of the long-wavelength approximation. Thus, it is possible to select an adjusted number of iterations for each species.
$(\unicode[STIX]{x1D64E}_{\text{e}}-C_{\text{v3e}}\unicode[STIX]{x1D650}_{\text{e}}-\unicode[STIX]{x1D645}_{\text{e}}^{\text{ad}})\boldsymbol{d}^{(n)}$
for the electrons respectively can be fixed at a certain iteration level if convergence has been reached for this species. Typically the convergence rate for the ions is much faster than for the electrons. In many cases it is not necessary to perform an iteration for the ions at all to diminish the statistical error unless to achieve the full gyro-averaging instead of the long-wavelength approximation. Thus, it is possible to select an adjusted number of iterations for each species.
The main advantage of the iterative scheme is that it is not necessary to reconstruct the matrices
 $\bar{\unicode[STIX]{x1D645}}_{\text{i}}^{\text{ad}}$
and
$\bar{\unicode[STIX]{x1D645}}_{\text{i}}^{\text{ad}}$
and
 $\unicode[STIX]{x1D645}_{\text{e}}^{\text{ad}}$
every time the markers have been pushed. The only ingredient we need is the result of
$\unicode[STIX]{x1D645}_{\text{e}}^{\text{ad}}$
every time the markers have been pushed. The only ingredient we need is the result of
 $(\bar{\unicode[STIX]{x1D645}}_{\text{i}}^{\text{ad}}\,+\,\unicode[STIX]{x1D645}_{\text{e}}^{\text{ad}})\boldsymbol{d}^{(n-1)}$
(matrix-free method) (see § 8.1.1). The approximating matrices
$(\bar{\unicode[STIX]{x1D645}}_{\text{i}}^{\text{ad}}\,+\,\unicode[STIX]{x1D645}_{\text{e}}^{\text{ad}})\boldsymbol{d}^{(n-1)}$
(matrix-free method) (see § 8.1.1). The approximating matrices
 $\unicode[STIX]{x1D64B}_{1}$
and
$\unicode[STIX]{x1D64B}_{1}$
and
 $\unicode[STIX]{x1D64B}_{2}$
are independent of the marker positions and can be calculated at the initialisation process of the code. Supposed that it is not too costly, it would be possible to perform an LU decomposition only once which could be used later for inversion purpose with a forward and back substitution of
$\unicode[STIX]{x1D64B}_{2}$
are independent of the marker positions and can be calculated at the initialisation process of the code. Supposed that it is not too costly, it would be possible to perform an LU decomposition only once which could be used later for inversion purpose with a forward and back substitution of
 $\text{O}(N^{2})$
operations. In contrast to the iterative scheme a direct method would need the calculation of the inverse
$\text{O}(N^{2})$
operations. In contrast to the iterative scheme a direct method would need the calculation of the inverse
 $(\unicode[STIX]{x1D647}+\bar{\unicode[STIX]{x1D645}}_{\text{i}}^{\text{ad}}+\unicode[STIX]{x1D645}_{\text{e}}^{\text{ad}}-C_{\text{v}2\text{e}}\unicode[STIX]{x1D650}_{\text{e}})^{-1}$
of
$(\unicode[STIX]{x1D647}+\bar{\unicode[STIX]{x1D645}}_{\text{i}}^{\text{ad}}+\unicode[STIX]{x1D645}_{\text{e}}^{\text{ad}}-C_{\text{v}2\text{e}}\unicode[STIX]{x1D650}_{\text{e}})^{-1}$
of
 $\text{O}(N^{3})$
operations and this after every push of the markers.
$\text{O}(N^{3})$
operations and this after every push of the markers.
F.2 The nonlinear case
In the following, we will present an iterative scheme to solve the nonlinear discretised Ampère’s law (8.12). For the convergence of the nonlinear iterative scheme it is important that the nonlinearity
 $\unicode[STIX]{x1D645}^{\text{nonlin}}(\boldsymbol{d})$
is relatively small. If we use the converged coefficient vector
$\unicode[STIX]{x1D645}^{\text{nonlin}}(\boldsymbol{d})$
is relatively small. If we use the converged coefficient vector
 $\boldsymbol{d}^{(n)}(t_{n-1})$
of the previous time step
$\boldsymbol{d}^{(n)}(t_{n-1})$
of the previous time step
 $t_{n-1}$
of the simulation for an initial transformation of the perturbed weights, equation (3.47) or (3.48), we can assume for a sufficiently small time-step size
$t_{n-1}$
of the simulation for an initial transformation of the perturbed weights, equation (3.47) or (3.48), we can assume for a sufficiently small time-step size
 $\unicode[STIX]{x0394}t$
:
$\unicode[STIX]{x0394}t$
:
 $$\begin{eqnarray}||\unicode[STIX]{x1D645}^{\text{nonlin}}(\boldsymbol{d})||\ll ||\unicode[STIX]{x1D645}^{\text{ad}}\boldsymbol{d}||,\end{eqnarray}$$
where
 $$\begin{eqnarray}\unicode[STIX]{x1D645}^{\text{ad}}\stackrel{\text{def}}{=}\bar{\unicode[STIX]{x1D645}}_{\text{i}}^{\text{ad}}+\unicode[STIX]{x1D645}_{\text{e}}^{\text{ad}}\quad \text{and}\quad \unicode[STIX]{x1D645}^{\text{nonlin}}(\boldsymbol{d})\stackrel{\text{def}}{=}\bar{\unicode[STIX]{x1D645}}_{\text{i}}^{\text{nonlin}}(\boldsymbol{d})+\unicode[STIX]{x1D645}_{\text{e}}^{\text{nonlin}}(\boldsymbol{d}).\end{eqnarray}$$
Usually, the maximal time-step size
 $\unicode[STIX]{x0394}t_{\max }$
, which is limited by the dynamics of the simulation, is already sufficiently small to imply this relation. Hence, there will be no further restriction on the time-step size to guarantee the convergence of the iterative scheme.
$\unicode[STIX]{x0394}t_{\max }$
, which is limited by the dynamics of the simulation, is already sufficiently small to imply this relation. Hence, there will be no further restriction on the time-step size to guarantee the convergence of the iterative scheme.
The derivation of the iterative scheme is quite similar to the linear scheme in § F.1. To see this we rewrite Ampère’s law (8.12) in the form:
 $$\begin{eqnarray}(\unicode[STIX]{x1D647}+\unicode[STIX]{x1D645}^{\text{ad}}-C_{\text{v}2\text{e}}\unicode[STIX]{x1D650}_{\text{e}})\boldsymbol{d}=\tilde{\boldsymbol{b}}-\unicode[STIX]{x1D645}^{\text{nonlin}}(\boldsymbol{d}).\end{eqnarray}$$
The nonlinear term is assumed to be only a small modification of the right-hand side. From this, it immediately follows (compare with (F 1)) that the iterative linear scheme, equation (F 12), can be adapted to the nonlinear case:
 $$\begin{eqnarray}\displaystyle \boldsymbol{d}^{(n)} & = & \displaystyle (\unicode[STIX]{x1D647}+\check{\unicode[STIX]{x1D64E}}_{\text{i}}+\unicode[STIX]{x1D64E}_{\text{e}}-C_{\text{v1e}}\unicode[STIX]{x1D650}_{\text{e}})^{-1}\nonumber\\ \displaystyle & & \displaystyle \times \,\hat{{\mathcal{F}}}[(\check{\unicode[STIX]{x1D64E}}_{\text{i}}+\unicode[STIX]{x1D64E}_{\text{e}}-C_{\text{v3e}}\unicode[STIX]{x1D650}_{\text{e}}-\unicode[STIX]{x1D645}^{\text{ad}})\hat{\boldsymbol{d}}^{(n-1)}+\tilde{\boldsymbol{b}}-\unicode[STIX]{x1D645}^{\text{nonlin}}(\hat{\boldsymbol{d}}^{(n-1)})]\nonumber\\ \displaystyle & = & \displaystyle (\unicode[STIX]{x1D647}+\check{\unicode[STIX]{x1D64E}}_{\text{i}}+\unicode[STIX]{x1D64E}_{\text{e}}-C_{\text{v1e}}\unicode[STIX]{x1D650}_{\text{e}})^{-1}\nonumber\\ \displaystyle & & \displaystyle \times \,\hat{{\mathcal{F}}}[(\check{\unicode[STIX]{x1D64E}}_{\text{i}}+\unicode[STIX]{x1D64E}_{\text{e}}-C_{\text{v3e}})\hat{\boldsymbol{d}}^{(n-1)}+\unicode[STIX]{x1D739}\bar{\boldsymbol{j}}_{\Vert \text{i}}^{\,\text{h}}+\unicode[STIX]{x1D739}\boldsymbol{j}_{\Vert \text{e}}^{\text{h}}-\unicode[STIX]{x1D645}(\hat{\boldsymbol{d}}^{(n-1)})],\end{eqnarray}$$
where we used (8.10). In particular, we have to evaluate
 $$\begin{eqnarray}\unicode[STIX]{x1D739}\bar{\boldsymbol{j}}_{\Vert \text{i}}^{s,(n-1)}+\unicode[STIX]{x1D739}\boldsymbol{j}_{\Vert \text{e}}^{s,(n-1)}=\unicode[STIX]{x1D739}\bar{\boldsymbol{j}}_{\Vert \text{i}}^{\,\text{h}}-\bar{\unicode[STIX]{x1D645}}_{\text{i}}(\hat{\boldsymbol{d}}^{(n-1)})+\unicode[STIX]{x1D739}\boldsymbol{j}_{\Vert \text{e}}^{\text{h}}-\unicode[STIX]{x1D645}_{\text{e}}(\hat{\boldsymbol{d}}^{(n-1)}),\end{eqnarray}$$
which can be done by performing the transformation of the perturbed weights, equation (3.47) or (3.48), with a subsequent current assignment in the symplectic formulation. So the iterative solution of Ampère’s law has been combined with an iterative transformation of the weights.
Alternatively, the iterative scheme (F 17) can be written in the following form:
 $$\begin{eqnarray}(\unicode[STIX]{x1D647}+\check{\unicode[STIX]{x1D64E}}_{\text{i}}+\unicode[STIX]{x1D64E}_{\text{e}}-C_{\text{v1e}}\unicode[STIX]{x1D650}_{\text{e}})\unicode[STIX]{x0394}\boldsymbol{d}^{(n)}=\hat{{\mathcal{F}}}[\unicode[STIX]{x1D739}\bar{\boldsymbol{j}}_{\Vert \text{i}}^{s,(n-1)}+\unicode[STIX]{x1D739}\boldsymbol{j}_{\Vert \text{e}}^{s,(n-1)}-(\unicode[STIX]{x1D647}-C_{\text{v}2\text{e}}\unicode[STIX]{x1D650}_{\text{e}})\hat{\boldsymbol{d}}^{(n-1)}],\end{eqnarray}$$
where
 $$\begin{eqnarray}\unicode[STIX]{x0394}\boldsymbol{d}^{(n)}\stackrel{\text{def}}{=}\boldsymbol{d}^{(n)}-\boldsymbol{d}^{(n-1)}.\end{eqnarray}$$
For the initial step of
 $\boldsymbol{d}^{(0)}=0$
one solves the linearised discretised Ampère’s law (7.21) in the Hamiltonian formulation. And for a converged result, i.e.
$\boldsymbol{d}^{(0)}=0$
one solves the linearised discretised Ampère’s law (7.21) in the Hamiltonian formulation. And for a converged result, i.e.
 $\unicode[STIX]{x0394}\boldsymbol{d}^{(n)}=0$
, one has finally solved the discretised Ampère’s law (7.20) in the symplectic formulation.
$\unicode[STIX]{x0394}\boldsymbol{d}^{(n)}=0$
, one has finally solved the discretised Ampère’s law (7.20) in the symplectic formulation.
The iterative scheme, in its form of (F 19), is well suited to solve Ampère’s law as it appears for the mixed formulation in Kleiber et al. (Reference Kleiber, Hatzky, Könies, Mishchenko and Sonnendrücker2016, (12)). In this case, the initialisation of the recursion would start with
 $\boldsymbol{d}^{(0)}$
being the coefficient vector of
$\boldsymbol{d}^{(0)}$
being the coefficient vector of
 $\unicode[STIX]{x1D6FF}\boldsymbol{A}_{\Vert }^{\text{s}}$
and the first iteration would solve for the coefficient vector of
$\unicode[STIX]{x1D6FF}\boldsymbol{A}_{\Vert }^{\text{s}}$
and the first iteration would solve for the coefficient vector of
 $\unicode[STIX]{x1D6FF}\boldsymbol{A}_{\Vert }^{\text{h}}=\unicode[STIX]{x0394}\boldsymbol{d}^{(1)}$
. But as long as the iterative scheme does not stop after one iteration, further diminishing of the error of
$\unicode[STIX]{x1D6FF}\boldsymbol{A}_{\Vert }^{\text{h}}=\unicode[STIX]{x0394}\boldsymbol{d}^{(1)}$
. But as long as the iterative scheme does not stop after one iteration, further diminishing of the error of
 $\unicode[STIX]{x1D6FF}\boldsymbol{A}$
would be possible.
$\unicode[STIX]{x1D6FF}\boldsymbol{A}$
would be possible.


 Open access