

Diet is an important factor in promoting health and preventing chronic diseases such as CVD, diabetes, obesity and cancer. The rapid growth of the global ageing population and the limited efficacy of available pharmacological therapies for age-related cognitive decline and neurodegenerative diseases means that there is an increasing interest and public demand for so called ‘functional foods’ that promote cognitive wellbeing and longevity( Reference Cannella, Savina and Donini 1 – Reference Feart, Samieri and Barberger-Gateau 3 ). At the other end of the scale a growing body of evidence supports that early nutrition during prenatal development, infancy and childhood affects both cognitive development and cognitive function and behaviour in later life( Reference Anjos, Altmae and Emmett 4 – Reference Jacka, Ystrom and Brantsaeter 7 ). The beneficial effects of certain food groups including plant foods and oily fish which provide high sources of plant bioactives (e.g. polyphenols, glucosinolates and antioxidant vitamins) and n-3 fatty acids, respectively, are well documented( Reference Feart, Samieri and Barberger-Gateau 3 , Reference Pallauf, Giller and Huebbe 8 – Reference Feart, Samieri and Alles 10 ). Many modern diets and food supplements are enriched with these bioactive compounds and claim to be beneficial to health through boosting the immune system, supporting cardiovascular function, protecting cells against oxidative stress and promoting healthy skin, teeth and bones( Reference Roll, Nocon and Willich 11 – Reference Esfahani, Wong and Truan 17 ).
Addressing the synergistic effects of certain functional foods and supplements consumed in combination on health and wellbeing is of growing interest in the field of nutrition( Reference Alles, Samieri and Feart 2 , Reference Jacobs and Steffen 18 , Reference Jacobs, Gross and Tapsell 19 ). The purpose of this communication was to address potential common biological effects of the functional foods n-3 fatty acids EPA and DHA, flavonoids and resveratrol on different regulatory mechanisms including development, immune responses, metabolic processing and disease using a pathway analysis approach. Gene sets associated with these functional foods were also overlaid with genome-wide association studies (GWAS) hits for common diseases and biological functions. The findings of this analysis will have implications for public health, disease intervention, therapeutic management, nutrition-related behaviours, marketing strategy, economic growth and food development.
Methods
Gene expression array database
Human microarray data for dietary interventions with n-3 fatty acids (EPA and/or DHA), flavonoids and resveratrol was downloaded from the ArrayExpress database (https://www.ebi.ac.uk/arrayexpress/). Study descriptions for the microarray data sets are detailed in Table 1. Studies included in the analysis were selected on the following criteria: (1) performed in healthy human subjects or subjects with a dietary-related disease but otherwise healthy, (2) double-blinded randomised controlled trials, (3) microarray-based gene expression data available at baseline and following treatment intervention for each subject. Gene expression changes between baseline measurements or placebo for cross-over studies (control group) and following treatment intervention (treatment group) within the same individuals were analysed using GEO2R( Reference Davis and Meltzer 26 ), based on the Linear Models for Microarray Analysis (limma) R/ Bioconductor software package( Reference Ritchie, Phipson and Wu 27 ), available at http://www.ncbi.nlm.nih.gov/geo/info/geo2r.html. Only significantly regulated genes (P<0·05) were considered for pathway analysis. Unadjusted P values were used in this study in order to address extended biological networks associated with the dietary interventions. For gene replicates within individual studies or duplicates across different studies for the same treatment group, data points with the least significant P value were excluded. If replicates within individual studies had fold changes that were opposing (i.e. positive and negative values for the same gene) both data points were excluded from the analysis.
Microarray study descriptions included in the pathway analysis (Mean values and ranges and standard deviations; mean values with their standard errors)
PBMC, peripheral blood mononuclear cells; BP, blood pressure.
* Gene expression changes were analysed in the same individuals using baseline measurements verses treatment intervention unless stated otherwise.
Genome-wide association studies database
Human GWAS data was downloaded from The National Human Genome Research Institute)-European Bioinformatics Institute GWAS catalog (http://www.ebi.ac.uk/gwas/docs/downloads, accessed August 2015), a publicly available collection of published GWAS for more than 100 000 SNP with SNP-trait associations of P<1×10⁻⁵ ( Reference Welter, MacArthur and Morales 28 ). Reported genome-wide associated genes for ageing, breast cancer, cognitive function, CVD, diabesity, neurodegeneration and psychiatric disorders were compiled and duplicates removed. GWAS included in this analysis are detailed in the SupplementaryAppendix S1 (Tables SA1–SA8).
Significance testing of overlapping gene sets
The hypergeometric distribution test phyper available through the R package (https://www.r-project.org/) was used to compute statistical significance between the overlap of two gene sets using the command:>phyper(q, m, n, k, lower.tail=FALSE); where, q=overlap between list 1 and list 2, m=size of list 1, n=population size – list 1, and k=size of list 2. If ‘phyper(q, m, n, k)’ gives the probability of getting x overlap or fewer, ‘lower.tail=FALSE’ gives the probability of getting x+1 or more. A P value of <0·05 was considered significant. The reference gene set in the Protein ANalysis THrough Evolutionary Relationships (PANTHER) database (20 814 genes) was selected as the population size based on subsequent pathway analysis methods using this reference list. Significant overlap of multiple gene sets was addressed using the GeneOverlap package in R, downloaded from https://www.bioconductor.org/packages/release/bioc/html/GeneOverlap.html ( Reference Shen 29 ).
Pathway analysis
Gene expression data obtained from ArrayExpress was analysed using the Ingenuity Pathway Analysis (IPA) Core Analysis function (QIAGEN) under default parameters. Significance testing was performed using the following methods: (1) ratio of the number of differentially expressed genes from the uploaded data set that map to an IPA pathway divided by the total number of molecules that exist in the pathway. (2) Fischer’s exact test, used to calculate the probability that the association between the genes in the uploaded data set and the canonical pathway is explained by chance alone. P values of <0·05 were considered significant. (3) Benjamini–Hochberg procedure, used to calculate the false discovery rate and correct for multiple-testing( Reference Benjamini and Hochberg 30 ). Adjusted P values of <0·05 were considered significant. (4) Fold change cut-off of >0·5, <−0·5 log (differential expression) applied to all data sets. 5) z Score analysis, used as a statistical measure of the match between expected relationship direction and observed gene expression of the uploaded dataset. Positive and negative z scores indicate up-regulated and down-regulated pathways, respectively. In line with IPA cut-off values, z scores of >2·0 or <−2·0 were considered significant.
Statistical overrepresentation testing of gene lists was performed using the publicly available PANTHER Classification System( Reference Mi, Huang and Muruganujan 31 ), http://www.pantherdb.org/. Over-represented pathways were determined using the binomial distribution test( Reference Cho and Campbell 32 ). P values of <0·05 were considered significant.
Results
Gene expression changes associated with dietary n-3 fatty acids EPA/DHA, flavonoids and resveratrol
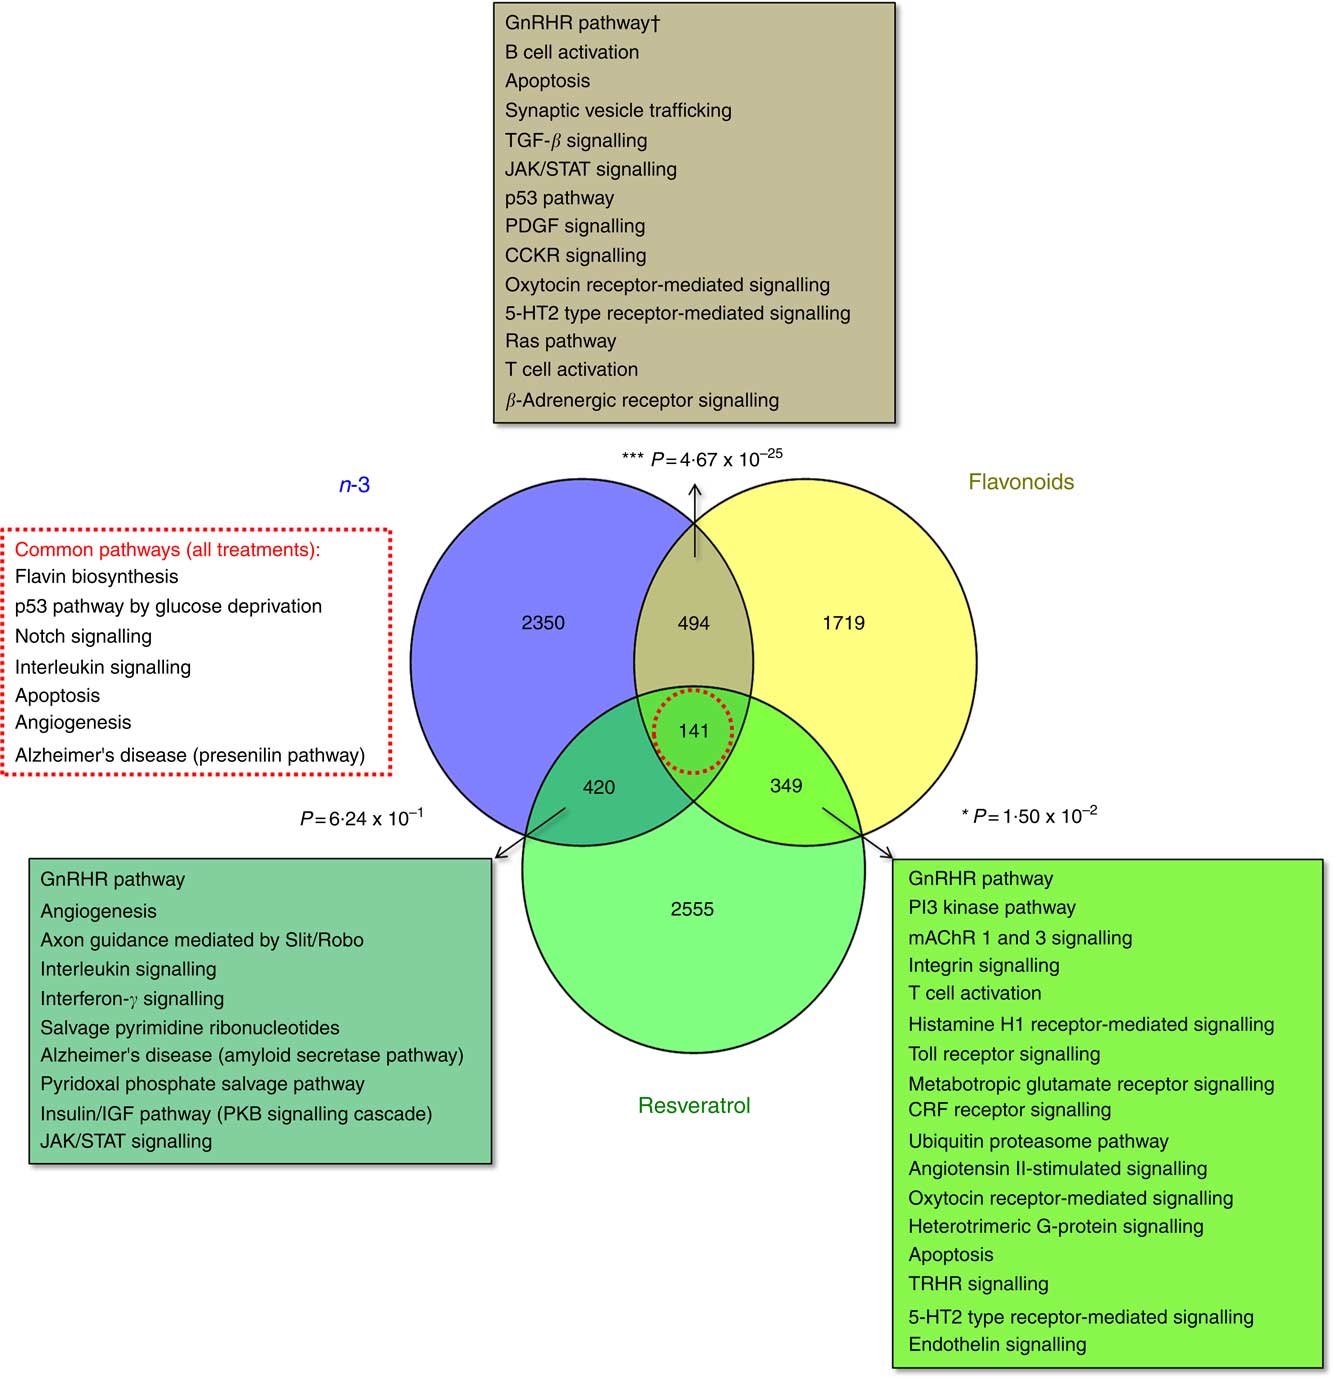
The total number of significant gene expression changes associated with dietary intervention with the functional foods addressed in this study were 3403 for EPA/DHA (mean: 1213; range: 542–1827), 2703 for flavonoids (mean: 1480; range: 915–2,045) and 3464 for resveratrol (mean: 925; range: 555–1424). Gene lists representing all genes significantly regulated in response to these treatment groups are included in the online Supplementary Appendix S2. Significant overlap was observed between the gene sets for EPA/DHA and flavonoids (P=4·67×10−25) and flavonoids and resveratrol (P=0·015), but not for EPA/DHA and resveratrol (P=0·624). A total of 141 genes were common across the three treatment groups (online Supplementary Appendix S2, Table SA12). Statistical overrepresentation testing of these overlapping gene sets was performed using the PANTHER Classification System, which compares user defined gene lists to a reference gene list within the PANTHER database and determines whether a particular class of genes is over- or under-represented with respect to a particular biological process or pathway( Reference Mi, Muruganujan and Casagrande 33 ). Significantly over-represented pathways are represented in Fig. 1.
Enrichment analysis of overlapping gene sets associated with dietary interventions with n-3 fatty acids EPA/DHA, flavonoids and resveratrol. Gene expression data were downloaded from ArrayExpress (https://www.ebi.ac.uk/arrayexpress/). Studies included in the analysis are detailed in Table 1. Significant gene expression changes are represented as a Venn diagram showing treatment-specific and overlapping profiles across the three dietary interventions. For gene lists included in this analysis, see the online Supplementary Appendix S2 (Tables SA9–SA12). Overlapping gene sets (n-3 and flavonoids, 494 genes; n-3 and resveratrol, 420 genes; flavonoids and resveratrol, 349 genes; all treatments, 141 genes) were subjected to statistical overrepresentation testing using PANTHER pathway analysis software. Significantly over-represented pathways are listed for each of the overlapping gene sets. Bold font indicates common pathways across the different gene sets. † Withstood Bonferroni correction for multiple-testing. TGF, transforming growth factor; JAK/STAT, Janus kinase/signal transducer and activator of transcription; PDGF, platelet-derived growth factor; CCKR, cholecystokinin receptor; CRF, cortocotropin releasing factor; 5-HT2, 5-hydroxytryptamine/serotonin; PKB, protein kinase B; mAChR, muscarinic acetylcholine receptor; TRHR, thyrotropin-releasing hormone receptor.
Determining regulatory pathways affected by dietary n-3 fatty acids EPA/DHA, flavonoids and resveratrol
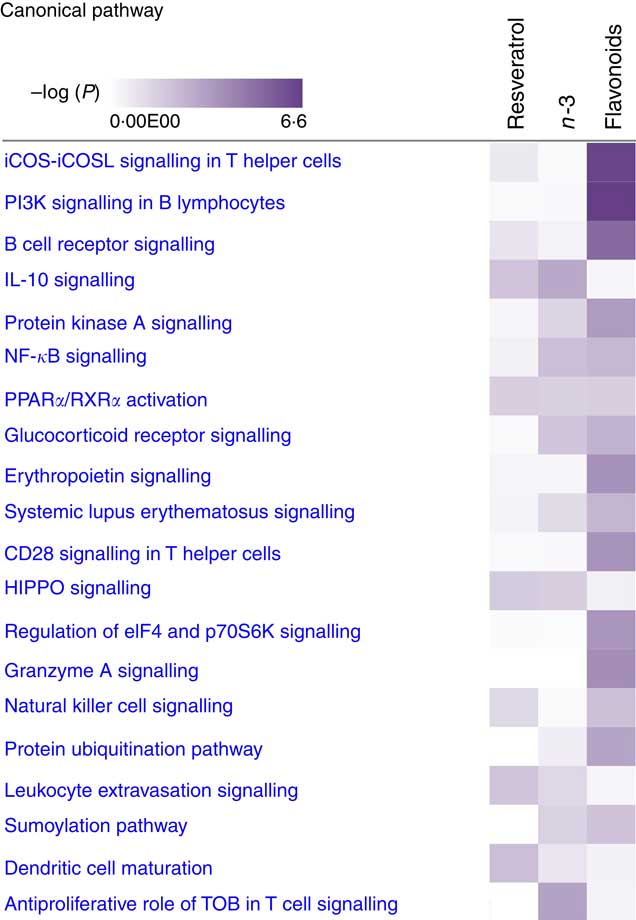
For pathway analysis, differential gene expression data for all significantly regulated genes under each of the treatment conditions was parsed into the IPA platform and enrichment pnalysis performed using the Core Analysis function. This provides an overview of biological relationships, mechanisms, functions and pathways relating to the uploaded data set based on log fold changes in gene expression. Gene lists were filtered to include genes with a log fold change of more than 0·5. To correct for multiple-testing, data sets were adjusted using the Benjamini–Hochberg procedure( Reference Benjamini and Hochberg 30 ). The top canonical pathways associated with dietary intervention with EPA/DHA, flavonoids and resveratrol are shown in Fig. 2 and online Supplementary Appendix S3 (online Supplementary Tables SA13–SA15). Intervention with EPA/DHA enriched for genes implicated in the anti-proliferative role of TOB (Transducer Of ERBB2) in T cell signalling, as well as PPAR (peroxisome proliferator receptor activator) signalling and autoimmune disorders; flavonoids activated PI3K signalling in B lymphocytes, iCOS-iCOSL signalling in T helper cells and cancer pathways; and resveratrol associated with dendritic cell maturation and phagosome formation. Comparative enrichment analysis of significantly regulated canonical pathways indicated overlap between the different treatment groups, as listed in Table 2. PPARα/RXRα (retinoid X receptor) activation was common to all treatment interventions. A regulatory upstream connection and network predicted for PPAR signalling in response to n-3 fatty acids (EPA/DHA) treatment intervention is illustrated in Fig. 3, based on IPA Casual Network Analysis( Reference Kramer, Green and Pollard 34 ). EPA/DHA and flavonoids shared 7/15 common canonical pathways, EPA/DHA and resveratrol shared 8/15 pathways and flavonoids and resveratrol shared 2/15 pathways. There was an enrichment of pathways relating to immune response, disease signalling, cardiovascular function and signal transduction across all treatment conditions (Table 2).
Top twenty canonical pathways significantly regulated following dietary intervention with n-3 fatty acids (EPA/DHA), flavonoids and resveratrol. Functional enrichment analysis of differentially regulated gene sets was performed using Ingenuity Pathway Analysis. Fold change cut-off of >0·5 and <−0·5 log (differential expression) was applied. Statistical significance was determined using the Benjamini–Hochberg procedure for multiple-testing correction. Intensity of a block colour corresponds to –log (P). All significant pathways for each treatment group are listed in the online Supplementary Appendix S3; common significant pathways across the different treatment groups are listed in Table 2.
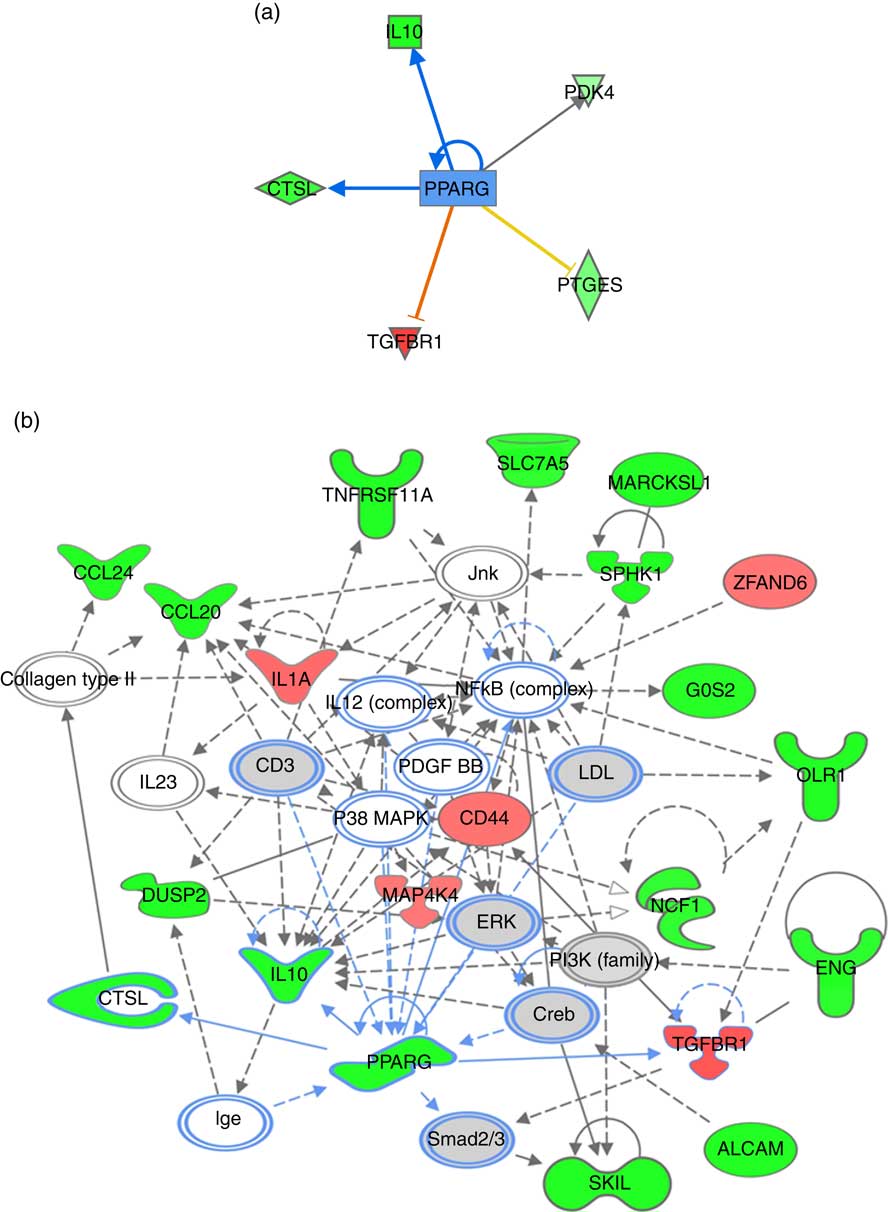
PPARG signalling network predicted for differentially expressed genes in response to n-3 fatty acids (EPA/DHA) treatment intervention. (a) PPARG as an upstream regulatory connection generated using Ingenuity Pathway Analysis (IPA) analysis. Red, green and grey blocks respectively show functions differentially up-regulated, down-regulated and not significantly changed in response to EPA/DHA treatment intervention. Significant activators are represented by red lines connected to red boxes; significant inhibitors by blue lines connected to green boxes. Intensity of a block colour corresponds to –log (fold change). (b) PPARG regulatory network was generated using the IPA network algorithm. Input gene IDs were used as seed functions and their associations retrieved from IPA’s knowledge base. The maximum number of nodes allowed in one network was set at 35. ![]() , Known connections (experimentally validated functional interactions);
, Known connections (experimentally validated functional interactions); ![]() , suggested connections (based on detected associations between proteins). The shapes of blocks correspond to classes of general molecular functions. Red blocks represent differentially over-expressed genes; green blocks represent under-expressed genes, grey blocks represent genes that have not changed based on a fold change cut-off of >0·5 and <−0·5 log (differential expression). Intensity of a block colour corresponds to log (differential expression).
, suggested connections (based on detected associations between proteins). The shapes of blocks correspond to classes of general molecular functions. Red blocks represent differentially over-expressed genes; green blocks represent under-expressed genes, grey blocks represent genes that have not changed based on a fold change cut-off of >0·5 and <−0·5 log (differential expression). Intensity of a block colour corresponds to log (differential expression).
Common canonical pathways significantly regulated following dietary intervention with n-3 fatty acids (EPA/DHA), flavonoids and resveratrolFootnote *
↓ Down-regulated pathway.
* Functional enrichment analysis of gene sets differentially regulated by dietary intervention with n-3 fatty acids EPA/DHA, flavonoids or resveratrol was performed using Ingenuity Pathway Analysis software. Fold change cut-off of >0·5 and <−0·5 log (differential expression) was applied. Statistical significance was determined using the Benjamini–Hochberg procedure. Net effects of gene expression changes on pathway activation or repression were determined using activation z scores (threshold, <−2·0; >2·0).
† Pathways that withstood multiple-testing correction (adjusted P<0·05).
Dietary n-3 fatty acids EPA/DHA, flavonoids and resveratrol target disease pathways
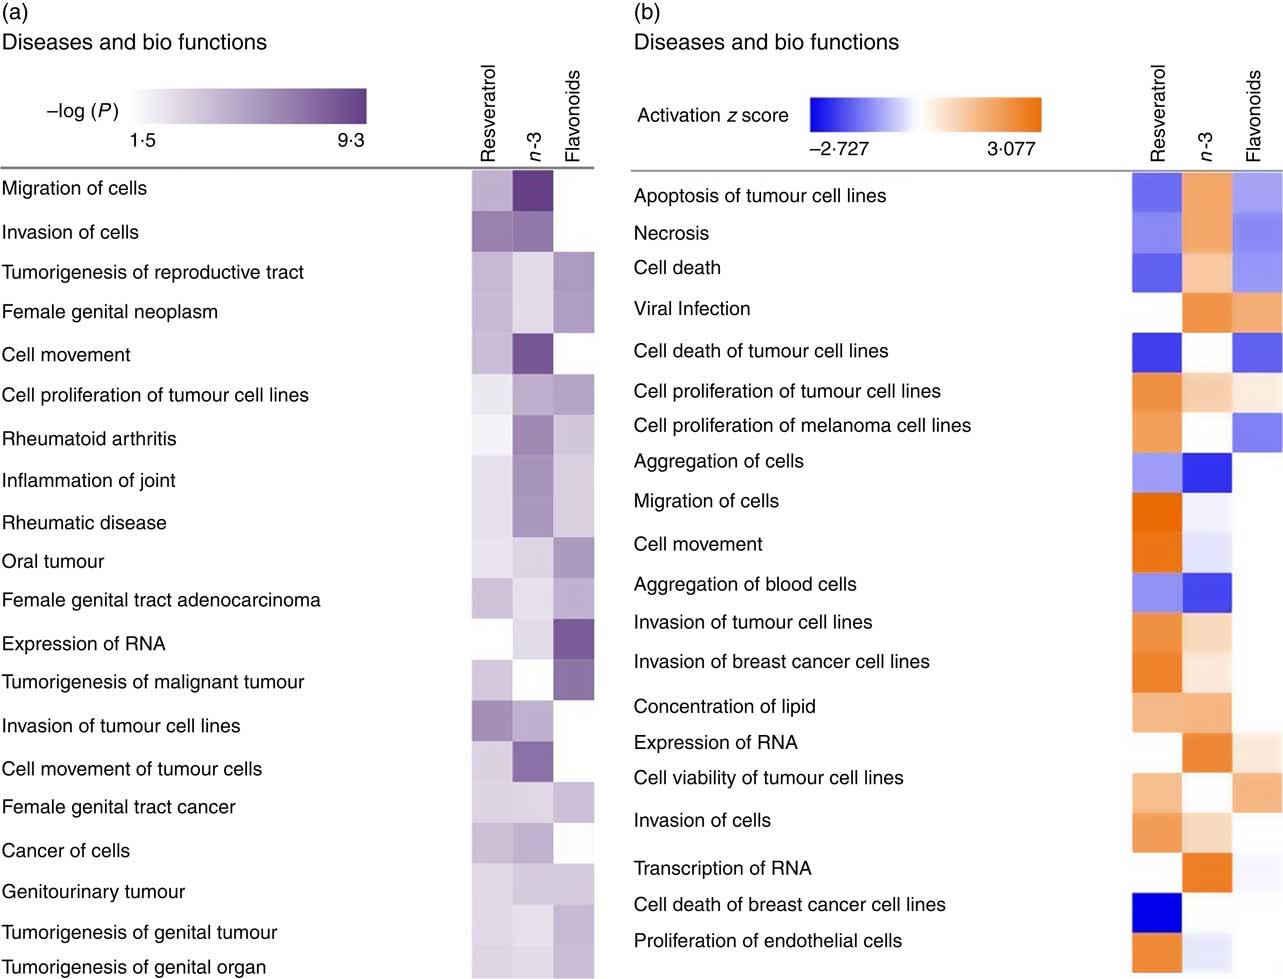
To investigate the role of EPA/DHA, flavonoids and resveratrol in the prevention and/or treatment of disease, IPA Core Analysis was used to identify the top disease pathways and biological functions associated with significantly regulated gene sets for these treatment conditions. This identified processes relevant to tumorigenesis, inflammation and autoimmune disorders, Fig. 4(a). The net effect of gene expression changes was addressed using z scores which predict an increase (positive z score) or decrease (negative z score) in pathway activation. Based on this analysis, EPA/DHA was suggested to have anti-tumorigenic properties (increased apoptosis of tumour cell lines; decreased aggregation of blood cells), flavonoids had both anti-tumorigenic (decreased growth of melanoma) and pro-tumorigenic properties (decreased apoptosis and necrosis of prostate cancer cell lines; increased cell viability of cervical cancer cell lines), and resveratrol was strongly enriched for pro-tumorigenic processes (decreased apoptosis of breast cancer cell lines; increased migration, invasion and proliferation of tumour cell lines) (Fig. 4(b)).
Top disease pathways and biological functions enriched for genes significantly regulated following dietary intervention with n-3 fatty acids (EPA/DHA), flavonoids and resveratrol. Functional enrichment analysis of differentially regulated gene sets was performed using Ingenuity Pathway Analysis. Fold change cut-off of >0·5 and <−0·5 log (differential expression) was applied. (a) Statistical significance was determined using the Benjamini–Hochberg procedure for multiple-testing correction. Intensity of a block colour corresponds to −log (P). (b) Net effects of gene expression changes on pathway activation or repression were determined using activation z scores (threshold, <−2·0; >2·0). Intensity of a block colour corresponds to down-regulated (blue) and up-regulated (orange) pathways.
n-3 Fatty acids EPA/DHA modulate genes implicated in breast cancer through genome-wide association studies
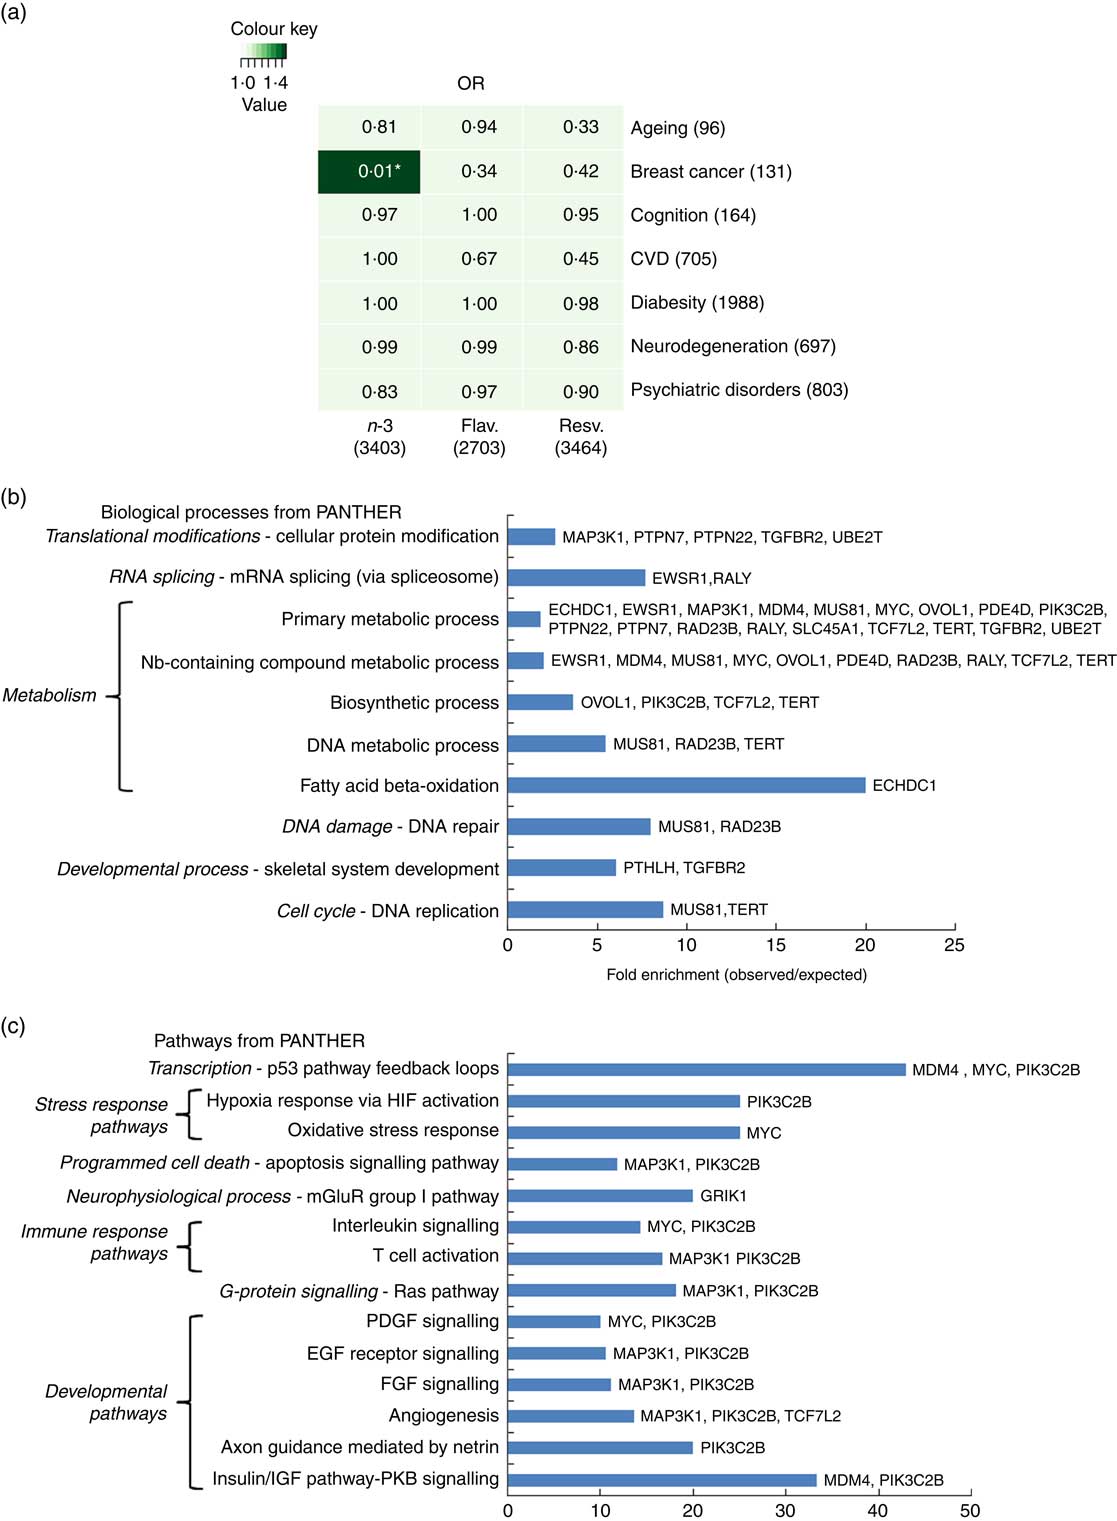
To further address how EPA/DHA, flavonoids and resveratrol may converge onto major disease pathways, gene expression changes associated with these functional foods were compared against GWAS hits for different biological functions and diseases. Hypergeometric distribution testing using the GeneOverlap package in R was used to determine significant overlap between the GWAS data sets and genes associated with dietary interventions with EPA/DHA, flavonoids and resveratrol. As illustrated in Fig. 5(a), significant overlap was observed between the two lists representing genes regulated in response to EPA/DHA and those implicated in breast cancer risk from GWAS. A total of thirty-two genes were identified as being common between the two gene lists. Pathway analysis of this gene set identified enrichment of genes implicated in metabolic processes (Fig. 5(b) and developmental pathways (Fig. 5(c). No other significant associations were found between gene lists for the functional foods and diseases/biological functions tested (Fig. 5(a)).
Significance testing of overlap between genes regulated in response to functional foods and genome-wide association studies (GWAS) hits for common diseases/biological functions. (a) Gene lists representing all genes significantly regulated in response to dietary interventions with n-3 fatty acids EPA/DHA, flavonoids and resveratrol (see Table 1 for study details) were compared against gene lists identified from GWAS (see the online Supplementary Appendix S1 for study details) for ageing, breast cancer, cognition, CVD, diabesity, neurodegeneration and psychiatric disorders. Numbers in brackets represent the number of genes within each gene list. GeneOverlap and GeneOverlapMatrix functions available in R were used to calculate and visualise significant overlap between the gene lists tested. Fischer’s exact test was used to calculate P values which are stated within each panel of the grid. Colour key represents OR values. * Significant overlap (P<0·05). (b) and (c) Statistical overrepresentation testing was performed using the binomial statistics tool available through PANTHER to identify biological processes (b) and pathway classifications (c) for common genes associated with breast cancer and dietary intervention with n-3 fatty acids (EPA/DHA). Uploaded genes were compared with a reference list containing all human genes within the PANTHER database in order to statistically determine over- or under-representation of PANTHER classification categories using the binomial distribution test( Reference Cho and Campbell 32 ). Associated genes are listed on the right of the bar charts. Flav., flavonoids; Resv., resveratrol; Nb, nucleobase; HIF, hypoxia-inducible factor; mGluR, metabotropic glutamate receptor; PDGF, platelet-derived growth factor; EGF, epidermal growth factor; FGF, fibroblast growth factor; IGF, insulin-like growth factor; PKB, protein kinase B.
Discussion
There is a growing interest in the therapeutic potential of n-3 fatty acids and polyphenol-rich foods in the prevention and treatment of chronic disease( Reference Simopoulos 35 – Reference Sagar, Yance and Wong 47 ). The protective role of these functional foods has in part been attributed to their antioxidant and anti-apoptotic effects( Reference Tulio, Chang and Edirisinghe 48 – Reference Pandey and Rizvi 52 ). However, the exact biological mechanisms underpinning the functional aspects of these bioactive compounds are not fully understood. In this communication, pathway analysis was performed to identify the major biological processes associated with genes targeted by dietary intervention with n-3 fatty acids EPA/DHA, flavonoids and resveratrol. Better understanding of the potential synergistic effects of these functional foods in modulating complex biological and pathological processes has important therapeutic implications for the prevention and management of disease.
Enrichment analysis of overlapping gene sets significantly regulated in response to dietary interventions with EPA/DHA, flavonoids and resveratrol identified apoptosis, IL signalling and angiogenesis as common pathways across all treatment groups (Fig. 1). In addition, EPA/DHA and flavonoids enriched for pathways relevant to cellular proliferation and migration, B and T cell activation, neuroendocrine signalling and cardiovascular function; flavonoids and resveratrol enriched for signal transduction, immune response and neuroendocrine pathways; and EPA/DHA and resveratrol enriched for pathways associated with neurodegeneration (Fig. 1 and 2). PPARα/RXRα activation was identified as a significantly regulated pathway common to all three treatment interventions (Fig. 2). PPAR signalling was also found to be significantly associated with EPA/DHA (online Supplementary Appendix S3, Table SA13). n-3 Fatty acids, flavonoids and resveratrol are known ligands of PPARγ ( Reference Edwards and O’Flaherty 53 – Reference Quang, Ngan and Minh 55 ), which plays a key role in the regulation of apoptosis, cellular proliferation, glucose and lipid metabolism, inflammatory responses, oxidative stress, endothelial function and cancer( Reference Marion-Letellier, Savoye and Ghosh 56 ). We would therefore expect to see strong regulation of PPAR-specific target genes in our analysis. However, casual analysis for potential upstream regulators in IPA( Reference Kramer, Green and Pollard 34 ) suggested only marginal involvement of PPARG and PPARA in the regulation of genes differentially expressed in the treatment intervention groups studied, Fig. 3(a). This may reflect the long-term and systemic nature of the studies included in our analysis; even if PPARs played a significant role in triggering gene expression changes at the start of treatment intervention, expression of direct PPAR targets are likely stabilised via multiple feedback mechanisms. Nonetheless, more long-term differential gene expression profiles triggered by these early induced changes are clearly represented in our functional network analysis of primary PPAR targets (Fig. 3(b). On the other hand, continuous activation of receptors can eventually cause an adaptive cellular response and shutting down of the expression of the receptors and their downstream pathways. It would therefore be interesting to follow this line of investigation into interrogation of organismal and tissue responses to short- and long-term exposures to these bioactive compounds.
Analysis of disease pathways associated with the functional foods analysed in this study indicated anti-tumorigenic properties for EPA/DHA, Fig. 4(b), which is supported by the literature( Reference Petrik, McEntee and Chiu 57 – Reference Cockbain, Toogood and Hull 59 ). In contrast, flavonoids were linked to both anti- and pro-tumorigenic processes, whereas resveratrol was strongly enriched for pro-tumorigenic pathways. Resveratrol is well documented for its modulation of the cell cycle in models of cancer( Reference Yuan, Zhang and Xia 60 – Reference Quoc Trung, Espinoza and Takami 66 ). These conflicting results may reflect tissue-specific gene expression profiles (adipose v. skeletal muscle) or phenotypic variations across the study cohorts (overweight/obese male verses postmenopausal female) and warrant further investigation.
Our diet is influenced by many factors including age, sex, education, ethnicity and socioeconomic pressures. Psychological determinants of diet such as mood and stress levels are also very influential( Reference Adam and Epel 67 – Reference Ganasegeran, Al-Dubai and Qureshi 70 ). To address overlap between nutrition and key biological processes and common diseases potentially modified by dietary interventions, GWAS data sets for ageing, cognition, breast cancer, CVD, diabesity, neurodegeneration and psychiatric disorders were compared against gene expression changes associated with EPA/DHA, flavonoids and resveratrol. Significant overlap was observed between the EPA/DHA and breast cancer gene sets (Fig. 5), emphasising the anti-tumorigenic properties of this functional food.
There are several limitations of this study, most notably the comparison of small cohort trials with varied treatment interventions and methodologies, including, and not limited to, cohort size, subject variables, length of intervention, type and dosage of supplement tested, tissue type used for gene expression analysis, and type of microarray technology used for gene expression profiling. Correction for the effect of cofounding variables such as age, sex, health status, genetic variation etc. on gene expression changes across the different study cohorts included in our analysis could not be accounted for in this study. A further limitation of this study is the absence of a matched control group; not every study included in this analysis had gene expression data for no-treatment intervention. Nonetheless, this study identifies several potentially important genes and regulatory pathways targeted through human dietary interventions with n-3 fatty acids EPA/DHA, flavonoids and resveratrol. This is exemplified through significant overlap of the EPA/DHA gene set, identified from pathway analysis as having an anti-tumorigenic profile, with GWAS hits for breast cancer.
In summary, gene expression changes associated with dietary n-3 fatty acids EPA/DHA, flavonoids and resveratrol converged onto important biological and disease pathways, including immune response and cell cycle regulation, suggesting a potentially important role for these bioactive compounds in the prevention and treatment of dietary-related disease. The findings of this study warrant further investigation into the synergistic effect of these functional foods in the management of non-communicable diseases.
Acknowledgements
This research received no specific grant from any funding agency, commercial or not-for-profit sectors.
A. W., P. Q., J. P. S. and J. P. Q. were involved in the study design. A. W. and O. V. were involved in the generation and interpretation of data.
None of the authors has any conflicts of interest to declare.
Supplementary Material
For supplementary material/s referred to in this article, please visit https://doi.org/10.1017/S0007114517003506


