


Aiming for healthy diets
Vegetables are a key aspect of a diverse diet and are among the most recommended sources of vitamins and minerals(Reference Herforth, Arimond and Álvarez-Sánchez1). Despite this, three-quarters of the countries in sub-Saharan Africa consume less than 100 g of fresh vegetables per capita per d, as compared with the WHO recommendation of 240 g(2), an EAT forum recommendation of 300 g(Reference Willett, Rockström and Loken3) and an ‘optimum’ of 360 grams(Reference Afshin, Sur and Fay4). Fruit and vegetable availability in sub-Saharan Africa overall has risen slightly from 178 g per person per d in 1990 to 206 g in 2015, but only one out of forty-three countries meets the 400 g per d recommendation on availability, and projected rises still do not meet recommendations everywhere by 2050 under multiple scenarios(Reference Afshin, Sur and Fay4) (data are often only available combined, despite the different nutritional and sociocultural aspects of fruit v. vegetables). Vegetables are also under-consumed in most parts of West Africa(Reference Willett, Rockström and Loken3,Reference Afshin, Sur and Fay4) . Vegetable consumption in Mali is approximately 110 g per capita per d and in Benin 80 g(Reference Afshin, Sur and Fay4), and up to 15 % of adults in Benin and 12 % in Mali report zero fruit and vegetable consumption(5). There is a need to understand what drives these low vegetable consumption figures in West Africa, because vegetables are a key element of healthy diets.
Working through food environments
Within food systems, food environments are a key stage where supply meets demand and are an under-researched aspect of food systems(Reference Turner, Aggarwal and Walls6), including in Africa(Reference Holdsworth and Landais7). The food environment as conceptualised by Turner (2018)(Reference Turner, Aggarwal and Walls6) includes key domains not directly influenced by consumers (external domains: availability, prices, and vendor and product properties and marketing of different foods) and key domains influenced by consumers’ personal characteristics (personal domains: physical accessibility, affordability, convenience and desirability of different foods), all of which reach upstream into food supply chains and downstream into food demand. Downs et al. (2020) have extended these ideas for physical food environments, further classifying built and wild/cultivated environments, and formal and informal environments where people may source their food(Reference Downs, Ahmed and Fanzo8). Food environments therefore shape food options and diets significantly, and there is a need to better understand food environments in general, and how they affect vegetables in particular, to understand how best to support increases in consumption.
Literature on the links between food environments and diets has largely focused on links between agricultural production diversity or biodiversity and dietary diversity or nutrition(Reference Frison, Cherfas and Hodgkin9,Reference Kumar, Harris and Rawat10) , or on links between consumer demand and diets or nutrition(2–Reference Afshin, Sur and Fay4,Reference Wanyama, Gödecke and Chege11–Reference Demmler, Klasen and Nzuma13) , often with little attention to the links between the external and personal domains of the food environment(Reference Timperio, Ball and Roberts14). Recent work has looked explicitly at physical food environments and diets.
Much of this work has been from higher-income countries, largely using Geographic Information System (GIS) approaches to analyse publicly available map data, or neighbourhood food outlet and consumption surveys, largely in urban areas. It has been established in these contexts that a higher density of fast food and convenience stores close to home is associated with a lower likelihood of meeting fruit and vegetable intake in Australia(Reference Timperio, Ball and Roberts14), and that a higher density of retail stores is associated with higher fruit and vegetable consumption in Brazil(Reference Curioni, Boclin and Silveira15). In general, there are more healthy options in higher-income neighbourhoods in the USA(Reference Glanz, Sallis and Saelens16), though in one UK study the most deprived urban areas had higher access to grocery stores and fresh produce(Reference Smith, Cummins and Taylor17). A higher distance to supermarkets was associated with a higher likelihood of meeting fruit and vegetable thresholds in Australia(Reference Timperio, Ball and Roberts14), and in the US study fruit and vegetable consumption was not associated with distance but with the choice to shop in a more expensive supermarket(Reference Aggarwal, Cook and Jiao18). Generally, supermarkets and medium-sized stores had a better ratio of healthy to unhealthy foods than convenience stores in the USA(Reference Glanz, Sallis and Saelens16–Reference Farley, Rice and Bodor19). Overall in higher-income countries, the physical accessibility of healthy foods including fruits and vegetables is consistently found to be a key determinant of consumption – but physical access is not only associated with closeness to home but also with other convenient daily routes such as to schools or work; and even these convenient routes might be deviated from in order to shop in more choice locations such as better supermarkets or cheaper stores(Reference Pitt, Gallegos and Comans20,Reference Turner, Green and Alae-Carew21) . These findings are context-specific, and work has not yet been done to understand the extent to which findings from high-income countries are generalisable to different contexts within low- and middle-income countries.
Studies in lower-income countries use slightly different methods, as public mapping data do not cover the range of (often informal) food outlet options, so on-the-ground neighbourhood surveys are most often used, largely in urban areas. In Africa, assessments of physical access to food outlets have shown that lower distance to the nearest shop in Malawi(Reference Thakwalakwa, Flax and Phuka22), or lower distance to a tarmac road in Kenya(Reference Keding, Kehlenbeck and Kennedy23), is associated with lower fruit consumption. The role of supermarkets might be quite different in low-income than in high-income countries, perhaps because of the demographics of who shops in these stores, with higher-income earners spending more on fruits and vegetables in supermarkets in South Africa(Reference Odunitan-Wayas, Okop and Dover24), but shopping in supermarkets is associated with a decrease in energy consumption from fruits and vegetables in towns in Kenya(Reference Demmler, Ecker and Qaim25). The role of vehicle ownership is also a confounding factor in access studies, where it is unclear if it is the facilitation of access afforded by driving, or being wealthy enough to afford a car, that drives increased fruit and vegetable consumption in these groups(Reference Okop, Ndayi and Tsolekile26,Reference Sinyolo, Ndinda and Murendo27) . Several studies in Africa have worked to understand the food environments of women or poorer populations specifically, but few went further than this in terms of looking at inequality(28).
Overall, there are many research gaps at the level of the food environments in Africa and their associations with healthy diets or vegetable intake, but there is consensus in reviews that food environments in many African contexts are rapidly changing, with mixed findings on the role of supermarketisation in providing healthy foods and the ongoing importance of wet markets(Reference Stadlmayr, Trübswasser and McMullin29). Given the overall limited evidence, particularly in low-income countries, particularly on vegetables, and particularly in West Africa, there is a need to study the food environment for vegetables for low-income populations in low-income countries. This study aimed to understand the availability of vegetables around schools in urban areas of Benin and Mali, as well as describe other aspects of the food environment.
Methods
Study design
This study used neighbourhood surveys of food outlets around schools in urban areas of Benin and Mali to understand food environments as defined by Turner and Downs(Reference Turner, Aggarwal and Walls6,Reference Downs, Ahmed and Fanzo8) . We looked at physical availability of vegetables in general, and traditional African vegetables (TAV) in particular, and distance to vegetables for different neighbourhoods. We also looked at other aspects of the food environment, including the types of outlets and whether they were formal/informal and built/cultivated, and aspects of cost, promotion, freshness and convenience to understand external domains of the vegetable food environment. The focus was on the most marginalised neighbourhoods, based on income and access to services(Reference Nisbett, Harris and Backholer30). Methods were based on a review of other physical food environment studies, including those using GIS methods(Reference Timperio, Ball and Roberts14,Reference Glanz, Sallis and Saelens16,Reference Cobb, Appel and Franco31) . We asked: What characterises the food environment, particularly vegetable availability, in low-income neighbourhoods in urban Mali and Benin?
Study area
This work was undertaken in the capital city and second most populous city in each country – the combined urbanisation of Cotonou and Porto-Novo, and Parakou, in Benin, and Bamako and Sikasso in Mali (n 5 cities, as Cotonou and Porto-Novo are a combined urbanisation, but we report them separately here). Within these cities, we were particularly interested in low-income neighbourhoods to understand food options for the poorest and most marginalised populations. We purposively selected five neighbourhoods (‘quartiers’) within each city to represent as much as possible different population groups with an equity lens.
Sampling
Neighbourhoods and schools
Neighbourhoods were selected based on (1) the most densely populated neighbourhoods by census data, as a proxy for low income (though acknowledging that most neighbourhoods in these cities are mixed income to some extent), and (2) discussions with local officials to identify the most marginalised neighbourhoods among these. Local officials also identified the main school in each neighbourhood.
Food outlets and foods
Within each neighbourhood, the main public primary school was selected as the starting point for sampling, as a common institution occurring within most neighbourhoods where most households would have to pass multiple times per week (considering physical convenience for shopping) and where children spend most of their time during the day. While we were not specifically aiming to understand children’s access to vegetables, local knowledge suggests that schools are a hub for families with young children and that families might undertake some of their food shopping in such a regular location. All food outlets and food acquisition options (including wild or cultivated spaces) within a 1 km radius (about 15 min walking for a shopper) of these starting points were surveyed in a census fashion, with enumerators walking systematically along neighbourhood streets (guided by Google Maps, supplemented by taking unmarked trails and streets) until the entire neighbourhood within 1 km of the starting point was covered.
This project was part of a much larger study that was particularly interested in understanding the food systems for three global vegetables (onion, tomato and hot pepper) and three TAV (amaranth, okra and jute mallow), within other vegetables and other foods in the food system. At points in this paper, more in-depth data are provided on these targeted vegetables, as sentinel vegetables in the West African context.
Data collection
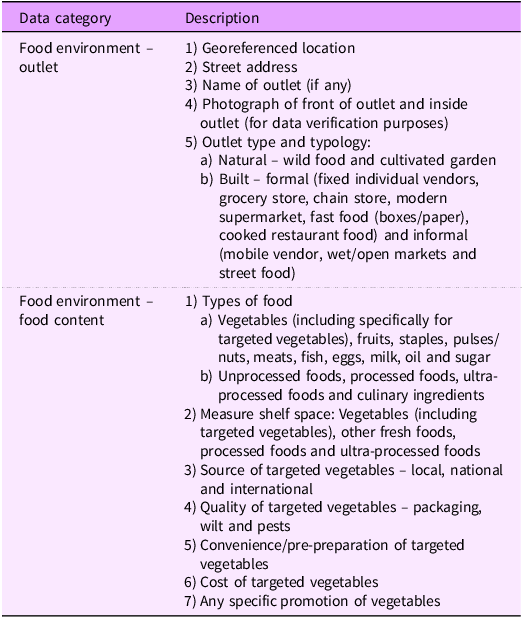
Data collection was undertaken from February to April 2022 by five enumerators studying for master’s degrees in nutrition in universities in Mali and Benin. Enumerators used tablets enabled with KOBOcollect software to digitally collect data. At each outlet, a georeferenced coordinate was taken to store the location, and then the following details were collected (Table 1). Some data were possible to collect publicly (from the street); for other data, an informed consent process was undertaken with the owner/manager/vendor themselves, and data collection was not undertaken for any items where consent was not given.
Data collected in the neighbourhood survey

Analysis
Data were downloaded into Excel for processing. Data were checked, and outliers were checked with enumerators and dropped if necessary. The study used descriptive summaries to analyse data per neighbourhood, city and country, and findings were reported at the level appropriate for the analysis (usually city level). We created equal-distance buffers using the starting points of the schools. The buffer rings started from 250 m, and the most distant one is 1 km. We counted the number of food outlets in each buffer ring and calculated the ratio of outlets that sell vegetables. All geospatial analyses were done in Quantum Geographic Information System (QGIS).
Analyses allowed the following assessments to be made:
-
1) Number and type of outlets per neighbourhood
-
2) Typologies of outlets (wild/cultivated/built and formal/informal) by neighbourhood
-
3) Types of foods and types of vegetables available per neighbourhood
-
4) Source, quality and cost of vegetables available
-
5) Convenience or promotion of vegetables
-
6) Ratios of shelf space: vegetable: non-vegetable; unprocessed: processed: ultra-processed
-
7) Average distance from school (starting point) to vegetable outlets in different neighbourhoods
-
8) Concentration of outlets
Results
What types of food outlets are available in the food environments of different neighbourhoods?
Number and location of outlets
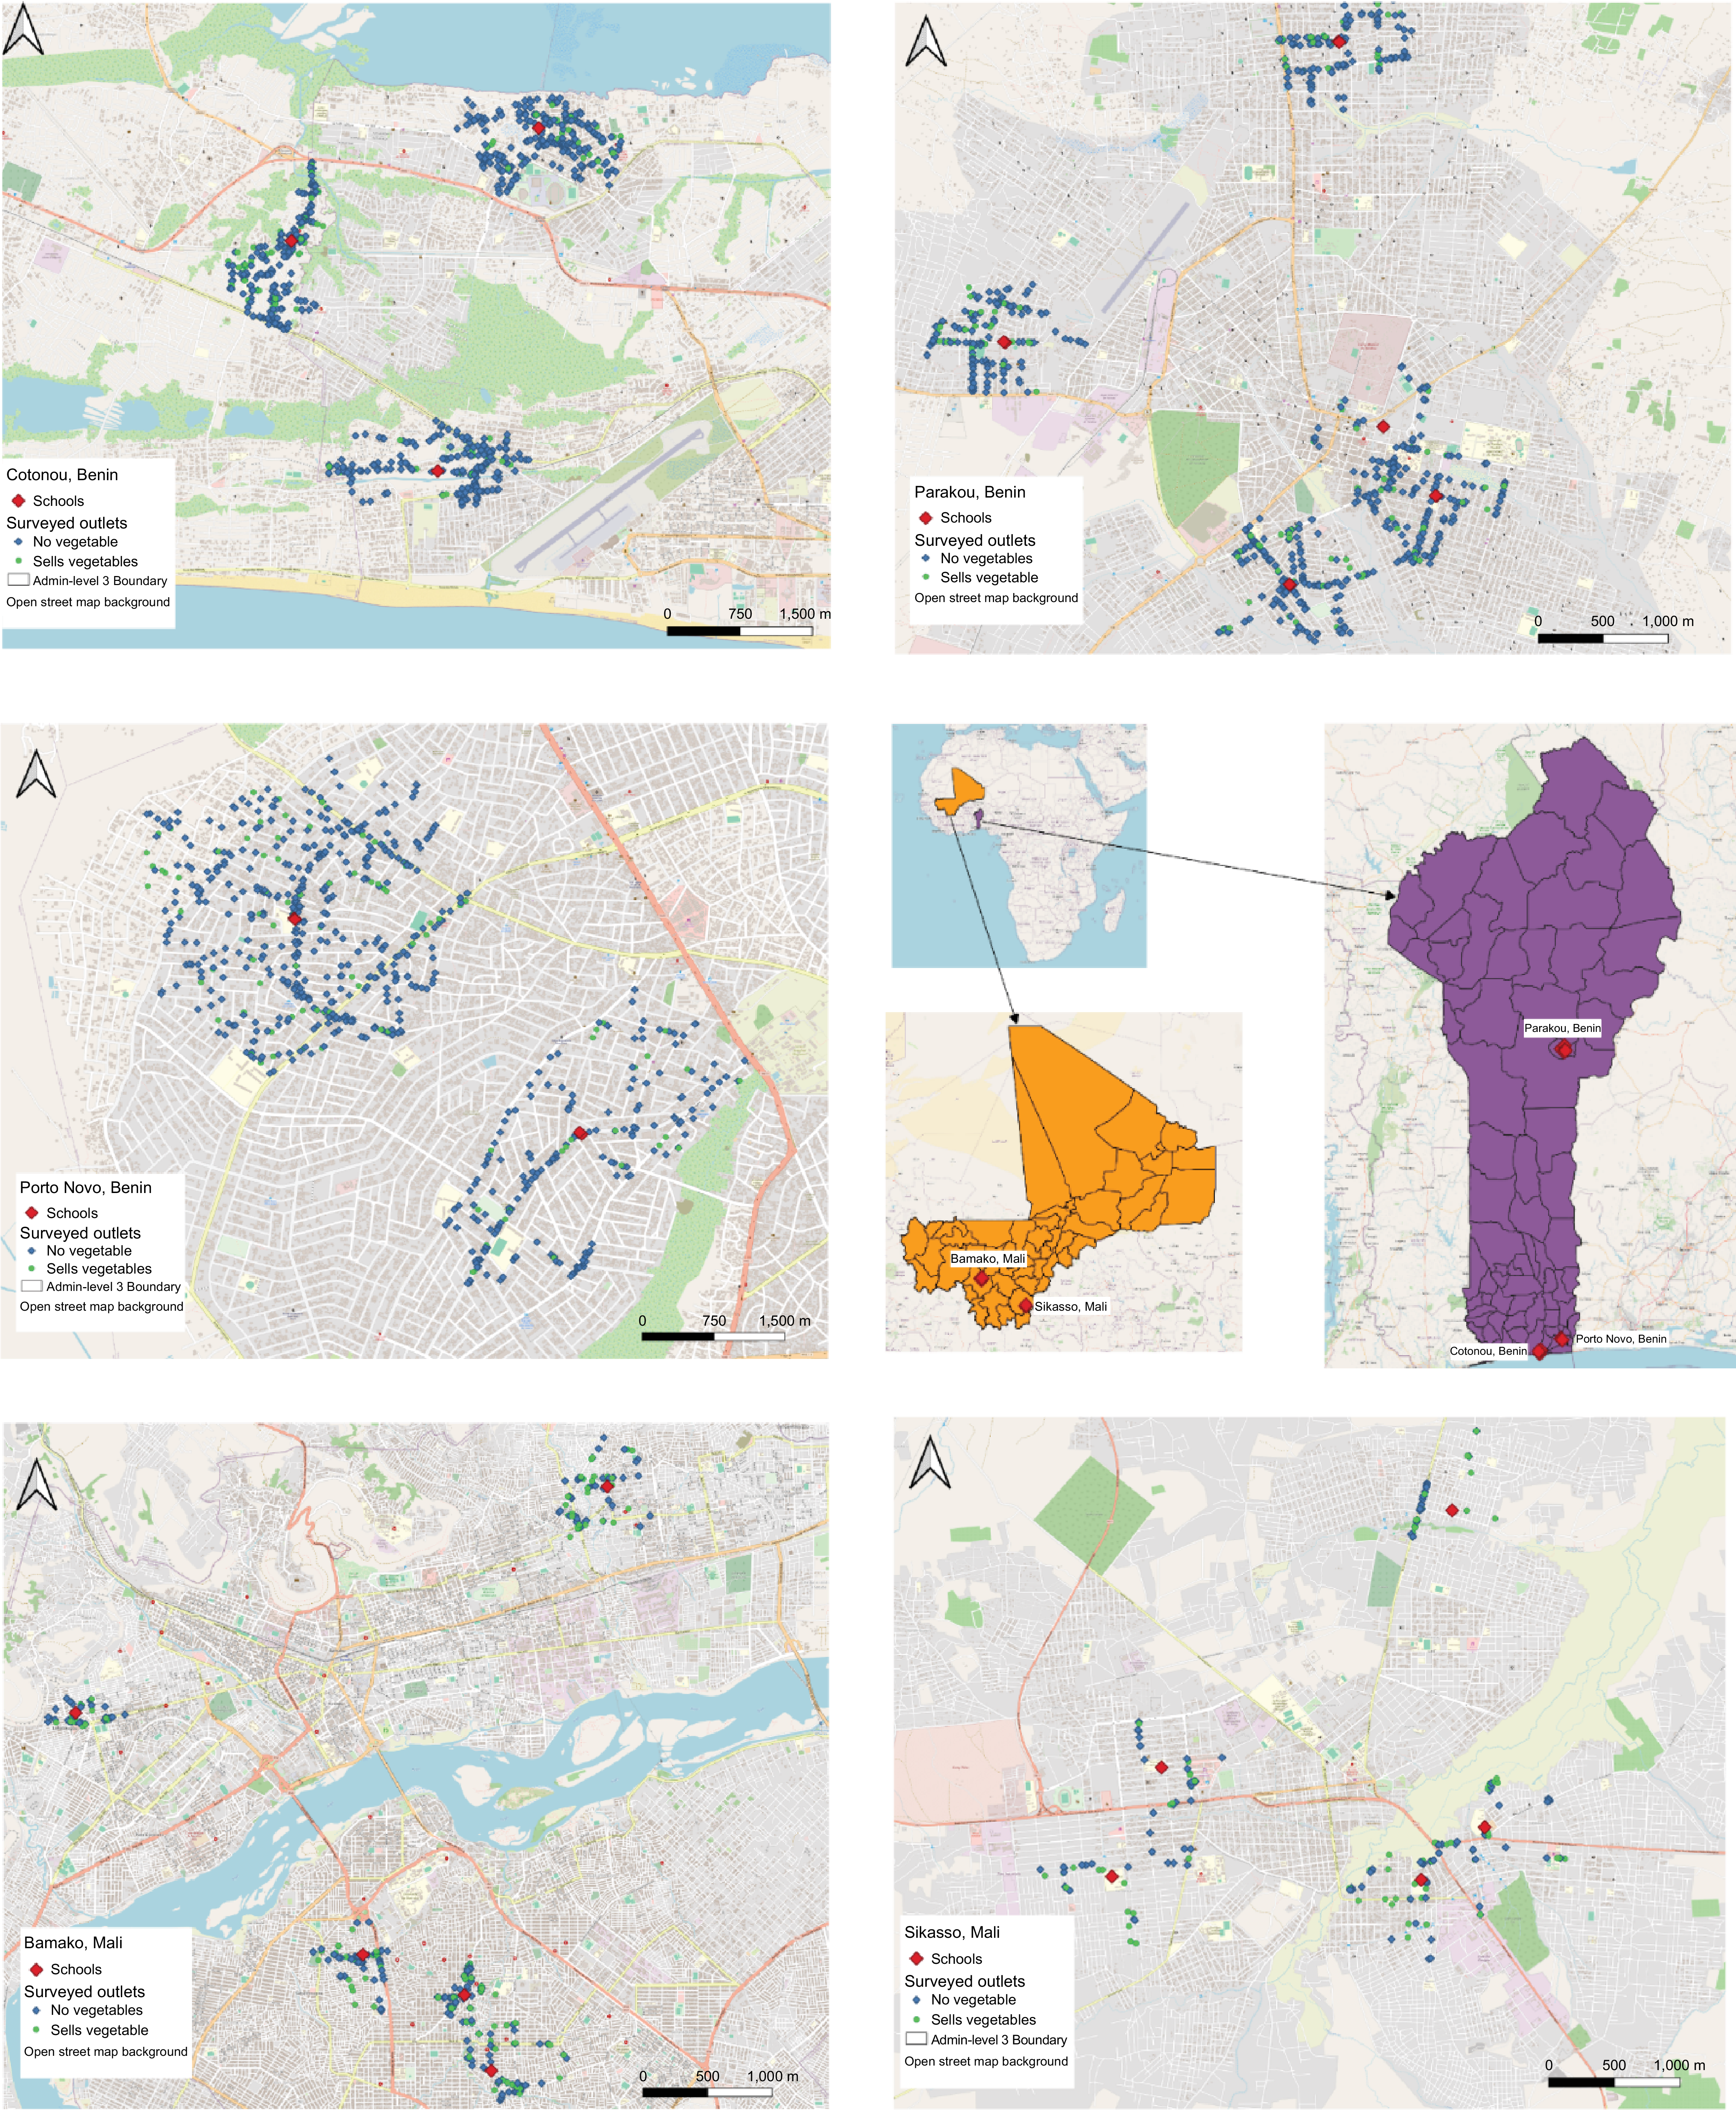
A total of 3798 food outlets were sampled in the twenty neighbourhoods across five cities in the two countries. This included 3105 outlets in Benin (919 in Cotonou, 1194 in Porto-Novo and 992 in Parakou) and 693 in Mali (469 in Bamako and 224 in Sikasso). Figure 1 shows the locations of the cities within countries, neighbourhoods within cities and outlets within neighbourhoods. Outlets in Mali were both fewer in number and less densely concentrated than in Benin.
Locations of cities, neighbourhoods and outlets in the study areas.

Types of outlets
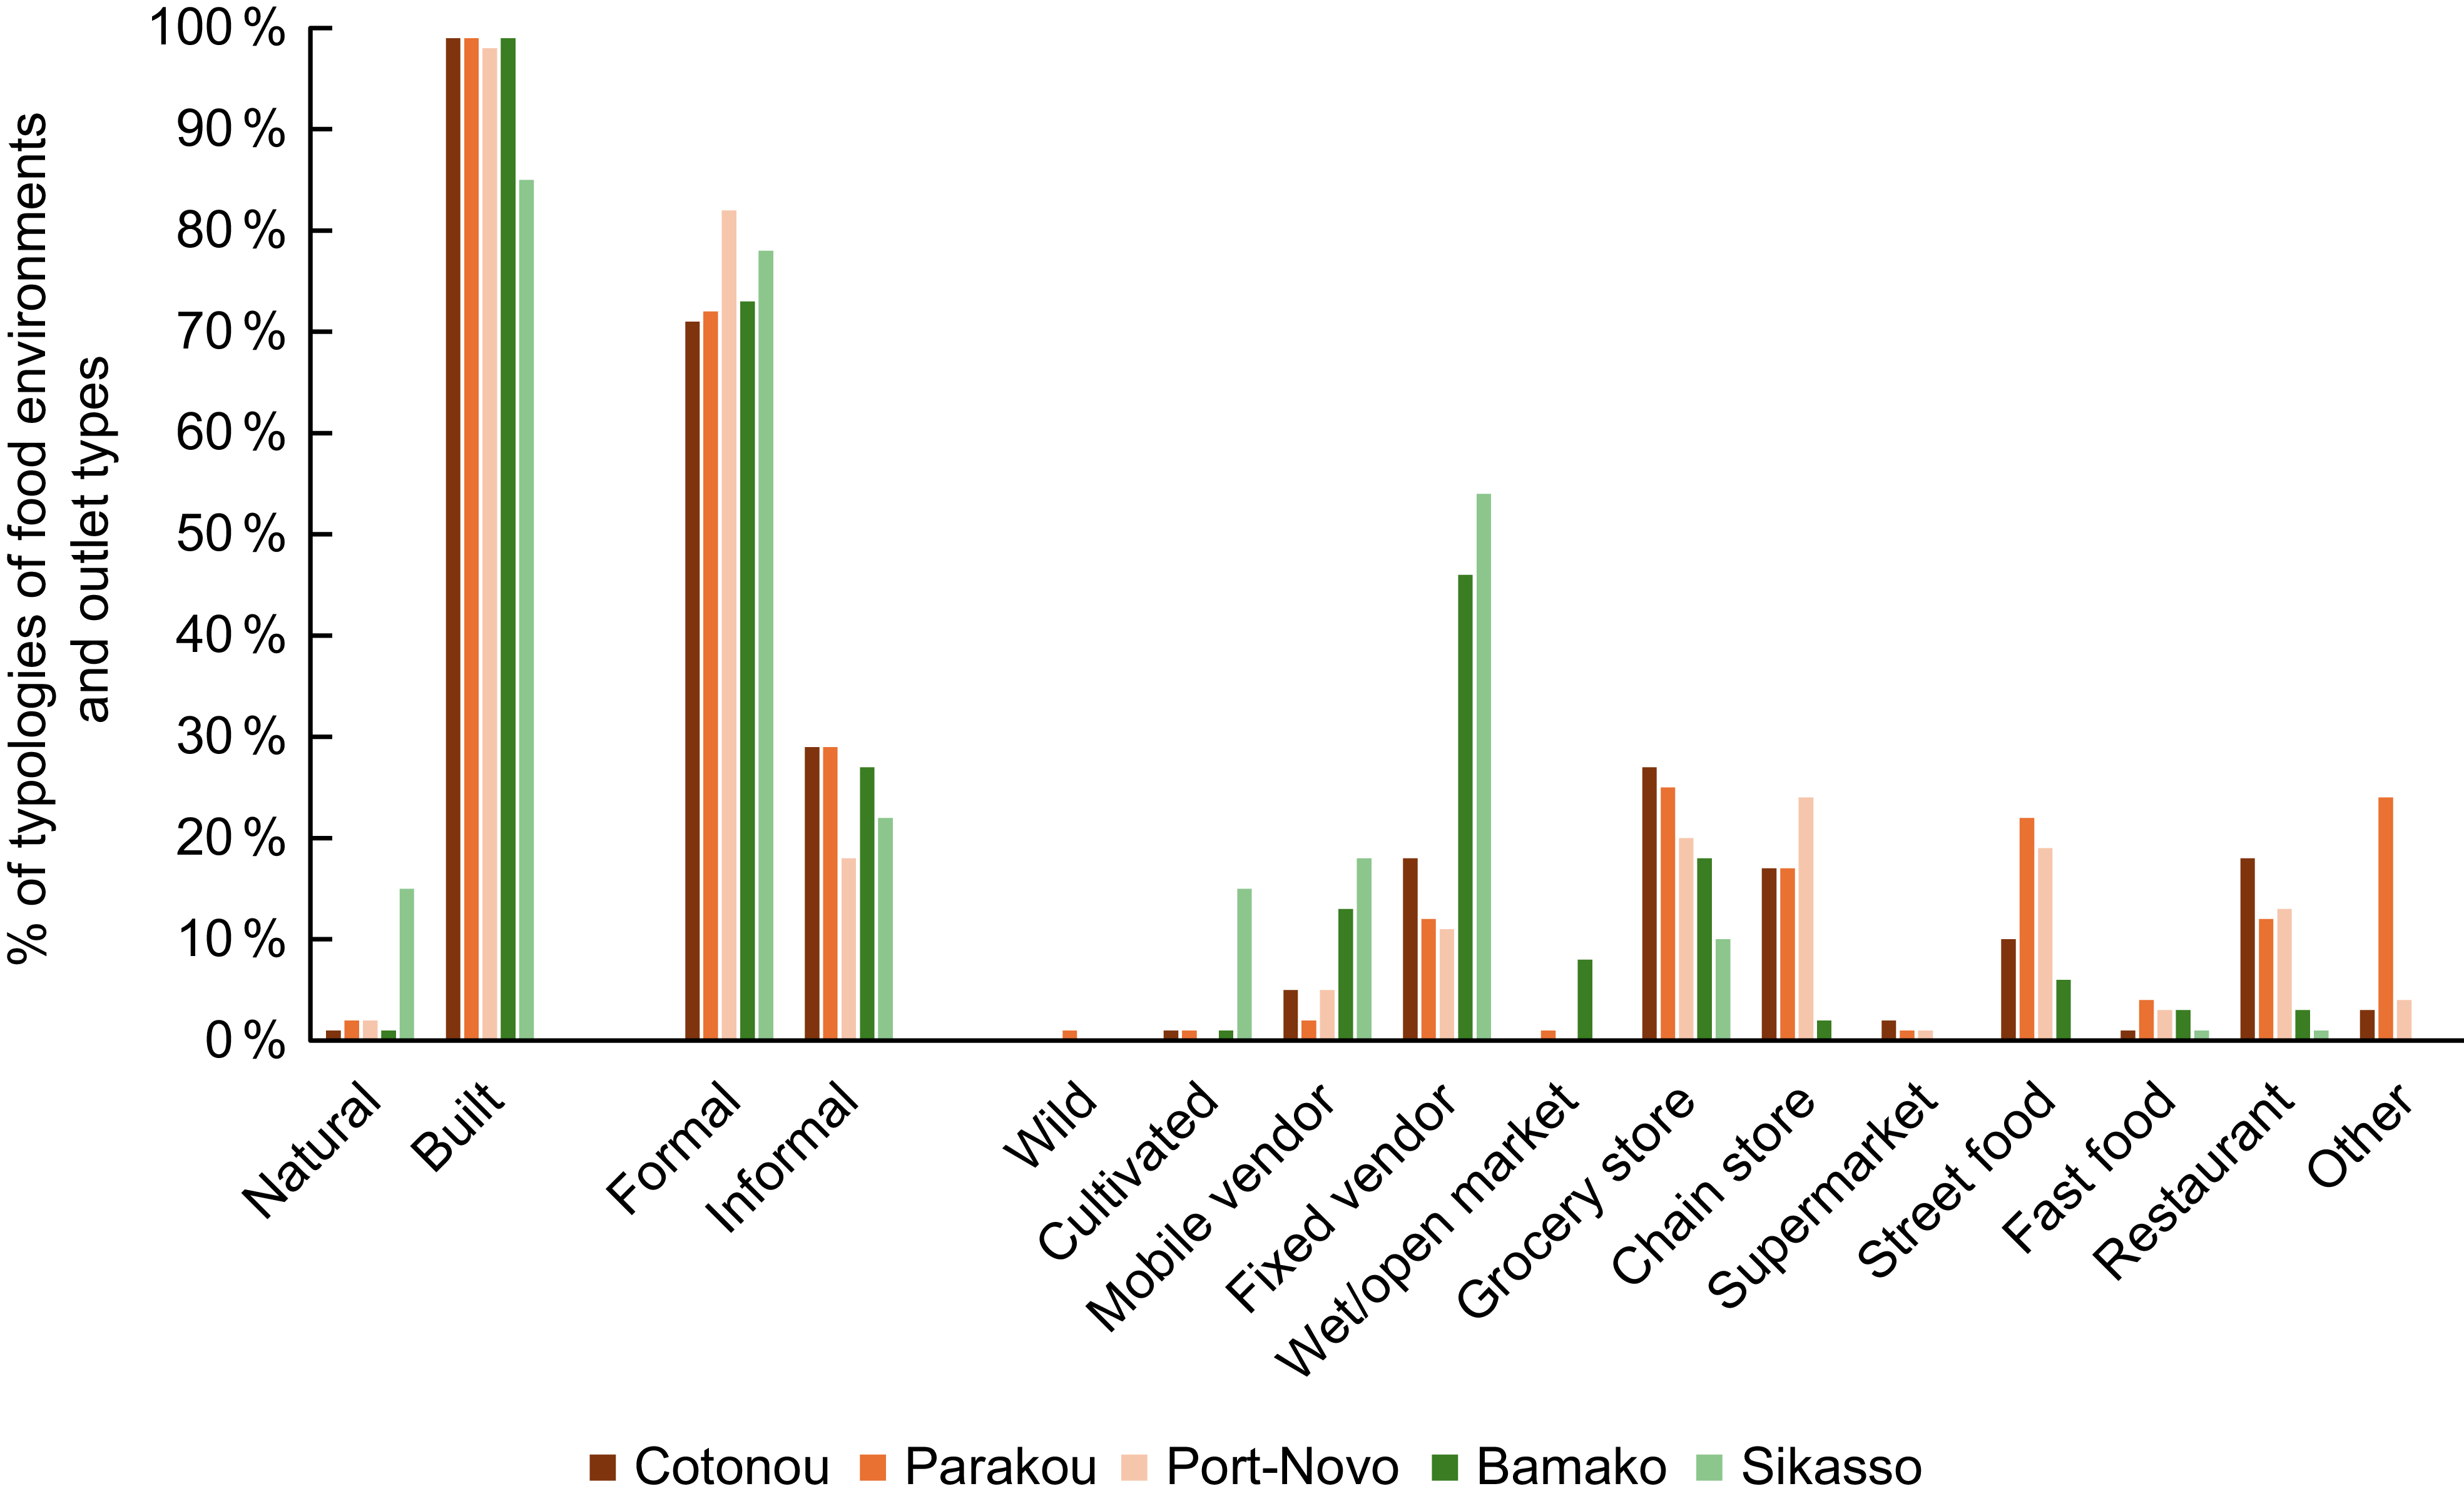
The most common type of outlet at country level is grocery stores (23·6 %) in Benin and fixed vendors (48·6 %) in Mali, while the least-recorded outlet at country level is wet/open markets (0·3 %) in Benin and supermarkets (0·3 %) in Mali (Figure 2). It should be noted that each of these least-recorded outlet types tends to serve a large geographic area, so it is likely that they fell outside of our sampled areas.
Typologies of food environments v. outlet types across cities in Mali and Benin.

In Benin, eleven types of outlets were found, which included grocery stores (23·6 %), chain stores (19·2 %), street food (17·3 %), fixed vendors (13 %), restaurants (13·9 %), mobile vendors (4·2 %), fast-food restaurants (3 %), supermarkets (1 %), urban garden (0·8 %), wild food (0·5 %), wet/open markets (0·3 %) and others (3·3 %).
In Mali, ten types of outlets were found, which included fixed vendors (48·6 %), grocery stores (15·7 %), mobile vendors (14·7 %), urban gardens (5·5 %), wet/open markets (5·1 %), street food (3·9 %), fast-food restaurants (2·5 %), restaurants (2·2 %), chain stores (1·3 %), supermarkets (0·1 %) and others (0·1 %). No wild food sources were found in Mali cities.
Typologies of outlets
A majority of outlets in all cities are built outlets, comprising shops and restaurants of many different types. Cultivated food environments, specifically urban gardens, were the largest category of natural food environment in both countries, at city and neighbourhood levels, while food in the wild was absent in Mali at all levels. Sikasso had a notably higher level of cultivated food environment of the five cities, at 14·8 %, while the other cities had less than 2 % cultivated food environments (Figure 2).
Formal markets made up the largest percentage of built food environments at both national and city levels in Benin. Within formal markets, fixed stores formed the largest percentage of the built food environments in Mali at national and city levels, while in Benin, grocery stores were the most at the national level and varied with chain stores at the neighbourhood level. Under the informal markets category, street-food outlets made up the largest percentage in Benin at national and neighbourhood levels, while mobile vendors made up the largest category in Mali at both national and neighbourhood levels.
What characterises different food outlets in terms of food profiles available?
Foods available
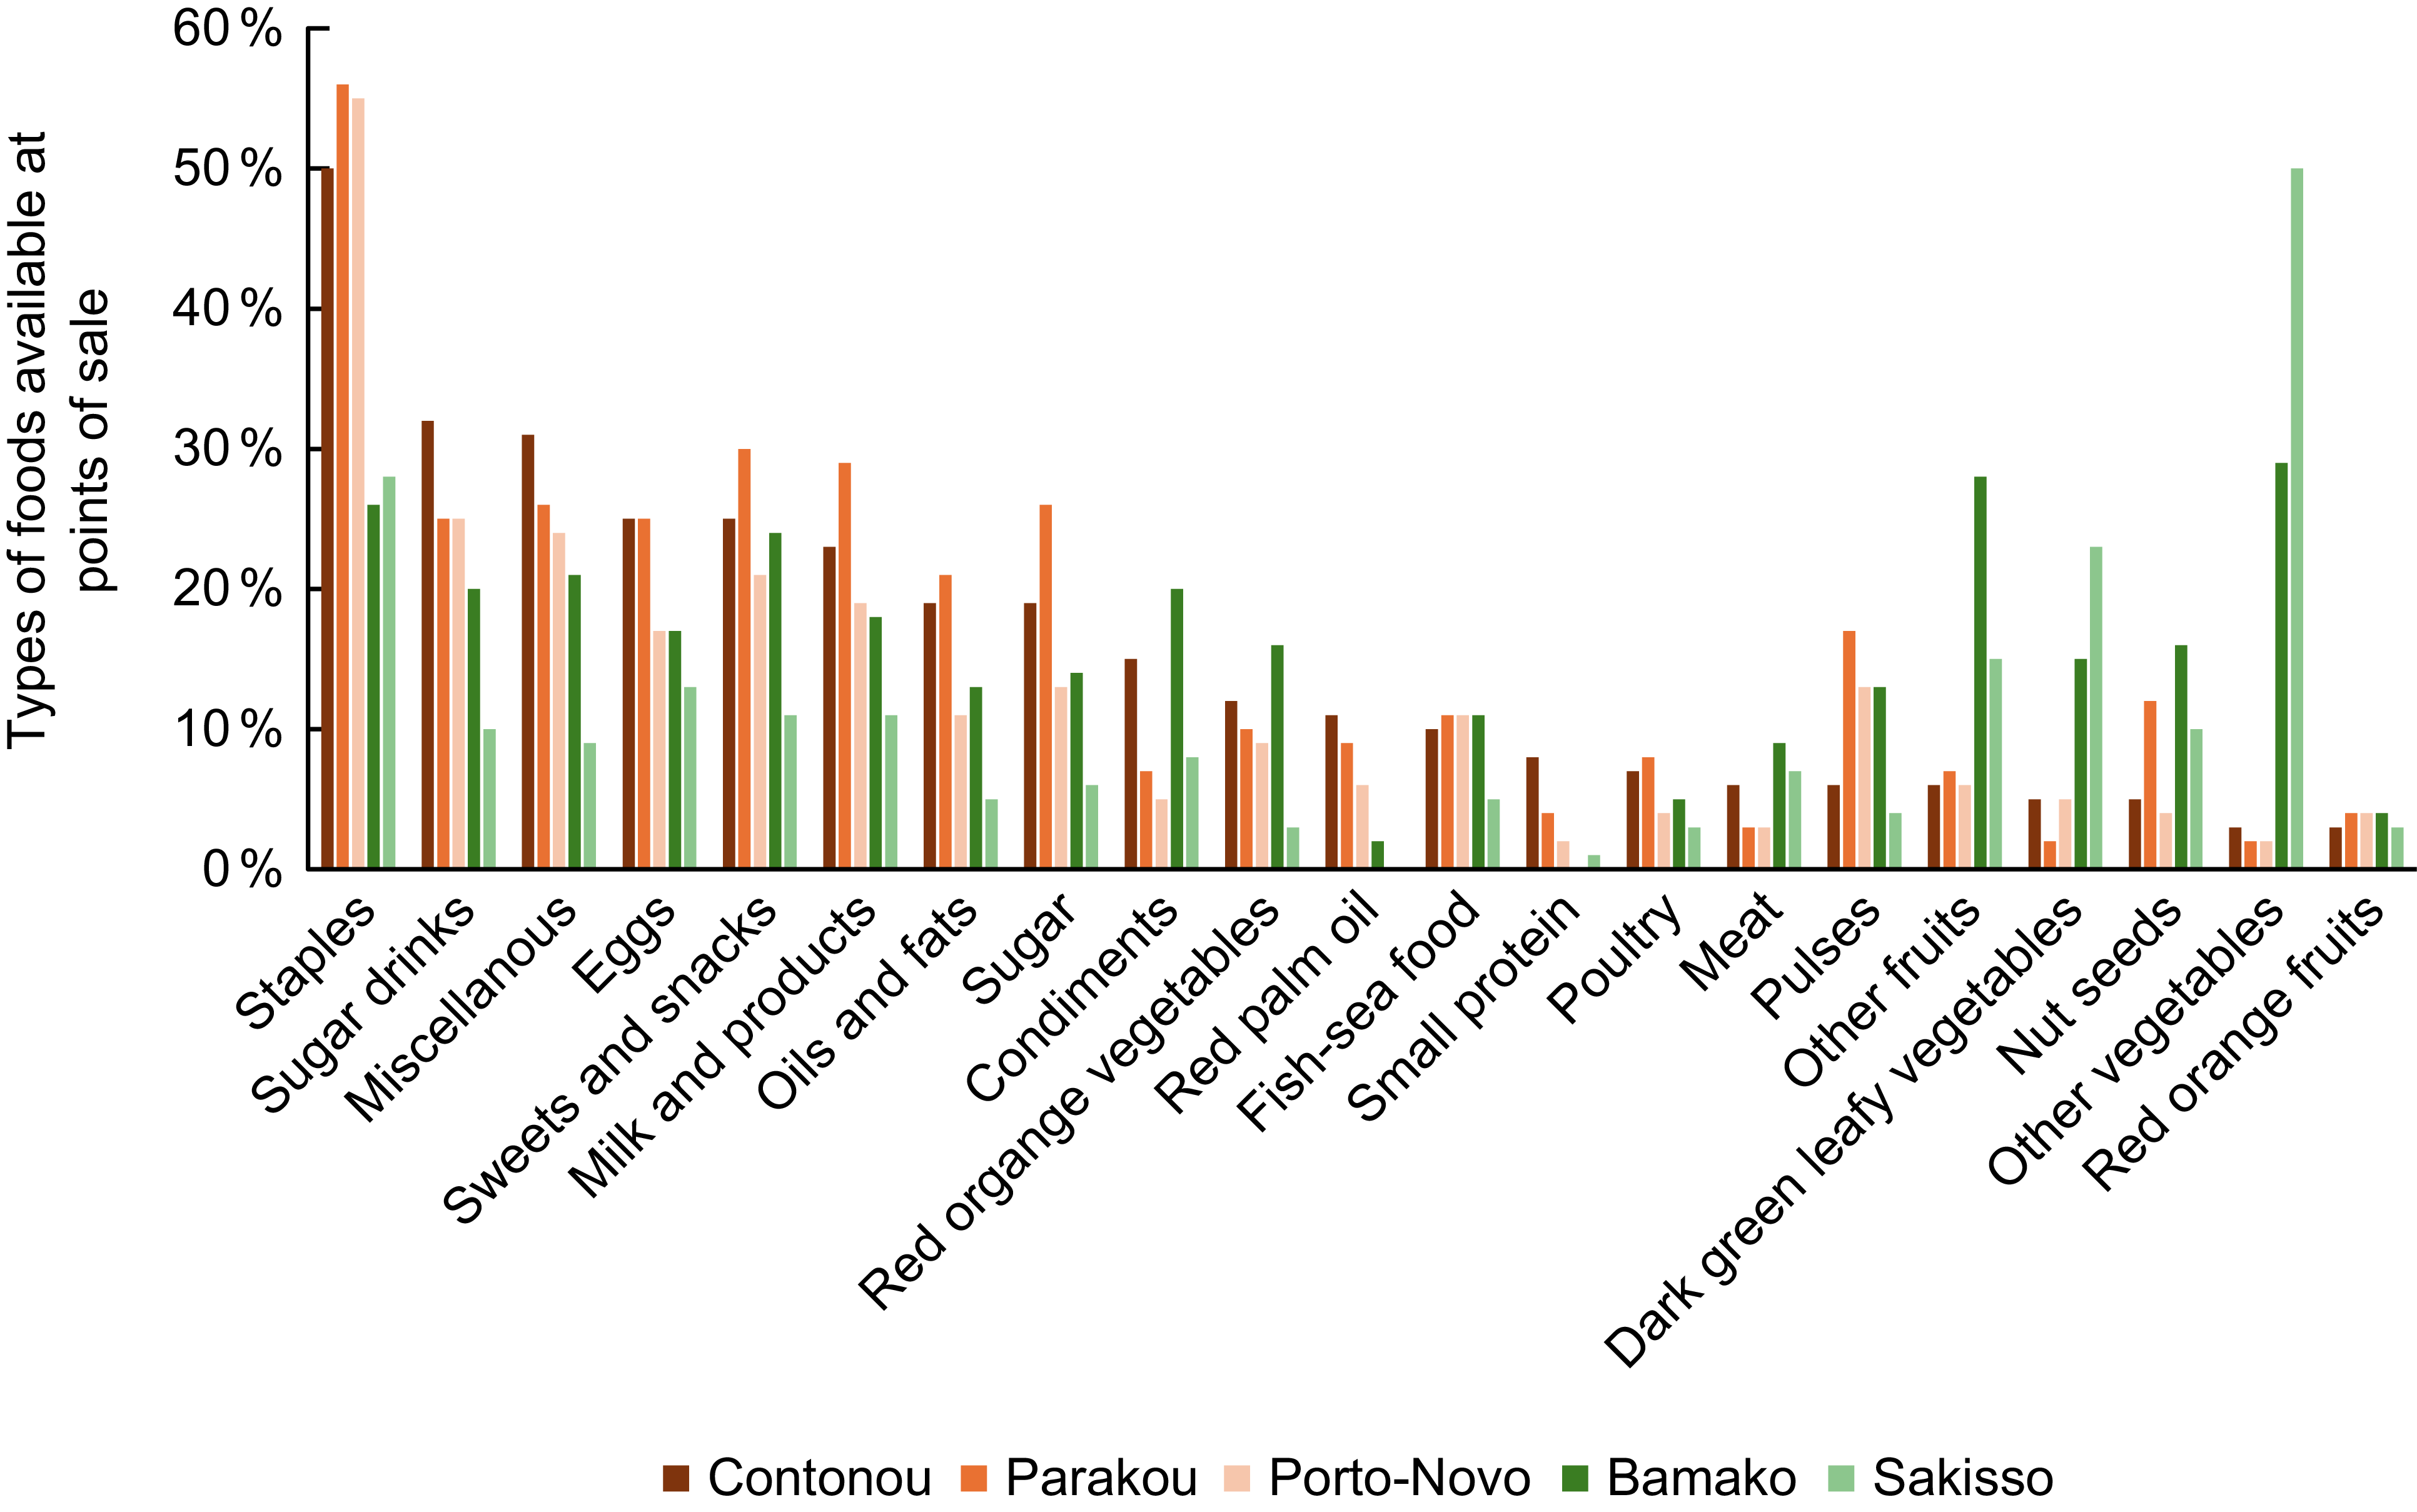
Staple foods make up the largest portion of foods sold in outlets at national and city levels in Benin, while ‘other vegetables’ form the largest portion in Mali at both national and city levels. Fruits and vegetables are sold in a higher proportion of outlets in Mali than in Benin, where they are among the least sold food items in all outlets at all levels (Figure 3).
Types of foods sold at outlets across five cities in Mali and Benin.

A wide range of vegetables are sold in these outlets (figure available on request). In Benin, between 14 and 23 % of outlets across the different cities sold our targeted global vegetables (hot pepper, onion or tomato); between 4 and 10 % of outlets sold our targeted TAV (okra, amaranth and jute mallow); and between 59 and 74 % of outlets sold other vegetables that we did not categorise. In Mali, our targeted vegetables were more common, and the range of vegetables was slightly smaller: between 28 and 41 % of outlets sold the global vegetables, 7 % of outlets sold the TAV and between 53 and 56 % of outlets sold other non-categorised vegetables.
Targeted vegetables in Benin were largely sold at modern retail stores – grocery stores, fixed vendors and chain stores, respectively – while in Mali, the points of sale were more focused on traditional outlets – mobile vendors, wet/open markets and street food.
Space dedicated to different foods
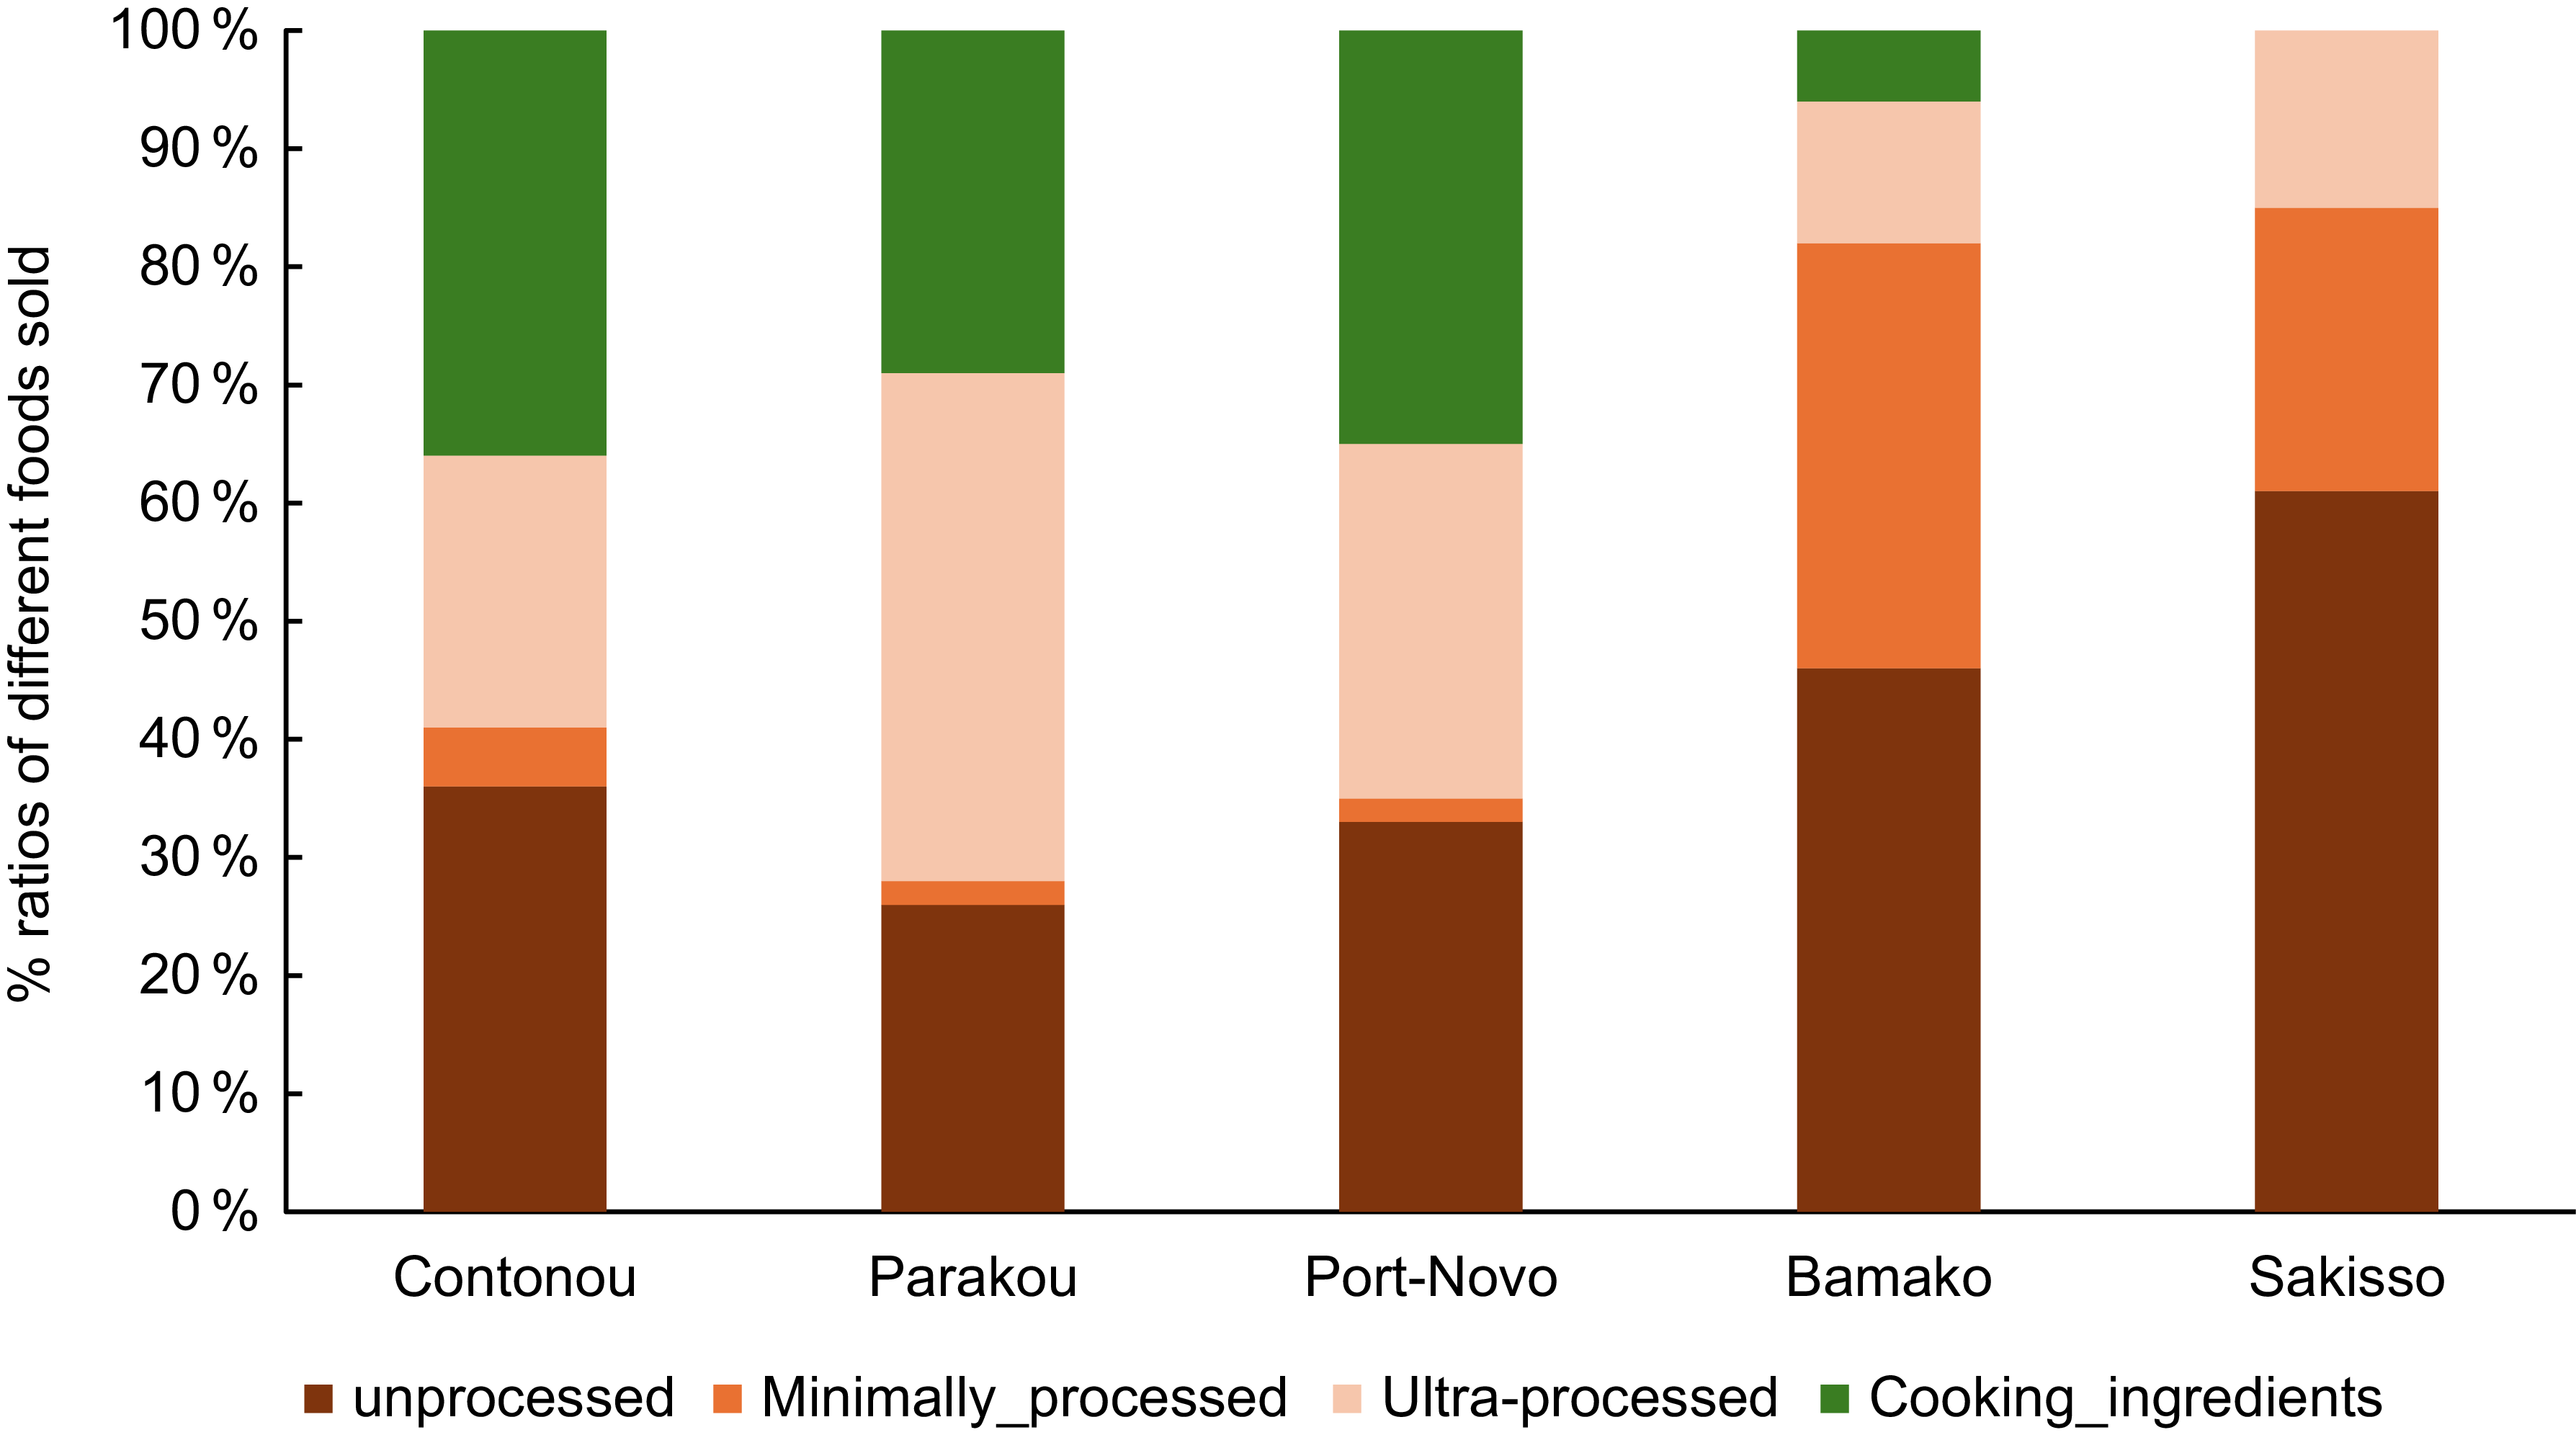
The ratio of (shelf) space for unprocessed foods compared to minimally or ultra-processed foods(Reference Monteiro, Cannon and Levy32) was highest in Mali at 51 %, compared to Benin at 32 % (Figure 4). Minimally processed foods had the least ratio in Benin, while culinary ingredients and ultra-processed foods had the least ratio in Mali, and these were largely. Grocery stores provided the largest shelf space compared to other outlets for various food types in Benin, while in Mali this was provided by fixed stores.
Ratio of raw foods: minimally processed foods: ultra-processed foods: cooking ingredients in Benin and Mali.

The largest (shelf) space dedicated to our targeted vegetables was found in urban gardens and wet/open markets in both countries. Onions and jute mallow occupied the largest shelf space ratio overall across the two countries. Targeted vegetables were absent in the wild in urban settings in both countries and also in supermarkets and fast-food outlets in Benin.
In Benin, jute mallow occupied the largest (shelf) space ratio overall. Onions and tomatoes occupied the largest shelf space at wet/open markets, while amaranth, jute mallow and okra occupied the largest shelf space in urban gardens. In Mali onions, tomatoes, amaranth and jute mallow occupied the largest shelf space in urban gardens. Hot peppers occupied the largest shelf space in supermarkets, and okra occupied the largest shelf space in wet/open markets (figure available on request).
Quality, convenience, source and promotion
In terms of quality, more than 50 % of all targeted vegetables were found in their fresh-clean form in both countries at both national and city levels, except for jute mallow and okra in Mali, where more than 70 % were found in other forms (dried). Fresh-clean vegetables were largely found in formal markets (grocery and fixed stores) in Benin and more in informal markets in Mali on top of fixed stores at all levels (figure available on request).
In terms of source, in Benin, more than 50 % of each of the targeted vegetables were sourced locally at both national and city levels with the exception of one city (Cotonou) where more than 50 % of the vegetables are sourced nationally. In Mali, more than 50 % of hot peppers, amaranth and jute mallow were sourced locally. However, a substantial amount of onions, tomatoes, hot peppers, okra and amaranth in both Bamako and Sikasso were sourced internationally with onions at 43 %, 29 %, 14·7 %, 16 % and 10·5 %, respectively (figure available on request).
Visual and verbal promotions were the most used forms of promotion regardless of the type of outlet in both countries. In Benin, more than 60 % of all targeted vegetables were promoted through visual advertising, while in Mali vegetables were promoted in almost equal proportions between visual and verbal advertising (figure available on request).
Some vegetables are pre-processed in some form for convenience or storage. More than 50 % of all vegetables were found in their raw form in both countries and at the neighbourhood level, except for okra and hot peppers in Mali which had more than 50 % in dried form (figure available on request).
How can populations in different places access different foods?
Below, we contrast the sampled marginalised urban contexts in Mali and Benin in terms of types of outlets and vegetables, quality and price, and distance and concentration of outlets. While it is not possible to generalise our findings to all urban contexts in the two countries, our careful geographic sampling based on the marginalisation of the areas suggests that our findings may be representative of similar neighbourhoods throughout the two countries.
Types of outlets and vegetables
There were fewer outlets per sampled area in the Mali contexts overall. We find that while fixed vendors outside of markets or shops, and general grocery stores, are common in these contexts in both countries, Benin’s physical food environment is skewed towards more modern retail (stores and supermarkets) than Mali’s, but Benin also has more wild food sources around the cities. Both countries rely on a few wet markets. While Sikasso city in Mali had notably more natural food environments, all were cultivated, and neither city had any wild food environments in the survey areas, although this cannot be generalised to the whole country.
With regard to types of vegetables found at points of sale, Benin had a wider range of vegetables sold at national and city levels of which non-targeted vegetables formed the largest percentage compared to the global targeted vegetables. Mali had a smaller range of non-targeted vegetables and a larger focus on the global vegetables compared to Benin, at both national and city levels (figure available on request).
Quality and price
In terms of quality of vegetables, more than 50 % of all vegetables surveyed at points of sale were found in observably fresh and clean form at both national and city levels in both countries. There were more non-fresh vegetables found in Benin than in Mali, with more than 10 % of each targeted vegetable in Benin found to not be fresh. Mali had more vegetables which were either dried or concentrated, at more than 15 % of each vegetable.
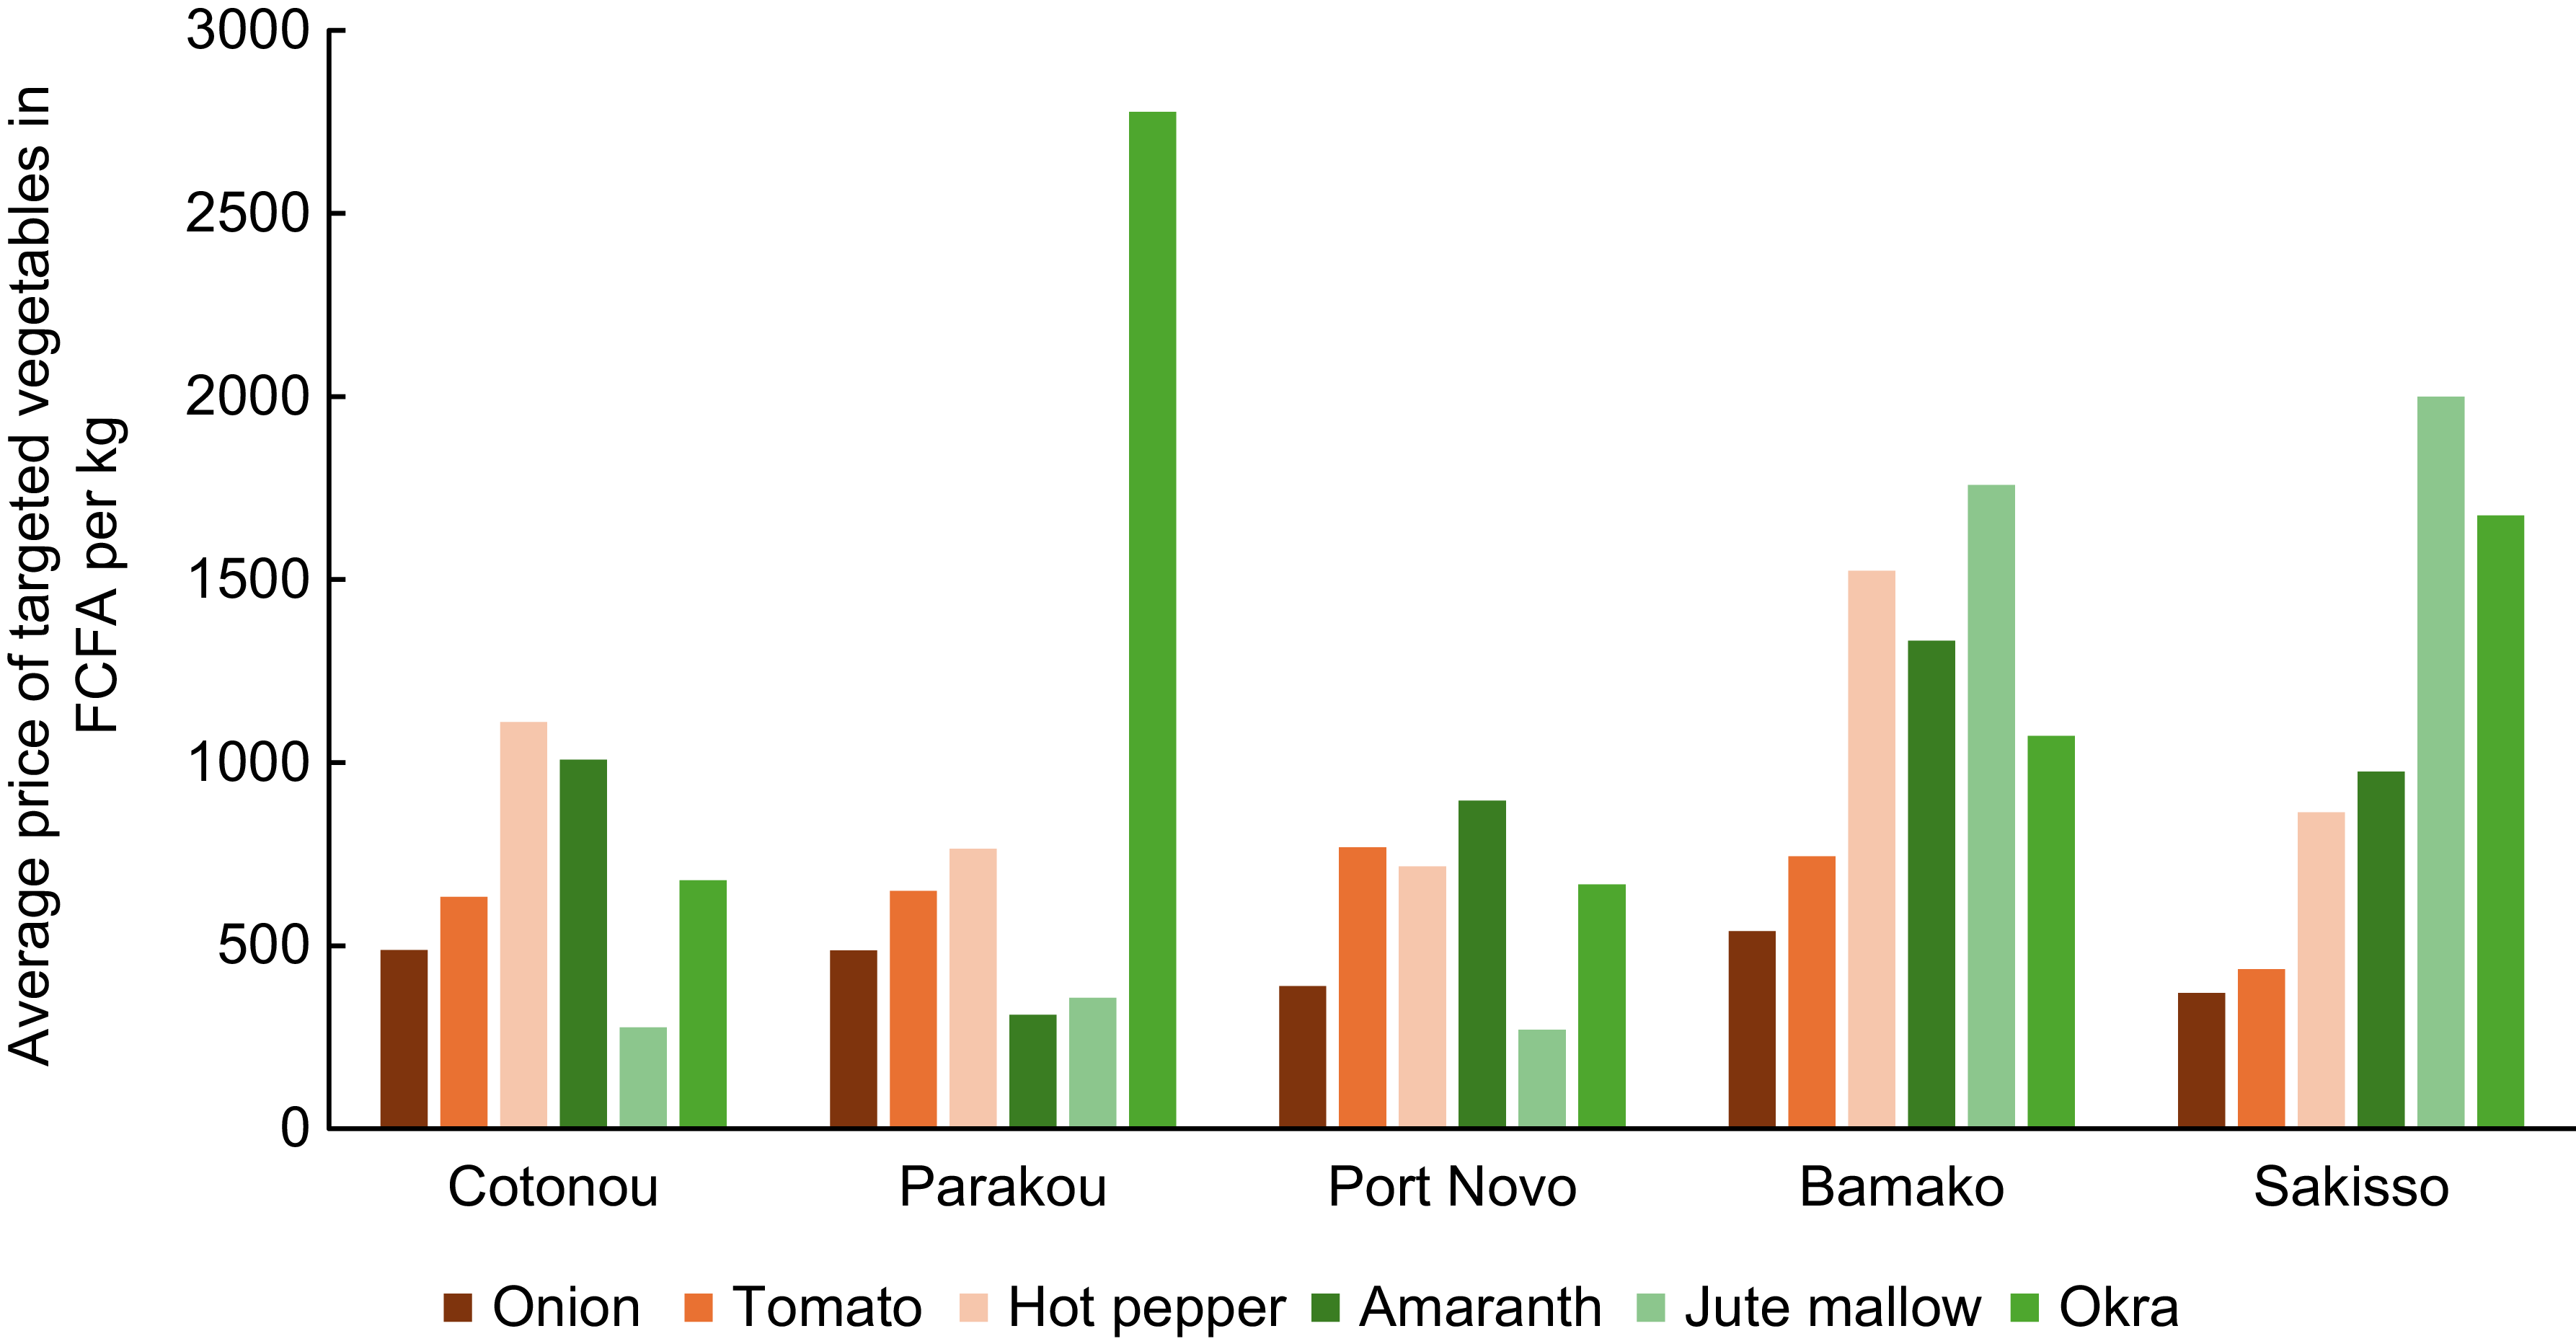
Targeted vegetables were in general cheaper in Benin than in Mali; in Mali, the TAV were more expensive per kg than the global vegetables (Figure 5). The overall average cost of vegetables in Mali was cheaper in Sikasso compared to Bamako, although vegetables could be found at more points of sale in Bamako compared to Sikasso. The prices of onions and tomatoes were cheapest at urban gardens, mobile vendors, fixed vendors and wet/open markets compared to other points of sale across both cities.
Average price of targeted vegetables in West African CFA franc (FCFA) per kg.

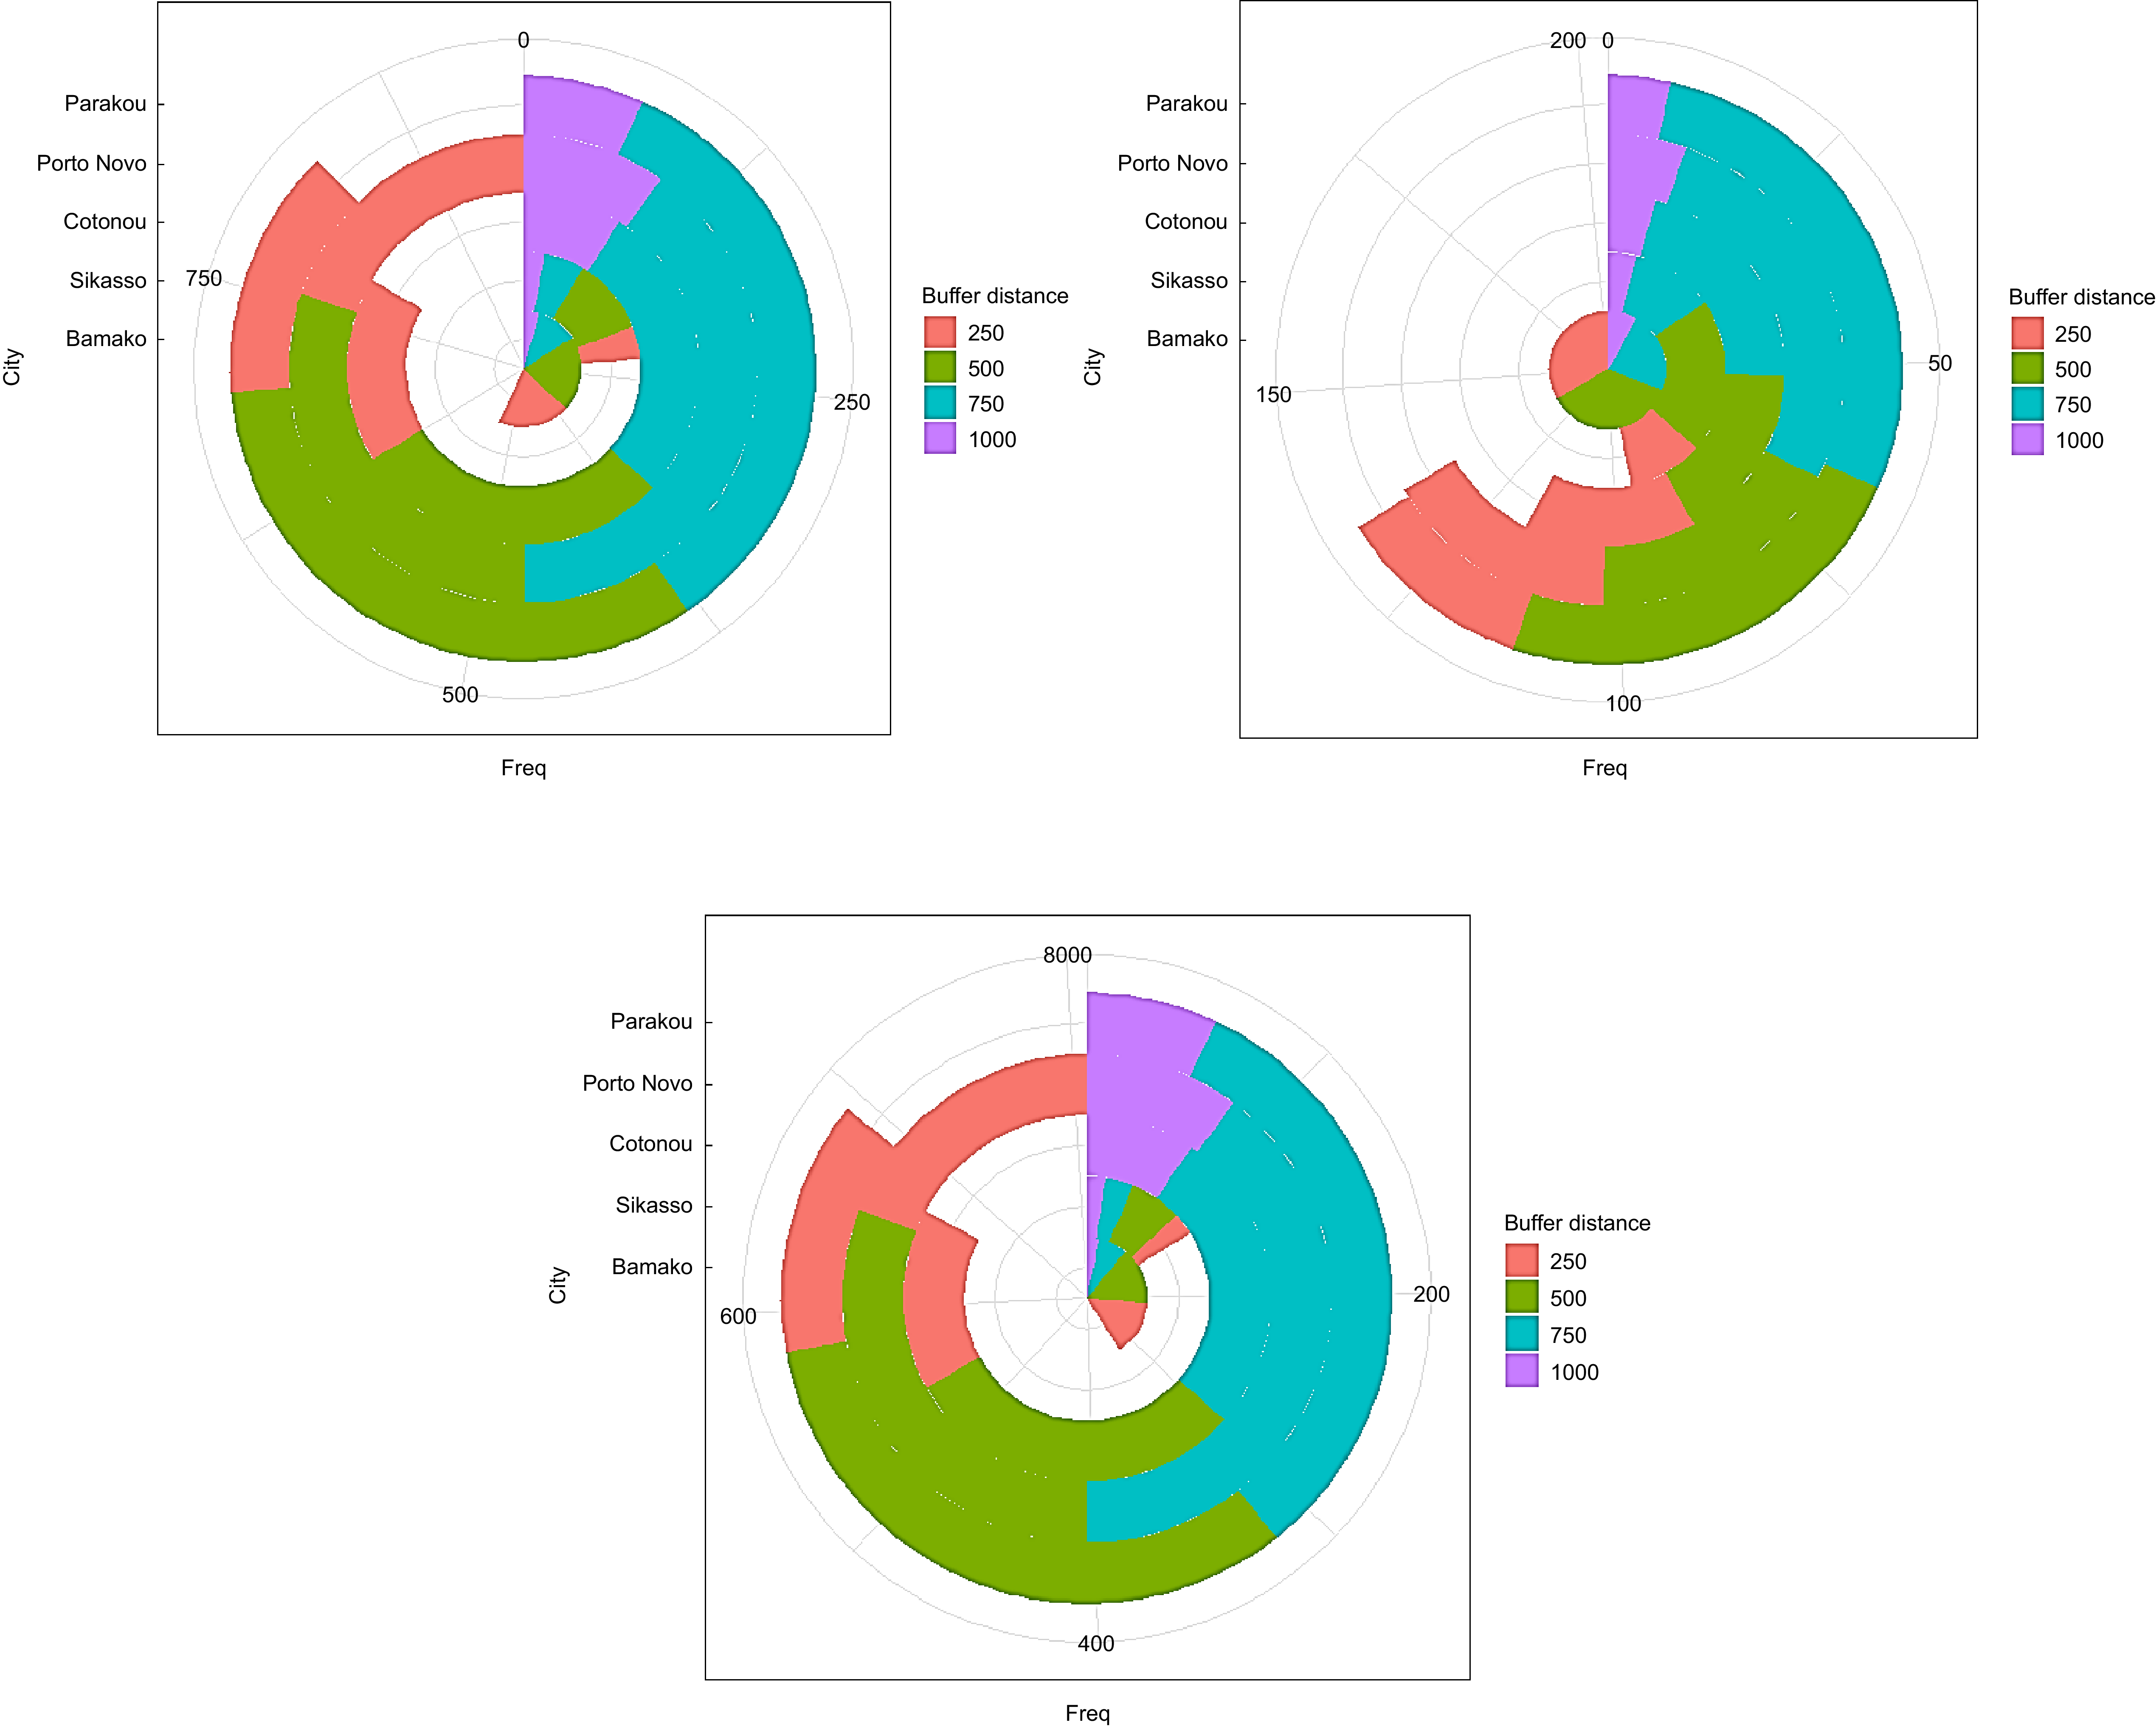
Distance and concentration of outlets
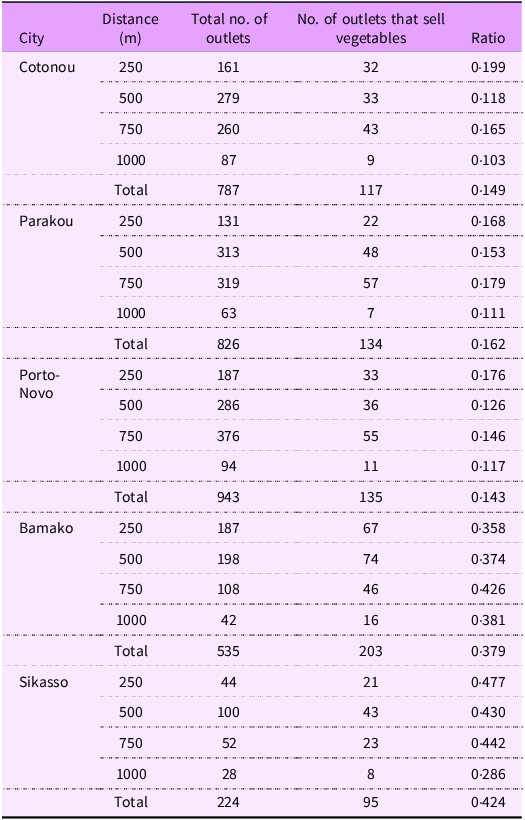
For each city, buffers were created with a radius of 250 m, 500 m, 750 m and 1000 m from the starting point, and the number of outlets within those distances were calculated (Table 2). In general, outlets were less concentrated in cities in Mali than in Benin, within 1 km of schools in low-income neighbourhoods. For example (Figure 6), in Sikasso, Mali, a total of 224 outlets were found around the five surveyed schools; in comparison, 943 outlets were found in the 1 km buffer in Porto-Novo, Benin. However, more outlets in Mali sell vegetables than outlets in Benin (Table 2). Less than 20 % of the outlets around schools in the three cities in Benin sell vegetables. The patterns are consistent across the distance and across the three cities. In Mali, although the overall number of outlets is lower, around 40 % of these outlets sell vegetables.
Distance from school (starting point) to outlets that sell vegetables

Concentration of outlets at city level in Mali and Benin.

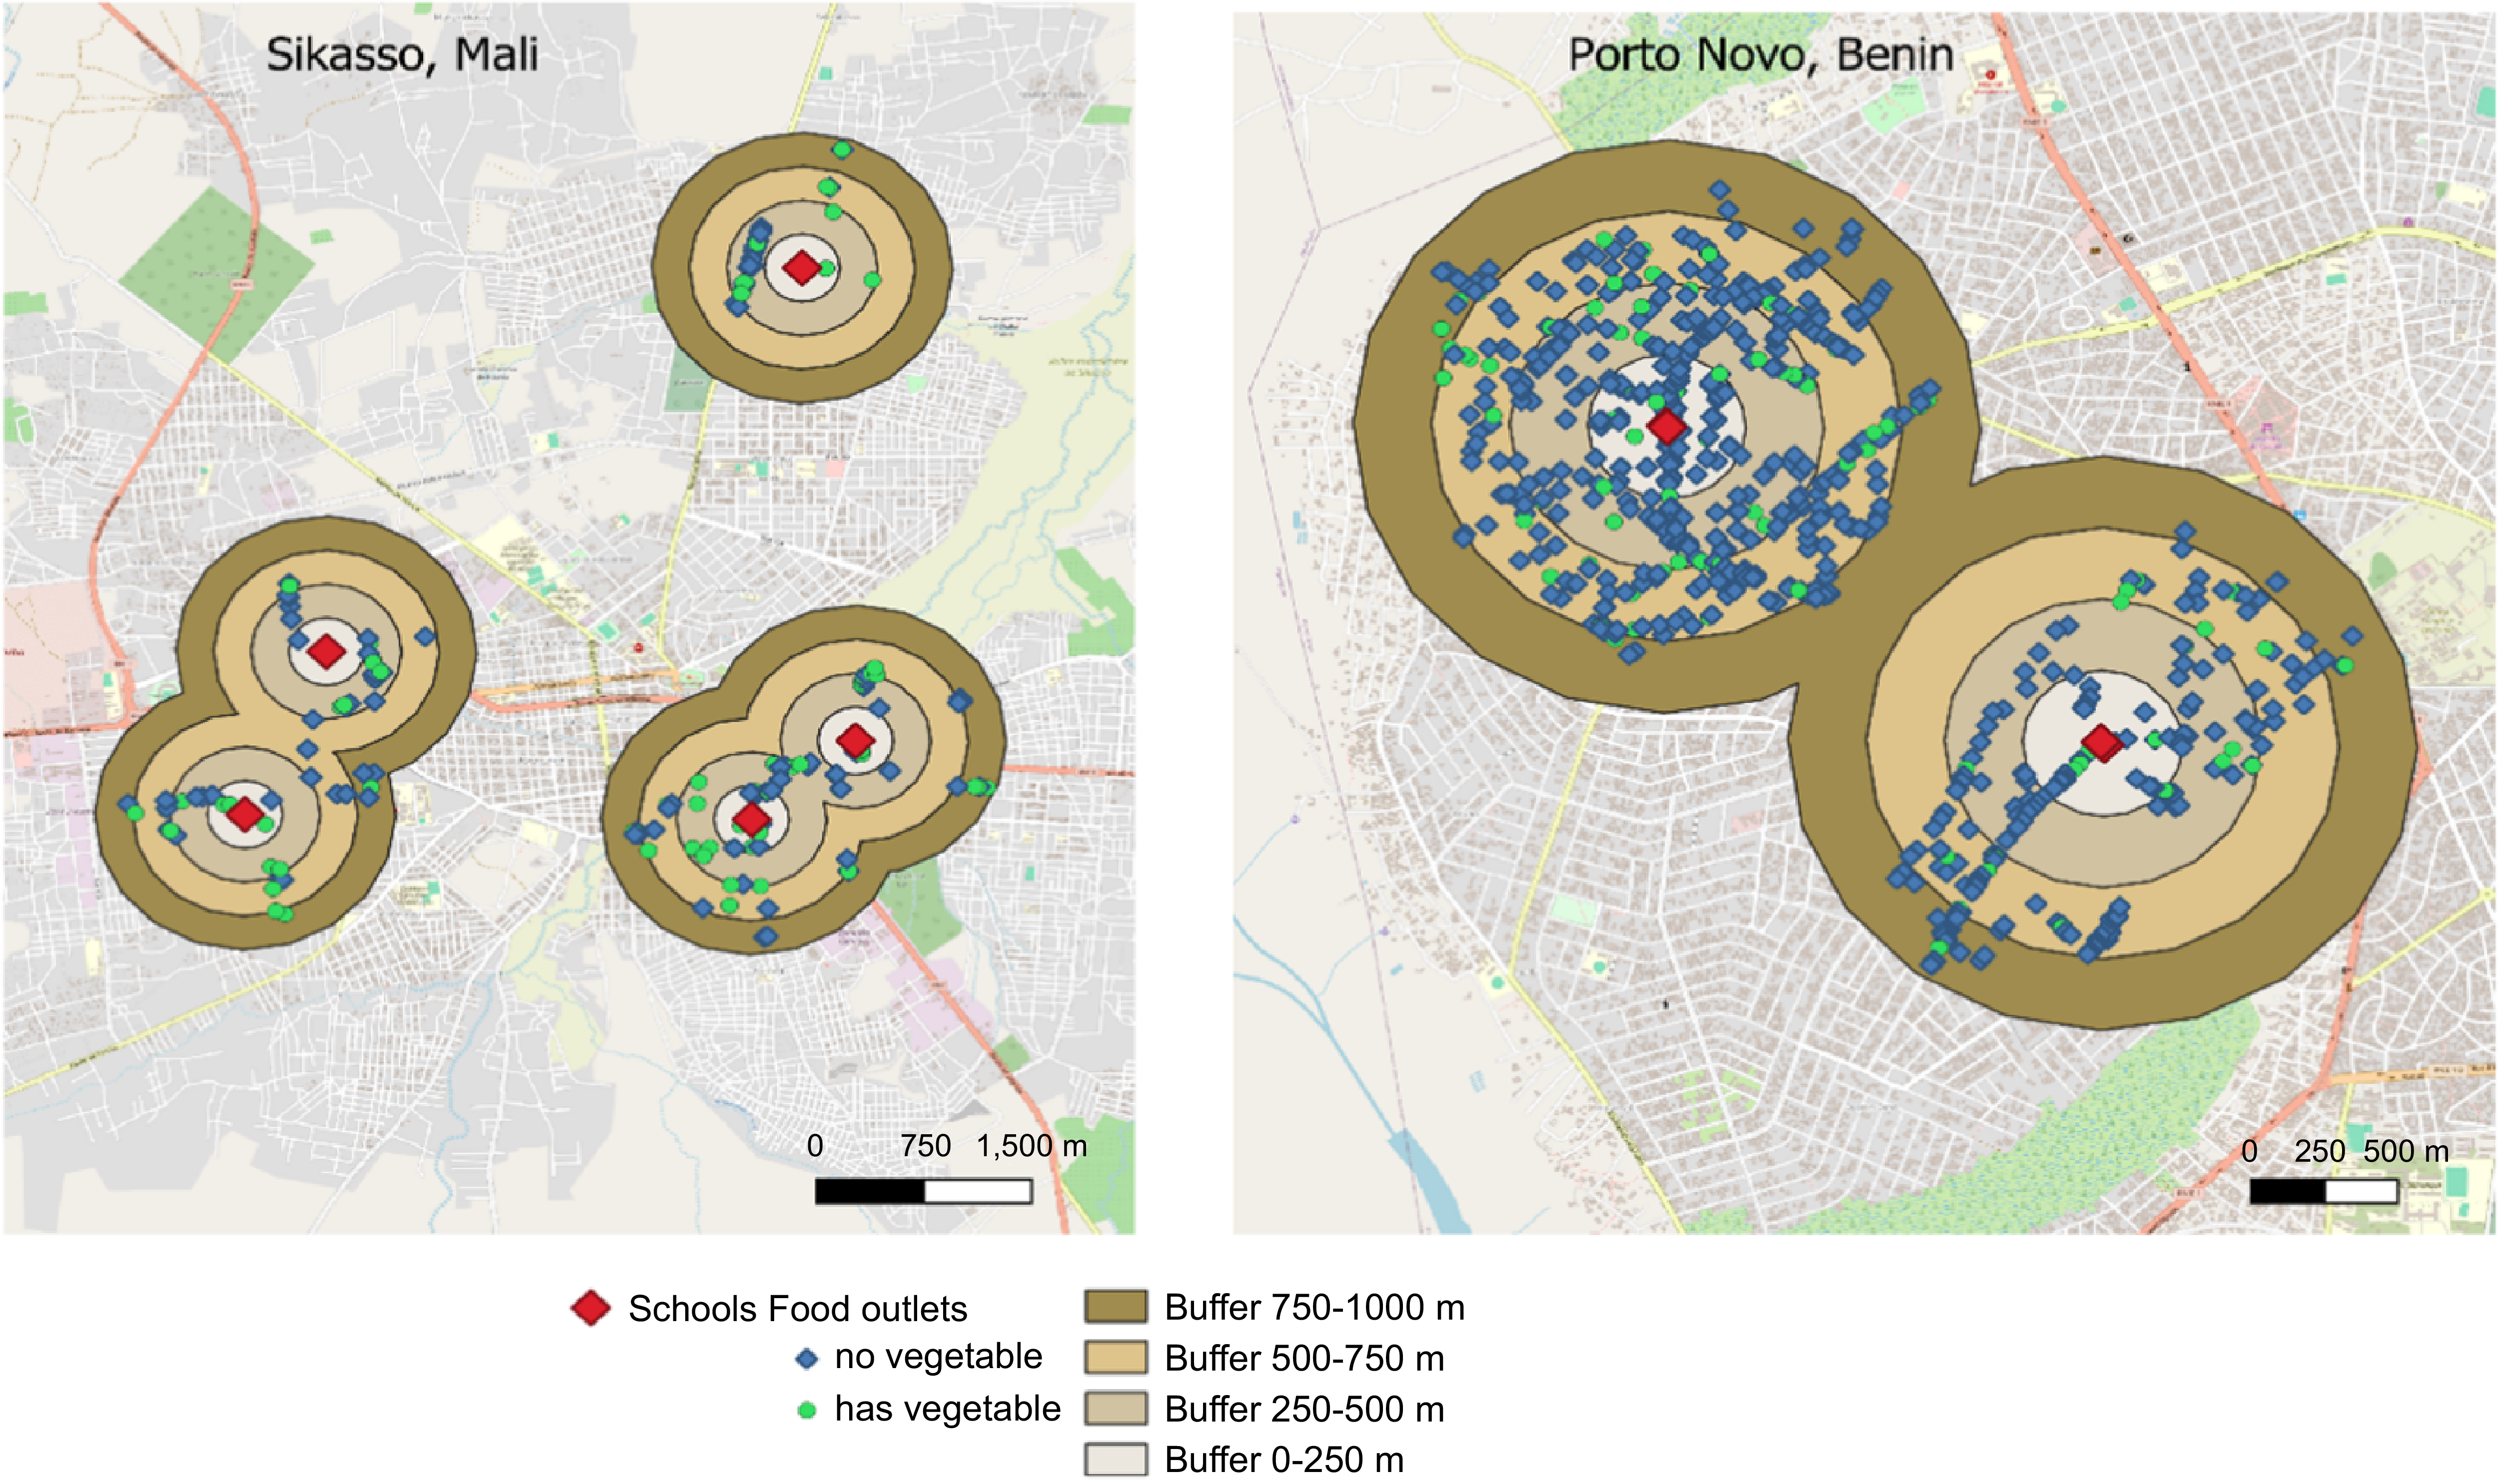
In Mali cities, most outlets were located closer to the starting point – within 750 m, while in Benin cities the largest proportion of outlets were located within 250–750 m from the starting point, but also there were more non-vegetables in these outlets (Figure 7).
Concentration of outlets at city level in Benin and Mali. From left to right, it is (left) all food outlets surveyed, (middle) outlets that sell vegetables and (right) outlets that do not sell vegetables. The four colours represent the four buffers: 0–250 m, 250–500 m, 500–750 m and 750–1000 m. The five cities from the inside ring to the outside circle are Bamako, Sikasso, Cotonou, Porto-Novo and Parakou.

Discussion
Availability and physical access are unlikely to be major limitations to vegetable consumption in surveyed areas of either city – findings show that vegetables (global and TAV) are highly available and accessible in central areas (around schools) of low-income urban neighbourhoods of both countries. This is positive, as studies have found positive relationships between exposure to food outlets around schools and increased consumption of fruits and vegetables(Reference Williams, Scarborough and Matthews33), but it very much depends on what unhealthy or convenience foods the outlets sell in addition to these, as unhealthy food consumption is also associated with access to food outlets(Reference Sturm34,Reference Da Costa Peres, Gardone and Costa35) .
There were key similarities and differences found across the country contexts studied here: targeted vegetables were largely sold in raw form across both countries, but Benin had more of a formal built environment compared to Mali, and Mali’s outlets had a larger focus on targeted vegetables and unprocessed/minimally processed foods compared to Benin. This suggests that urban Benin is further along in its ‘nutrition transition’ from more local and traditional diets to more globalised diets with a larger choice of both healthy and unhealthy foods(Reference Popkin36). Generally, these transitions bring a larger range of modern food outlets and come along with negative nutrition and health outcomes such as rising obesity and non-communicable disease(Reference Reardon, Tschirley and Liverpool-Tasie37). This is not inevitable, however; some countries, such as Vietnam and Korea, have managed to keep aspects of healthful traditional food cultures alive alongside these changes(Reference Harris, Nguyen and Tran38,Reference Lee, Popkin and Kim39) and provide a possible way forward should countries choose to emulate them.
The types of foods available, their accessibility and convenience, and their distance from visited places are among the most important factors affecting dietary behaviour(Reference Osei-Kwasi, Laar and Zotor40). It is therefore vital to ensure vegetables in the food environment, but vegetables are among the more complex foods to make available and accessible due to their perishable nature. But there are options. One option is to promote measures that increase the shelf life of vegetables since a large proportion are sold in raw form (figure available on request) or to produce vegetables closer to urban outlets, through peri-urban production, though concerns over quality and environmental health would need to be addressed(Reference Levasseur, Pasquini and Kouamé41) – it is unclear from our study why no urban gardens were seen in Mali. In high-income countries, healthier food zoning around schools has been associated with higher fruit and vegetable consumption, though this was largely in wealthier areas of richer countries(Reference Jilcott Pitts, Acheson and Ward42), and it is unclear what appetite or opportunity there is for zoning in West Africa. To address cost, consumer-level subsidies have been shown to affect purchases(Reference Thow, Downs and Jan43), including fruit and vegetables(Reference Dong and Lin44), but again largely in high-income countries. Interventions will likely be needed in ‘push’ (production and supply chains), ‘pull’ (demand and desirability) and ‘policy’ (including governance and activism)(Reference Harris, Tan and Raneri45). Overall, bringing people with a stake in local food systems together, explicitly including those most marginalised for accessing healthy diets(Reference Harris, Tan and Raneri45), and using ‘reverse thinking’ to work backwards from desired outcomes(Reference McDermott and de Brauw46) is a starting place in addressing contextualised barriers to vegetable access.
Study contributions and limitations
Until recently, most food environment studies were undertaken in the global North, and this study contributes to a growing set of primary research in the global South(Reference Turner, Kalamatianou and Drewnowski47), and Africa in particular. It also contributes to work on urban food geographies and food policy(Reference Moragues-Faus and Battersby48), with a focus specifically on vegetables. Both sets of literature have called for stronger empirical methods to be applied in understanding food systems, particularly for the most marginalised(28,49) , and this study applied grounded empirical approaches (in-person exhaustive physical survey of marginalised communities) along with strong geospatial analysis, including buffer zones, to demonstrate the fine-detailed distribution of food outlets with respect to schools (GIS approaches).
While this study does not focus on schools other than as a sampling strategy, the findings can also contribute to the school food environment literature. Much of the literature on school food environments is about what is sold or provided within school premises. What we have looked at in this study is the food environment around schools that students would be exposed to on their walk to and from class and that parents would pass on their route to collect their children, and hence the convenience of physical access to vegetables among other foods.
The study also has some limitations, including missing data on some costs and weights due to consent processes; lack of consistent weights due to the measures of vegetables used (bunches, pots, etc.); lack of assessment of seasonality on availability; and possibly missing some of the major vegetable vending points, such as large city wet markets, where these did not fall within the radius of sampled schools. Future research could consider some of these issues where logistically possible. More research is needed on food environments in Africa(Reference Laar, Addo and Aryeetey50).
Conclusion
This study used neighbourhood surveys of food outlets around schools in urban areas of Benin and Mali to understand the physical availability of vegetables. Vegetables are in general highly available around urban schools in both Mali and Benin, with more outlets and more outlet diversity in general in Benin but a greater proportion selling vegetables in Mali. There is nuance, however, in which vegetables are sold (global or traditional vegetables) and what they are sold alongside that provides healthier or unhealthier options for consumers. The detailed findings in this study on outlets, vegetables and the characteristics of vending are a significant contribution to understanding physical food environments in urban neighbourhoods that can inform policy responses in West Africa and beyond.
Acknowledgements
This study was part of the implementation of the Choose Grow Thrive project led by the World Vegetable Center. The authors are grateful to the local officials for supporting the identification of the most marginalised neighbourhoods within the five cities as well as all the food vendors in the focus cities in Benin and Mali for their participation in the study. They would also like to thank Sognigbe N’Danikou at the World Vegetable Center for giving valuable insight in the analysis of the results.
Financial support
This work was supported by the German Federal Ministry for Economic Cooperation and Development (BMZ) commissioned by the Deutsche Gesellschaft für Internationale Zusammenarbeit (GIZ) through the Fund International Agricultural Research (FIA), grant number: 81260859 to the project “Choose, Grow, Thrive: Using citizen science in expanding West Africa’s food basket with African vegetables to tackle malnutrition (BMZ-CGT)”. Open access funding was provided by the Foreign, Commonwealth & Development Office (FCDO) of the United Kingdom. Authors also acknowledge long-term strategic donors to the World Vegetable Center: Republic of China (Taiwan), United States Agency for International Development (USAID), Australian Centre for International Agricultural Research (ACIAR), United Kingdom, Thailand, Philippines, Korea, and Japan.
Conflict of interest
There are no conflicts of interest.
Authorship
J.H. conceived the study, oversaw the study and analysis, and contributed to writing, reviewing and finalising of the paper; R.N.C. undertook further analysis and contributed to writing, reviewing and finalising the paper; Y.D. undertook the GIS analysis and write-up; O.T., O.R.A., A.S., F.C. and N.F-F. undertook the data collection and initial descriptive analyses, and contributed to reviewing and editing the paper. All authors provided final approval of the version to be published, agreed on the journal to which the article was submitted and agreed to be accountable for aspects of the work.
Ethics of human subject participation
This study was conducted according to the guidelines laid down in the Declaration of Helsinki, and all procedures involving research study participants were approved by the Institutional Review Board of the World Vegetable Center. Verbal informed consent was obtained from all food outlet owners, and data collection was only undertaken for items where consent was given. Verbal consent was witnessed and formally recorded.
Data availability
Some of the illustrative figures generated in this study are not included in the manuscript but are available upon request from the corresponding author.

 Open access