

There is a growing interest in definitions for verbal descriptors and/or colour coding to indicate whether foods and drinks (in the present paper shortened to ‘foods’) are ‘high’ or ‘low’ in specific nutrients. This interest is growing because verbal descriptors and colour coding are potentially useful for improving the comprehensibility of food labelling aimed at informing consumers about the nutrient composition of foods. Some verbal descriptors such as ‘low in fat’ and ‘high in fibre’ have long been used as a means of marketing foods, in which case they are called ‘nutrition claims’. On the other hand, verbal descriptors such as ‘high in fat’ and ‘low in fibre’ have been used less frequently on food labels.
At a national level, the UK Food Standards Agency (FSA) recently convened an expert group to agree upon definitions for ‘high’, ‘medium’ and ‘low’ in fat, saturated fat, total sugars and salt, which can be used in the context of front-of-pack ‘signposting’ of these nutrients(1). The FSA recommends that this signposting should involve colour coding (traffic light labelling): red to indicate ‘high’, amber to indicate ‘medium’ and green to indicate ‘low’.
At a European level, a new Regulation on the use of nutrition and health claims has recently been adopted(2). The Regulation contains definitions for some verbal descriptors of the nutrient content of foods such as ‘low in fat’, ‘low in saturated fat’, etc. (i.e. nutrition claims) and will mean that the European Food Safety Authority will need to advise on definitions for ‘high in fat’, ‘high in saturated fat’, etc. The European Commission is also in the process of reviewing the European Union (EU) directive on nutrition labelling(3). In the future, EU legislation might conceivably allow, or even prescribe, the use of nutrition labelling which involves the use of verbal descriptors and/or colour coding.
Meanwhile, some retailers in the UK have used, use or propose to use verbal descriptors and/or colour coding to label foods. One of the first to use verbal descriptors was the Co-op Wholesale Society, who in 1992 started to use them in conjunction with back-of-pack nutrition labelling using definitions developed by the Coronary Prevention Group (CPG)(4). Recently, other retailers including Sainsbury’s, Waitrose and Asda have started to use colour-coded front-of-pack nutrition signposting(5). Some of these retailers have adopted the FSA’s proposed definitions for ‘high’, ‘medium’ and ‘low’ in fat, saturated fat, etc. but others have used their own definitions e.g. Sainsbury’s (however it should be noted that Sainsbury’s has recently agreed to use the FSA’s definitions; J Sainsbury plc, personal communication, 2006).
There are then a number of different sets of definitions for verbal descriptors such as ‘high’, ‘medium’ and ‘low’ in fat, fibre, etc. Table 1 shows three sets of definitions of ‘high’ and ‘low’ in fat developed by the CPG, the FSA and those initially used by Sainsbury’s. In the present paper, we have called such sets of definitions ‘banding schemes’.
Definitions for ‘low in fat’ and ‘high in fat’ when applied to a food

CPG, Coronary Prevention Group; FSA, Food Standards Agency.
*J Sainsbury plc, personal communication (2006).
†Liquid foods are defined as drinks and not other products such as yoghurts that are sold by volume.
‡Complete meals includes complete ready meals, sandwiches/rolls/baps/wraps, pizzas, etc.; meal components includes ready meal centres, meat products, bread, cakes, etc.; other foods includes ingredients, snacks, drinks and fats and oils. For more details contact either Sainsbury’s or the corresponding author.
These banding schemes are known to have some weaknesses. In general, they have not been developed using consistent or systematic methods. The CPG’s definition for ‘low in fat’ is set at 50 % below the UK’s population dietary goal for fat while that for ‘high in fat’ is set at 50 % above the population dietary goal(4). The FSA’s definition for ‘low in fat’ is that of the EU Regulation on nutrition and health claims which in turn is partly derived from that of the Codex Alimentarius(6). Its definition for ‘high in fat’ is based on previous advice on what counts as ‘a lot’ of fat in a food(Reference Rayner, Scarborough and Williams7). Sainsbury’s definitions are based on a variety of considerations including ‘the importance of highlighting the healthier choice in the category’ (J Sainsbury plc, personal communication, 2006).
A banding scheme categorising foods on the basis of just one nutrient is the simplest type of nutrient profiling model. Nutrient profiling can be defined as ‘the science of categorising foods according to their nutritional composition’(Reference Scarborough, Rayner and Stockley8) and is a tool that can be used to generate logical definitions for verbal descriptors of foods such as ‘low in fat’, ‘low in fat, sugar and salt’, ‘healthier’, etc. For any one descriptor, many different definitions are possible. We and others have suggested that all such definitions should be generated and tested with reference to ‘dietary patterns’ and, in particular, by using foods that are indicators of different types of diet(4, 9). This is because descriptors such as ‘low in fat’ as applied to a food are meaningful only in the context of the consumer seeking to adopt a low-fat diet in order to improve their health. Ideally, then, only the foods that help consumers adopt a healthy, low-fat diet should carry the descriptor ‘low in fat’.
Banding schemes are generally tested – entirely subjectively – on the basis of how well they perform in classifying an arbitrary list of foods(Reference Scarborough, Boxer, Rayner and Stockley10). However, we propose that the way banding schemes categorise foods should ideally be compared with the way that foods contribute to health outcomes associated with different types of diet. This would involve the use of data from follow-up studies that relate health outcomes to the consumption of particular foods. In the absence of such studies, we propose that the way banding schemes categorise foods should at least be compared with the way that foods contribute to the maintenance of different types of diet.
In the present paper, we describe four different methods of generating ‘indicator foods’ that are high, medium or low in fat on the basis of their role in the maintenance of high- and low-fat diets. We then use these indicator foods to test three banding schemes that provide three different sets of definitions of ‘high’, ‘medium’ and ‘low’ in fat: the CPG’s, the FSA’s and Sainsbury’s schemes.
There are many different methods of generating high, medium or low fat indicators, not least because the descriptors ‘high’, ‘medium’ and ‘low’ when applied to the fat content of a food can have many different meanings. For example, ‘low’ can mean low per se (as in the common nutrition claim ‘naturally low in fat’) or ‘low’ relative to products of a similar type (as in ‘low-fat spread’). In devising our methods of generating indicators we had two hypotheses in mind: (i) that low-fat foods are more likely to be consumed by those with a low-fat diet than a high-fat diet (and vice versa); and (ii) high-fat foods are more likely than low-fat foods to contribute to high-fat diets (and vice versa).
Methods
Developing indicators of foods that are high, medium or low in fat
In order to develop high, medium and low fat indicators, we used food intake data from the National Diet and Nutrition Survey (NDNS)(11) and food composition data from the nutrient databank that was used for analysing the results of the NDNS. The NDNS assessed the diets of 1724 adults aged 19–64 years living in Great Britain between July 2000 and June 2001. Each subject was asked to complete a 7 d diary recording the weighed intake of all foods consumed both in and out of the home. All foods that were consumed by the NDNS subjects were allocated to one of 7749 different food codes in the nutrient databank. There were 4612 foods consumed by at least one subject in the survey. Of these, 377 foods were excluded for the analyses reported in the present paper. The excluded items were tea, coffee and water, alcoholic drinks, dietary supplements and artificial sweeteners. We used four different methods for developing high, medium or low fat indicators.
Method 1 (frequency only)
Method 1 defines a high fat indicator as a food that is significantly more likely to be consumed by an individual with a high-fat diet than by an individual with a low-fat diet. Similarly, a low fat indicator is defined as a food that is significantly more likely to be consumed by an individual with a low-fat diet than an individual with a high-fat diet (Fig. 1).
The identification of indicators by Method 1. SND = standard normal deviate calculated using (% consumption by high-fat diet group minus % consumption by low-fat diet group)/standard deviation for the two % consumptions
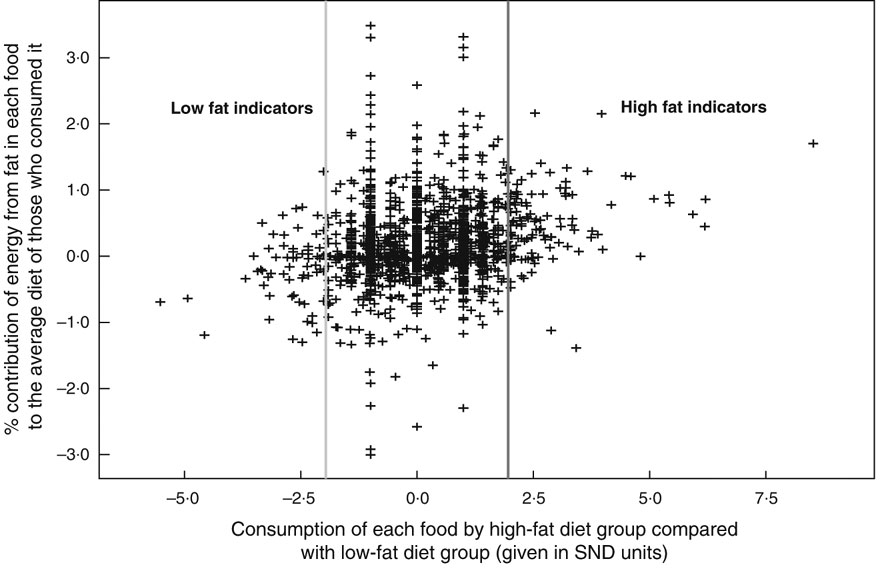
In order to identify those with a high- or low-fat diet, the NDNS participants (n 1724) were divided into four quartiles based on their fat intake (in g) per 100 kcal (418 kJ) of total energy in the diet. Those in the first quartile were considered to have a low-fat diet and those in the fourth quartile a high-fat diet.
The probability that a food is more or less likely to be consumed by an individual with a high-fat diet than by an individual with a low-fat diet could potentially be calculated in many different ways. In this instance, this probability was considered to be the difference between the proportion of individuals consuming a food in the high-fat diet group and the proportion of individuals consuming the food in the low-fat diet group. If the difference in the two proportions was significantly positive (i.e. the standard normal deviate (SND) ≥1·96), the food was identified as a high fat indicator. If the difference was significantly negative (i.e. the SND ≤−1·96), the food was identified as a low fat indicator. Foods for which there was no statistically significant difference were not considered to be medium fat indicators principally because people with medium fat diets had been excluded from the analysis.
Method 2 (frequency and contribution)
Method 2 defines a high fat indicator as a food that contributes a ‘substantial’ amount of fat to the fat intake of those who consume that particular food, in addition to being significantly more likely to be consumed by an individual with a high-fat diet than that by an individual with a low-fat diet (assessed as in Method 1). Similarly, a low fat indicator is defined as a food that does not contribute a substantial amount of fat to the fat intake of those who consume that particular food, in addition to being significantly more likely to be consumed by an individual with a low-fat diet than by an individual with a high-fat diet (Fig. 2).
The identification of indicators by Method 2. SND = standard normal deviate calculated using (% consumption by high-fat diet group minus % consumption by low-fat diet group)/standard deviation for the two % consumptions
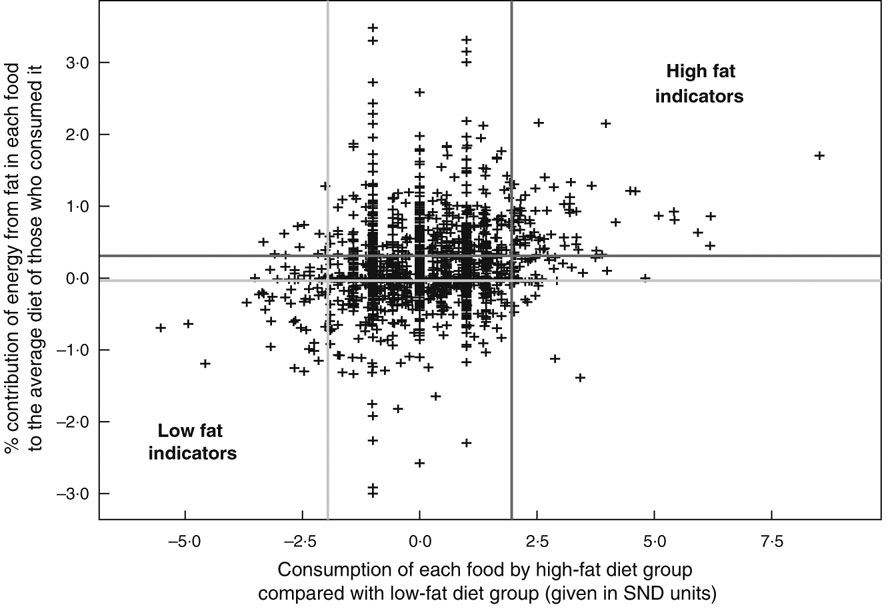
The amount of fat a food contributes to the fat intake of those who consume it could potentially be calculated in many different ways. In the present paper this contribution was considered to be the capacity (E) of the food to change the percentage energy from fat in the diet of those that consume it. E was calculated as follows:
where a = energy from fat in the diet, b = total energy in the diet, c = energy from fat in the diet provided by the food and d = total energy in the diet provided by the food. Note therefore that E can be positive as well as negative.
When foods consumed by at least one NDNS subject (n 4235) were plotted in a distribution curve by their capacity to change the percentage energy from fat in the diet of those who consume them (E), the values −0·037 % (95 % CI −0·027, −0·046 %) and +0·307 % (95 % CI 0·285, 0·327 %) corresponded to the 33rd and 66th percentiles of this distribution. Accordingly, if the capacity (E) was ≥0·307 % and in addition the food was more likely to be consumed by an individual with a high-fat diet than by an individual with a low-fat diet, the food was identified as a high fat indicator. Conversely, if the capacity (E) was <−0·037 % and in addition the food was more likely to be consumed by an individual with a low-fat diet than by an individual with a high-fat diet, the food was identified as a low fat indicator.
Method 3 (contribution only)
Method 3 defines a high fat indicator and a low fat indicator solely on the basis of the amount of fat they contribute to the fat intakes of those who consume them (assessed as in Method 2), i.e. regardless of whether they are more or less likely to be consumed by an individual with a high-fat or a low-fat diet (Fig. 3).
The identification of indicators by Method 3. SND = standard normal deviate calculated using (% consumption by high-fat diet group minus % consumption by low-fat diet group)/standard deviation for the two % consumptions. The figure indicates the threshold values of E used in Method 3 for identifying high fat and low fat indicators. Threshold values used in Method 4 (generated by the receiver-operating characteristic curves) were as follows. For CPG (Coronary Prevention Group), high fat indicator: ≥0·18 % (sensitivity: 97·47 % (95 % CI 94·9, 99·0 %); specificity: 90·14 % (95 % CI 87·4, 92·5 %); area under the curve: 0·981); low fat indicator: <–0·01 % (sensitivity: 80·78 % (95 % CI 77·3, 83·9 %); specificity: 98·92 (95 % CI 96·9, 99·8 %); area under the curve: 0·952). For FSA (Food Standards Agency), high fat indicator: ≥0·11 % (sensitivity: 98·90 % (95 % CI 96·1, 99·8 %); specificity: 72·29 % (95 % CI 68·7, 75·7 %); area under the curve: 0·907); low fat indicator: <0·01 % (sensitivity: 79·84 % (95 % CI 76·1, 83·2 %); specificity: 98·48 % (95 % CI 96·5, 99·5 %); area under the curve: 0·903). For Sainsbury’s, high fat indicator: ≥0·12 % (sensitivity: 90·51 % (95 % CI 86·6, 93·6 %); specificity: 83·09 % (95 % CI 79·7, 86·1 %); area under the curve: 0·936); low fat indicator: <–0·01 % (sensitivity: 88·05 % (95 % CI 84·7 90·9 %); specificity: 95·17 % (95 % CI 92·6, 97·1 %); area under the curve: 0·947)
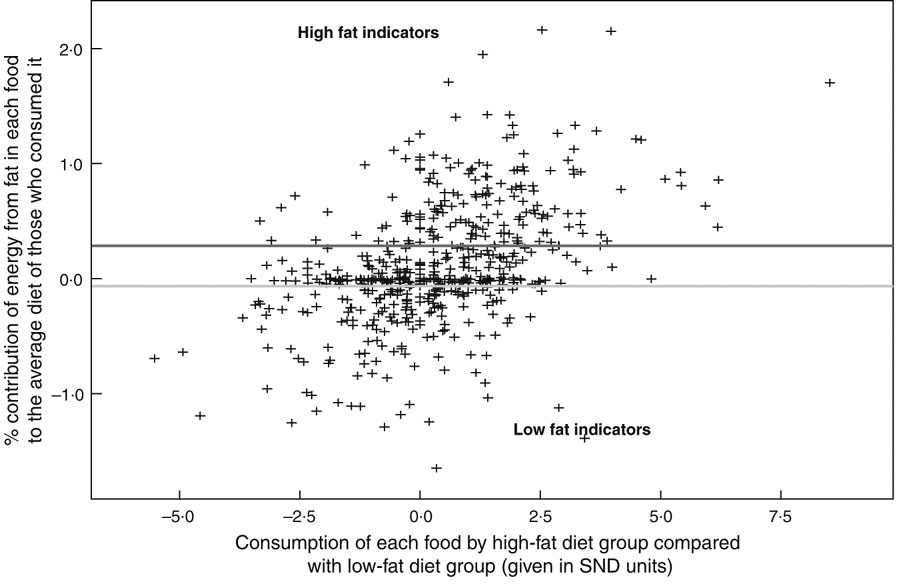
In this instance, we did not use all the foods in the nutrient databank consumed by at least one NDNS subject (n 4235) but only those foods that were consumed by at least seventeen subjects (n 845), i.e. 1 % of the NDNS subjects as a whole. This was done to reduce the number of possible indicators to a manageable number. When these foods were plotted in a distribution curve by their capacity to change the percentage energy from fat in the diet of those who consume them (E), the values −0·066 % (95 % CI −0·041, −0·107 %) and +0·285 % (95 % CI 0·215, 0·332 %) corresponded to the 33rd and 66th percentiles of this distribution. Accordingly, if the capacity (E) was ≥0·285 %, the food was identified as a high fat indicator. Conversely, if the capacity (E) was <−0·066 %, the food was identified as a low fat indicator. All other foods were classified as medium fat indicators.
Method 4 (contribution only with optimum thresholds)
Method 4, like Method 3, defines a high fat indicator and a low fat indicator solely on the basis of the amount of fat they contribute to the fat intakes of those who consume them (assessed as in Method 2) (Fig. 3). However, unlike Method 3 where the values corresponding to the 33rd and 66th percentiles values of E were used for identifying the indicators, Method 4 used ‘optimum’ thresholds of E which depended on the banding scheme to be tested.
In order to identify these optimum thresholds, receiver-operating characteristic (ROC) curves(Reference Altman12) were drawn for each banding scheme using different threshold values of E. The ROC graphs plotted sensitivity (on the y axis) v. specificity (on the x axis) for each possible threshold value for E. This was done for each banding scheme in turn. For each different threshold there is a different measure of sensitivity and specificity between the indicators and the banding scheme. The ROC graph identifies the threshold that produces the largest possible sensitivity and specificity for each banding scheme. These optimal threshold values for E for each banding scheme are given in the caption to Fig. 3.
Using indicators to test definitions of ‘high’, ‘medium’ and ‘low’ in fat of the banding schemes
The high, medium and low fat indicators generated by the four methods were used to compare the three different banding schemes by testing for:
1. The proportions of high, medium and low fat indicators correctly classified by each banding scheme (the sensitivity of each scheme);
2. The level of agreement between the way that a banding scheme classifies foods and the way that a method identifies indicators using kappa coefficients (κ). Kappa coefficients could not be used for Methods 1 and 2 because these methods did not generate medium fat indicators.
Results
Development of indicators
The four methods used to develop high, medium and low fat indicators generated different numbers of such indicators (Figs 1–3). For Methods 1 and 2, there were 1643 potential indicator foods which were eaten by at least one individual in the high-fat and/or the low-fat group. From these 1643 foods, Method 1 generated sixty-three low fat indicators and 116 high fat indicators. The indicators identified by Method 2 (thirty-five low fat indicators and seventy-three high fat indicators) were a subset of the indicators generated by Method 1.
For Methods 3 and 4, there were 845 potential indicators that were eaten by more than seventeen persons. Method 3 identified a third of these foods as low fat indicators (i.e. 281); a third as medium fat indicators (i.e. 282); and a third as high fat indicators (i.e. 282). Method 4 identified different proportions of the total of 845 indicators depending on the banding scheme to be tested.
Table 2 shows examples of the indicators generated by each method. Foods such as butter, fried eggs, boiled eggs and grilled economy sausages were identified by all four methods as high fat indicators and foods such as bananas were identified as low fat indicators by all four methods.
Comparison of the way different methods and banding schemes categorise foods

CPG, Coronary Prevention Group; FSA, Food Standards Agency; S’bury, Sainsbury’s; Pop freq., number of National Diet and Nutrition Survey (NDNS) respondents who consumed that food; No. freq., number of occasions on which the NDNS population consumed that food; H, high; M, medium; L, low; – indicates not consumed by at least one person in high-fat or low-fat diet group/no significant difference in consumption between high-fat and low-fat diet groups.
However, Method 1 identified some foods as high fat indicators that have very low amounts of fat indeed (e.g. white sliced bread and frozen carrots) or even no fat at all (e.g. vinegar). Similarly, it identified some foods as low fat indicators that have comparatively large amounts of fat (e.g. medium-fat soft cheese, grilled low-fat sausages and grilled salmon).
Since Method 2 is a ‘refinement’ of Method 1, it removes from the list of high fat indicators identified by Method 1 those foods that make a small contribution to the fat intake of those who consume them, and similarly it removes from the list of low fat indicators those foods that make a large contribution. For example, while Method 1 identified vinegar, white sliced bread and frozen carrots as high fat indicators, and wholemeal bread and medium-fat soft cheese as low fat indicators, Method 2 did not identify them as such.
Methods 3 and 4 take no account of the probability of a food being consumed by an individual with a low- or high-fat diet but only take account of the contribution the food makes to the fat intake of those who consume it (E). This means that Methods 3 and 4 generally identify, as low and high fat indicators, the same foods that Method 2 identifies as indicators but also additional indicators. There are, however, some differences in how Methods 2, 3 and 4 categorise individual foods because the threshold values of E are different for the three methods. For example, raw tomatoes and frozen carrots were identified as medium fat indicators by Method 3 but as low fat indicators by Method 4.
Testing banding schemes
The four sets of indicators were used to test the three banding schemes. The results are summarised in Tables 3 and 4.
Proportions of high, medium and low fat indicators correctly classified by banding schemes

CPG, Coronary Prevention Group; FSA, Food Standards Agency.
Statistical tests were not used to assess the significance of the difference between proportions that were correctly classified by the banding schemes because samples of indicators were not independent.
Level of agreement between the way banding schemes classify foods and the way Methods 3 and 4 identify indicators

The CPG banding scheme showed the highest sensitivity in identifying high fat indicators generated by all methods except Method 1 and the FSA banding scheme the lowest sensitivity. The CPG scheme also showed the highest sensitivity in identifying medium fat indicators generated by Methods 3 and 4 and Sainsbury’s scheme the lowest sensitivity. Sainsbury’s scheme showed the highest sensitivity in identifying low fat indicators generated by all four methods and there was then little to choose between the CPG and the FSA schemes. In other words, some schemes performed better with high fat indicators and others with low fat indicators, although in general the CPG scheme performed best by classifying over 50 % of high, medium and low fat indicators correctly.
The proportion of correct classifications is a measure of the sensitivity of the scheme but ignores specificity. The kappa coefficient gives an indication of the overall level of agreement between how banding schemes classify foods and methods identify indicators, i.e. incorporating measures of both sensitivity and specificity(Reference Altman12). However, kappa coefficients can only be used for Methods 3 and 4 because it is only these methods that generate medium fat indicators. Table 4 shows that the level of agreement between the way a banding scheme classifies foods and the way both Methods 3 and 4 identify indicators was greatest for the CPG banding scheme followed by the Sainsbury’s scheme and then the FSA scheme.
Discussion
The present paper is designed to be a contribution to the development of methods to test different nutrient profiling models. We and others have suggested that nutrient profiling models should be tested with reference to dietary patterns and, in particular, by using foods which are ‘indicators’ of different types of diet. A banding scheme is the simplest type of nutrient profiling model, categorising foods on the basis of just one nutrient(4, 9).
In this case, we have developed four different methods of generating high, medium and low fat indicators and have used these sets of indicators to test three banding schemes. This approach to testing could readily be extended to testing definitions for ‘high’, ‘low’ and ‘medium’ in other nutrients: saturated fat, sodium, fibre, etc. In addition, the methods could be used as a starting point for the development of indicator foods for testing more complex nutrient profile models (i.e. those that consider more than one nutrient).
An International Life Sciences Institute working group has already sought to develop a method for characterising ‘healthy’ and ‘less healthy’ indicator foods with which nutrient profiling models that generate definitions of ‘healthy’, ‘less healthy’, etc. can be tested in a way very similar to our Method 1(9). Those who have sought to develop a more scientific approach to the development of food-based dietary guidelines have used methods similar to ours for characterising foods that people should eat less or more of, if they are to achieve healthier diets(Reference Gibney and Sandstrom13).
A comparison between four methods of generating indicators
In the present paper, we have demonstrated that there are several ways of generating high, medium and low fat indicators. We have illustrated this by developing four different methods with reference to patterns of fat intake in the UK. All of these methods have their strengths and weaknesses – although in our view, Methods 3 and 4 have more strengths and fewer weaknesses than Methods 1 and 2.
Method 1 defines a high fat indicator as a food that is significantly more likely to be consumed by an individual with a high-fat diet than by an individual with a low-fat diet. There are three potential weaknesses of such a method. First, the method identifies some foods as high fat indicators merely because they are commonly eaten in conjunction with other high fat indicators. For example, Method 1 identifies vinegar (which contains no fat at all) as a high fat indicator because, in the UK, vinegar is eaten with other foods commonly eaten by those with a high-fat diet such as fried cod in batter (Table 2). Second, such a method seems to identify some foods as high fat indicators merely because these foods are characteristic of diets consumed by the high-fat diet group rather than by the low-fat diet group, regardless of their fat content or even the fat content of what they are eaten with. For example, Method 1 identifies white sliced bread as a high fat indicator but wholemeal bread as a low fat indicator (Table 2). Third, the method identifies as low fat indicators some foods that are merely slightly lower fat versions of their regular high-fat equivalents, e.g. low-fat soft cheese and low-fat sausages (Table 2).
Method 2 is an improvement over Method 1 in that it takes account of the amount of fat a food contributes to diets. However, it generates only a few indicators which limits its usefulness.
Methods 3 and 4 define a high fat indicator as a food that contributes a ‘substantial’ amount of fat to the average diet of those who consume that particular food. One strength of such a method is that it takes into account the serving size and frequency of consumption of foods together with their nutritional content. However, a possible weakness is that such a method does not automatically identify as low fat indicators those foods that contain very little fat, either because they contain very little energy or because they are not eaten in sufficient quantities to make a large (negative) contribution to the fat intake of those who consume them. For example, Method 3 identifies raw tomatoes, frozen carrots and vinegar as medium fat indicators while Method 4 identifies only vinegar as a medium fat indicator (Table 2). This could be addressed by using a higher threshold to identify low fat indicators.
In addition to the weakness discussed above, another weakness of Methods 1 and 2 is that they cannot be used to generate medium fat indicators. It might be supposed that those foods for which there was no statistically significant difference in the consumption between people in the high-fat and low-fat diet groups should be considered to be medium fat indicators. These foods consist of two sorts of foods: (i) foods that were consumed in large quantities by similar numbers within both high-fat and low-fat diet groups; and (ii) foods that were consumed in small quantities where there was a lack of statistical power to detect a difference in the frequency of consumption by the two groups. In our view, neither type of food can be said to be an indicator of a medium fat diet because people with a medium fat diet had been excluded from the analysis.
Methods 3 and 4, however, do generate medium fat indicators. This is a major advantage over Methods 1 and 2 because it means that the kappa coefficient can be used to give an indication of the overall level of agreement between how methods identify indicators and banding schemes classify foods, i.e. incorporating measures of both sensitivity and specificity.
As well as the four methods we have developed for generating indicators, there are several others. With each method, there are various possible modifications and refinements. For example, Method 1 is based on differences in the numbers of people consuming a food within the high-fat and low-fat diet groups but does not take account of the frequency with which each food is consumed by each individual. A modified version of Method 1 could take into account the frequency of consumption by individuals and would then generate a different set of indicators. Similarly, Method 3 takes no account of the differences in the way that foods are consumed by those with high- and low-fat diets. A modified version of Method 3 might, for example, define a high fat indicator as a food that contributes a substantial amount of fat to the average diet of those with a high-fat diet. This definition is similar but not identical to the definition of a high fat indicator for Method 2. However, the four methods for generating indicators discussed in this paper are illustrative of the range of possible methods.
Of the four methods, we consider Methods 3 and 4 to be better methods of generating high and low fat indicators than Methods 1 and 2. Furthermore, we think that Method 4 is preferable to Method 3 because it involves a less arbitrary method of selecting the threshold levels of E for defining indicators.
Whatever the method, a problem in defining verbal descriptors in relation to diets is that the classification of foods that are high in fat and low in fat might not be applicable universally owing to the population, culture and time-specific nature of dietary surveys. This is a major limitation, but is unavoidable if indicators are to be defined with reference to diets.
A comparison between three banding schemes
We have argued previously(Reference Scarborough, Rayner and Stockley8) that the development of nutrient profiling models (including banding schemes) should proceed systematically through a number of steps which include: (i) deciding whether to use food category-specific or ‘across-the-board’ criteria; (ii) deciding which base or combination of bases to use (i.e. whether to set thresholds per 100 g, per serving, per 100 kJ, or a combination thereof); and (iii) deciding on the precise numbers for the thresholds.
Of the three banding schemes, only one – the CPG scheme – has truly ‘across-the-board’ criteria (i.e. the same criteria for all categories of food), although the FSA scheme only has two categories: solids and liquids. On the other hand, the Sainsbury’s scheme uses truly ‘category-specific’ criteria (i.e. different criteria for three different categories of food). In theory, Method 1 should favour schemes which use category-specific criteria. This is because Method 1 is more likely than the other methods to identify as low fat indicators foods which are lower fat versions of their regular equivalents (e.g. low-fat soft cheese and low-fat sausages). The rationale behind the choice of category-specific criteria is that they are more suited to labelling schemes which help consumers identify healthier alternatives within categories. Indeed, Sainsbury’s scheme correctly classifies more of the high and low fat indicators identified by Method 1 than the other two schemes (Table 3).
The three different banding schemes use different bases – the CPG scheme uses the per 100 kJ base; the FSA and Sainsbury’s schemes use a combination of per 100 g and per serving bases. There are various advantages and disadvantages of the different bases as outlined elsewhere(Reference Scarborough, Rayner and Stockley8). Per 100 kJ and per serving bases take more account of the way foods are eaten than the per 100 g base. The FSA’s definition of ‘low in fat’ – the same as the EU definition of ‘low in fat’ – uses only a per 100 g base, so it is perhaps not surprising that, of the three banding schemes, the FSA scheme classifies the least number of low fat indicators correctly.
The three different banding schemes use different numbers for their thresholds. These numbers have seemingly been selected fairly arbitrarily. Numbers for banding schemes (and other nutrient profiling schemes) are generally selected by the persons responsible for developing the scheme scrutinising lists of foods to see how they classify foods and subjectively deciding what the numbers should be. Testing schemes against indicator foods should provide a more rational way of selecting the numbers (regardless of the choice of across-the-board or category-specific criteria or choice of base).
Conclusion
The present paper describes four methods of developing indicator foods with reference to dietary patterns for the purpose of testing simple nutrient profiling models – i.e. banding schemes. It further illustrates how these methods can be used to test three sets of definitions for ‘high’, ‘medium’ and ‘low’ in fat (banding schemes). We recommend that similar indicators should also be developed for testing definitions of other nutrients. It is not yet clear which method or methods of developing indicators are most appropriate. We consider, however, that methods based purely on the probability of consumption by people with healthy or unhealthy diets are unlikely to be sufficient.
Acknowledgements
We acknowledge the statistical assistance given to us by Dr Rafael Perera and Dr Pat Yudkin. M.R. and P.S. are supported by the British Heart Foundation.
All of the authors were part of the British Heart Foundation Health Promotion Research Group in the Department of Public Health, University of Oxford at the time of submission. This group is supported by the British Heart Foundation.
M.R. contributed towards the development of the CPG and FSA banding schemes.
There are no other conflicts of interest to declare.
Author contributions: Each of the authors made a significant contribution to the analysis of the paper and the writing of the manuscript. C.A. prepared the final draft of the manuscript from comments on earlier drafts by A.B., P.S. and M.R.


