


1. Introduction
Energetic charged particles observed in solar and Earth's magnetosphere plasmas (Lin & Forbes Reference Lin and Forbes2000; Bhattacharjee Reference Bhattacharjee2004; Birn et al. Reference Birn, Artemyev, Baker, Echim, Hoshino and Zelenyi2012; Fu et al. Reference Fu, Khotyaintsev, Vaivads, Retinò and André2013; Chen et al. Reference Chen, Shen, Gary, Reeves, Fleishman, Yu, Guo, Krucker, Lin, Nita and Kong2020) and in laboratory plasmas (Yamada et al. Reference Yamada, Levinton, Pomphrey and Budny1994; Hsu et al. Reference Hsu, Carter, Fiksel, Ji, Kulsrud and Yamada2001; Fiksel et al. Reference Fiksel, Almagri, Chapman, Mirnov, Ren, Sarff and Terry2009; Fox et al. Reference Fox, Porkolab, Egedal, Katz and Le2010; Yamasaki et al. Reference Yamasaki, Inoue, Kamio, Watanabe, Ushiki, Guo, Sugawara, Matsuyama, Kawakami, Yamada, Inomoto and Ono2015; Tanabe et al. Reference Tanabe, Yamada, Watanabe, Gi, Inomoto, Imazawa, Gryaznevich, Michael, Crowley, Conway, Scannell, Harrison, Fitzgerald, Meakins, Hawkes, McClements, O'Gorman, Cheng and Ono2017) are frequently associated with magnetic reconnection (Parker Reference Parker1963; Priest & Forbes Reference Priest and Forbes2000), a process of changing the topology of magnetic fields and thereby allowing an explosive release of stored magnetic energy.
Magnetic reconnection in high-energy-density laser-produced plasmas has been extensively studied (Nilson et al. Reference Nilson, Willingale, Kaluza, Kamperidis, Minardi, Wei, Fernandes, Notley, Bandyopadhyay, Sherlock, Kingham, Tatarakis, Najmudin, Rozmus, Evans, Haines, Dangor and Krushelnick2006, Reference Nilson, Willingale, Kaluza, Kamperidis, Minardi, Wei, Fernandes, Notley, Bandyopadhyay, Sherlock, Kingham, Tatarakis, Najmudin, Rozmus, Evans, Haines, Dangor and Krushelnick2008; Li et al. Reference Li, Seguin, Frenje, Rygg, Petrasso, Town, Landen, Knauer and Smalyuk2007; Dong et al. Reference Dong, Wang, Lu, Huang, Yuan, Liu, Lin, Wei, Zhong, Shi, Jiang, Ding, Jiang, Du, He, Yu, Liu, Wang, Tang, Zhu, Zhao, Sheng and Zhang2012; Fiksel et al. Reference Fiksel, Fox, Bhattacharjee, Barnak, Chang, Germaschewski, Hu and Nilson2014; Rosenberg et al. Reference Rosenberg, Li, Fox, Igumenshchev, Seguin, Town, Frenje, Stoeckl, Glebov and Petrasso2015a,Reference Rosenberg, Li, Fox, Zylstra, Stoeckl, Seguin, Frenje and Petrassob; Fox et al. Reference Fox, Schaeffer, Rosenberg, Fiksel, Matteucci, Park, Bott, Lezhnin, Bhattacharjee, Kalantar, Remington, Uzdensky, Li, Seguin and Hu2020) and plasma heating and the presence of super-thermal energetic electrons have been documented (Zhong et al. Reference Zhong, Li, Wang, Wang, Dong, Xiao, Wang, Liu, Zhang, An, Wang, Zhu, Gu, He, Zhao and Zhang2010, Reference Zhong2016). Nevertheless, although high-energy electrons have been detected, the mechanism of their acceleration still remains poorly understood. Moreover, contributions from alternative acceleration mechanisms, such as laser–plasma interaction (LPI) (Kruer Reference Kruer1988; Regan et al. Reference Regan, Bradley, Chirokikh, Craxton, Meyerhofer, Seka, Short, Simon, Town, Yaakobi, Carroll III and Drake1999), formation of collisionless shocks (Schaeffer et al. Reference Schaeffer, Fox, Haberberger, Fiksel, Bhattacharjee, Barnak, Hu and Germaschewski2017), tearing (plasmoid) and Weibel instabilities (Bhattacharjee Reference Bhattacharjee2004; Drake, Swisdak & Fermo Reference Drake, Swisdak and Fermo2012; Hoshino Reference Hoshino2012; Fox et al. Reference Fox, Fiksel, Bhattacharjee, Chang, Germaschewski, Hu and Nilson2013, Reference Fox, Park, Deng, Fiksel, Spitkovsky and Bhattacharjee2017; Huntington et al. Reference Huntington2015) and the betatron effect (Somov et al. Reference Somov, Oreshina, Oreshina and Shakura2003; Chen et al. Reference Chen, Shen, Gary, Reeves, Fleishman, Yu, Guo, Krucker, Lin, Nita and Kong2020), are not ruled out and, as such, the role of reconnection in the acceleration is only conjectured.
We report on experiments conducted using the OMEGA (Boehly Reference Boehly, Brown, Craxton, Keck, Knauer, Kelly, Kessler, Kumpan, Loucks, Letzring, Marshall, McCrory, Morse, Seka, Soures and Verdon1977) and OMEGA EP (Waxer et al. Reference Waxer, Maywar, Kessler, Kruschwitz, Loucks, McCrory, Meyerhofer, Morse, Stoeckl and Zuegel2005) laser facilities, which provide a conclusive observation of particle energization in experiments where collision, merging and reconnection of two magnetized plasmas take place.
To initiate a collision, two neighbouring plasma plumes are produced by intense laser beams, and the magnetic fields, self-generated via the Biermann battery effect (Biermann Reference Biermann1950), merge and reconnect in the process of the plumes’ expansion. To characterize the energization, the energy distribution of the electrons escaping the plasmas is measured. To isolate the merging and/or reconnection as an acceleration source, the electron energy spectra obtained from two-plume reconnection shots are compared with the spectra from ‘null’ single-plume shots.
One important observation is that even in experiments with a single plasma plume, an energized population with energies up to ${\sim }250$ keV and an equivalent temperature of up to ${\sim }19$
 keV can be produced. Observing the single-plume spectra is important because they presumably play a role of ‘input’ to any energization process which occurs during the merging. We also observe that in experiments with two merging plasma plumes, the electrons are additionally accelerated by ${\sim }50\text {--}100$
 keV compared with single-plume shots. This additional energization is significantly beyond the statistical variation between the single- and two-beam experiments, and is confirmed in experiments with both OMEGA and OMEGA EP.
In this paper, we consider several possible energization mechanisms, and find that the additional energization is much larger than could be expected from mechanisms typically associated with reconnection, such as acceleration by the electric field induced in the current sheet or the first-order Fermi acceleration, a process of energy gain via consecutive reflections from two approaching magnetic fields. Another general and important observation is that careful comparison of two-plume merging with single plume is required to confirm the effect of energization. These comparison tests, to our knowledge, have not previously been reported.
The paper is organized as follows. Section 2 describes the experimental set-up and diagnostics. Results of the electron energization are presented in § 3. These results and also several mechanisms of electron energization are discussed in § 4. Section 5 presents justifications of the various plasma parameters used throughout the paper. The results and conclusions are summarized in § 6.
2. Experimental set-up and diagnostics
The experiments were conducted using the OMEGA and OMEGA EP laser facilities with a typical experimental set-up shown in figure 1. A thin plastic (CH) target with a size of $3\times 5\ \textrm {mm}^{2}$ is driven by one or two $351\ \text{nm}$
 laser beams, each focused on a spot with a diameter of $750\ {\mathrm {\mu }}$
 m. The target thickness was $5\ {\mathrm {\mu }}$
 m for experiments on OMEGA and $25\ {\mathrm {\mu }}$
 m for experiments on EP.
Experimental set-up. A plastic (CH) target is driven by one or two ${\rm nm}$ laser beams focused on a spot with a diameter of $750\ {\mathrm {\mu }}$
 m. Each beam has an energy of $200$
 J and a duration of $0.5$
 ns. The fast electrons are analysed by a magnetic energy spectrometer placed $95$
 mm from the target. The electrons entering the spectrometer are dispersed by a permanent magnetic field of $450$
 G and registered by an image plate placed on top of the magnets.

Each beam has an energy of $200$ J for EP and $225$
 J for OMEGA and a duration of $0.5$
 ns, which corresponds to a beam power of $0.4\text {--}0.45$
 TW and a nominal on-target laser intensity of $0.9\text {--}1\times 10^{14}$
 W cm$^{-2}$
 . The choice of the beam energy and duration was motivated by trying to reduce the effect of electron energization by LPI, such as stimulated Raman scattering or two-plasmon decay instability. In general (Rosenberg et al. Reference Rosenberg, Solodov, Seka, Follett, Myatt, Maximov, Ren, Cao, Michel, Hohenberger, Palastro, Goyon, Chapman, Ralph, Moody, Scott, Glize and Regan2020; Solodov et al. Reference Solodov, Rosenberg, Seka, Myatt, Hohenberger, Epstein, Stoeckl, Short, Regan, Michel, Chapman, Follett, Palastro, Froula, Radha, Moody and Goncharov2020), LPI intensity and hence electron acceleration increase with the laser beam intensity and duration. For the experiments, a low beam power and a short duration were chosen to minimize this effect.
Two types of shots were investigated: two-plume merging shots and single-plume non-merging shots. For merging shots, two beams focused $1.6$ mm apart produce two plasma plumes with anti-parallel self-generated Biermann magnetic fields that merge and reconnect in the process of the plumes’ expansion. For non-merging, or ‘null’, shots only a single beam was used.
The fast electrons were analysed by a magnetic energy spectrometer (Habara et al. Reference Habara, Iwawaki, Gong, Wei, Ivancic, Theobald, Krauland, Zhang, Fiksel and Tanaka2019) placed $95$ mm from the target. The majority of the data were obtained with the spectrometer aligned to detect the electrons streaming along the so-called X-line, that is, the line normal to the reconnection current sheet and along which the oppositely directed magnetic fields cancel each other and thus only weakly affect the electron trajectories. In addition, this alignment results in the spectrometer's line of view being aligned with the reconnection-induced electric field, which could be directly related to the electron acceleration. The position of the analyser shown in figure 1 corresponds to the electrons being accelerated by the reconnection-induced electric field. We also show results with the analyser viewing the front face of the target, the direction in which the electrons are expected to be decelerated by the field. Finally, we show results with the analyser aligned parallel to the current sheet, along the ‘outflow’ direction.
The electrons enter the spectrometer through a $0.7$ mm pinhole collimator and are dispersed by a permanent magnetic field of $450$
 G. The magnetic dispersion was calculated with the COMSOL Multiphysics package using the experimentally measured magnetic field. The dispersion energy range of the spectrometer is from $0.02$
 to $4$
 MeV. The dispersed intensity of the electron flux is registered by a Fuji BAS-TR image plate (Miyahara et al. Reference Miyahara, Takhashi, Amemiya, Kamiya and Satow1986; Gales & Bentley Reference Gales and Bentley2004) placed on top of the magnets. Image plates are widely used for detection of charged particles and ionizing radiation due to their high sensitivity and linearity over a large energy range. A specific advantage of using the TR type for our purpose is that it does not have a protective mylar film covering the photostimulable phosphor layer, thus extending its low-energy range. Since the image plate response is time-integrated, no temporal information is available.
A typical plot of the image plate photostimulated luminescence (PSL) signal integrated across the image plate versus the distance along the image plate is shown in figure 2. Besides the luminescence from the dispersed electrons, there is a contribution from scattered X-rays that is shown in blue and is measured along the part of the image plate not exposed to the electrons. For spectral analysis, the background is subtracted from the total signal. The background level was dependent on the type of shot, i.e. merging or ‘null’, as well as varying from shot to shot.
A typical plot of PSL (red curve) versus distance along the image plate. The background (BG; blue curve) is caused by scattered X-rays and is subtracted from the total signal for analysis.

After scanning the exposed image plate, the PSL profile $\textrm {d}(PSL)/\textrm {d} l$ (in units of PSL mm$^{-1}$
 ) is converted to the electron energy spectra $\textrm {d} N/\textrm {d} E$
 according to

where $\textrm {d} E/\textrm {d} l$ is the spectrometer dispersion and $\textrm {d} (PSL)/\textrm {d} N$
 is the image plate sensitivity per electron (Bonnet et al. Reference Bonnet, Comet, Denis-Petit, Gobet, Hannachi, Tarisien, Versteegen and Aleonard2013).
3. Electron energization
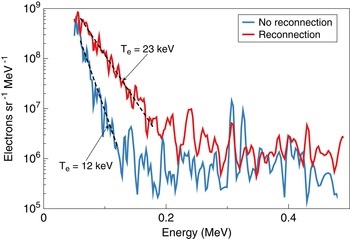
The energy spectra for merging and non-merging shots measured using OMEGA EP in the direction of X-line acceleration, that is, anti-parallel to the reconnection electric field, are shown in figure 3, where we compare a set of two merging shots with a set of four single-beam ‘null’ shots. Each curve represents the spectra normalized over the number of beams in each shot and then averaged over the respective set. In this normalization, the total laser energy in each group is identical, and if there is no additional energization from merging, one would predict the spectra would be identical as well. The shot-to-shot data scatter is represented by the coloured bands, which span an interval of one standard deviation.
Electron energy spectra for merging (red) and non-merging (blue) shots taken using OMEGA EP in the direction of X-line acceleration. The coloured bands represent the standard shot-to-shot deviation.

The ‘null’ shot spectrum exhibits an initial exponential slope with an equivalent temperature of $19$ keV. The value of the slope is significantly higher than the expected bulk plasma temperature of $T_e = 0.4$
 keV. (See § 5 for more details on the plasma density and temperature measurements.) In addition, even though this high-energy tail appears to be Maxwellian, it cannot be supported by classical Coulomb collisions in plasma at such energies. Indeed, estimating an electron mean-free path for a fast electron with an energy $E$
 in a plasma with a density $n_e = 1.5 \times 10^{19}\ {\textrm {cm}^{-3}}$
 , 1 : 1 C-to-H plasma composition and $\varLambda = 10$
 , $\lambda [\textrm {cm}] = 1.25 \times 10^{12}E^{2} [\textrm {eV}]/n_{e} [\textrm {cm}^{-3}]\varLambda$
 (Book Reference Book1990), results in $\lambda = 80\ \textrm {cm}$
 for a typical electron energy of $E = 100$
 keV. This mean-free path is much larger than a typical plasma size of several millimetres. This observation strongly suggests that other, non-thermal energization mechanisms, for example energization via LPI, are present in the plasma.
The spectrum from the merging shots has an exponential slope that corresponds to an equivalent temperature of $29$ keV, an increase by a factor of about 1.5 compared to the ‘null’ shots. Given the spectra normalization procedure described earlier, the fact of the additional electron acceleration strongly suggests that it is a result of the plumes’ collision and/or reconnection. We note here that the plateau part of the spectra at high energies, e.g. higher than $0.4\text {--}0.5$
 MeV in figure 3, represents the background noise from X-ray exposure.
We confirmed the energization effect in separate experiments conducted using OMEGA with a similar experimental set-up employing a similar beam configuration albeit at a 10 % higher beam power ($225$ J instead of $200$
 J). In this series of shots we compare one merging shot with two beams with one single-beam ‘null’ shot. Each curve represents the spectra normalized over the respective number of beams. Only one shot for the merging case and one shot for the single beam were taken; therefore, no error bar estimation was possible. This series produced similar results – strong electron energization even in the case of a single plasma plume and additional energization for two colliding and merging plumes (figure 4).
Electron energy spectra for merging (red) and non-merging (blue) shots taken using OMEGA in the direction of X-line acceleration.

We note here that the energy losses from passing through the thin targets are expected to be small. Using the NIST tables (NIST 2021), one can estimate that the range of a $100$ keV electron is about $145\ {\mathrm {\mu }}$
 m, much longer than the target thickness, and the energy loss is about $2$
 keV for OMEGA and $10$
 keV for EP.
Because of the arrangements of the laser and diagnostic ports of EP, it was not possible to place an analyser viewing the plasma from the direction of X-line deceleration, which is parallel to the reconnection electric field. However, for OMEGA this configuration was possible and the results are shown in figure 5. Relative to the direction of X-line acceleration, the signature of the additional acceleration during the merging of the plumes is very similar, although the signal amplitude is lower. This decrease in the amplitude may agree with the LPI origin of the pre-accelerated electrons, which are predominantly forward-peaked.
Electron energy spectra for merging (red) and non-merging (blue) shots taken using OMEGA in the direction of X-line deceleration.

Finally, figure 6 shows the energy spectra taken using EP and OMEGA in the outflow direction. The additional acceleration during the merging of the plumes is evident. The ‘outflow’ electrons might be strongly affected by the reconnection magnetic field, so the signal might strongly depend on the angle of the line of sight relative to the target, which in our experiment was very oblique.
Electron energy spectra for merging (red) and non-merging (blue) shots taken using (a) EP and (b) OMEGA in the outflow direction.

To conclude the presentation of the experimental results, we briefly reiterate two major points. First, it has been found that there exists a source of electron energization that is active even in single-plume ‘null’ shots. We speculate that these super-thermal electrons are generated via residual LPI that was not completely eliminated by reducing the laser beam intensity even though its level was below the detection threshold. Most importantly, we confirm additional acceleration found in experiments where two plumes collided and merged, over that observed in single-plume experiments, indicating an effect due to the collision, merging and/or reconnection.
4. Discussion
Several relevant electron acceleration mechanisms in high-energy-density plasmas have been discussed in the literature, including magnetic reconnection (Zhong et al. Reference Zhong, Li, Wang, Wang, Dong, Xiao, Wang, Liu, Zhang, An, Wang, Zhu, Gu, He, Zhao and Zhang2010; Dong et al. Reference Dong, Wang, Lu, Huang, Yuan, Liu, Lin, Wei, Zhong, Shi, Jiang, Ding, Jiang, Du, He, Yu, Liu, Wang, Tang, Zhu, Zhao, Sheng and Zhang2012; Totorica, Abel & Fiuza Reference Totorica, Abel and Fiuza2016, Reference Totorica, Abel and Fiuza2017; Zhong et al. Reference Zhong2016; Fox et al. Reference Fox, Park, Deng, Fiksel, Spitkovsky and Bhattacharjee2017), Fermi acceleration (Drake et al. Reference Drake, Swisdak and Fermo2012; Hoshino Reference Hoshino2012), formation of collisionless shocks (Schaeffer et al. Reference Schaeffer, Fox, Haberberger, Fiksel, Bhattacharjee, Barnak, Hu and Germaschewski2017), plasma instabilities (Bhattacharjee Reference Bhattacharjee2004; Drake et al. Reference Drake, Swisdak and Fermo2012; Fox et al. Reference Fox, Fiksel, Bhattacharjee, Chang, Germaschewski, Hu and Nilson2013; Huntington et al. Reference Huntington2015; Fox et al. Reference Fox, Park, Deng, Fiksel, Spitkovsky and Bhattacharjee2017) and the betatron effect (Somov et al. Reference Somov, Oreshina, Oreshina and Shakura2003; Chen et al. Reference Chen, Shen, Gary, Reeves, Fleishman, Yu, Guo, Krucker, Lin, Nita and Kong2020).
We briefly consider three potential mechanisms for acceleration of energetic super-thermal electrons: (1) X-line acceleration, (2) first-order Fermi acceleration and (3) the betatron effect. We conclude that the two former mechanisms contribute only weakly to acceleration while the latter has all the ingredients for efficient acceleration including a high driving force and a good particle confinement, both necessary for the energization to take place.
4.1. X-line acceleration
The electric field induced by reconnection can in principle accelerate collisionless electrons, especially in the vicinity of X-points where the two reconnecting magnetic fields cancel each other so the electrons become demagnetized and are only weakly affected by the magnetic field. However, simple estimates demonstrate that these effects are expected to be small in our particular case. The energy gain from the electric field $\mathcal {E}_z$ induced in the current sheet is $\Delta E_X = e \int \mathcal {E}_z \, \textrm {d} z$
 , where the $z$
 axis is directed along the X-line. The electric field can be estimated as $\mathcal {E}_z \sim V_\textrm {in}B$
 , thus

where $V_\textrm {in}$ is the inflow velocity, $B$
 is the plume magnetic field and $\int B \, \textrm {d} z$
 is the magnetic flux per unit of the current sheet length.
From the magnetic field imaging using the fast proton radiography diagnostic under conditions very similar to ours (Petrasso et al. Reference Petrasso, Li, Seguin, Rygg, Frenje, Betti, Knauer, Meyerhofer, Amendt, Froula, Landen, Patel, Ross and Town2009), the $B$ -integral is $\int B\, \textrm {d} z \sim 10\ \textrm {T mm}$
 and the flow velocity estimated from the bubble expansion dynamics is $V_\textrm {in} \sim 5\times 10^{5}$
 m s$^{-1}$
 . Therefore, the expected energy gain from the reconnection-induced field $\Delta E_X = e \int \mathcal {E}_z \, \textrm {d} z \sim 5$
 keV, which is much less than observed. In addition, this mechanism is expected to be weakly dependent on the initial electron energy, whereas the measured spectra clearly indicate that the acceleration favours higher energies. Indeed, given that this high-energy electron tail is collisionless, a constant energy gain across the spectra would have resulted in an energy shift, while the observed change of slope, shown for example in figure 3, indicates that energy gain is approximately proportional to the energy as $\Delta E \approx 0.5 E$
 .
.
4.2. First-order Fermi acceleration
Previous simulations (Fox et al. Reference Fox, Park, Deng, Fiksel, Spitkovsky and Bhattacharjee2017; Totorica et al. Reference Totorica, Abel and Fiuza2017) suggested the possibility of the first-order Fermi acceleration process, in which a charged particle is accelerated by bouncing between two approaching magnetic walls. If the relative magnetic wall velocity is much less than the particle velocity, then due to conservation of the adiabatic invariant $\oint p_x\, \textrm {d} x$ (Landau & Lifshitz Reference Landau and Lifshitz1981), the particle energy is increasing as $E = E_0 l_0^{2}/l^{2}$
 , or the energy gain is

where $l$ is the wall separation and $E_0$
 and $l_0$
 are the initial energy and the initial wall separation.
In general, this mechanism favours the higher energies but in the three-dimensional geometry of the experiment, an electron can escape from the gap between the walls along the unmagnetized direction. The escape time can be estimated as $\tau \sim L/v_{e}$ , where $L$
 is a characteristic length and $v_{e}$
 is the electron velocity. Because of the small, ${\sim }1$
 mm size of a typical laser plasma experiment, the electron is lost in a very short time. For an electron with an energy of $E_0 = 100$
 keV, the escape time over $L = 3$
 mm (three times the plasma size) is $\tau \sim 20$
 ps. If the two walls, separated initially by $l_0= 1$
 mm, are colliding with a velocity of $V_\textrm {in} = 5\times 10^{5}$
 m s$^{-1}$
 , then in that time each wall would move only by $V_\textrm {in}\tau \approx 10\ {\mathrm {\mu }}$
 m, resulting in a very small compression factor of $l_0^{2}/l^{2} \sim 1.04$
 , and a corresponding energy gain of only $\Delta E_F = 4$
 keV.
keV.
4.3. A model of electron acceleration
To evaluate the effects of both acceleration by the reconnection electric field and Fermi acceleration in a cohesive and self-consistent manner, consider a simple toy model of expanding and merging toroidal Biermann fields. Following Kugland et al. (Reference Kugland, Kugland, Ryutov, Ryutov, Plechaty, Plechaty, Ross, Ross, Park and Park2012) consider two merging magnetic toroidal plumes, each with a magnetic field defined by its vector potential:

where $a$ is the plume radius. The magnetic field is calculated as $\boldsymbol {B} = \nabla \times \boldsymbol {A}$
 and the electric field as $\boldsymbol {E} = - \partial \boldsymbol {A}/ \partial t$
 . Each individual magnetic field, given by (4.3), has closed toroidal flux surfaces typical for a field generated by the Biermann effect, as illustrated in figure 7(a).
Magnetic field topology. (a) A magnetic toroid typical for a field generated by the Biermann effect. The model (b) magnetic field map, and (c) magnetic (blue) and electric (red) fields, and the line integral of the magnetic field (blue, dashed) profiles at $t = 0.8$ ns.
ns.

Assume that each plume expands according to $a = a_0 +V_\textrm {in}t$ , where $a_0$
 is the initial plume radius and $V_\textrm {in}$
 is the expansion velocity. For the particular model, assume $a_0 = 0.5$
 mm, $V_\textrm {in} = 5\times 10^{5}$
 m s$^{-1}$
 and select $B_0 = 20$
 T, the value that results in the maximum of the line-integrated magnetic field of $\int {B\, \textrm {d} z} = 10\ \textrm {T mm}$
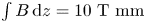 . Figure 7(b) shows a map of the magnetic field across the horizontal cross-section at $t = 0.8$
 ns, which is the moment when the plumes start to merge, and figure 7(c) shows the profiles of the magnetic and electric fields and the line integral of the magnetic field at that time.
In order to emulate the conditions of our experiment using this simple model, we follow a group of already pre-energized electrons. To this end, an isotropic source of test electrons with an an initial energy of $100$ keV is placed between the plumes and their trajectories are traced by solving the relativistic equations of motion with the COMSOL Multiphysics package. The electrons are bouncing between the expanding plumes experiencing a combined action of the direct Fermi effect and the inductive electric field and eventually escape. The trajectories of the electrons, represented in terms of the electron energy, are shown in figure 8. The electrons escaping down the X-line in the direction opposite to that of the electric field are gaining an energy of up to about $4$
 keV, in agreement with the previous estimates. To check the effect of the magnetic field, the calculations were repeated at a value of the magnetic field integral of $\int {B\, \textrm {d} z} = 25$
 T mm. As a result, the energy gain of the escaped electrons increased from $4$
 to $10$
 keV, still much lower than observed in the experiment.
Electron trajectories between two expanding magnetic toroids (shown in dark red). The initial electron energy is $100$ keV. The trajectories are traced by solving the relativistic equations of motion with the COMSOL Multiphysics package. The trajectories are represented in terms of the electron energy that is shown in the colour bar.

4.4. Betatron acceleration
The betatron mechanism accelerates charged particles spiralling about the magnetic field lines due to conservation of the magnetic moment $\mu = mv^{2}/2B$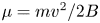 in a dynamically increasing magnetic field. This effect is used and observed in many applications ranging from particle accelerators (Kerst Reference Kerst1940) to solar flares (Somov et al. Reference Somov, Oreshina, Oreshina and Shakura2003; Chen et al. Reference Chen, Shen, Gary, Reeves, Fleishman, Yu, Guo, Krucker, Lin, Nita and Kong2020).
Magnetized plasmas colliding with a high, super-Alfvénic, supersonic velocity exhibit a strong transient jump of the magnetic field across the collision interface because of the plasma compression – so-called magnetic field pileup. This effect can accelerate the reconnection by compressing the magnetic field and therefore the local Alfvén velocity $V_A = B/(\mu _0 \rho )^{1/2}$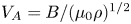 , where $\rho$
 is the total plasma mass density. Recent observations in the Earth's magnetosphere revealed flux pileup by a factor of 3 to 5 (Fu et al. Reference Fu, Khotyaintsev, Vaivads, Retinò and André2013; Øieroset et al. Reference Øieroset2019), a factor of between 1 and 5 in the solar photosphere (Litvinenko, Chae & Park Reference Litvinenko, Chae and Park2007), and a factor of 2 in a high-energy-density plasma (Suttle et al. Reference Suttle, Hare, Lebedev, Ciardi, Loureiro, Burdiak, Chittenden, Clayson, Halliday, Niasse, Russell, Suzuki-Vidal, Tubman, Lane, Ma, Robinson, Smith and Stuart2018). In the above cited works it was also observed that plasma in the flux pileup region was heated.
Returning to laser-driven reconnection experiments, two-dimensional particle-in-cell simulations (Fox, Bhattacharjee & Germaschewski Reference Fox, Bhattacharjee and Germaschewski2011, Reference Fox, Bhattacharjee and Germaschewski2012) with plasma profiles and parameters relevant to our experiments showed pileups reaching up to a factor of 4, depending on the inflow Mach number. However, these two-dimensional simulations are relatively over-compressive because in reality the plumes simultaneously are expanding (and decompressing) in the out-of-plane direction. Recent three-dimensional simulations obtain a smaller but finite pileup, close to a factor of 1.5–2 (Matteucci et al. Reference Matteucci, Fox, Bhattacharjee, Schaeffer, Moissard, Germaschewski, Fiksel and Hu2018). Other two-dimensional simulations (Totorica et al. Reference Totorica, Abel and Fiuza2016) observed a field enhancement of a factor of 1.5–5, depending on the inflow Mach number, and decreasing to about 7 % for a three-dimensional case for an inflow Mach number $M_A = V_\textrm {in}/V_A= 4$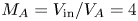 . For comparison, the inflow Mach number in our experiment was $M_A = 10\text {--}12$
 .
.
For these reasons, we hypothesize that the electrons are accelerated in concert with the magnetic compression into the reconnection layer in the strongly driven regime. These electrons are magnetized by the strong magnetic field and therefore can stay confined to the plumes for the time scale of the interaction, rather than being promptly lost. To explain the observed energy gain dependency on the energy ($\Delta E \approx 0.5 E$ ), a 50 % field increase would be required.
5. Plasma parameters
In this section we present results of experiments justifying the choice of plasma parameters, such as density, temperature, flow speed and magnetic field, used for various numerical estimates throughout the paper.
5.1. Magnetic field and plasma bubble expansion
Much work has been published on Biermann magnetic field measurements in laser plasmas using proton radiography (Li et al. Reference Li, Seguin, Frenje, Rygg, Petrasso, Town, Landen, Knauer and Smalyuk2007; Petrasso et al. Reference Petrasso, Li, Seguin, Rygg, Frenje, Betti, Knauer, Meyerhofer, Amendt, Froula, Landen, Patel, Ross and Town2009; Gao et al. Reference Gao, Nilson, Igumenshchev, Haines, Froula, Betti and Meyerhofer2015; Rosenberg et al. Reference Rosenberg, Li, Fox, Igumenshchev, Seguin, Town, Frenje, Stoeckl, Glebov and Petrasso2015a,Reference Rosenberg, Li, Fox, Zylstra, Stoeckl, Seguin, Frenje and Petrassob). The quantity that is directly inferred from these measurements is not the magnetic field per se, but its integral, $\int {B\, \textrm {d} l}$ , along the proton path. Incidentally, it is exactly the same quantity that determines the acceleration by the reconnection electric field – equation (4.1).
The measurements published in Petrasso et al. (Reference Petrasso, Li, Seguin, Rygg, Frenje, Betti, Knauer, Meyerhofer, Amendt, Froula, Landen, Patel, Ross and Town2009) were done under conditions very similar to those in our experiment, namely using a $5\ {\mathrm {\mu }}$ m thick CH foil irradiated by a laser beam with an intensity of $8\times 10^{13}$
 W cm$^{-2}$
 , focused to a diameter of $850\ {\mathrm {\mu }}$
 m. Those results reveal a toroidal magnetic field structure expanding with a velocity of $V_\textrm {in}\approx 5 \times 10^{5}$
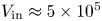 m s$^{-1}$
 , with a peak of the field integral of $\int {B\, \textrm {d} z} = 10$
 T mm, the values we use in our paper. Somewhat higher magnetic field and expansion velocity, $16$
 T mm and $7 \times 10^{5}$
 m s$^{-1}$
 , respectively, were inferred from measurements in Rosenberg et al. (Reference Rosenberg, Li, Fox, Zylstra, Stoeckl, Seguin, Frenje and Petrasso2015b), but they were made at a laser intensity higher by a factor of two.
5.2. Plasma density and temperature
Plasma parameters were probed with temporally resolved Thomson scattering using a $2\omega$ probe beam ($527$
 nm, $50$
 J, $1$
 ns) (Follett et al. Reference Follett, Delettrez, Edgell, Henchen, Katz, Myatt and Froula2016). Scattered light from the probe beam was collected from a localized volume ($50 \times 50 \times 70\ \mathrm {\mu }\textrm {m}^{3}$
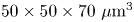 ) centred midway between the two drive beams. The scattering angle was $63^{\circ }$
 , yielding a scattering parameter $\alpha = 1/k \lambda _\textrm {de} = 1.2$
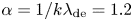 for typical plasma parameters (i.e. the collective regime). The collected light was scattered from electron plasma waves, which can provide information on the electron density and temperature, passed through a spectrometer with a wavelength resolution of $0.5$
 nm and imaged onto a streak camera with a temporal resolution of $50$
 ps. The scattered signal was streaked for $1$
 ns starting $1.5$
 ns after the drive beams.
To perform error analysis, we employ a Monte Carlo approach in which the extracted plasma parameters represent the mean value over 50 fits, with error bars corresponding to the standard deviation. In all cases, the electron plasma wave spectra fits assumed a Maxwellian velocity distribution.
The results depicted in figure 9 show a nearly constant electron temperature $T_e \approx 400$ eV over the probed time range, and a slowly increasing density that plateaus around $n_e \approx 1.5 \times 10^{19}$
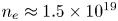 cm$^{-3}$
 .
.
Time evolution of the plasma density $n_e$ and electron temperature $T_e$
 .
.

6. Conclusions
In this series of experiments, electron energization during collision and merging of plasma plumes was studied and a positive energization in the interaction and merging of the two plumes was demonstrated. To isolate the merging as an acceleration source, the electron energy spectra obtained from two-plume collision shots are compared with the spectra from single-plume shots. It was established that even for a case of a single plume, a copious amount of energetic electrons with energies reaching hundreds of keV were present. For colliding and merging plasma plumes, electrons are additionally accelerated by several tens and up to hundreds of keV. We emphasize here that this kind of comparison of merging and ‘null’ shots, a comparison which, to our knowledge, has not previously been reported, is absolutely crucial for positively identifying the effect of merging and/or reconnection.
Our estimates and simple model simulations demonstrate that the electron energization due to the Fermi effect and/or to the electric field induced in the current sheet region is much lower than the observed gain. This observation makes us conclude that some other mechanisms are involved, for example the betatron effect in the dynamically changing magnetic field during the merging and/or reconnection. The energy gain due to the betatron effect is proportional to the particle initial energy, in agreement with the experimental signatures.
While the electron energization by the betatron effect sounds like a potentially compelling explanation, it is not inherently related to reconnection, per se. To better differentiate between the two mechanisms, we plan to conduct experiments with colliding parallel magnetic fields, similar to what was done in Rosenberg et al. (Reference Rosenberg, Li, Fox, Igumenshchev, Seguin, Town, Frenje, Stoeckl, Glebov and Petrasso2015a). In those types of shots, the reconnection would be eliminated, but the possibility for the betatron effect still remains because of the field amplification during collision. In addition, employing spatially and temporally resolved measurements of energized electron populations (e.g. via Thomson scattering or X-ray imaging) may be able to discern further between possible energization mechanisms.
Acknowledgements
The authors acknowledge the support of the University of Rochester and the New York State Energy Research and Development Authority.
Editor Dmitri Uzdensky thanks the referees for their advice in evaluating this article.
Funding
This work was supported through LaserNetUS at the OMEGA EP facility (contract number DE-SC0020005) and by the Department of Energy National Nuclear Security Administration (award number DE-NA0003856).
Declaration of interest
The authors report no conflict of interest.


 Open access