


1. Introduction
To gain and retain office, political parties can target some groups of voters with specific policies. While ethnic, cultural and religious groups are prone to such targeting, single-member district electoral systems favour geographically targeted spending (Milesi-Ferretti and Rostagno, Reference Milesi-Ferretti, Perotti and Rostagno2002). This is often referred to as pork-barrelling, or as a form of distributive politics: in order to increase its likelihood of re-election, a government may spend more money in targeted districts. Importantly, if electoral motivations sometimes reinforce normative expectations about the workings of representative democracy and governments’ courses of action (such as pledge fulfillment and responsiveness), it is difficult to attribute normative objectives to pork-barrelling. Quite the opposite: pork-barrelling may actually favour inequality and inefficiency in the distribution of public resources.
The objective of this article is to examine the presence of geographically targeted spending in analyzing the allocation of infrastructure projects in Canada. Pork-barrelling is a well-studied theoretical perspective and an empirical reality in several different countries (Golden and Min, Reference Golden and Min2013), but few studies have tested the presence of political discretion in allocative decisions in Canada. The exceptions are a handful of studies that focussed on the province of Quebec. Our research thus contributes to the literature by analyzing for the first time the allocation of infrastructure spending across all Canadian regions.
Building on previous studies, we expect ridings represented by the governing party to be advantaged in the allocation of infrastructure projects. In addition, we test two main assumptions regarding which districts are generally targeted by political elites: swing districts or core/loyal districts. Targeting swing districts (opposition or government-held) calls for increasing and thus securing government support in ridings that were won or lost by a slight margin (Lindbeck and Weibull, Reference Lindbeck and Weibull1987). Targeting core/loyal districts, in contrast, calls for rewarding supporters and maintaining their support (Cox and McCubbins, Reference Cox and McCubbins1986; Dixit and Londregan, Reference Dixit and Londregan1996). In addition to these electoral motivations, we investigate whether characteristics of Members of Parliament (MPs), such as seniority or holding a cabinet position, influence the allocation of infrastructure projects in Canada, given that these characteristics may affect MPs’ ability to attract projects to their own districts.
We test these expectations by analyzing the distribution of Infrastructure Canada's funding across federal electoral districts between 2006 and 2018. Our dataset covers 7,728 projects that amount to $9.5 billion, granted across 215 non-urban ridings. Unfortunately, the dataset did not allow us to include urban districts, which in turn limits the generalizability of our results. What we are able to show is that non-urban governmental districts receive on average more money than opposition districts and that this is even more the case in loyal government districts—as predicted by the core district hypothesis. Surprisingly, these results apply only to the governments of the Conservative Party of Canada; we do not find such effects under governments of the Liberal Party of Canada. Finally, cabinet ministers and senior MPs are not better positioned to attract additional projects or funding in their district relative to other representatives.
2. Geographically Targeted Spending in Canada
Most studies of distributive politics in Canada focus on the case of Quebec (Joanis, Reference Joanis2011; Mehiriz and Marceau, Reference Mehiriz and Marceau2013; Mehiriz, Reference Mehiriz2014) and ask whether government districts are advantaged in the allocation of public resources compared to districts held by the opposition. A related question concerns which government districts are targeted by political officials: Is it swing districts, which are won by a small margin of victory and are key battlegrounds for re-election? Or is it core districts, which should be rewarded for their loyalty toward the governing party? As we develop further in the theory section, political elites in government may have good reasons to target both types of district. In the case of Quebec, empirical results indicate that government districts are advantaged in the allocation of infrastructure projects (Joanis, Reference Joanis2011; Mehiriz and Marceau, Reference Mehiriz and Marceau2013; Mehiriz, Reference Mehiriz2014). There is less consensus, however, with respect to the type of districts targeted by political officials. For example, Joanis (Reference Joanis2011) examines the allocation of roadwork expenditures in Quebec between 1986 and 1991 and finds that core government districts received the most funding, while Mehiriz (Reference Mehiriz2014) shows that swing districts tend to be targeted for infrastructure spending in the province.
Only one study examined political discretion at the federal level in Canada, but this analysis is limited to two Canadian regions. Milligan and Smart (Reference Milligan and Smart2005) analyzed the distribution of regional grants by the federal economic development agencies in Quebec and in the Atlantic provinces over the 1988–2001 period. Their results indicate that swing districts, districts represented by the governing party and districts represented by a senior MP tend to receive more funding.
While these studies provide significant evidence of political influence in the allocation of infrastructure projects in some Canadian regions, they suffer from some important limitations. First, no published study on distributive politics and geographically targeted public spending covers the entire country. Importantly, we may wonder whether the empirical results from Quebec are generalizable to other provinces or if they describe an exceptional context that is specific to Quebec politics. Indeed, collusion in the construction industry between firms and political officials has tainted Quebec politics in the last few decades. A series of scandals at the municipal and provincial levels of governments led to a public inquiry in 2011 on the management of public construction contracts (the Commission of Inquiry on the Awarding and Management of Public Contracts in the Construction Industry), as well as a permanent task force to prevent corruption in public procurement (the Unité permanente anticorruption).
Second, it is worth noting that the agencies analyzed by Milligan and Smart (Reference Milligan and Smart2005) are the sole responsibility of the federal government, with no provincial input, which makes them more likely to be subject to pork-barrelling compared to the Infrastructure Canada projects we analyze below, which are a joint federal-provincial responsibility. Finally, Milligan and Smart's data are limited to the 1988–2001 period, which covers the time frame during which the sponsorship scandal unfolded and which in turn led to the creation of the Gomery Commission in 2004. The Conservative Party of Canada, elected in 2006, campaigned on an anti-corruption agenda against what they perceived as a lack of accountability by the Liberal Party of Canada, which had been in office during the sponsorship scandal. The Federal Accountability Act adopted by the Conservatives in 2006 enhanced the power of the auditor general and reduced personal donations to political parties precisely to reduce political interference with allocative decisions (Canada, 2006). This shift in context may have significantly changed whether political officials engaged in distributive politics in Canada. Overall, there are reasons to believe that the empirical findings from Quebec and from the period leading to the sponsorship scandal are not necessarily generalizable to other Canadian regions or more recent time periods.
2.1 The case of infrastructure projects in Canada
The shortage of studies on distributive politics in Canada is mainly due to a lack of available data. As highlighted by the parliamentary budget officer, it has been difficult to find official data on infrastructure projects in Canada because the programs are generally scattered across different government agencies (Fréchette, Reference Fréchette2018). Fortunately, Infrastructure Canada recently released a dataset covering all infrastructure projects funded between 2002 and 2018. Importantly, these infrastructure projects are distributed across all Canadian provinces and were funded during a more recent period than previous studies have covered. These are the projects we examine in this article.
Projects funded by Infrastructure Canada are structured by three rounds of bilateral agreements between provinces and the federal government and by the rules governing the allocation of the Gas Tax Fund.Footnote 1 Under these application-based programs, municipalities need to apply for infrastructure project funding. A joint committee, co-presided by a provincial and a federal civil servant, reviews the demands and prioritizes which projects should be funded based on the program's criteria, all of which are subject to the limits of funding available for each province as established by the agreement. The federal-provincial bilateral agreements were modified in 2018. Provincial officials are now responsible for identifying and prioritizing the projects to be submitted to Infrastructure Canada, but Infrastructure Canada can refuse the project if it does not meet the program's criteria. Thus, the 2018 modifications to the agreements significantly decrease the possibility of distributive policies in infrastructure spending—at least by the federal government.Footnote 2
The possibility of political discretion from the federal government occurs, presumably, at the last stage when projects are analyzed and selected by the joint provincial-federal committee and then when the minister responsible for Infrastructure Canada approves the funding. How exactly the channels of political influence operate on the federal public servant and/or the cabinet minister remain unclear in the decision-making process we study.
In theory, the decision-making process of infrastructure projects’ prioritization that we analyze is conducted by neutral civil servants at the provincial and federal levels. Canada's bureaucracy follows the Whitehall model, in which bureaucrats’ role is to “speak truth to power”: civil servants are not political appointees; they are neutral, recruited by a meritocratic process and enjoy security of employment (Wilson and Barker, Reference Wilson and Barker2003). Independent bureaucrats are, presumably, shielded from political pressures to use distributional policies for political purposes, and so policy outcomes should reflect legal-rational considerations.
Of course, there may be a gap between official rules and informal practices. Indeed, the relationship between civil servants and politicians has become more politicized in recent decades in Whitehall countries, in general, and in Canada, in particular (Aucoin, Reference Aucoin2012). This has also been underlined by André Juneau (Reference Juneau, Allan, Gordon, Hanniman, Juneau and Young2018), the first deputy minister of Infrastructure Canada, who suggested that the federal infrastructure minister, as well as the regional federal ministers, may have some influence over the allocation of projects. This influence may explain why some municipalities raise concerns about the lack of transparency when it comes to the funding criteria. In evaluations of federal infrastructure spending conducted by the House of Commons or the Senate, municipalities regularly complain that the funding criteria, sometimes described as a “lottery,” are not transparent enough (Smith and Cools, Reference Smith and Cools2017; Sgro, Reference Sgro2018).
Other channels of political influence are also possible. The Prime Minister's Office (PMO) may influence the cabinet minister directly or reach out to MPs from specific districts with the objective of mobilizing relevant actors in their region to propose infrastructure projects. It is also possible that government MPs and their political staff are more likely to know about the available programs and to help municipalities in their districts to navigate the bureaucratic processes to secure project funding. In contrast, opposition MPs and their political staffers might be less connected to government programs or more suspicious of their efficiency and thus less likely to help the municipalities in their districts get the funding they need. Moreover, government MPs might develop personal relationships with cabinet ministers who may be able to tilt the decision-making process in favour of a project within their district (Suiter and O'Malley, Reference Suiter and O'Malley2013). For example, MPs serving in different executive functions (such as whip, junior minister or parliamentary secretary) may have privileged access to cabinet members (Thomas and Lewis, Reference Thomas and Lewis2019).
Overall, there are different paths through which federal policy makers may influence and skew the allocation of infrastructure projects. Our study, however, does not open this black box. We believe that interviews with decision makers involved in the allocation of these projects will be essential to better grasp the mechanisms underlying the outcomes we analyze since, to our knowledge, no study has identified the channels of influence explaining political discretion in project allocation in Canada. We discuss this crucial issue again in the conclusion.
2.2 Why are infrastructure projects prone to political discretion?
Studies of distributive politics often examine the role of electoral politics on infrastructure projects since they are visible and easy to target geographically. These are important conditions if the objective of policy makers is to gain electoral support in specific regions. Indeed, voters generally reward governments for additional spending in their districts (Levitt and Snyder, Reference Levitt and Snyder1997; Chandler, Reference Chandler2011; Golden and Min, Reference Golden and Min2013). However, a caveat to consider is that total infrastructure spending of the Government of Canada represents only a small proportion of federal program expenditures (3.6% in 2017–2018).Footnote 3 Federal policy makers could thus have weaker incentives to intervene in the distribution of projects given the relatively small amount of money involved. For two reasons, we think that this is not the case.
First, infrastructure is one of the largest discretionary spending items in the budget and one of the few policies that governments can actually use to target specific geographic districts (Breunig and Busemeyer, Reference Breunig and Busemeyer2012).Footnote 4 Indeed, there are relatively few areas of discretionary spending left to governments, as the growing cost of entitlement spending squeezes out discretionary spending (Streeck and Mertens, Reference Streeck and Mertens2011; Jacques, Reference Jacques2020). Moreover, in the context of fiscal pressures on public finance, there is little room to implement popular new entitlements. Governments are looking for “affordable credit claiming”: relatively non-costly policies that have a visible positive impact on citizens for which governments can claim credit, such as infrastructure projects (Bonoli, Reference Bonoli, Bonoli and Natali2012).
Second, federal infrastructure projects are visible to constituents even if they are small in size in comparison to other federal expenditures. Projects are generally visible to the public given their nature (for example, road and bridge construction). Also, the Government of Canada issued clear and mandatory signage guidelines for communicating with the public (Canada, 2018). A recent study by Marland et al. (Reference Marland, Lewis and Flanagan2017) even suggested that governments intend to make signage visually similar to their own partisan colours. For example, they argue that the Canada Economic Action Plan was built as the master brand of the Conservative government and consistently used as a marketing tool. For these reasons, we assume that projects funded by Infrastructure Canada may be subject to political interference.
However, the presence of federal institutions and the non-integration of federal and provincial party systems make political discretion in Infrastructure Canada's projects more difficult to achieve, when compared to analyses focussed on a single province or on a program managed solely by the Canadian government. Indeed, infrastructure projects are funded by three levels of government. While the dataset captures all projects directly funded by the federal government, the projects are all implemented in co-operation with provinces (for example, sharing the cost 50/50) and sometimes with municipalities (for example, sharing the costs one-third for each government) (Juneau, Reference Juneau, Allan, Gordon, Hanniman, Juneau and Young2018; Smith and Cools, Reference Smith and Cools2017). This structure of decentralized federalism with joint decision making may help prevent pork-barrelling. The capacity of the federal government to target specific electoral districts may be hampered by the different objectives pursued by provincial or even municipal governments (Nicholson-Crotty, Reference Nicholson-Crotty2005).
Also, while it is conceivable that this coordination problem could be overcome if the federal and provincial party systems were integrated, this is not how it works in Canada (Chhibber and Kollman, Reference Chhibber and Kollman2009). Because of Canada's non-integrated party system, the funding sources, recruitment patterns, membership and activists of provincial and federal branches of parties tend to differ (Stewart and Stewart, Reference Stewart and Stewart1997). Moreover, Dickson (Reference Dickson2009) found that provinces represented by the same provincial and federal parties do not receive more federal transfers than those represented by different parties, confirming the view of an absence of coordination across jurisdiction levels. In fact, the party system is characterized by regionalization (Pruysers et al., Reference Pruysers, Sayers and Czarnecki2020). In contrast, in an integrated party system, co-partisans could help each other by agreeing to target spending to specific districts benefiting the other level of government, such as what Tavits (Reference Tavits2009) found in the Scandinavian context. Indeed, if central parties could discipline co-partisans in provinces, it would be easier for them to implement a unified policy agenda transcending jurisdictional divisions (Rodden, Reference Rodden2006), but this is not the case here. As explained below, we account for this possibility in the empirical models.
Overall, we believe that the projects funded by Infrastructure Canada represent a unique opportunity for studying distributive politics across all Canadian regions and during a period in which legislative changes were made to reduce potential corruption. Importantly, infrastructure programs today represent the most important discretionary spending left to the federal government. If geographically targeted spending does occur in Canada, infrastructure projects are the (only) type of program to consider.
3. Expectations
When it comes to the allocation of infrastructure projects in Canada, our main expectation is that government districts will be favoured over opposition districts. This assumption is based on and consistent with the results of previous studies that focussed on Quebec, the Atlantic region and other countries (Golden and Min, Reference Golden and Min2013).
Hypothesis 1 Government districts receive more funding than opposition districts.
While scholars generally expect government districts to be favoured, there is much debate regarding which types of districts should be targeted among government districts. Rooted in formal modelling, two different answers—which represent the micro-foundations of theories of distributive politics—have been proposed: the swing voters/districts model and the core voters/districts model.
3.1 The swing voters/districts hypothesis
The swing voters model predicts that core voters, whose ideological intensity is strong, are less likely to be targeted than swing voters with weak ideological intensity (Lindbeck and Weibull, Reference Lindbeck and Weibull1987). Additional public expenditures are less likely to change the minds of voters with strong ideological attachment compared to voters with weak ideological attachment; hence, rational decision makers should allocate scarce resources to the latter. In other words, swing voters could be persuaded by additional public spending, while core voters cannot. Milesi-Ferretti et al. (Reference Milesi-Ferretti, Perotti and Rostagno2002) argue that single-member districts (SMDs) encourage governments to reward geographically based constituencies with locally visible projects in swing districts that may be pivotal to a government re-election. The seat-vote disproportionality inherent to SMD systems also prompts parties to target swing districts since a small difference in votes in key electoral districts may create a large difference in seats (McGillivray, Reference McGillivray2018). In addition, the capacity to use the distribution of public spending in accordance with the incentives provided by the electoral system depends on the governing party's strength relative to its members. Strong governing parties can discipline MPs and coordinate actions to channel public spending toward key districts (McGillivray, Reference McGillivray2018). Evidence of targeted public spending toward swing districts has been found in Westminster parliamentary systems by Ward and John (Reference Ward and John1999) in England and by Denemark (Reference Denemark2000) in Australia.
Canada's SMD electoral system encourages politicians to compete at the local level while also respecting the party line, due to Canada's strong party system (Soroka et al., Reference Soroka, Penner and Blidook2009) and the centralization of power in the prime minister's office (Savoie, Reference Savoie1999). Strong governing parties, controlled by the prime minister's office, can easily choose to distribute public funding toward swing districts, especially in an era characterized by the increasingly sophisticated use of marketing techniques to target key voters (Delacourt, Reference Delacourt2013).
It is important to note that swing districts can be held by the government or by opposition parties. Both types of district are crucial to the re-election chances of the governing party. The prediction that swing opposition districts might be targeted by governments assumes that in a parliamentary system where elections are party-centred, voters may reward the governing party—and not the incumbent from the opposition party—for the extra funding received in swing districts (Persson and Tabellini, Reference Persson and Tabellini2004; Ward and John, Reference Ward and John1999). This is empirically supported by the fact that elections are party-centred in most parliamentary systems and especially so in Canada, which decreases both the importance of and the opportunity for credit claiming by local candidates (Blais et al., Reference Blais, Gidengil, Dobrzynska, Nevitte and Nadeau2003). This differs markedly from the American context where Senate and House of Representatives elections are much more candidate-centred and thus credit claiming for projects is a widespread electoral strategy (Mayhew, Reference Mayhew1974). We thus offer the following hypothesis:
Hypothesis 2 Swing governmental and opposition districts receive more funding than other districts.
3.2 The core voters/districts hypothesis
The core voters hypothesis assumes that risk-averse governments target expenditures to loyal supporters that are more easily identifiable and more reliable than swing voters (Cox and McCubbins, Reference Cox and McCubbins1986). In particular, governments have an informational advantage about their core voters, making it easier to target them effectively with projects corresponding to their preferences. This represents a less risky and less costly strategy than targeting swing voters imprecisely and with potentially inadequate projects (Dixit and Londregan, Reference Dixit and Londregan1996). This prediction, however, relates to politicians’ actions within their own constituencies.Footnote 5 Scholars have extended this rationale to the targeting of core districts by governments. Targeting swing districts still represents a high-risk, high- reward strategy, given that it could end up rewarding opposition districts, as the government is uncertain to win the swing district (Joanis, Reference Joanis2011). Moreover, a government looking beyond the next election could be interested in securing core voters and districts’ long-term support (Joanis, Reference Joanis2011). Thus, targeting core districts is a low-risk, future-looking strategy. Since Canadian parties are broad coalitions of divergent regional interests, public spending to core districts can be a tool to cement the electoral coalition of the governing party and reward loyalty. In fact, Leigh (Reference Leigh2008) and Joanis (Reference Joanis2011) evaluate cases of SMDs with strong parties (Australia and the province of Quebec) and find that governments tend to reward core districts. This finding leads to an additional hypothesis:
Hypothesis 3 Core governmental districts receive more funding than other districts.
We recognize that hypotheses 2 and 3 may look contradictory, given their different theoretical underpinnings. Rather than choosing sides, we propose both hypotheses for two reasons. First, there is evidence supporting each expectation in the Canadian context: Joanis (Reference Joanis2011) supports the core hypothesis, while Milligan and Smart (Reference Milligan and Smart2005) support the swing hypothesis. Second, these hypotheses are not mutually exclusive in practice. We may think of a government rewarding core government districts with extra funding while targeting, at the same time, crucial swing districts to secure re-election (government districts won by a moderate margin of victory would be less targeted). Consequently, we do not have strong views about which model should prevail in the Canadian context and assume instead that we may observe both possibilities.
3.3 Seniority and cabinet ministers
While we expect governments to target their own districts, it is possible that MPs with more experience or with more responsibilities may influence the project attribution process as well. Indeed, the channels of political influence remain unclear in the decision-making process we study. The mechanisms motivating hypotheses 1, 2 and 3 mostly relate to a top-down process in which the prime minister's office influences civil servants to target specific districts (either directly or via the minister responsible for Infrastructure Canada). However, it is also plausible that experienced MPs, often from core districts or sitting at the cabinet table, are better able to help municipalities in their own district to navigate the bureaucratic process and to propose projects that are more likely to respect the program's criteria to be funded by Infrastructure Canada. Incumbents generally have an electoral advantage in Canada (Blais-Lacombe and Bodet, Reference Blais-Lacombe and Bodet2017), and their parliamentary experience could presumably help them to attract more projects and funding in their districts. Milligan and Smart (Reference Milligan and Smart2005) showed that cabinet ministers bring more funding to their own constituencies than do backbenchers. MPs’ resources (that is, seniority or holding a cabinet position) could be crucial for successfully obtaining additional projects and money for their districts. We thus propose the following two hypotheses:
Hypothesis 4 Districts represented by cabinet ministers receive more funding than districts represented by government backbenchers and opposition MPs.
Hypothesis 5 Districts represented by senior MPs receive more funding than districts represented by junior MPs.
4. Data
To test our hypotheses, we need data on government spending sharing three characteristics: visibility, a geographical dimension and some degree of political discretion by the federal government. To this end, we mobilize a new dataset released by Infrastructure Canada listing all the infrastructure projects funded by the federal government from 2002 to 2018 in Canadian municipalities and merge it with Elections Canada data matching municipalities to federal electoral districts. Infrastructure Canada was created in 2002, but few projects were funded in the first years, presumably because it took some time to initiate the program. We thus restrict the analysis to the post-2005 period, which covers the Harper (Conservative) and Trudeau (Liberal) governments.
The final beneficiaries of projects funded by Infrastructure Canada are municipalities. To locate them geographically in federal electoral districts, we merged them with a list of all municipalities in each federal electoral district provided by Elections Canada. Several coding decisions were necessary to assemble the final dataset. These decisions are explained in detail in the online appendix. Since some municipalities encompass many electoral districts, we had to eliminate infrastructure projects that were allocated to a municipality covering more than one riding because we could not identify the district in which the project was located. This decision removed urban districts and some suburban districts from our dataset. These coding decisions left us with 7,728 projects from a total of 13,227 listed in the Infrastructure Canada dataset, which represents 58.4 per cent of all projects. Overall, our dataset is restricted to 215 non-urban federal electoral districts.Footnote 6
Given these data, it is important to keep in mind that our conclusions apply only to non-metropolitan ridings. Whether our results are generalizable to urban districts remains an open question that future studies might consider. As well, it is important to recognize that the patterns of party competition differ across urban and non-urban districts. In particular, the Conservative party generally gathers more support in rural areas than in metropolitan areas (Gidengil et al., Reference Gidengil, Blais, Everitt, Fournier and Nevitte2012). This finding is also reflected in our data. Under Conservative governments, districts represented by an MP from the government represent a majority of the ridings (52%, 60% and 62%, respectively, under the Thirty-ninth, Fortieth and Forty-first Parliaments), which was not the case under the Liberal government (38%). Overall, this pattern indicates that the districts in our dataset are more Conservative than average and that the government in office for the majority of the time period we analyze relies on non-urban districts to win elections. This overrepresentation of Conservative ridings and the exclusion of urban districts may actually facilitate the discovery of pork-barrelling, since these districts are more likely to be targeted by Conservative governments. Nonetheless, this feature of the data does not weaken the internal validity of our results with respect to geographically targeted spending under Conservative governments.
4.1 Measurements
Our main dependent variable is the amount of money spent per federal electoral district. In the online appendix, we also present models using the number of projects funded per district, which produces very similar results. Infrastructure data are provided annually, but we transformed the data to a parliament-level of analysis (see the appendix for more details). For each riding and parliament, we compute the total amount of money allocated. The four parliaments covered by the data are the Thirty-ninth (2006–2008), Fortieth (2009–2010), Forty-first (2011–2015) and Forty-second (2016–2018) Parliaments.
Note that the amount of money spent per district is right-skewed and that post-estimation diagnostic tests (skewness and kurtosis test of normality) indicated that the residuals are not normally distributed, which might be problematic for inference tests. We thus apply a logarithmic transformation of the dependent variable to approximate a normal distribution. The results, however, are substantively the same whether we use the dependent variable untransformed (see Table A3 in the appendix) or its square root transformation (another possible correction for approximating a normal distribution—see Table A2 in the appendix). While we display the results of the log transformation as our main models, our substantive discussion of the results is based on the transformation of the dependent variable back to its original scale.Footnote 7 Importantly, this transformation to the initial measurement scale corrects for the diminishing effect of margin of victory on spending as imposed in the log models.
There are four main independent variables associated with our hypotheses. Government is a dummy variable coded 1 when a riding is represented by a member of the governing party and coded 0 otherwise. Cabinet minister is a dummy variable coded 1 if the district is represented by a cabinet minister and coded 0 otherwise. According to hypotheses 1 and 4, we expect both government and cabinet minister to have a positive impact on the amount of money spent in a federal electoral district. To test hypothesis 5, we count the number of times an incumbent MP won re-election.
To test hypotheses 2 and 3 with respect to the impact of core (swing) governmental ridings, we follow common practice and use the margin of victory at the last federal election in this riding (Joanis, Reference Joanis2011; Milligan and Smart, Reference Milligan and Smart2005; Tavits, Reference Tavits2009). Margin of victory is computed as the difference in the vote share of the winning candidate and the runner-up. Hypotheses 2 and 3 predict that swing and core governmental districts should receive more money.Footnote 8 Consequently, we expect a curvilinear relationship (U-shaped) between margin of victory and money spent for governmental districts: government districts won by a small and large margin of victory would receive more money than governmental ridings won by a moderate margin of victory. We detail below the specification of the interaction model. Conversely, we expect opposition districts won by a smaller margin of victory to be advantaged in terms of funding compared to opposition districts won by a larger margin of victory.
5. Model Specifications and Confounding Factors
The unit of analysis in our next models is the riding. Observations are clustered within ridings—up to a maximum of four observations per riding (that is, for those ridings that did not change at the 2013 redistricting)—and serial correlation is possible given the time ordering of the data. A Wooldridge test for serial correlation in panel-data models revealed no serial correlation. We also conduct tests of cross-sectional dependence but did not find evidence of spatial correlation across districts.Footnote 9 To account for clustering at the riding level, we use clustered robust standard errors at the riding level.
In order to ensure that the bias in project allocation we find is the result of political decisions and not just of a reflection of population needs for public investment, we use generalized least squares (GLS) regressions with random-effects and control for geographic and socio-demographic variables using the Statistics Canada census.Footnote 10 The control variables are mostly informed by those employed in previous Canadian studies on distributive politics (Joanis, Reference Joanis2011; Mehiriz and Marceau, Reference Mehiriz and Marceau2013; Mehiriz, Reference Mehiriz2014). Education (measured by the percentage of the population with no degree), the median income after tax (in thousands of dollars) and the employment rate together capture socio-economic characteristics. Governments may prioritize spending in poorer districts with low employment rates to favour economic development in those areas. Similarly, districts with a larger proportion of individuals without degrees are disadvantaged in a knowledge economy and may need more public investments. The variables population density (in thousands) and total population (in thousands) together get to the size and composition of a district: a very large district with a very low density will have different needs than a typical rural district closer to city centres. Similarly, a riding subject to an important increase in its population would have different needs in infrastructure than a riding with a stable or decreasing population. In each model, we also control for the alignment of governments between the federal and provincial level with a dummy variable coded 1 when the government of a province is of the same partisan affiliation as the federal government, given that this partisan congruence might ease distributive politics.Footnote 11
While the relationships between these control variables and infrastructure expenditure are mostly straightforward, we must recall that control variables need to be correlated to the main independent variables to be relevant. Otherwise, if there is no correlation between an independent variable and a control variable, the inclusion or not of the latter will not influence the effect (coefficient) of the independent variables (Wooldridge, Reference Wooldridge2015: 78–81). We might expect a correlation between the socio-economic controls and the independent variables, given that citizens with higher socio-economic status tend to favour the Liberal party of Canada (Gidengil et al., Reference Gidengil, Blais, Everitt, Fournier and Nevitte2012). In any case, it seems to us a more conservative strategy to account for these socio-economic and demographic variables.
Note that the main results below are substantively the same when we employ a fixed-effects (FE) specification at the riding level rather than a random-effects (RE) specification.Footnote 12 Importantly, the risk we face in the current analysis is that the ridings we analyze differ on other characteristics associated with infrastructure needs that we do not account for in our models and that those variables are correlated to our main independent variables of interest, leading to an omitted variable bias. Fixed-effects at the riding level capture by design those types of omitted confounding factors that do not vary over time. Consequently, if some ridings differ on some unobserved (and time-invariant) characteristics that might be related to the main independent variables, these factors are accounted for in our FE estimations. The similarity between the results of the FE and RE model specifications suggests that no unobserved characteristics correlated to the independent variables seem to be omitted.
Finally, in addition to the control variables mentioned above, the models control for provinces and parliaments with a series of dummy variables. Adding these controls is equivalent to introducing fixed-effects at the provincial and parliamentary levels of analysis. The models thus assess the average within-effect of the independent variables across provinces and parliaments. Controlling for provinces is necessary because the amount of money allocated across provinces differs and depends on the federal-provincial bilateral agreements. Also, political dynamics and the degree of federal discretion should vary between provinces. Small provinces with weaker bureaucracies might be more likely to be influenced by federal decision makers, while provinces with a more autonomous conception of federal-provincial relations, such as Quebec, could be less willing to concede influence to the federal government (Fafard et al., Reference Fafard, Rocher and Côté2010). Controlling for parliaments is also important given that governments varied in terms of their partisanship and majority status over the period of study. The first two Harper governments were minority governments, whereas the third Harper government and the Trudeau government were majority governments.
6. Results
In Table 1, we present the descriptive statistics of our dependent variable across the main independent variables (except for margin of victory and incumbency length, given their ratio level of measurement). In particular, we present the average funding received in a district during a parliament. Over the course of a parliament, ridings receive on average $15.8 million. There is, however, a lot of variation across ridings given the size of the standard deviations. Descriptive statistics suggest that districts held by cabinet ministers receive more funding ($20.6 million) than those held by government backbenchers ($16.2 million) or opposition members ($14.2 million). It is this latter group that receives the lowest amount of funding on average. However, a mean-comparison test between the categories of cabinet ministers and opposition fails to reach conventional levels of statistical significance (p = .09 with a one-tailed test). The differences between the other categories are not statistically significant either. Overall, the differences across ridings displayed in Table 1 are in the expected direction but not important enough to be statistically different than 0.
Average Amount of Funding Received per District
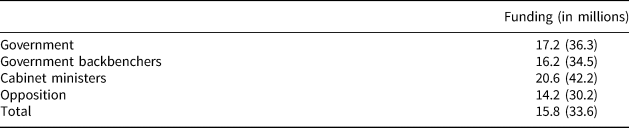
Note: The values indicate the average amount of funding received in a riding over a legislature. Standard deviations are displayed in parentheses.
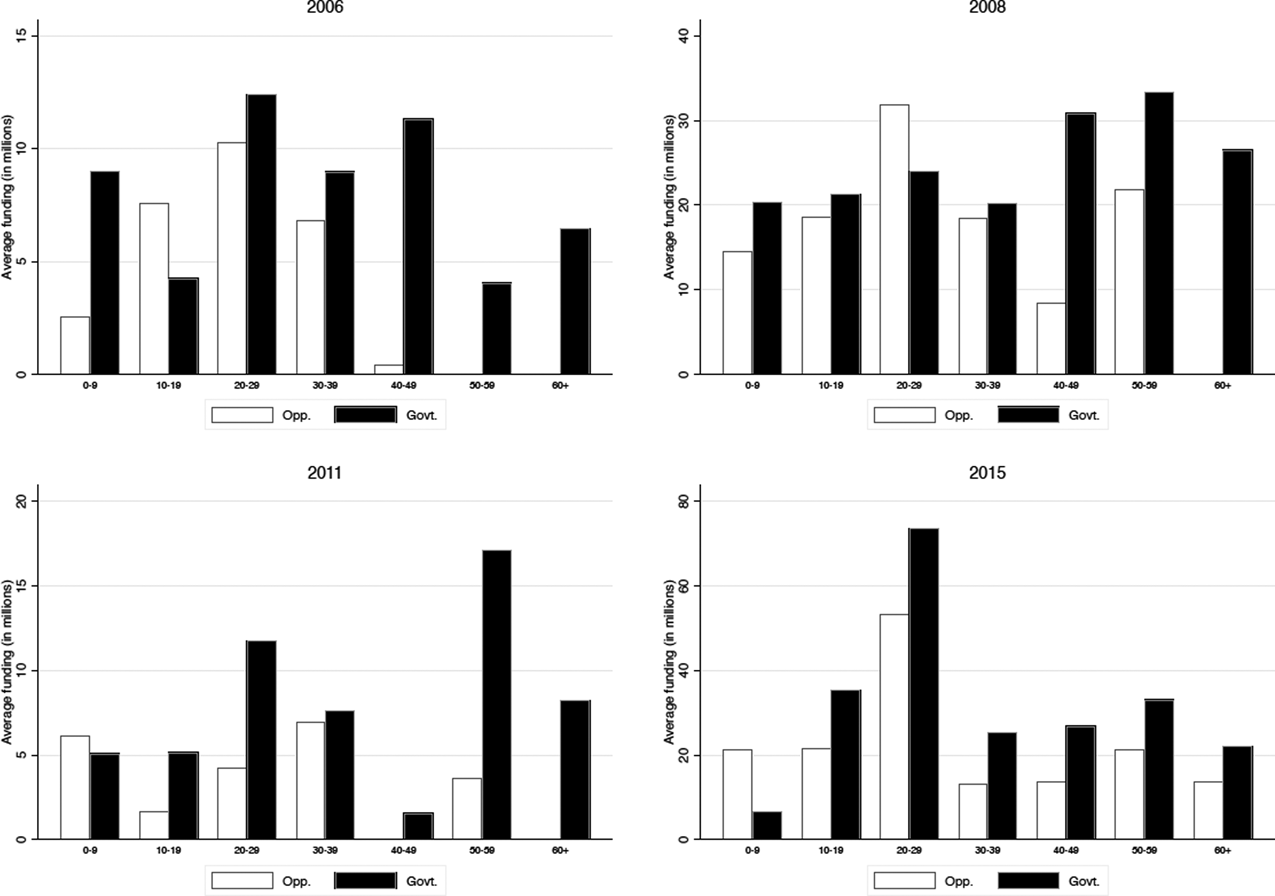
In Figure 1, we present in more detail the relationship between government/opposition districts, margin of victory and the amount of funding received by districts. For the four parliaments under study, the figure displays the average funding received by government and opposition districts across districts’ margin of victory. The results clearly indicate that government districts receive more money on average than opposition districts. This seems to be especially the case for government districts with greater margins of victory.Footnote 13 Those preliminary results are in line with hypotheses 1 and 3.
The Average Amount of Funding Received by Government/Opposition Districts and Margin of Victory.
We now test our hypotheses more systematically by controlling for the socio-demographic profile of each riding. Our main results are displayed in Table 2. In columns (1) and (2), respectively, we present the results of the RE and FE model specifications where we examine the effects of government, cabinet minister and incumbency length. The results in column (1) support our prediction that government ridings receive, on average, more funding than opposition districts (hypothesis 1). This is indicated by the coefficient of government (0.68), which is statistically significant at the .01 level. Note that this coefficient reflects the impact of government on the logarithmic transformation of the dependent variable. The substantive difference between government and opposition districts while accounting for this transformation is actually $7,360,648 over the course of a government mandate. The results are substantively the same in column (2) under the FE specification.
Predicting the Amount of Funding Allocated to Ridings
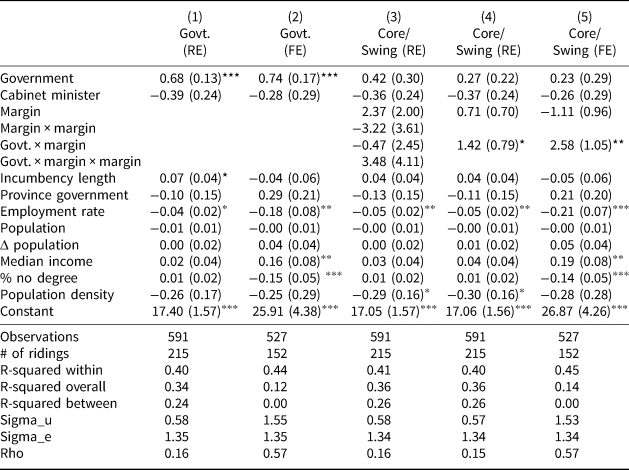
Note: Clustered standard errors in parentheses. Province and legislatures fixed-effects are not displayed. See Table A2 in online appendix for full results.
*p < .1; **p < .05; ***p < .01
On the other hand, the results displayed in columns (1) and (2) do not support hypotheses 4 and 5 with respect to the effect of cabinet minister and incumbency on the amount of funding received in a riding. The effect of cabinet minister is negative and not statistically significant in both columns, while the effect of incumbency is positive as expected in column (1) but only statistically significant at the .1 level and negative and not statistically significant in column (2). We also note here that being represented by a government of the same partisan affiliation at the federal and provincial levels (province government) does not influence infrastructure spending.
In column (3) of Table 2, we present the models testing hypotheses 2 and 3 about the impact of margin of victory under governmental and opposition districts. As predicted by these hypotheses, there is possibly some heterogeneity in the effect of government and margin of victory on project allocation. In particular, we expect government districts won by a small (swing) and large (core) margin of victory to receive more money, while opposition districts won by a small margin of victory should be advantaged as well (swing). To capture this curvilinear relationship (U-shaped) among government districts, we need to interact the dummy variable government with margin of victory and its square and include all the constitutive terms (Brambor et al., Reference Brambor, Clark and Golder2006). This specification also accounts for the negative linear effect of margin of victory expected under opposition districts.
The results in column (3) do not support hypotheses 2 and 3. In particular, none of the coefficients of the interaction terms are statistically significant. The triple interaction in column (3) models if both swing and core governmental districts are targeted, but it is possible that governments target only swing or core districts. In this situation, a simple interaction between government and margin of victory would be sufficient to capture the different effects of margin of victory under governmental and opposition districts. We examine this possibility in column (4). The results suggest that this simple interaction better reflects the data-generating process at hand,Footnote 14 which is indicated by the coefficient of government and margin of victory that is statistically significant at the .1 level. It is also confirmed by the comparison of the predicted values from models 3 (see Figure A1 in the appendix) and 4 (see Figure 2 below), which clearly suggest a linear positive relationship between margin of victory and funding for government districts and not a curvilinear (U-shaped) relationship. Those results are also substantively the same in the FE specification of column (5) (see Figure A5 in the appendix for the corresponding results).
The Predicted Amount of Funding across Margin of Victory and Government/Opposition Districts.

The results displayed in Figure 2 provide support for the core districts hypothesis (hypothesis 3) but not the swing districts hypothesis (hypothesis 2). Note that we transform the predicted values to reflect the amount spent per district in real dollars—that is, without the logarithmic transformation. First, government and opposition districts that were won by a small margin of victory (swing) do not receive more funding. In fact, these are the districts receiving the least amount of money: about $8–10 million on average.
Second, the results indicate that government districts won by a large margin of victory (core) receive more funding than those won by a small margin of victory (swing). The average marginal effects of margin of victory under government districts (the solid black line) is statistically significant at the .01 level.Footnote 15 For each increase of 1 percentage point in margin of victory, government districts receive about $500,000 in additional funding. On the other hand, the average marginal effects of margin of victory under opposition districts (0.71) is not statistically significant, which goes against hypothesis 2. As indicated in Figure 2, opposition districts (the dashed line) receive about the same amount of funding whether the margin of victory is small (about 7.5 million) or high (about 12.9 million). Note that in Table 2, the respective impact of margin of victory in government and opposition districts is statistically significant at the .1 level in the RE specification of column (4) and at the .05 level in the FE specification of column (5).
Finally, we should note that the difference in the amount of funding received by governmental (solid line) and opposition districts (dashed line) is statistically significant at the .05 level only for values of margin of victory greater than 8 percentage points (see Figure A2 in the appendix for the average marginal effects [AME] of government across values of margin of victory). When the margin of victory is 8 percentage points, government districts receive about $2 million more in funding. A government district won by the average margin of victory (23 percentage points) receives about $8 million more in funding than opposition districts.
6.1 Robustness checks
In addition to the different model specifications discussed above, we performed several robustness checks to validate our results, which are all presented in the appendix. First, we use the number of projects allocated to districts as an alternative dependent variable. The results are similar under this specification, although the magnitudes of the effects are smaller than in our previous analyses.
We also provide two additional robustness checks to control for lifecycle effects in infrastructure. We first added a lagged dependent variable to capture lifecycle effects and control for the lumpiness of infrastructure spending. Indeed, the infrastructure needs of a district would be diminished if it received a significant amount of funding during the previous parliament, thus reducing the demand for new funding (see Table A6 in the appendix). Second, we control for provincial infrastructures’ average remaining useful life and for provincial, municipal and private infrastructure investments (see Table A5 in the appendix and our corresponding discussion of these variables). The substantive results are similar to those displayed in Table 2.
We also verify whether outliers drive our main results. As we mentioned, our dependent variable is right-skewed, as a small number of observations received a significant amount of funding. While the logarithmic transformation mostly accounts for these extreme values, it is still possible that outliers significantly influence our estimates. The inspection of the DFBETA measures for our variables of interest does not indicate that some observations have too much influence on the coefficient estimates. On the other hand, DFITS measures (the difference between the predicted values with and without each observation) indicate that some observations may be problematic. Replications of all models indicate that our substantive conclusions remain the same when excluding this group of 57 observations.
Some readers may wonder whether there is an endogeneity problem between infrastructure projects and the variable margin of victory. In particular, some could argue that there is possibly a reverse causation where the amount of money received in a riding also influences the margin of victory of the government in the riding at the next election (t + 1). While this is a possibility, we believe that our model specifications are not prone to this endogeneity issue. First, the time ordering of our measures is important to consider. We measure the amount spent in a district during a parliament (that is, between elections), while the margin of victory is measured at the time of the previous election. Second, we directly examine the possibility that the funding received in a riding influences the margin of victory and the government status of the riding at the next election but found little evidence supporting such claims—see Table A11 in the appendix.
6.2 The Harper and Trudeau governments
The final robustness check that we performed consisted of replicating the results separately for the Harper and Trudeau governments. This robustness check yields significant differences between the Harper and Trudeau governments in terms of allocation of projects and funding. In particular, no forms of distributive politics seem to occur under the Trudeau government (the coefficient of government incumbency on the amount of funding received in a district is −0.08). The impact of government, cabinet ministers and margin of victory (and its related interactions) are all statistically insignificant, whether it pertains to the number of projects or the amount of funding received (see Tables A9 and A10 in the appendix). The conclusions that we draw above are driven by the Harper governments (the coefficient of government incumbency is 0.83); see Tables A7 and A8 and Figures A7 and A8 in the appendix.
It is not possible to know if this finding reveals genuine differences between the Harper and Trudeau governments or if it is driven by the small number of cases of the latter. After all, Figure 1 suggests that government districts under the Trudeau government also receive more funding. However, it is possible that the 2018 reform led to a migration of political discretion from the federal to the provincial level, as provinces are now leading the decision-making process. Also, since the Conservatives relied on non-urban districts to win elections, they might be more tempted than the Liberals to target the districts we study. A dataset including cities may uncover political discretion by Liberal governments in those districts, given that they represent their core constituencies.
7. Conclusion
Our analysis finds that government districts, especially core government districts won by significant margins, tend to receive more money than opposition districts. No prior study had found such a pattern of political discretion at the federal level in Canada. While this is an important finding, we acknowledge that this conclusion applies only to non-urban ridings, since it was not possible to analyze urban electoral districts. Future studies with additional data should verify whether our conclusion applies to urban districts.
Interestingly, swing districts are not targeted for political purposes, despite Canada's SMD electoral system with strong parties. In contrast, our findings provide support for Joanis's (Reference Joanis2011) model of risk-averse governments rewarding core supporters to build a long-term relationship with them to guarantee their support in future elections. This argument suggests that Canada is a political environment in which parties have stronger incentives to prioritize their efforts on energizing their core supporters and cementing their electoral coalition, rather than focussing on expanding their base. However, as Joanis (Reference Joanis2011) mentions, it is possible that durable public goods, such as roads, are used to reward core constituencies and build long-term relationships, while more “fungible” policies, such as tax credits, could be used to target swing voters in the short term. Thus, studying other types of expenditures beyond infrastructure spending represents a fruitful avenue of research.
In contrast to the findings of other studies in Canada (Mehiriz and Marceau, Reference Mehiriz and Marceau2013; Milligan and Smart, Reference Milligan and Smart2005) or in similar countries (Denemark, Reference Denemark2000; Suiter and O'Malley, Reference Suiter and O'Malley2013), our models reveal that cabinet ministers and senior MPs are not able to secure additional funding for their own districts. This finding supports the idea that the influential role of cabinet ministers is gradually fading, presumably because of the centralization of power toward the prime minister in Canada (Savoie, Reference Savoie1999). The null effect of MPs’ individual characteristics also reflects the weak power of the legislature vis-à-vis the executive (Thomas and Lewis, Reference Thomas and Lewis2019).
The main contribution of our article is to reveal a robust empirical association between electoral politics and the allocation of infrastructure projects in the Canadian case. This was done by controlling for confounding factors to safeguard against a spurious relationship. An important limit of our research, however, is that we do not shed light on the channels of political influence that distort the distribution of infrastructure projects across the country. We discussed several possibilities, but we are not able to identify the main causal mechanisms in this study. In-depth interviews with decision makers could help identify the causal mechanisms at the root of the relationships our study revealed. That said, we are convinced that the systematic analysis of infrastructure data undertaken in this article remains necessary. Indeed, evidence of political influence resulting from elite interviews would not quantify the magnitude of the problem and would not represent evidence of systematic distortion in the allocation of projects. Overall, our research reveals that political discretion and geographically targeted spending in the distribution of infrastructure projects occurs in Canada, and it also calls for qualitative research to better understand the mechanisms generating such distortions.
Supplementary material
To view supplementary material for this article, please visit https://doi.org/10.1017/S0008423920000955
Acknowledgments
The authors wish to thank Marc-André Bodet, Marcelin Joanis, Alain Noël, Denis Saint-Martin and Geneviève Tellier for their comments on the article. We also wish to thank the three anonymous reviewers for their thoughtful comments, as well as Christopher Alcantara and Jack Lucas for their guidance during the review process. Olivier Jacques acknowledges the financial support of the Fonds de recherche du Québec —Société et culture (FRQSC) and the McGill Institute for the Study of Canada. Benjamin Ferland would like to acknowledge the financial support of the Social Sciences and Humanities Research Council (SSHRC) for this study.


