


Life has few thrills equal to skiing on a glacier. The quite moderate gradient surprised us with its immoderate speed for an uninterrupted half mile—if champagne has feelings when uncorked, they would match ours during those moments.
Source: Don Munday, Canadian naturalist and mountaineer, on a ski descent near Whistler, British Columbia, April 1937 (Whistler Museum, 2009).
1. Introduction
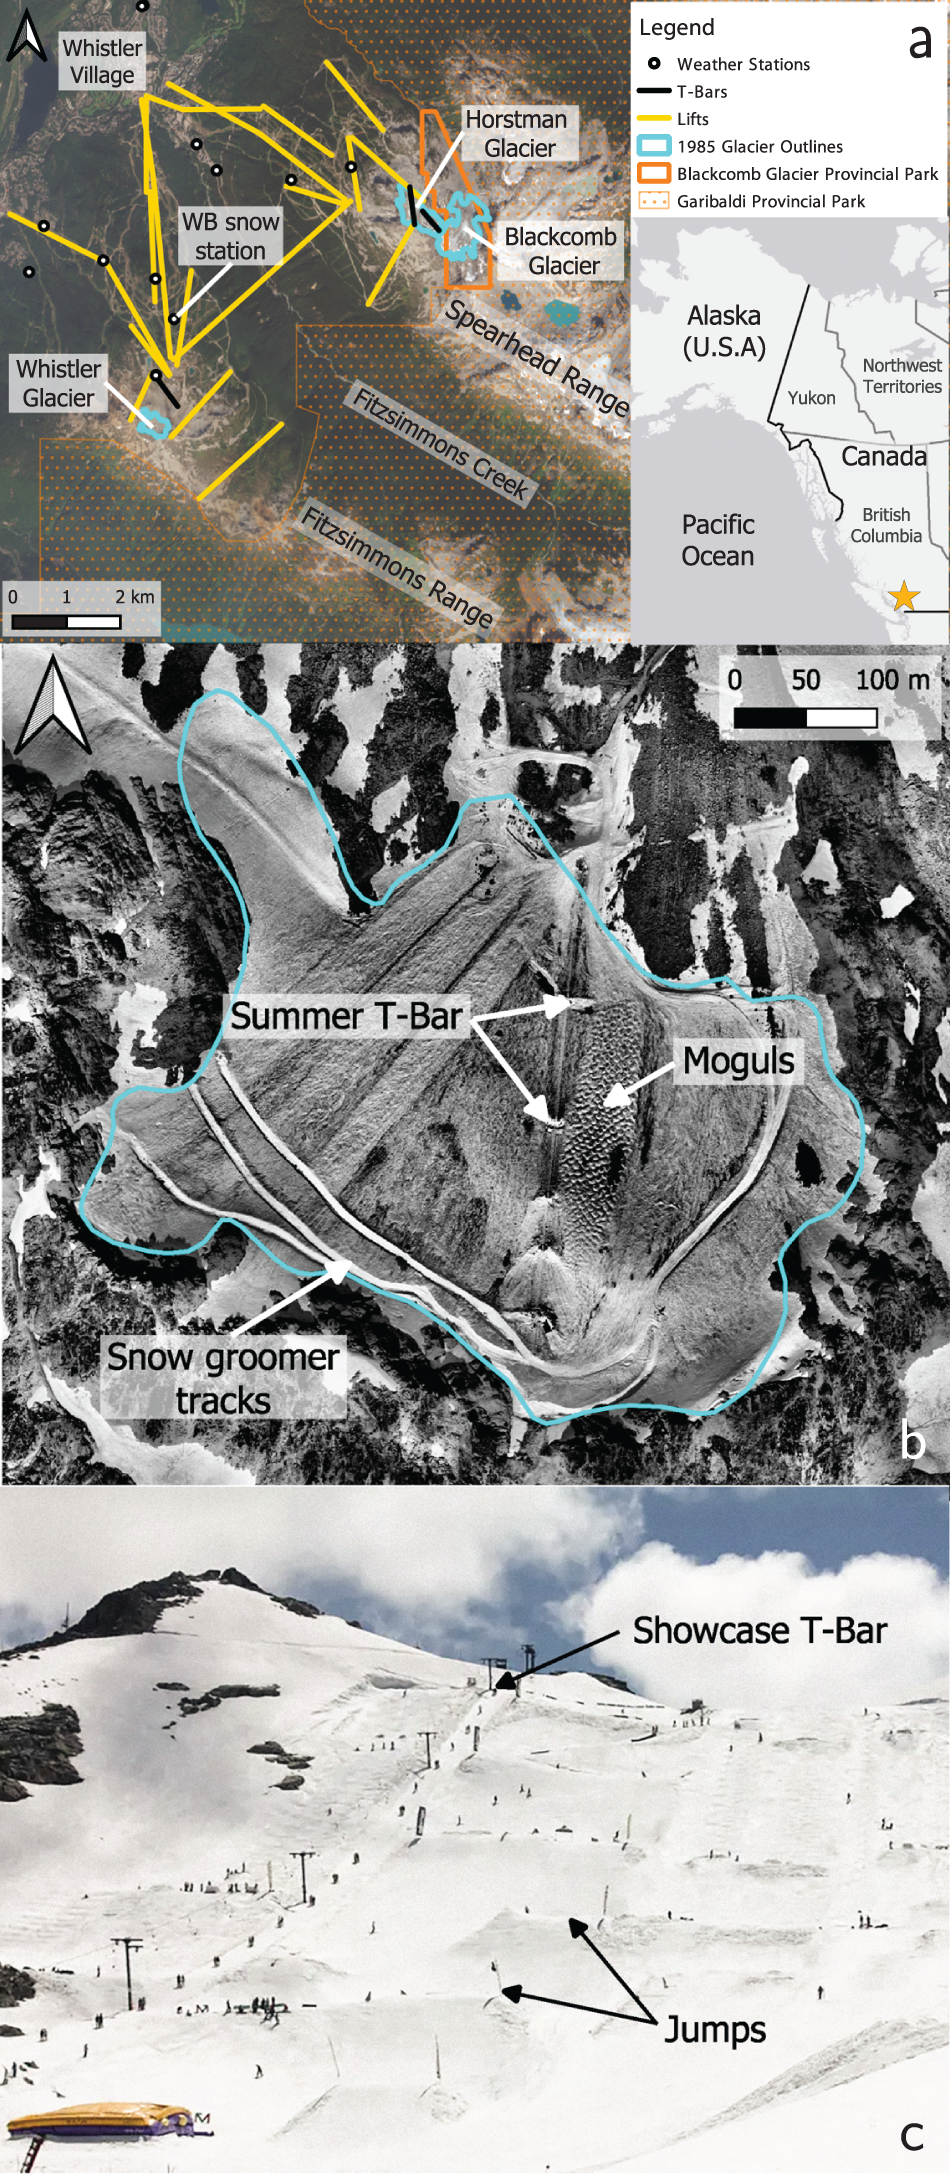
In recent decades, the effects of atmospheric warming have been observed on glaciers worldwide (Hock and Huss, Reference Hock and Huss2021), with accelerating rates of glacier loss observed in western Canada in recent years (Menounos and others, Reference Menounos, Huss, Marshall, Ednie, Florentine and Hartl2025). Current glacier loss challenges mountain resorts, which rely on income generated by glacier-related activities (Gagné and others, Reference Gagné, Rasmussen and Orlove2014). This includes the Whistler Blackcomb mountain resort in British Columbia, Canada. The landscape of Whistler and Blackcomb Mountains in the Coast Mountains of southwest British Columbia (Fig. 1a) has been called a skier’s paradise (Whistler Museum, 2009), with its terrain carved by the Cordilleran Ice Sheet (Clague and others, Reference Clague and Fulton1989; Church and Ryder, Reference Church and Ryder2010) and its abundant snowfall supplied by the orographic precipitation of North Pacific weather systems (Loukas and Quick, Reference Loukas and Quick1994).
The first documented ski descent of Whistler Mountain occurred in 1933 (Whistler Museum, 2009), over 30 years before becoming a ski resort. The Whistler Blackcomb ski resort began as a bid to bring the 1968 Olympics to the region (Vogler, Reference Vogler2016). Whistler Mountain first opened for commercial alpine skiing on 15 January 1966 (Whistler Museum, 2009), followed by Blackcomb Mountain on 4 December 1980. Starting in 1966, the glaciers within the Whistler Blackcomb area boundary provided access to the only mid-summer skiing operation in Canada, with various programs for freestyle and mogul skiing, snowboarding and downhill skiing.
While much of the glacier ice within the Whistler Blackcomb resort has already vanished, the remaining glaciers hold cultural and aesthetic value for the resort and the nearby community. However, continued warming threatens their existence. Here, we recount the historical use of Whistler, Horstman and Blackcomb Glaciers, and use two methods to estimate when they will disappear. We first document glacier area changes from 1973 to 2024, and then apply a simple mass-balance model to estimate the time to deglaciation.
2. Skiing on Whistler, Horstman and Blackcomb Glaciers
The 1966 opening of the Alpine T-Bar (no longer present), located near the peak of Whistler Mountain (Garibaldi Lifts, Reference Lifts1970), made Whistler Glacier accessible to skiers. The first glacier ski camp was held the following summer (Whistler Museum, 2024a) (Fig. 1b). Summer skiing on Whistler Glacier came to an end in the late 1990s due to glacier retreat and low summer snow levels (personal communication from A. De Jong, 2025). Since then, the entrances to Whistler Bowl (Fig. 2a), located west of the peak of Whistler Mountain, have become much steeper or no longer accessible, including the site of the terminal tower for the summer-camp T-bar (personal communication from C. Jewett, 2025). Locals note that one of the steepest runs on the mountain, The Saddle (Fig. 2a), has become even steeper in recent years due to glacier downwasting, leading the resort to increase the difficulty level of the run in 2021 from intermediate to advanced (Whistler Blackcomb, 2021).
Horstman Glacier (Fig. 1a) became accessible to skiers with the addition of the High Alpine T-Bar (no longer present) in 1985, located on the south-western flank of Blackcomb Mountain (Vogler, Reference Vogler2016). The Glacier T-Bar (later renamed Horstman T-Bar) was installed directly on Horstman Glacier in 1987 (Fig. 2b). In 1988, summer camps (Fig. 1c) commenced on Horstman Glacier (Brown, Reference Brown2017). After Whistler and Blackcomb resorts merged in 1997, summer camps that previously took place on Whistler Glacier moved to Horstman Glacier (personal communication from A. De Jong, 2025). Since the towers for Horstman T-Bar were mounted directly on glacier ice, they had to be repositioned every year in response to seasonal snowfall and glacier evolution. The resort experimented with several interventions to save the T-bar between 2015 and 2020, including the installation of a snow fence on the ridge to encourage greater snow accumulation on the glacier, a snowmaking experiment on the upper glacier to supplement natural snowfall and geotextiles to protect the ice under the towers and the loading and unloading stations (personal communication from A. De Jong, 2025). Despite these efforts, the T-bar was permanently removed in 2020 as the evolving glacier profile caused excessive cable tension and created a dangerously steep exit from the lift (Sorensen, Reference Sorensen2020). Horstman Glacier was not opened for summer skiing in 2024 due to low snowfall, marking the first time since 1996 that conditions resulted in neither Whistler nor Blackcomb resorts having a summer ski season (Tibballs, Reference Tibballs2024; Whistler Museum, 2024b). In March 2025, summer ski camps were indefinitely cancelled due to the diminishing glacier and snowpack (Song, Reference Song2025).
Study area in the Traditional Territory of the Skwxwú7mesh Úxwumixw and Líĺwat Nation, southwest British Columbia, Canada. (a) Whistler, Horstman and Blackcomb Glaciers shown in the context of the Whistler Blackcomb resort. Image credit: ESA, contains modified Copernicus Sentinel data (2024). (b) Whistler Glacier during 1989 summer operations. Image credit: property of the Province of British Columbia used with permission. (c) Horstman Glacier during 2015 summer operations. Image credit: Whistler Museum.

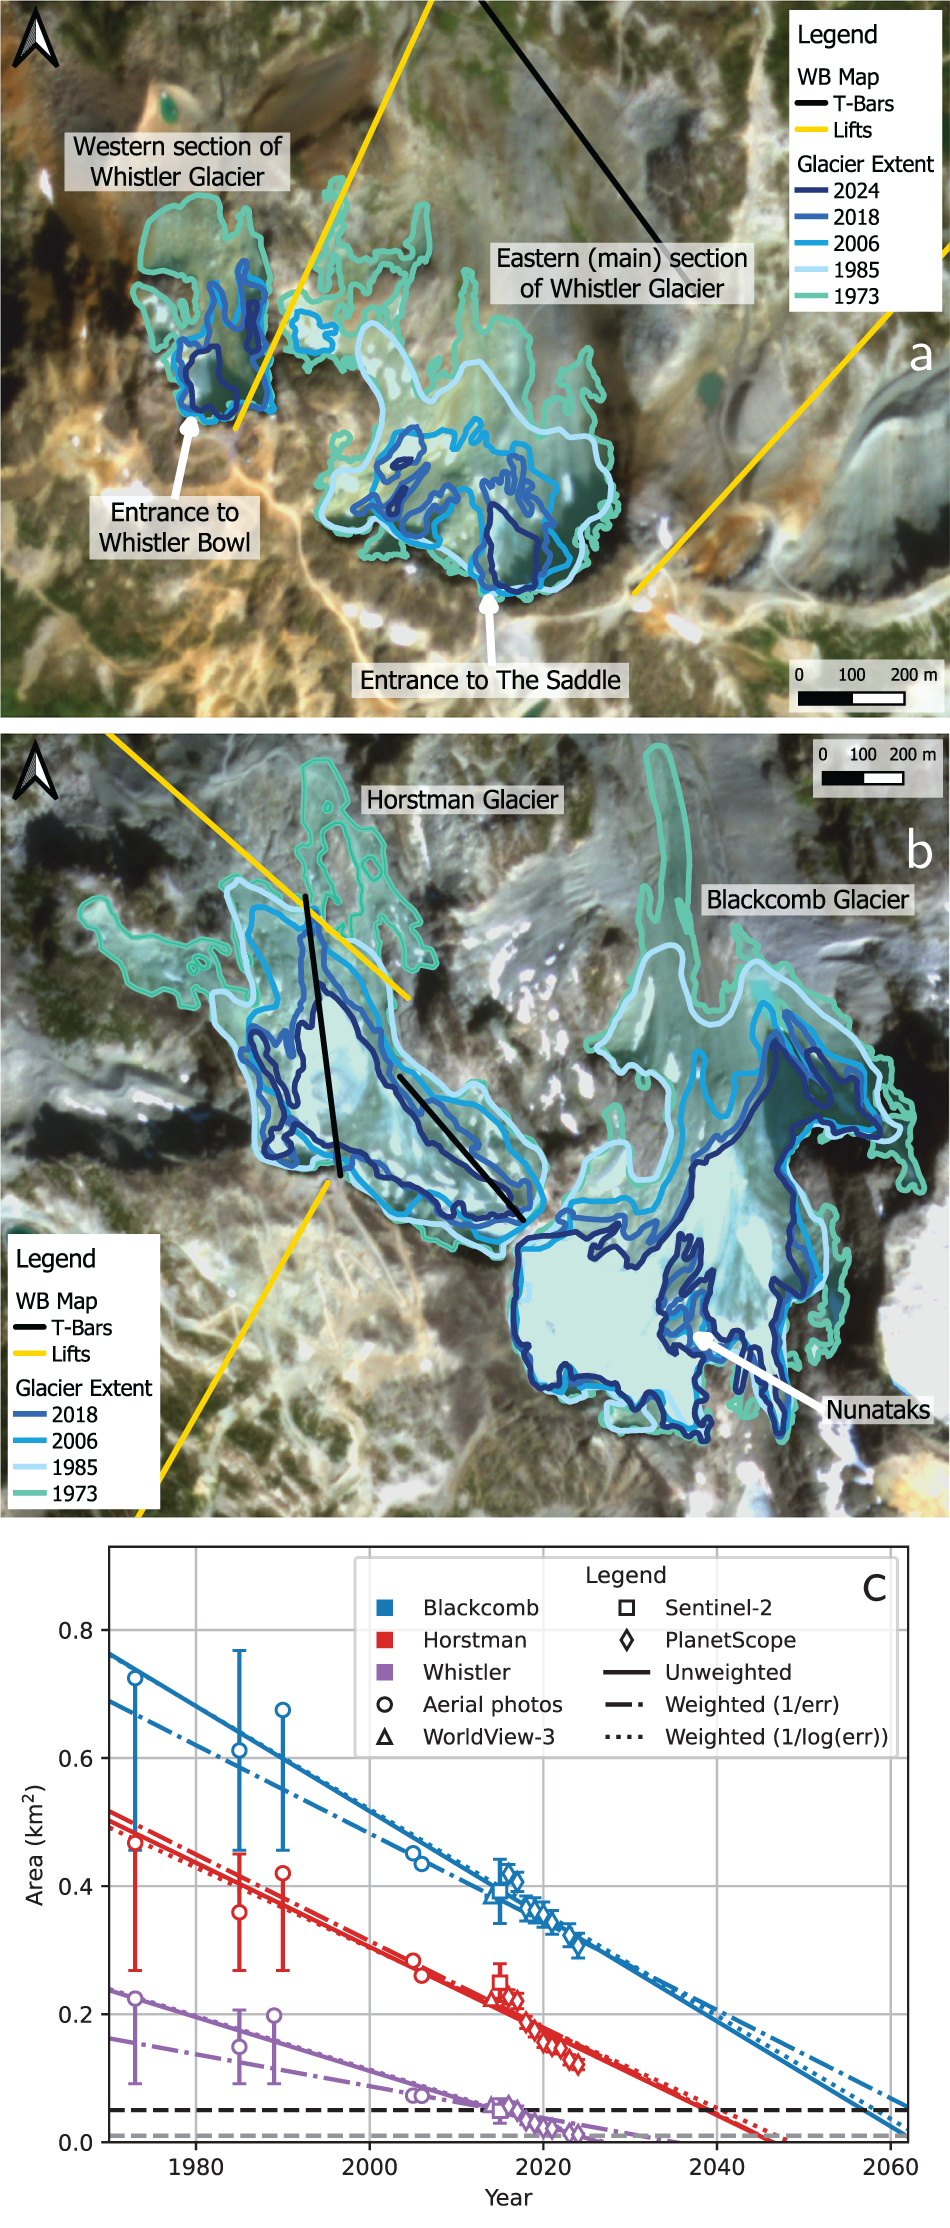
Glacier extents mapped from airborne and satellite imagery for 1973, 1985, 2006, 2018 and 2024. Image credit: © 2024 Planet Labs PBC. (a) Whistler Glacier. (b) Horstman and Blackcomb Glaciers. (c) Timeseries with weighted and unweighted least-squares linear regressions. Weights are inversely proportional to uncertainties (dashed-dotted lines) or the logarithm of uncertainties (dotted lines). Black dashed line indicates the 0.05 km2 threshold (Bolch and others, Reference Bolch, Menounos and Wheate2010; Bevington and Menounos, Reference Bevington and Menounos2022; Pelto and Pelto, Reference Pelto and Pelto2025) and grey dashed line indicates the 0.01 km2 threshold (Leigh and others, Reference Leigh, Stokes, Carr, Evans, Andreassen and Evans2019; Maussion and others, Reference Maussion2023). Note asymmetric uncertainties in 1973, 1989 and 1990, where snow cover permitted only an upper bound on area. See Figures S1 and S2 for all glacier outlines, Figures S3 and S4 for maps without outlines and Figure S6 for the time series on a semi-log plot.

The 1988 installation of Showcase T-Bar on the upper part of Horstman Glacier facilitated access to Blackcomb Glacier (Fig. 1a), which was originally within the adjacent Garibaldi Provincial Park and therefore unpatrolled and lacking avalanche control (Blackcomb Ski Corporation, 1988; Maxwell, Reference Maxwell and Barnett2000). The dangers were considerable and included a steep drop into a narrow valley with frequent avalanches, prompting Blackcomb resort to petition the British Columbia Ministry of Environment and Parks to redraw the provincial park boundaries and develop the glacier for skiing (Maxwell, Reference Maxwell and Barnett2000). The outcome was the creation of Blackcomb Glacier Provincial Park in 1990. In recent years, access to the glacier via Showcase T-Bar (Fig. 2b) has been limited to the late-winter ski season. In 2025, for example, the T-bar did not open until 22 March. The primary access point to Blackcomb Glacier has also evolved as glacier downwasting has steepened the traditional entrance. The changes in operations and available terrain at Whistler Blackcomb have been woven into the collective experience of resort visitors and local residents. In the following, we provide a quantitative assessment of past and projected ice loss to provide context for the experiential loss felt by the Whistler community.
3. Datasets and methods
3.1. Glacier delineation
We manually digitised glacier outlines (e.g. Paul and others, Reference Paul2013) in QGIS. We used high-resolution aerial photographs from the Government of British Columbia from 1973, 1989, 1990 and 2005 to delineate glacier extent (Government of British Columbia, 2025). These digital images were photogrammetrically scanned and later processed using Agisoft Metashape (version 2.1.0; https://www.agisoftmetashape.com, last access 17 June 2025) to generate orthoimagery with ground sampling distance (GSD) between 0.11 and 0.19 m. We also mapped glacier extent from a 2006 aerial orthophoto from the Resort Municipality of Whistler (0.4 m GSD) (Resort Municipality of Whistler, 2006). We mapped glacier extents from three sources of optical satellite imagery, including a 2014 image from Maxar Technologies obtained through Google Earth. This image was captured by the WorldView-3 optical satellite at a resolution of 0.3 m (Maxar Technologies, 2025). A 2015 image with 10 m resolution captured by the European Space Agency’s Sentinel-2 satellite was also used (ESA, 2025), as were 2016 to 2024 images with 3 m resolution from Planet Lab’s PlanetScope satellite constellation (Planet Developers, 2025). The PlanetScope satellites used here were the Dove Classic for 2016–20 and the SuperDove for 2021–24.
We derived uncertainties as the product of the perimeter length and image resolution (see Table S1 for details) (Hoffman and others, Reference Hoffman, Fountain and Achuff2007; Burns and Nolin, Reference Burns and Nolin2014). In areas where seasonal snow cover obscures the glacier margin, we retained the outline from the previous year for which we have imagery of the same type, under the assumption that no glacier advance occurs during the period of study. Any visible nunataks were outlined and their areas subtracted from the total glacier area. We estimated disappearance dates of Whistler, Horstman and Blackcomb Glaciers by extrapolating glacier area as a function of time using weighted and unweighted least-squares regression models with weights that are inversely proportional to the uncertainties or the logarithm of the uncertainties (Figure 2c).
The 1985 glacier outlines adopted from Bevington and Menounos (Reference Bevington and Menounos2022) were derived from a digital elevation model using the Terrain Resource Information Mapping (TRIM) dataset of the Government of British Columbia, and improved with Landsat imagery (Bolch and others, Reference Bolch, Menounos and Wheate2010). Inspection of the aerial imagery revealed that a landslide deposited roughly 0.01 km $^2$ of debris along the upper margin of Blackcomb Glacier sometime between 1973 and 1990. This debris-covered ice was excluded from the outlines of RGI 7.0 (2023) and from the Bevington and Menounos (Reference Bevington and Menounos2022) inventory; this landslide was therefore also excluded from the total area when comparing observed area change through time.
3.2. Mass-balance model
We used a classical degree-day model to relate positive air temperatures to surface ablation (e.g. Braithwaite and Olesen, Reference Braithwaite, Olesen, Bentley and Oerlemans1989; Hock, Reference Hock2003), with a single degree-day factor (DDF) for snow, ice and firn (due to data limitations as described below). We applied the model to the mean elevation of each glacier to estimate a uniform value of glacier-wide ablation. This approach neglects the complexities of glacier geometry, topographic setting and the surface energy balance. We computed degree-day factors for Horstman and Blackcomb Glaciers using a combination of (1) snow accumulation measurements, which we adjusted to the mean glacier elevations using a derived accumulation lapse rate, (2) geodetic net-balance measurements derived from repeat laser altimetry surveys during autumn of 2017, 2020 and 2024, with an assumed surface density of 850 $\pm$60 kg m $^{-3}$ (Huss, Reference Huss2013) to convert elevation to mass change, and (3) positive degree-days (PDDs) computed using downscaled air temperatures. We estimated ablation by differencing (1) and (2). In the absence of net-balance measurements for the relict Whistler Glacier, we used the average DDF from Horstman and Blackcomb Glaciers. Whistler, Horstman and Blackcomb Glaciers have similar north- to northeast-facing aspects (within $\sim20^\circ$), while Whistler Glacier is located at a lower mean elevation (2006 m, compared to 2151 and 2118 m for Horstman and Blackcomb Glaciers, respectively).
To compute positive degree-days (PDDs), we used air temperatures downscaled to  $\sim$10 km from CMIP6 (Coupled Model Intercomparison Project, Phase 6) by the Pacific Climate Impacts Consortium (PCIC, 2023) and adjusted using a lapse rate derived as described below. We used historical CMIP6 data back to 2000 and the SSP2-4.5 scenario (Shared Socio-economic Pathway 2, 4.5 W m-2 radiative forcing) from 2015–24 to compute PDDs and associated DDFs. From 2025–2100, we explored very high (SSP5-8.5), low (SSP1-2.6) and intermediate (SSP2-4.5) emissions scenarios.
We estimated the mean 2017–24 accumulation using snowfall measurements collected by Whistler Blackcomb (unpublished data) at Pig Alley, a weather station on Whistler Mountain at  $\sim$1640 m a.s.l. (Barton, Reference Barton2017). These data were converted to mass using the mean snow density of 90.5 $\pm$34.7 kg m-3 measured at the same station from snowboard core samples between 1990–2016. For simplicity, we assumed accumulation at Pig Alley remains constant in the future and equal to the 1971–2024 average of 10.3 m per year. Snow accumulation from the weather station and air temperatures from the downscaled CMIP6 data were adjusted to the mean elevations of each glacier and taken to represent glacier-wide values. We assigned elevations to the CMIP6 temperature data from ERA5-Land geopotential heights (Muñoz Sabater, Reference Muñoz Sabater2019) and used accumulation and temperature lapse rates ( $4.47\,\mathrm{m\,a}^{-1}\,\mathrm{km}^{-1}$ and $-5.74^{\circ}\ \mathrm{C\,km}^{-1}$, respectively) determined from local station data (PCIC, 2025) (see Fig. S7 for map of stations and S8, S9 for plots of monthly temperature and seasonal accumulation lapse rates).
Glacier volume projections were made by applying our simple mass-balance model to the Farinotti and others (Reference Farinotti, Huss, Fürst, Landmann, Machguth, Maussion and Pandit2019) and Millan and others (Reference Millan, Mouginot, Rabatel and Morlighem2022) ice-thickness models (hereafter referred to as simply ‘Farinotti’ and ‘Millan’ models) for each glacier under no-flow assumptions, as justified by ITS_LIVE time-averaged velocities less than 0.35 m a $^{-1}$ for all three glaciers (Gardner and others, Reference Gardner, Fahnestock and Scambos2025a; Reference Gardner, Fahnestock and Scambos2025b). Projections were made from different years (2000, 2007, 2015) to account for the ranges of acquisition dates of the surface DEMs used by the Farinotti and Millan models.
As previously stated, one of the main limitations of our method is that we used the same DDF for snow, ice and firn. In our model, the downscaled CMIP6 temperature data were not bias-corrected, so the DDFs compensate for any bias in the temperatures and cannot be meaningfully compared to other locally-derived DDFs, e.g. 2.71– $4.42 \,\mathrm{mm\,w.e.}\,^{\circ}\,\mathrm{C}^{-1}\,\mathrm{d}^{-1}$ for snow and 4.26– $5.63\;\mathrm m\mathrm m\,\mathrm w.\mathrm e.\,^\circ\,\mathrm C^{-1}\,\mathrm d^{-1}$ for ice as reported by Shea and others (Reference Shea, Dan Moore and Stahl2009) and Bevington and others (Reference Bevington, Menounos and Ednie2025). We also used a fixed lapse rate for all climate forcings. The accumulation data were from a nearby station below treeline, but their relation to accumulation on the study glaciers is unknown. Moreover, we have a limited understanding of the spatial variability of accumulation across the glaciers due to processes such as avalanching or wind distribution. Finally, the absence of ice-thickness measurements precluded us from evaluating the realism of the Farinotti or Millan ice-thickness models, which we used for the volume-based projections.
4. Results and discussion
4.1. Glacier extent change
In the last two decades, Whistler Glacier fragmented into multiple, small ice masses (Fig. 2a). We include only the eastern sector in values reported here for consistency with RGI 7.0 and the inventory of Bevington and Menounos (Reference Bevington and Menounos2022) (see Table S2 for western-sector values). Whistler Glacier area has declined  $\sim$95% from 0.224 $\pm$0.001 km2 in 1973 to 0.012 $\pm$0.002 km2 in 2024, and around 2015 dropped below 0.05 km2, the minimum area threshold used for previous glacier mapping by Bolch and others (Reference Bolch, Menounos and Wheate2010); Bevington and Menounos (Reference Bevington and Menounos2022); Pelto and Pelto (Reference Pelto and Pelto2025) (Figure 2c). What remains of Whistler Glacier will likely drop below the 0.01 km2 threshold used by Leigh and others (Reference Leigh, Stokes, Carr, Evans, Andreassen and Evans2019); Maussion and others (Reference Maussion2023), within a year. Simple extrapolation of area measurements since 1973 suggests disappearance of the now relict glacier within roughly a decade (Table 1, Method 1).
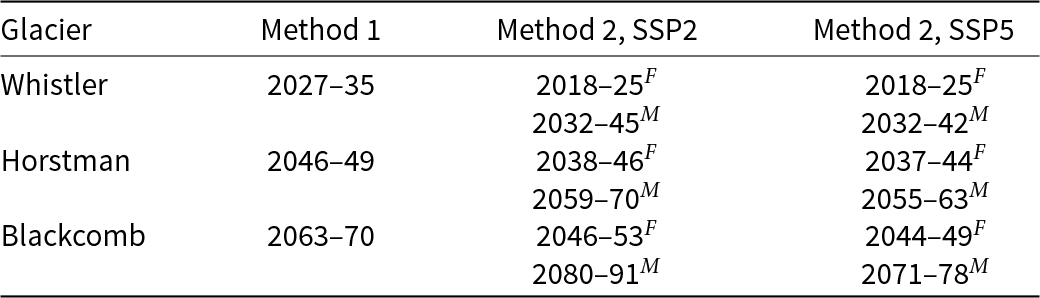
Estimated glacier disappearance dates. Method 1: Extrapolation of glacier-area regressions (Figure 2c). Method 2: Net balance calculated with degree-day model and constant winter balance applied to Farinotti and others (Reference Farinotti, Huss, Fürst, Landmann, Machguth, Maussion and Pandit2019) (F) and Millan and others (Reference Millan, Mouginot, Rabatel and Morlighem2022) (M) ice-thickness models for CMIP6 SSP2 and SSP5. See Tables S4 and S5 for disappearance dates of all Method 1 glacier-area regressions and SSP1 for Method 2.

The lack of a recent DEM precludes us from quantifying a change in glacier slope. However, glacier downwasting relative to bedrock can be observed from satellite imagery between 2015 and 2024, which is consistent with anecdotal evidence of the ski run steepening. The most recent DEM we have from 2011–14 (COP-DEM, 30m; ESA, 2019) shows an average slope of 29 $^{\circ}$ using the 2014 outline.
Analysis of our data shows that over the period 1973–2024, Horstman Glacier has been narrowing and retreating. At present, only two of the towers for Showcase T-bar are underlain by glacier ice, while no glacier ice remains at the tower locations of the former Horstman T-bar (Fig. 2b). The 2018 image shows that the use of geotextiles under the Horstman T-bar helped to preserve a portion of the glacier, as evidenced by the presence of an elevated ridge of ice where the textiles were used. Since 1973, Horstman Glacier lost nearly 75% of its area, declining from 0.467 $\pm$0.001 km2 to 0.121 $\pm$0.008 km2 in 2024, with extrapolation crossing the 0.05 km2 threshold as early as 2040, extended by $\sim$6 years with the 0.01 km2 threshold, and reaching zero prior to 2050 (Figure 2c, Table 1, Method 1). By plotting the glacier area through time, we observe a change in retreat rate around 2011, consistent with regional observations of glacier change (Hugonnet and others, Reference Hugonnet2021; Bevington and Menounos, Reference Bevington and Menounos2022) (see Fig. S5 for piecewise regression).
The evolution of Blackcomb Glacier is geometrically complex (Fig. 2b) and marked by the emergence of nunataks in its upper reaches. Imagery from 1973 and 1990 reveals that the glacier became disconnected from two smaller ice bodies to the southeast sometime between 1990 and 2005 (their area not included here for consistency with other inventories). Excluding the upper margin where the landslide occurred, Blackcomb Glacier lost close to  $\sim$60% of its area from 1973 (0.725 $\pm$0.002 km2) to 2024 (0.307 $\pm$0.019 km2). By extrapolating the linear fit to glacier area through time, we project that the glacier area will drop below 0.05 km2 around 2060, extended by $\sim$5 years with the 0.01 km2 threshold, and reach zero by 2070 (Table 1, Method 1). The apparent increase in glacier extent around 2016–17 is likely an artefact due to the change in image resolution and increased snow cover during the winters of 2015/16 and 2016/17.
4.2. Projections of glacier volume loss
The degree-day factors calculated for Horstman and Blackcomb Glaciers are  $1.60\,\mathrm{mm\,w.e.}\,^{\circ}\,\mathrm{C}^{-1}$ d $^{-1}$ and $1.72\,\mathrm{mm\,w.e.}\,^{\circ}\,\mathrm{C}^{-1}\,\mathrm{d}^{-1}$, respectively, with the average of
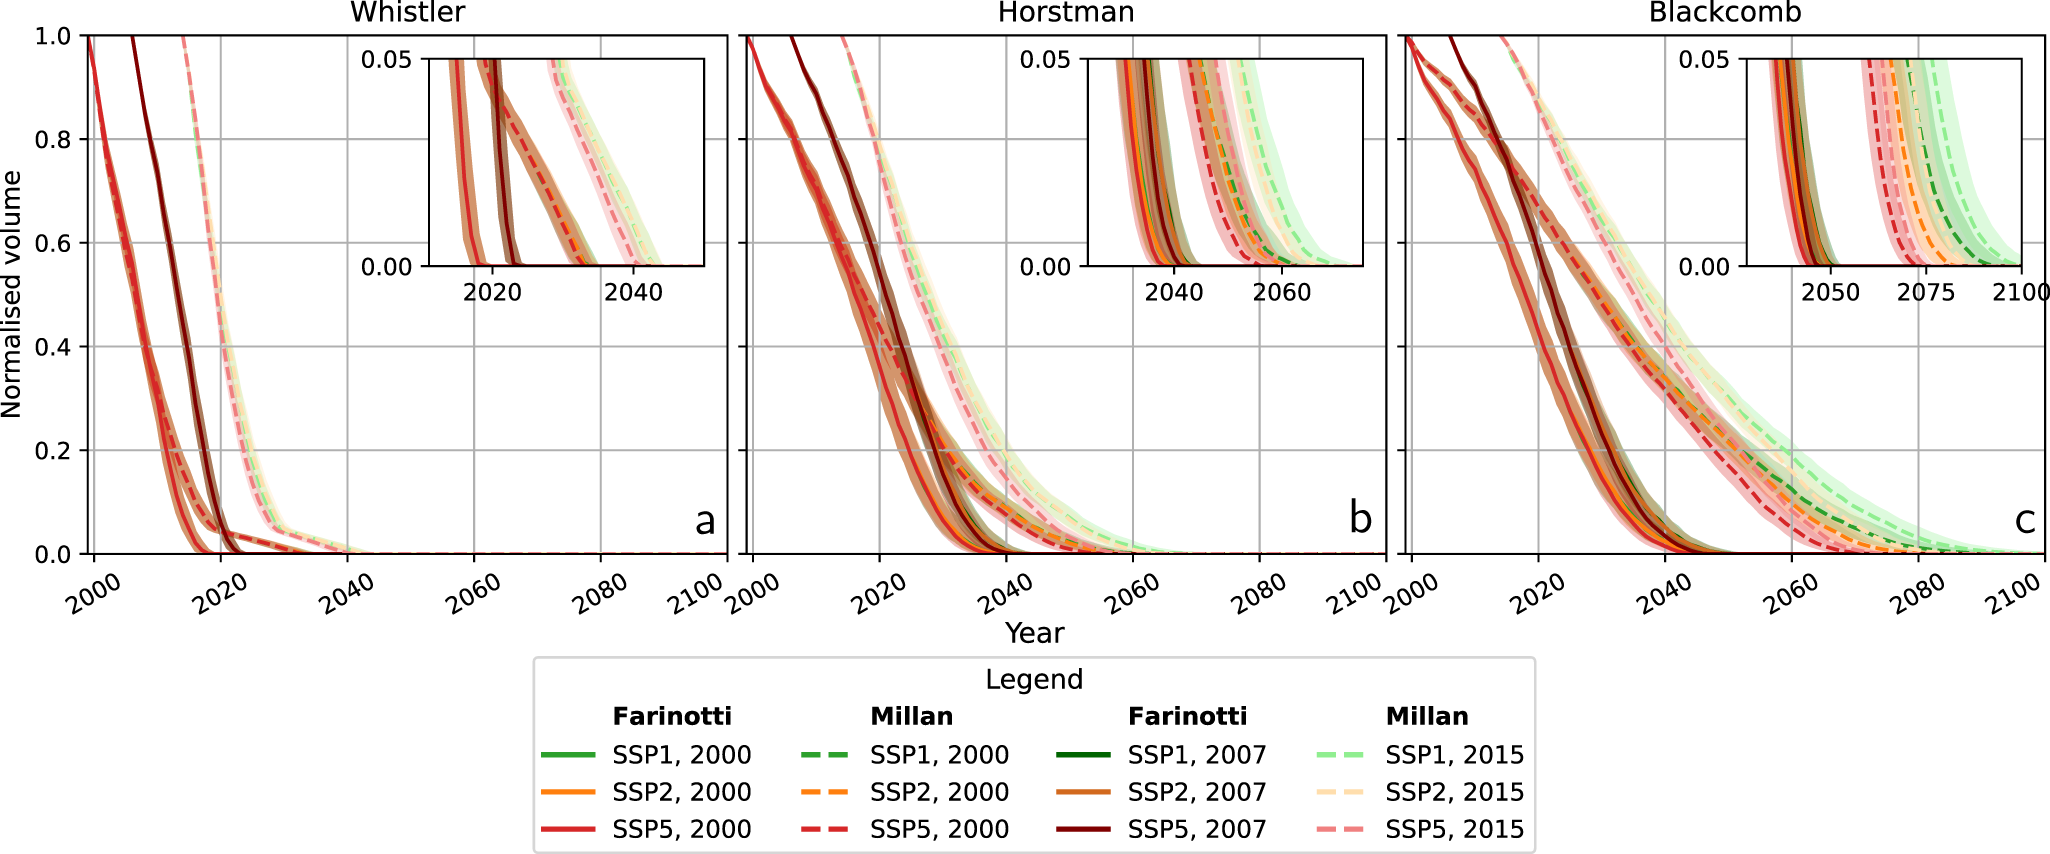
  $1.66\,\mathrm{mm\,w.e.}\,^{\circ} \mathrm{C}^{-1}\,\mathrm{d}^{-1}$ assumed for the relict Whistler Glacier (see Table S3 for net balance, ablation and PDD values). In the scenarios with the ice thickness initialised with the Farinotti model in 2000 and 2007, the now relict Whistler Glacier is projected to have already disappeared, or to disappear imminently (see Fig. 3c). The scenarios with the Millan model initialised between 2000 and 2015 are more optimistic and project the disappearance of the relict Whistler Glacier between 2032–45 for CMIP6 SSP2, which is the most plausible of our chosen scenarios based on current policies (Hausfather and Peters, Reference Hausfather and Peters2020). See Table 1 (Method 2) for the range of disappearance dates for SSP2 and SSP5 (see Table S5 for SSP1). Our model projects that Horstman Glacier will disappear between 2038–46 when initialised with the Farinotti model under the SSP2 scenario. Using the Millan model, Horstman Glacier persists until 2059–70 under the SSP2 scenario. As the largest of the three glaciers, Blackcomb Glacier shows the widest range of disappearance dates. The SSP2 scenario for Blackcomb Glacier leads to its projected disappearance between 2046–53 for the Farinotti model and 2080 and 2091 for the Millan model. Since the maximum initial ice thickness using the Millan model is approximately double that of the Farinotti model, using the Millan model greatly extends the projected survival of these glaciers (see Fig. S10).
Normalised glacier volume change over time. (a) Whistler Glacier. (b) Horstman Glacier. (c) Blackcomb Glacier. Scenarios initialised with the Farinotti model (starting in 2000 and 2007) are shown as solid lines, while those initialised with the Millan model (starting in 2000 and 2015) are shown as dashed lines. Scenarios SSP1, SSP2 and SSP5 are represented using different colours (see legend). The insets on each panel are zoomed to the normalised volume between 0 and 0.05 and the disappearance date for each scenario. See Figure S10 for spatially distributed projections of ice thickness.

Parameters that define the widest range of disappearance dates include ice thickness, initialisation date and, for the larger glaciers, the SSP scenario. When applied to both Farinotti and Millan models, different initialisation dates and all CMIP6 SSP scenarios, the ice density range of 790–910 kg m-3 produces only a two-year variation in disappearance dates. With the Farinotti model, SSP1 and SSP2 produce no variation in disappearance dates for Whistler and Horstman Glaciers, and one year difference for Blackcomb Glacier; with the Millan model, the variation is 3–4 years for Horstman Glacier, 10 to  $ \gt 12$ years for Blackcomb Glacier and no variation for Whistler Glacier. The variation in disappearance dates between SSP2 and SSP5 is larger, with differences up to four years for the Farinotti model, and up to 12 years for the Millan model.
The sensitivity of the mass-balance model to snow density, annual accumulation and lapse rates of temperature and accumulation is tested by varying each quantity by  $\pm$20%. For the reference case of the Millan model and CMIP6 SSP2 scenario initialised in 2007, disappearance dates vary by approximately 4–9 years with variations in the annual accumulation, 4–8 years with the temperature lapse rate, 1–2 years with snow density and 0–2 with the accumulation lapse rate (see Table S6 for associated DDFs and Fig. S11 for normalised volume curves). Despite the large uncertainty in parameters, the area loss rates up to 2024 generated by the mass-balance model are comparable to the observed area loss rates (see Table S7 and Fig. S12).
5. Conclusions and outlook
Linear extrapolations of area change and projections using a simple mass-balance model suggest the complete disappearance of the now relict Whistler Glacier is imminent or will occur within the next decade, and that of Horstman and Blackcomb Glaciers will follow in the next 10–50 and 20–70 years, respectively. The rapidity of this change is highlighted by the mean annual rates of glacier area change between 1973–2024:  $9.8\%\,\rm{a}^{-1}$ for Whistler Glacier, $9.6\%\,\rm{a}^{-1}$ for Horstman Glacier and $6.6\%\,\rm{a}^{-1}$ for Blackcomb Glacier, leading to area losses of 95%, 75% and 60%, respectively, within this 50-year period. The LiDAR-observed elevation changes of Horstman and Blackcomb Glaciers, averaging $-1.08\,\rm{m \,a}^{-1}$ and $-0.96\,\rm{m\,a}^{-1}$, respectively, over 2017–24, further emphasise the ongoing glacier attrition. The rapid decline of these glaciers reflects the trend of deglaciation observed in western Canada, with the disappearance of 8% of glaciers in British Columbia and Alberta observed by Bevington and Menounos (Reference Bevington and Menounos2022) between 1984–2020. Whistler, Horstman and Blackcomb Glaciers have served as ecological, aesthetic, recreational and economic resources, whose recent history illustrates the progression from mitigation to adaptation in the face of their committed disappearance. Ongoing adaptation will be required to maintain safe winter access to glacierised terrain, while adjusting to the loss of summer skiing programs that played an important role in the development of high-performance winter athletes.
Supplementary material
The supplementary material for this article can be found at https://doi.org/10.1017/aog.2026.10045.
Data availability statement
The climate data (CMIP6 and weather station data), DEMs and LiDAR used in this study, as well as the glacier outlines produced, are available at https://doi.org/10.5281/zenodo.15943001. Access to other publicly available datasets is described in the Supplementary Material.
Acknowledgements
This work was inspired by citizen scientists and Whistler community members who have been monitoring local glacier change for over 50 years. Arthur De Jong and Cathy Jewett generously provided information on the historical context of the study. We would like to thank the Whistler Museum for providing the 2015 image of Horstman Glacier and insights into the history of Whistler Blackcomb. We are grateful to the avalanche forecasters at Whistler Mountain for the snowfall data used in this study. We thank two anonymous reviewers, Scientific Editor Frank Paul and Associate Chief Editor Liss Marie Andreassen for their constructive comments and suggested revisions. Financial support was provided by the Natural Sciences and Engineering Research Council of Canada (GEF, BM, C. Monty), Simon Fraser University (C. Monty, GEF), including through a BC Graduate Scholarship to C. Monty, as well as the Tula Foundation (Hakai Institute; BM) and the Natural Hazards and Climate Change Geoscience Program at NRCan-GSC (JWC).
Author contributions
C. Monty conceived of the project, performed all calculations, created the figures and drafted text. GEF oversaw all aspects of the work and contributed to writing. BM supplied the processed LiDAR data, Planet Lab imagery, BC aerial photos, consulted on the methods and provided feedback on the text. C. Mathias processed the BC aerial photos and generated the ortho imagery. JWC consulted on methods and revised the text.


 Open access