


Introduction
Food production has a significant negative impact on the environment: approximately one third of global greenhouse gas emissions (GHGs) are a by-product of food production processes (Crippa et al., Reference Crippa, Solazzo, Guizzardi, Monforti-Ferrario, Tubiello and Leip2021). On average, the production of animal-source foods – for example, fish, meat and dairy products – has a greater environmental impact than the production of plant-based foods (Gerber & Food and Agriculture Organization of the United Nations, Reference Gerber2013; Poore & Nemecek, Reference Poore and Nemecek2018). Estimates of impact suggest that approximately 60% of food-related GHGs are a direct result of the production of meat-based products (Xu et al., Reference Xu, Sharma, Shu, Lin, Ciais, Tubiello, Smith, Campbell and Jain2021). In addition, consumption of animal products has been linked to negative consequences for human health. Specifically, consumption of red and processed meat has been linked to an increased risk of some types of cancer, excess weight and non-communicable diseases such as type 2 diabetes (Wellesley & Colby, Reference Wellesley and Colby2015; Ekmekcioglu et al., Reference Ekmekcioglu, Wallner, Kundi, Weisz, Haas and Hutter2018). Shifting consumer choices away from meat and dairy, and towards plant-based options (which contain no animal-derived ingredients (Plant Based Food Association, 2022)), is, therefore, a win for both health and sustainability.
Numerous behavioural interventions have been employed to improve diets to varying degrees of success. To date, choice architecture interventions – i.e., choice-preserving changes to the decision environment – have often proved effective at encouraging dietary changes away from meat (Bianchi et al., Reference Bianchi, Dorsel, Garnett, Aveyard and Jebb2018; Harguess et al., Reference Harguess, Crespo and Hong2020; Wolfenden et al., Reference Wolfenden, Barnes, Lane, McCrabb, Brown, Gerritsen, Barquera, Véjar, Munguía and Yoong2021). Interventions that have manipulated the availability of particular products – e.g., increasing the proportion of plant-based options – have been amongst the most successful of these (Bianchi et al., Reference Bianchi, Dorsel, Garnett, Aveyard and Jebb2018; Garnett et al., Reference Garnett, Balmford, Sandbrook, Pilling and Marteau2019; Pechey et al., Reference Pechey, Cartwright, Pilling, Hollands, Vasiljevic, Jebb and Marteau2019; Wolfenden et al., Reference Wolfenden, Barnes, Lane, McCrabb, Brown, Gerritsen, Barquera, Véjar, Munguía and Yoong2021). Studies that have increased the salience of products via labels or menu restructuring also appear promising, although further robust evidence of intervention efficacy is required (Carter et al., Reference Carter, Bignardi and Marteau2018; Gravert & Kurz, Reference Gravert and Kurz2021). However, the longevity of treatment effects is mixed, with only a few interventions consistently demonstrating a positive impact six months post-intervention (Bianchi et al., Reference Bianchi, Dorsel, Garnett, Aveyard and Jebb2018; Wolfenden et al., Reference Wolfenden, Barnes, Lane, McCrabb, Brown, Gerritsen, Barquera, Véjar, Munguía and Yoong2021).
Aside from behavioural interventions, there are numerous social marketing initiatives aimed at encouraging the consumption of plant-based options. The largest of these is Veganuary, a non-profit organisation and annual campaign that encourages people worldwide to “try vegan” (i.e., move to a plant-based diet) each January and beyond (Veganuary, 2023). Since January 2014, the number of people taking part in the initiative has risen year-on-year: in 2022, more than 629,000 participants officially signed up on the Veganuary website (Veganuary, 2021). Furthermore, the number of unofficial participants is estimated to be 10 times higher (Veganuary, 2022). This year, 375 million reaches have been registered across Veganuary's social media and the hashtag #Veganuary had over 550 million views on TikTok at the end of January 2022. The initiative has been taken up also in workplace challenges, with more than 100 organisations worldwide encouraging their employees to try vegan in January and providing more vegan options in the workplace.
Study objectives, context and hypotheses
While many organisations use Veganuary to launch their own campaigns that encourage the consumption of plant-based options, there have been few systematic evaluations of their effect (Trewern et al. Reference Trewern, Chenoweth, Christie and Halevy2022). Therefore, to extend the extant literature, we evaluated the short- and medium-run effectiveness of a workplace Veganuary campaign using interrupted time series analysis.
We accessed the sales data of a large contract catering company in the UK – servicing numerous local and national businesses – which initiated such a campaign in 2019 and repeated it annually in 2020, 2021 and 2022. We used the catering company's sales data from 2016 to 2022 to assess both the immediate and longer-term effects of the annually repeated campaign, testing the following two primary hypotheses.
H1: The Veganuary promotion increased the proportion of vegan meals sold during the annual campaign periods.
H2: The Veganuary promotion increased the proportion of vegetarian meals sold during the annual campaign periods.
In addition, given the identification of significant treatment effects across multiple years, we secondarily assessed the “shape” and duration of the impact. Estimates were based on the parameters of transfer functions in the interrupted time series models, a process described further in the Materials and methods section.
Materials and methods
Data source and cafeteria sample
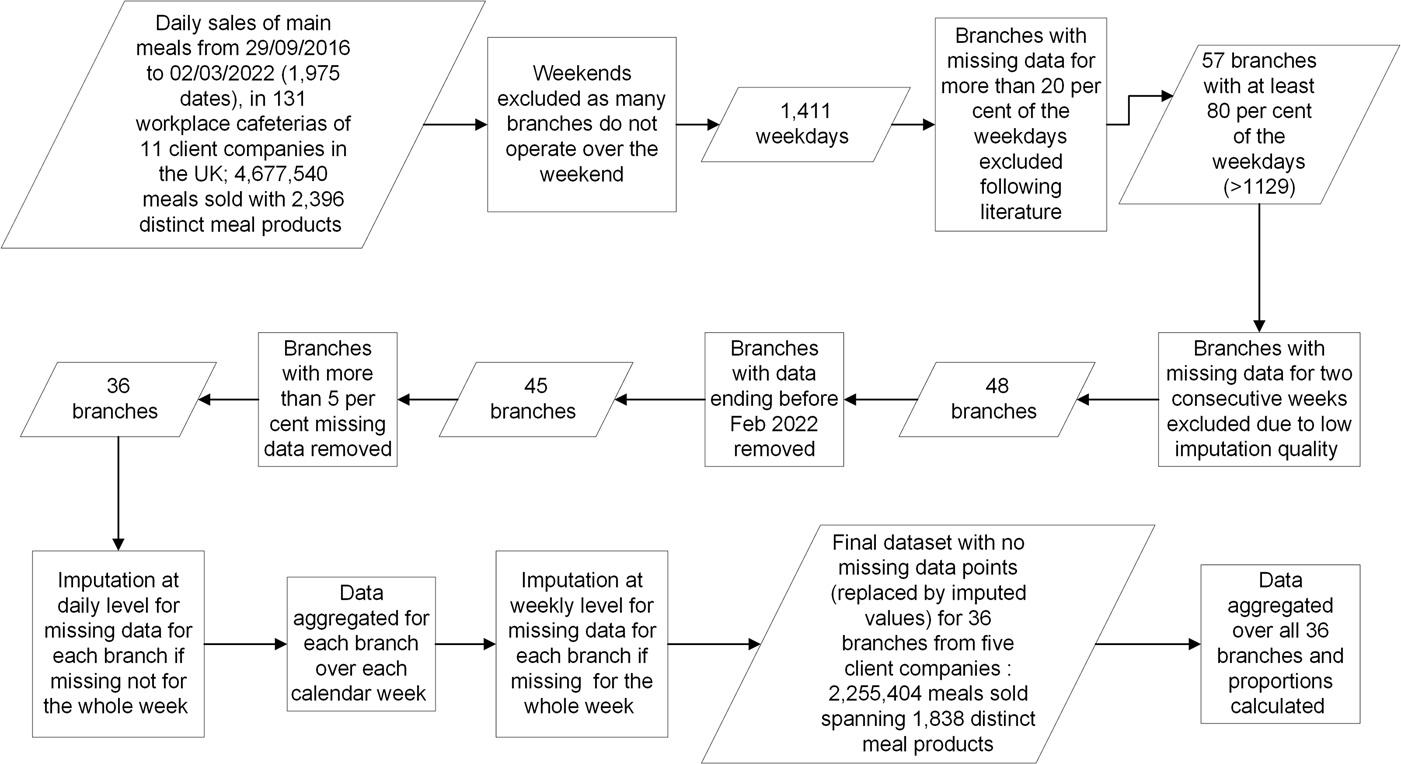
The main dataset for this study initially comprised daily sales of main mealsFootnote 1 from 29 September 2016 to 2 March 2022, in 131 workplace cafeteriasFootnote 2 (henceforth referred to as “branches”) of 11 client companies the catering company served in the UK. (Sales here and elsewhere in this paper refer to the number of meals sold – i.e., unit sales – rather than the monetary value of sales).
There were 1,975 dates in total in the study dataset. Over this period, 4,677,540 meals were sold, with 2,396 distinct meal products (henceforth, “products” refer to “meal products”). A separate dataset contained indicators for each of the meal products that denoted whether they were vegetarian or vegan options.
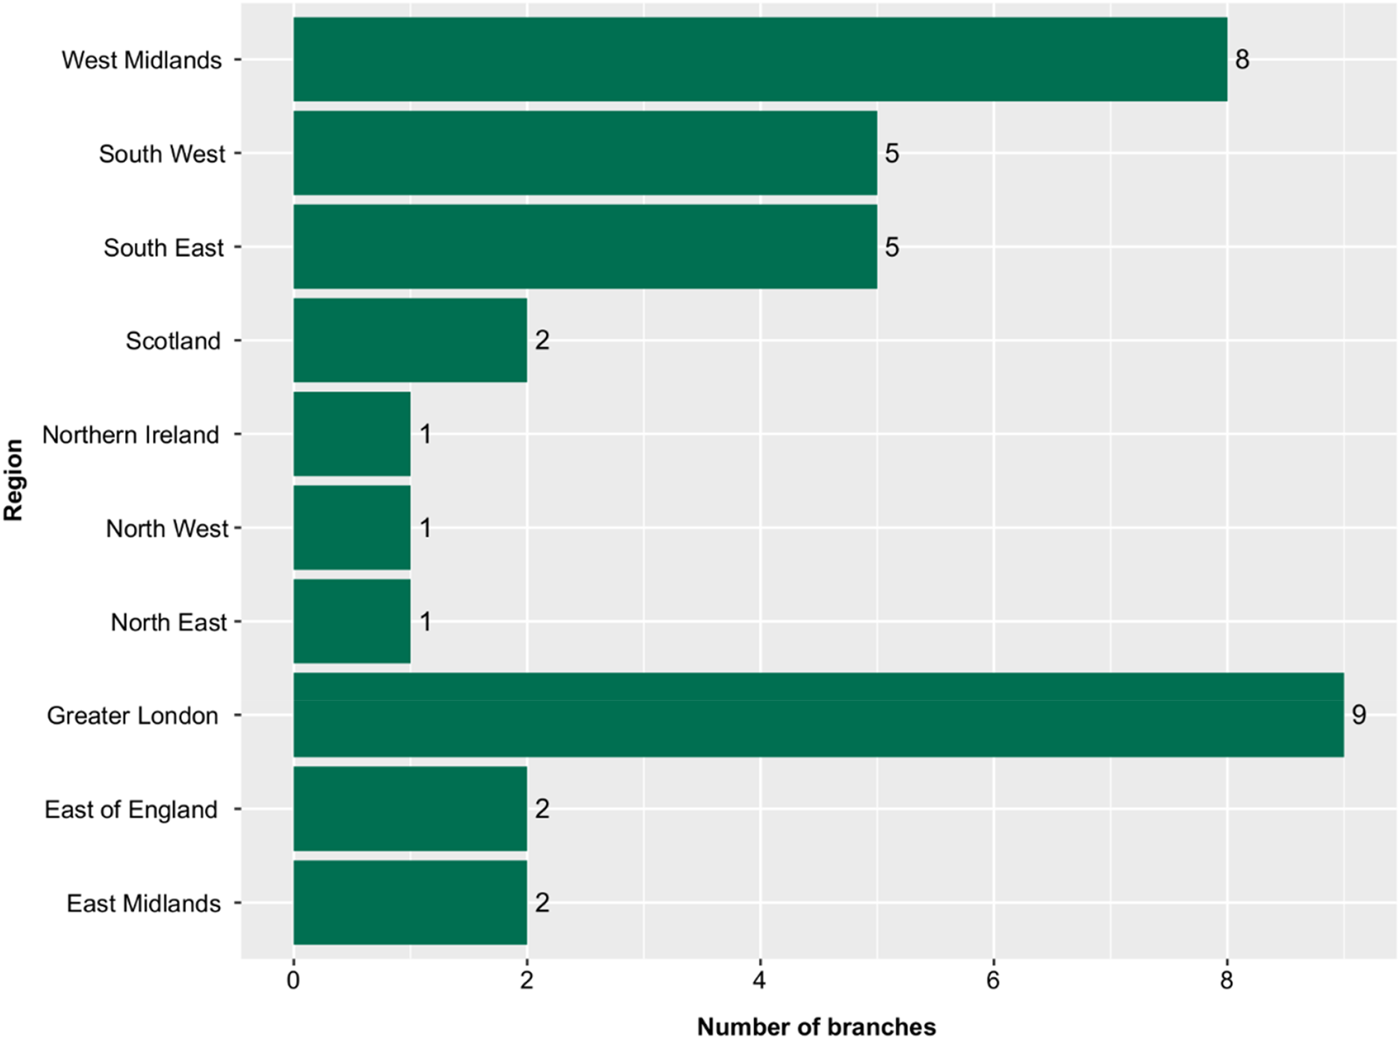
Considering both the volume of missing data and quality of imputation, we first removed weekends from the initial dataset and then excluded branches in multiple steps, resulting in a final dataset with 36 branches of five client companies located in eight of nine regions in England (all except for Yorkshire and The Humber), Scotland and Northern Ireland (see Figure 1). This process is described in detail in the supplementary materials; additional information on the volume of sales at excluded branches is also provided there. Imputation for missing data was conducted for the dataset after exclusion, described subsequently.
Location of branches in the final dataset.

The final dataset consisted of 2,255,404 meals sold in the time series, spanning 1,838 distinct meal products. See Figure 2 for a diagram of the procedure of data exclusion and imputation.
Data exclusion and imputation.

Imputation procedure
We used Kalman smoothing on the state space representation of an ARIMA model for the imputation of missing data, applied via the imputeTS package in R Statistical Software. Imputation was conducted for each branch, using a two-step approach. If data were missing for the whole week, we conducted the imputation at a weekly level; otherwise, data were imputed at a daily level.
To examine the quality of this imputation, we ran checks where we randomly removed 10% of the existing data, imputed values and calculated the correlations between the imputed values and actual values. We explored different imputation methods – e.g., seasonally decomposed missing value imputation, seasonally splitted missing value imputation interpolation, interpolation, last observation carried forward – and imputation with different seasonality settings in an attempt to improve imputation quality.
In the final dataset, for imputation at a daily level, Kalman smoothing on the state space representation of a weekly ARIMA model gave the best results, with correlation coefficients of 0.89, 0.65, 0.66 for total sales, vegetarian sales and vegan sales, respectively. For imputation at a weekly level, Kalman smoothing on the state space representation of an ARIMA model with a yearly seasonality gave the best results, with correlation coefficients of 0.94, 0.80, 0.78 for total sales, vegetarian sales and vegan sales, respectively. These correlation coefficients are roughly comparable to those seen elsewhere in the literature; nevertheless, data completeness and imputation remain a limitation of this study (Hadeed et al., Reference Hadeed, O'Rourke, Burgess, Harris and Canales2020).
Final dataset
The 36 branches in the dataset were in eight of nine regions in England (all except for Yorkshire and The Humber), Scotland and Northern Ireland (see Figure 1). The majority of the customers of the 36 branches were blue-collar workers, such as lorry/bus drivers and staff at distribution centres, while a few branches also served white-collar customers, such as office workers.
In these 36 branches, 2,255,404 meals were sold in the time series, spanning 1,838 distinct meal products. The average number of meals sold per branch per week (after imputation) was 221.38 (SD = 156.08), while the number for vegan meals was 3.89 (SD = 10.43) and 27.64 (SD = 34.57) for vegetarian meals.
Intervention
As mentioned in the introduction, the intervention in this study was a Veganuary promotional campaign, recurring annually each January.
The mechanism of the campaign was threefold. First, the company launched new plant-based products throughout the campaign period, thereby increasing the availability of such products. Second, the company emphasised the environmental and health benefits of the products via on-site materials such as posters. Third, the company promoted the newly launched products on-site, thereby increasing their salience.
Outcome measures
To abstract away from daily variation (which might have been an artefact of logistic issues, or otherwise), weekly sales were used for outcomes.
To obtain the final time series data for analyses, we firstly aggregated the total sales, the vegan sales and the vegetarian sales for each branch over each calendar week respectively, then aggregated over all 36 branches included in the final dataset for each of the three variables. This gave us the time series data of the total sales, the vegan sales and the vegetarian sales.
Finally, in line with the approach often used in time series analysis in the extant literature (Turner et al., Reference Turner, Karahalios, Forbes, Taljaard, Grimshaw, Cheng and McKenzie2020), we used these sales figures to create the two primary outcomes, which were the proportion of vegan sales (out of the total sales) for each week and the proportion of vegetarian sales (out of the total sales) for each week.Footnote 3
Analysis approach
The annual campaign effects of ‘Veganuary' promotion upon vegan and vegetarian sales were estimated using Autoregressive Integrated Moving Average (ARIMA) intervention analysis, following the general processes outlined in Box et al. (Reference Box, Jenkins, Reinsel and Ljung2015) and Cryer & Chan (Reference Cryer and Chan2008).
In this study, several different ARIMA models – two for vegan sales and two for vegetarian sales – were used to estimate the campaign effects associated with Veganuary promotional activity each year. If effective, each period of activity was assumed to act as an exogenous factor that disrupted the trend or mean function of vegan/vegetarian sales at the branches (Cui et al., Reference Cui, Liang and Ewing2020). The patterns of these disruptions were estimated using transfer functions.
The form of each of these ARIMA models – including the intervention effects – was fitted using the same general process. This process followed the steps outlined in Cryer & Chan (Reference Cryer and Chan2008) and was pre-registered on OSF (https://osf.io/3zwhs).
Interpretation of estimated effects
Due to the complex pattern of the level of outcome variables over time, the campaign effects could not be estimated by simply comparing the level of outcome variables during the campaign periods to that of non-campaign periods.
We therefore built a model which captured all the complex underlying patterns, including seasonal fluctuation (e.g., sales were higher during Christmas each year), and long-run trends (e.g., the increased consumption of plant-based meals over recent years). In this approach, we first estimated the model representing the counterfactual time series using unperturbed pre-campaign data (Step 1 of the Cryer & Chan (Reference Cryer and Chan2008) process). We then extended this model to the full time series and adjusted it to account for extra information (such as treatment effects) and control for potential confounding events using additive and innovative outliers (Steps 2 to 5 of the Cryer & Chan (Reference Cryer and Chan2008) process). The effects of the four campaign periods were modelled separately from each other; therefore, the estimated effect of one campaign at any time point was in addition to any estimated effect of other campaigns.
We were able to estimate longer-term effects beyond the campaign periods because of the way we modelled the intervention effects. Rather than modelling the campaign effects as a one-shot change of level, we modelled them as an initial level change followed by decay over time. We did not make any ex ante assumptions on how quickly the effect would decay; therefore, the effects could decrease to zero right at the end of the campaign period or persist over years.
Consistency of observed treatment effects
To investigate the consistency of the treatment effects, we randomly selected a single cafeteria using the randomizr package in R and modelled the impact of the promotional periods at that location.
Additional information
The statistical significance of model parameters was conducted using a Z-test of coefficients, with a significance level of α = 0.05.
Results
Product availability: the proportion of vegan and vegetarian products over time
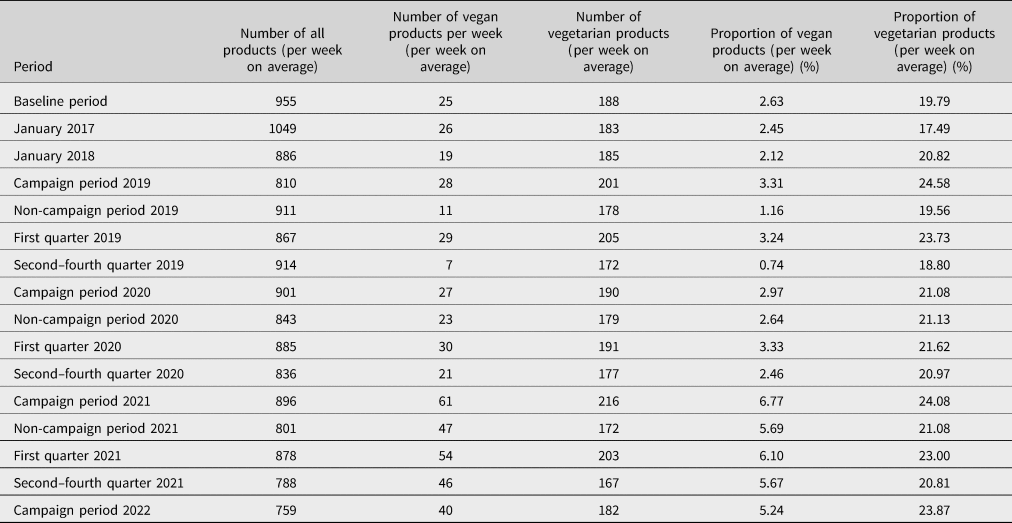
The availability of vegan and vegetarian products – expressed as a proportion of total products – increased numerically during the campaign periods (see Supplementary Figure S1 in the Supplementary Appendix).Footnote 4 Vegan products accounted for 2.62% (N = 25/955) of products during the baseline period, but 2.97% (N = 27/901) during the campaign in 2020, 6.77% (N = 61/896) in 2021 and 5.24% (N = 40/759) in 2022.Footnote 5
The pattern for the availability of vegetarian products was similar to that observed for vegan products. Specifically, vegetarian products accounted for 19.79% (N = 188/955) of products in the baseline period, rising to 24.08% (N = 216/896) in 2021 and 23.87% (N = 182/759) in 2022. See Table 1 for more details on the availability of vegan and vegetarian products for different periods.
H1: The Veganuary promotion increased the proportion of vegan meals sold during the annual campaign periods.
Availability of vegan and vegetarian products for different periods

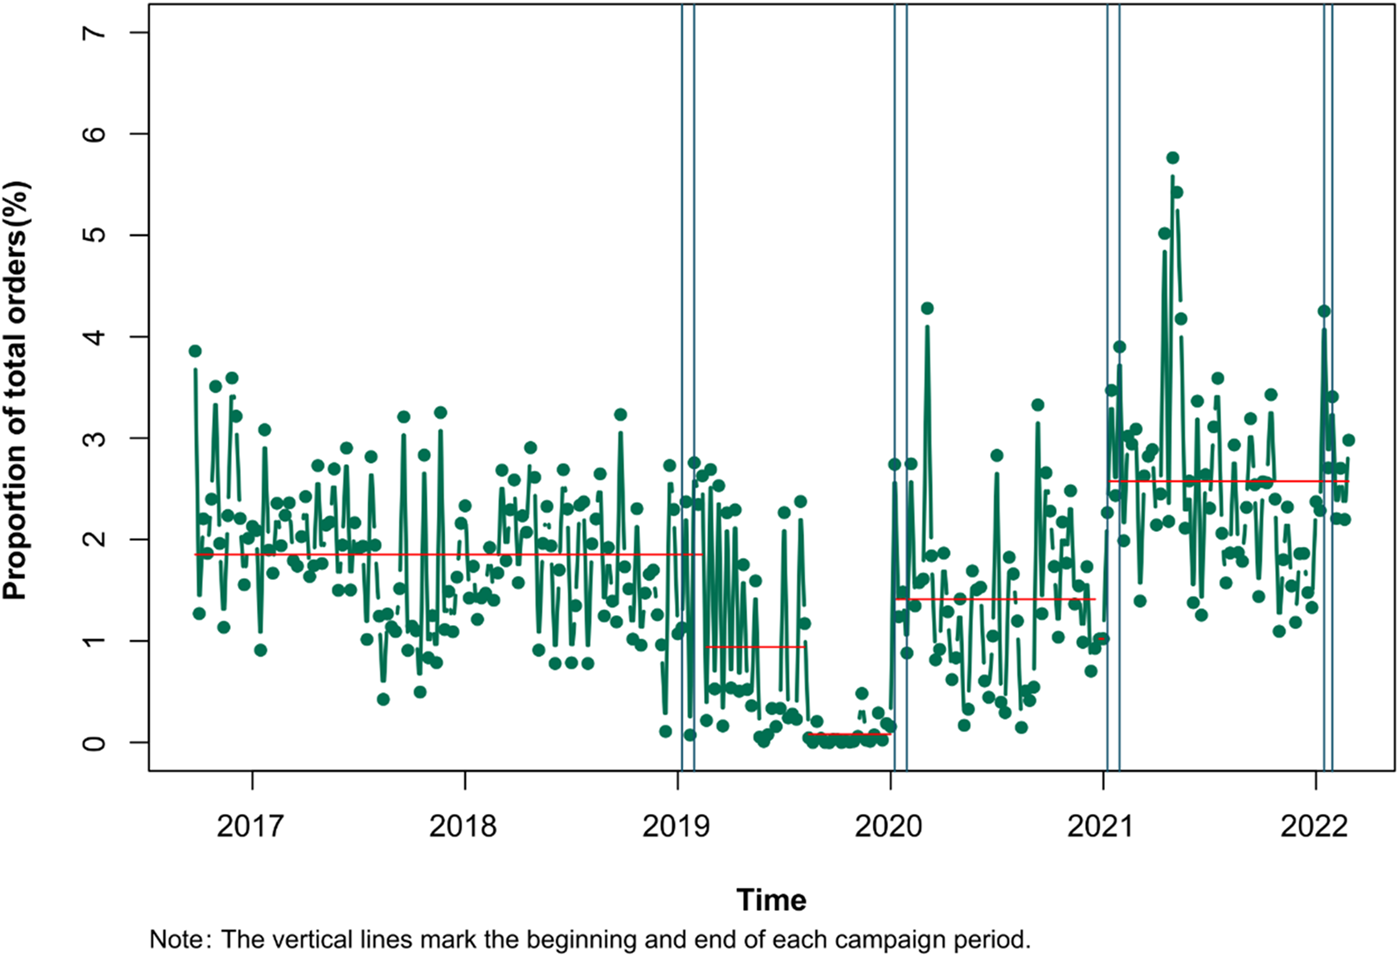
Figure 3 illustrates the proportion of total weekly sales accounted for by vegan products throughout the study period. In Figure 3, a change in the horizontal red line represents “break points” in the time series (which are points within a dataset where the statistical properties – mean and variance – change).Footnote 6 Upon initial inspection, the 2021 and 2022 campaign periods appeared to have been particularly successful in increasing sales of vegan products: higher sales volumes followed the “break points” that marked the 2021 period of promotional activity.
Vegan sales (weekly), proportion of total sales.

Although change points gave some indication of major shifts in the time series of the proportion of total weekly sales for vegan products, our main method of identifying the campaign effects was to estimate the coefficients of transfer functions embedded in an ARIMA model. The results of this analysis follow.
Statistically significant campaign effects were observed for the 2020 (ω 1 2020 = 0.016, p < 0.01), 2021 (ω 1 2021 = 0.021, p < 0.001) and 2022 (ω 1 2022 = 0.021, p < 0.001) campaign periods (see Table 2 for the full model). However, the absence of 2019 from the model suggests that the initial Veganuary campaign did not have a statistically significant impact upon vegan product purchases in the observed period.
Full time series ARIMA (3,1,1) (0,0,0)52 model parameters, vegan

Log likelihood = 983.4, Akaike information criterion (AIC) = −1942.8.
The 2019 transfer function was omitted due to parameter estimates with p-values that did not reach the threshold required for statistical significance.
Given the low proportion of vegan sales in the baseline period (1.86%, SD = 0.714%), the sizes of the initial effects were large – almost doubling the baseline level. Specifically, the average proportion of vegan sales during the 2021 and 2022 campaign periods was 3.02% and 3.14%, respectively.
Using the average number of total meals sold per week in each campaign period, the initial effects of 2020, 2021 and 2022 campaigns translated into extra sales of approximately 107, 190 and 181 vegan meals per week. Supplementary Table S2 in the Supplementary Appendix contains a summary of initial effects.
H2: The Veganuary promotion increased the proportion of vegetarian meals sold during the annual campaign periods.
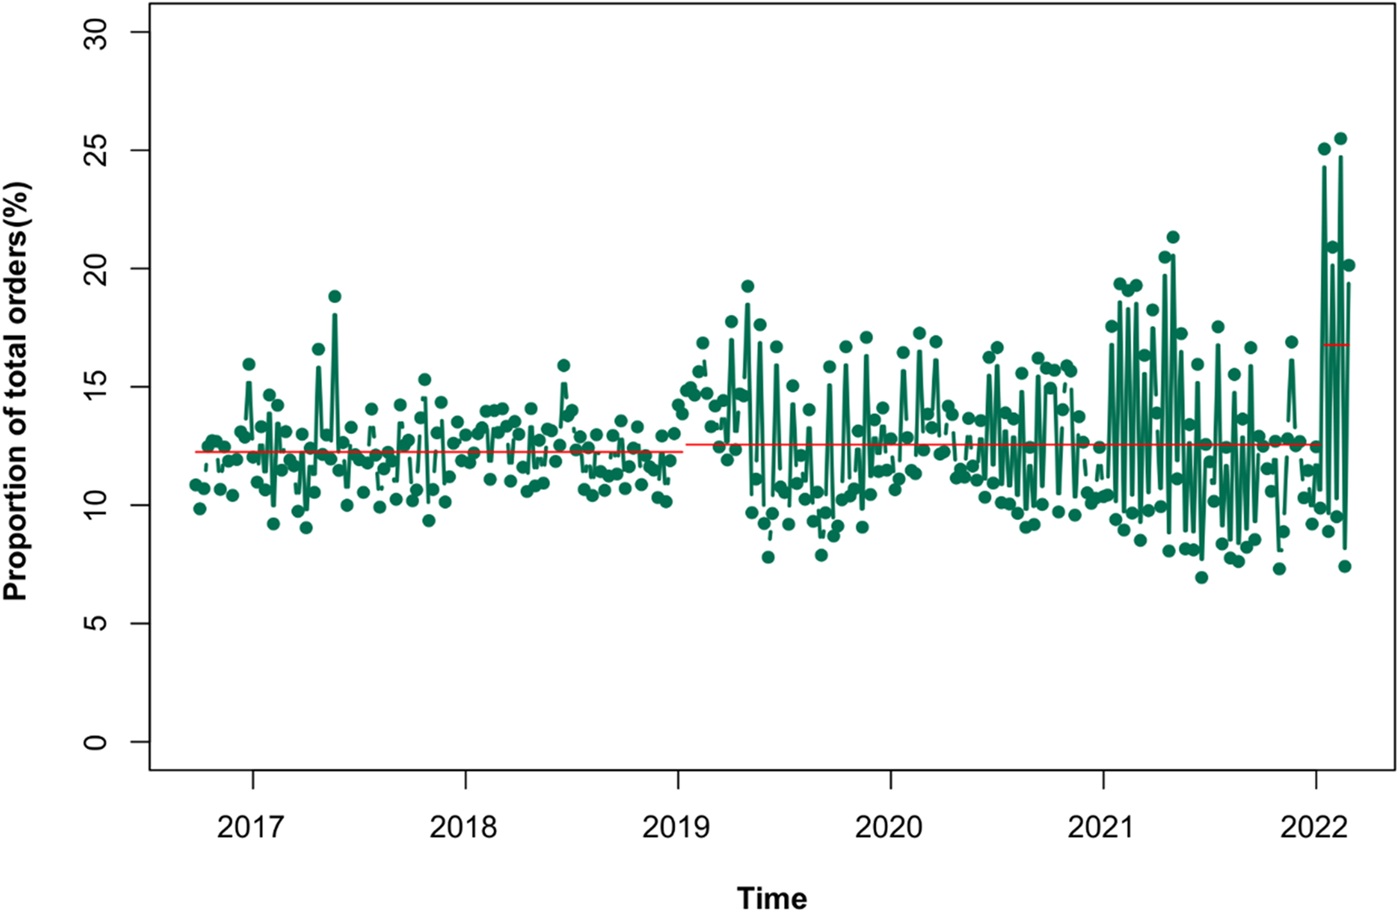
Figure 4 illustrates the proportion of total weekly sales accounted for by vegetarian products throughout the study period. For vegetarian sales, there was a small upward shift in mean sales following the 2019 promotional activity, and a large shift in mean sales followed the 2022 promotional activity. These results suggested that the 2022 campaign, in particular, may have been successful in increasing the sales of vegetarian products.
Vegetarian sales (weekly), proportion of total sales.

The ARIMA intervention model highlighted statistically significant campaign effects for the 2019 (ω 1 2019 = 0.032, p < 0.01), 2021 (ω 1 2021 = 0.028, p < 0.01) and 2022 (ω 1 2022 = 0.097, p < 0.001) campaign periods. (See Table 3 for the full model.) However, in contrast to the vegan sales model, the vegetarian model indicated that the 2020 campaign did not have a statistically significant impact upon vegetarian product sales.
Full time series ARIMA (4,0,0) (0,0,0)52 model parameters, vegetarian

Log likelihood = 720.56, AIC = −1399.11.
The 2020 transfer function was omitted due to parameter estimates with p-values that did not reach the threshold required for statistical significance.
Compared to vegan sales, the baseline level of the proportion of vegetarian sales was much higher (12.22%, SD = 1.57%), and the initial campaign effects were smaller – a 26.2%, 22.9% and 79.3% increase relative to the baseline level. Following the campaign, we observed the average proportion of vegetarian sales increased to 14.58%, 14.18% and 16.09% for the 2019, 2021 and 2022 campaign periods.
Using the average number of total meals sold per week in each campaign period, the initial effects of 2019, 2021 and 2022 campaigns translated into extra sales of 232, 253 and 835 vegetarian meals per week. See Supplementary Table S3 in the Supplementary Appendix for a summary of initial effects.
Investigation of the shape and duration of observed treatment effects
Vegan sales
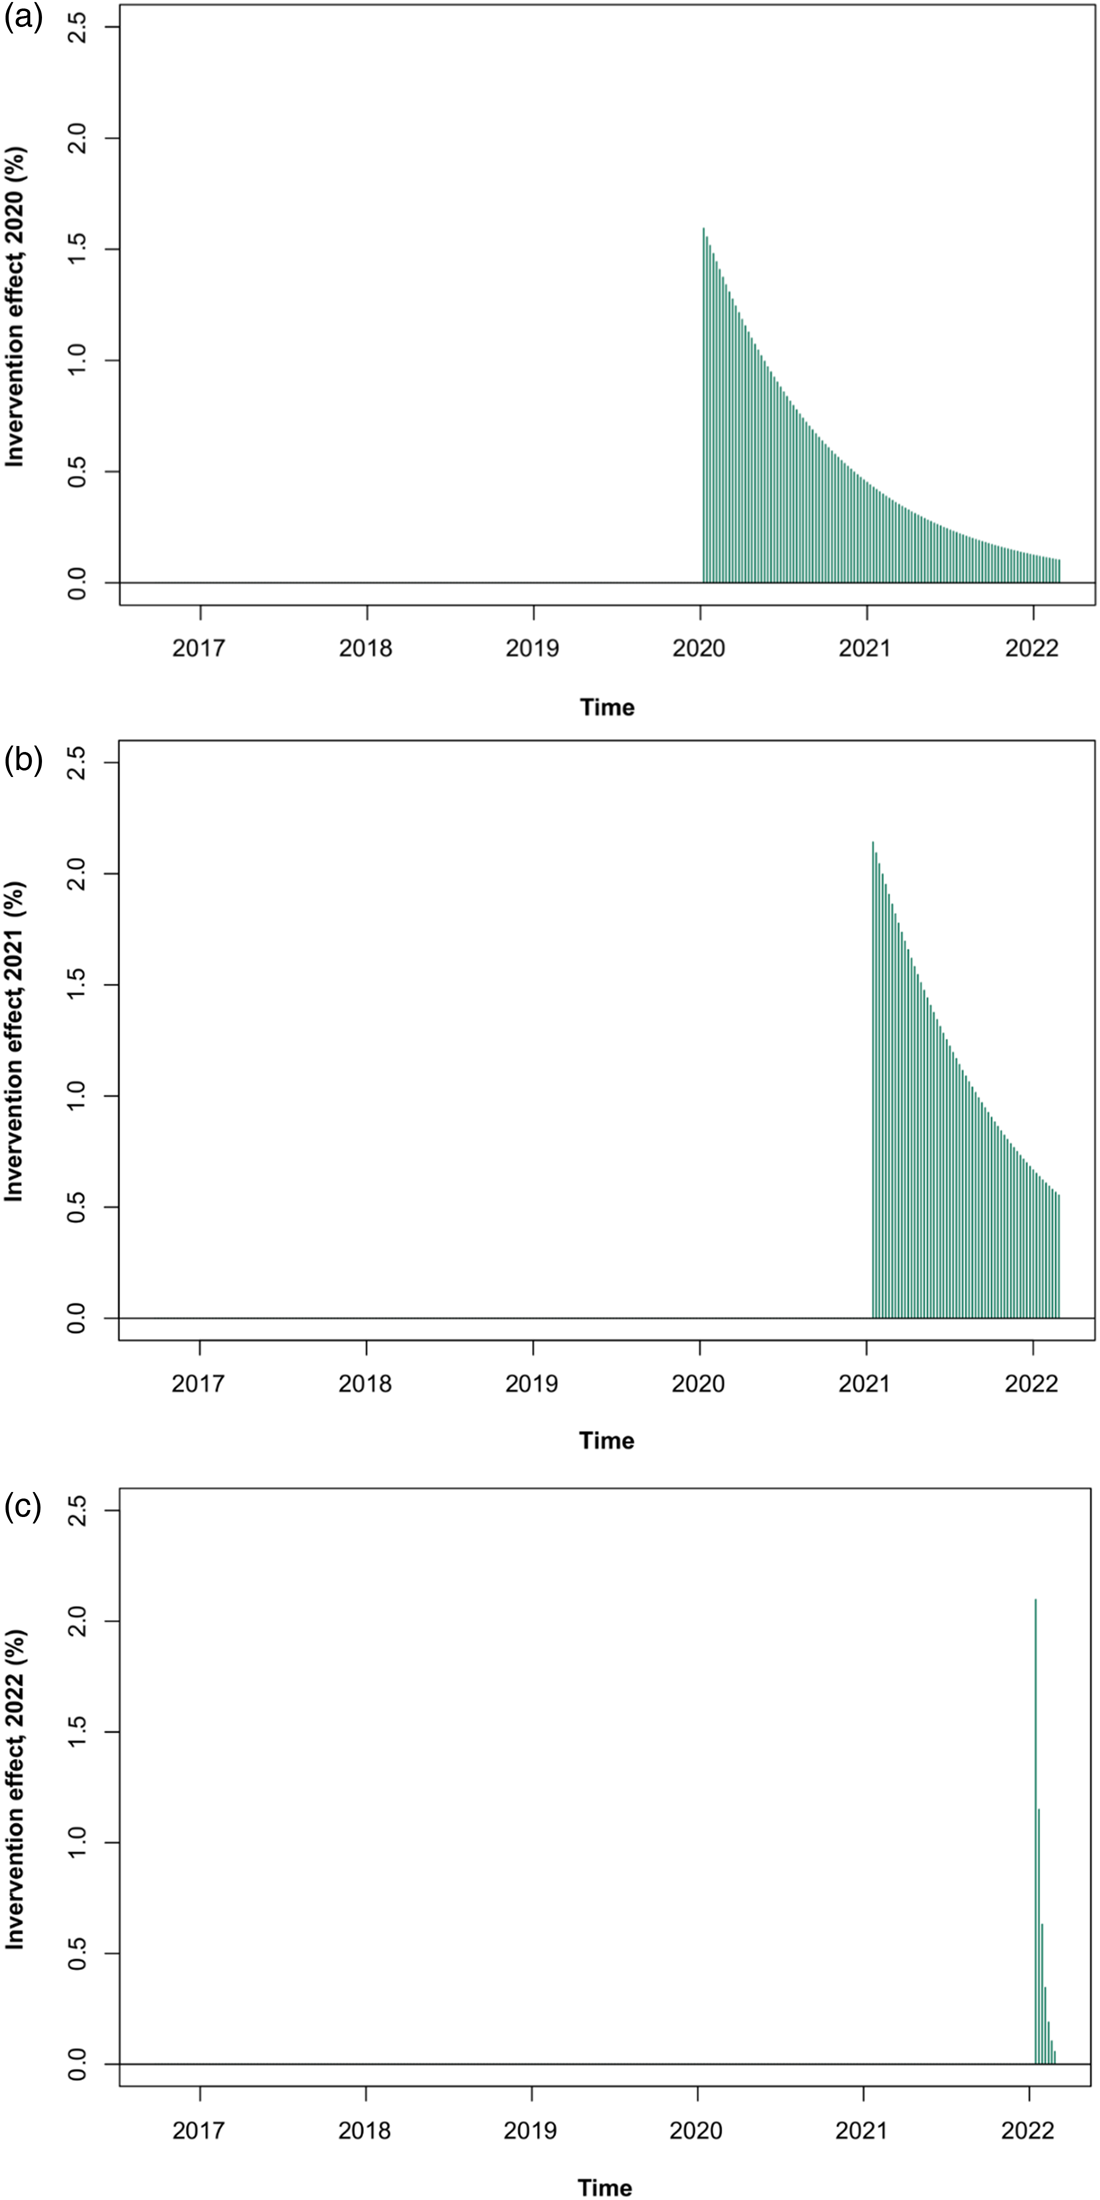
The effect of the 2020 campaign activity was most pronounced throughout campaign activity in 2020 (see Figure 5 for an illustration). It peaked at a 1.6 percentage point increase in sales, with a gradual decay over time (δ 2020 = 0.976, p < 0.001). The model suggests there was an enduring treatment effect, with a positive impact felt in 2021 (approximately 0.44 percentage points in January 2021), and a small positive impact still present in early 2022.
Estimated absolute treatment effects (vegan), 2020/2021/2022 campaigns (in percentage points).

The effect of the 2021 campaign activity had a similar shape to the effect in 2020: the decay was comparable (δ 2021 = 0.977, p < 0.001); however, the peak was higher (an increase of 2.1 percentage points). Further, the effect was also persistent: the effects of the intervention were still observed in 2022 (approximately 0.63 percentage points in January 2022).
The 2022 campaign period had a spike with a similar magnitude to 2021 (2.1 percentage points), but in contrast to previous years, the decay in effect appeared more rapid (δ 2022 = 0.548, p = 0.052). However, caution should be exercised when interpreting the decay function, given its p-value did not meet the threshold for statistical significance (p = 0.052).
Vegetarian sales
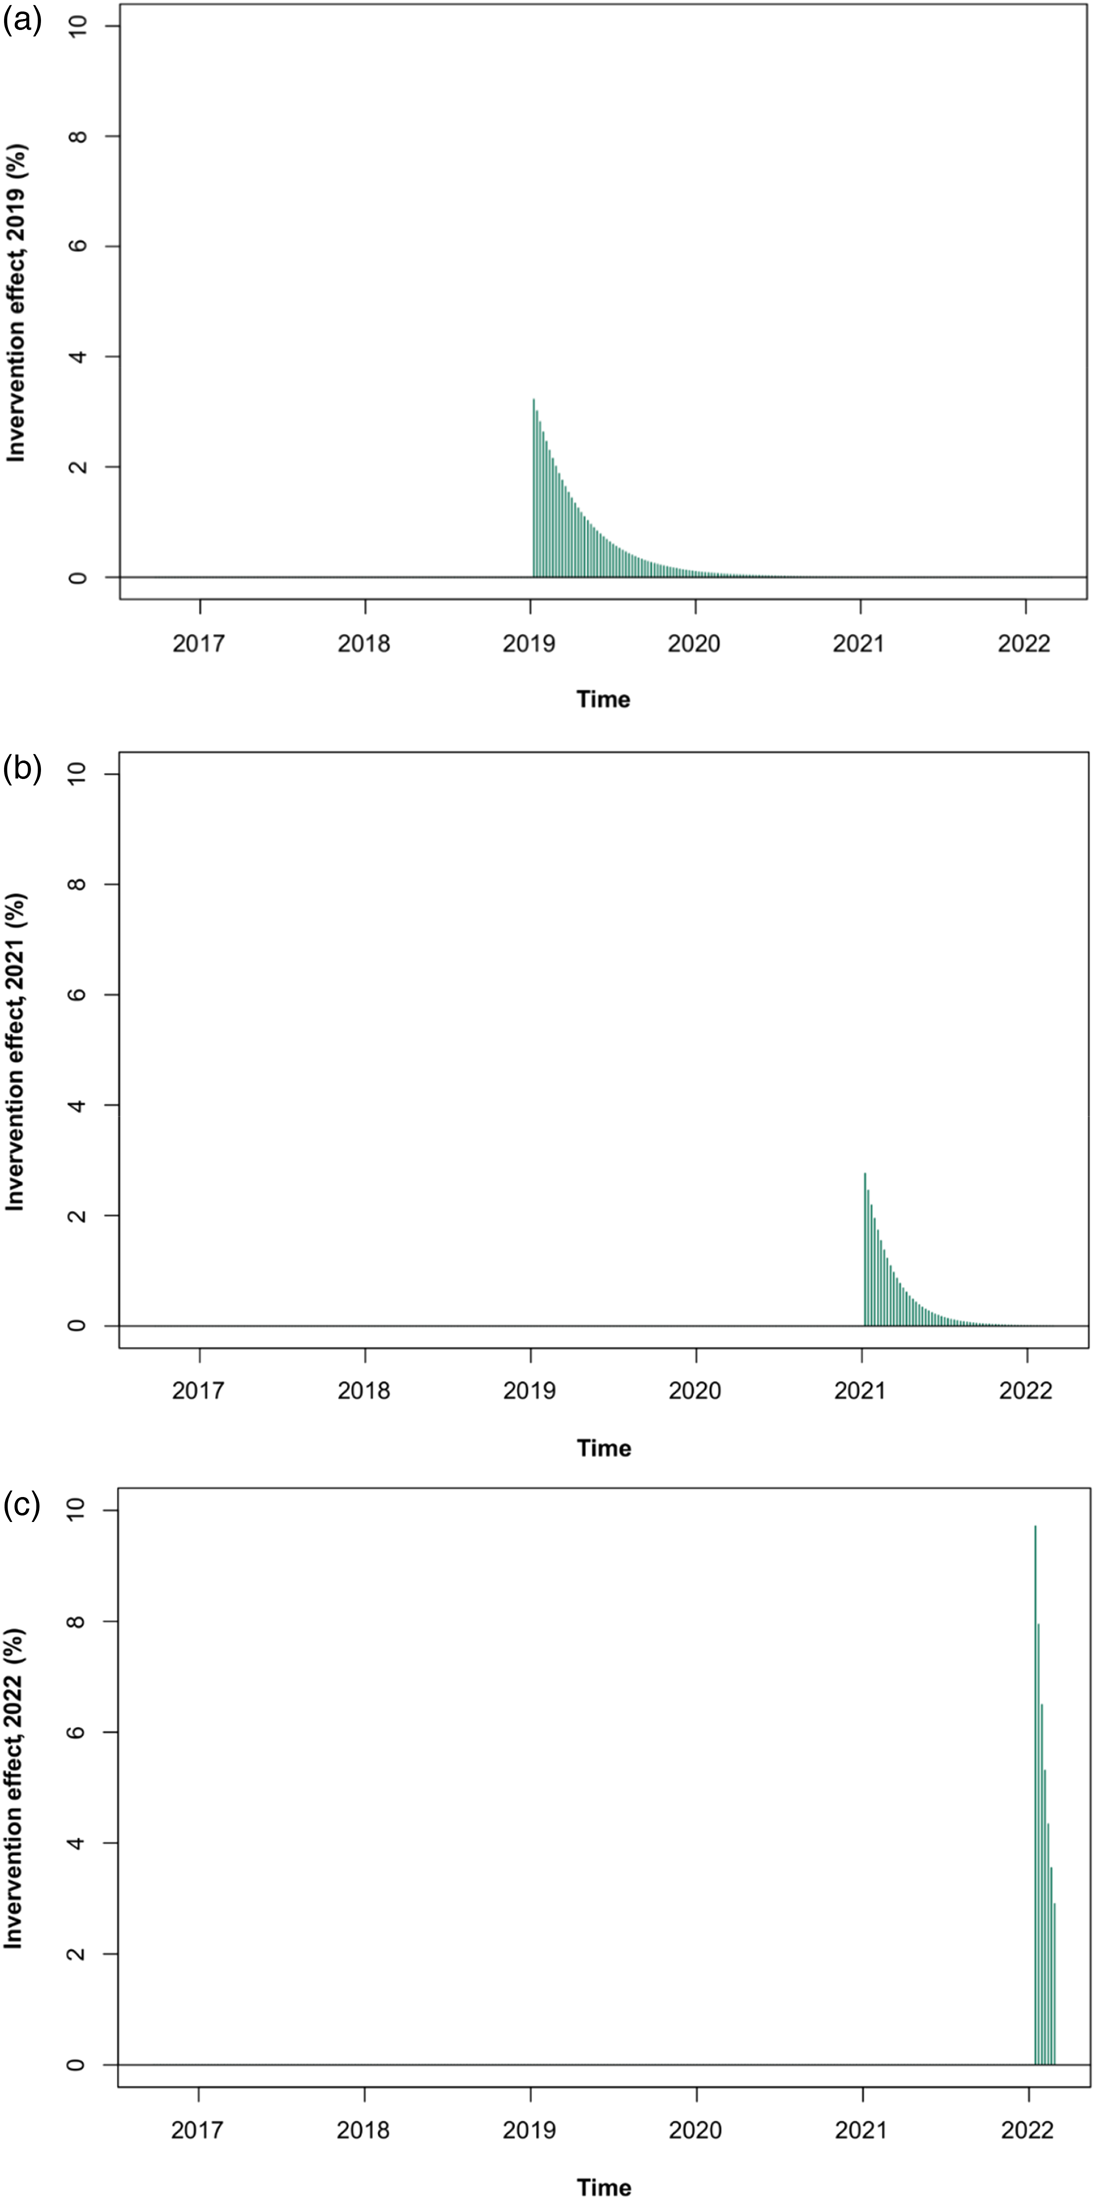
The 2019 campaign effect peaked at a 3.2 percentage point increase in vegetarian product sales with a gradual decay over time (δ 2019 = 0.935, p < 0.001) (see Figure 6). The model suggested that the effect persisted over a period of more than one year, with a small positive impact still present in early 2020.
Estimated absolute treatment effects (vegetarian), 2019/2021/2022 campaigns (in percentage points).

The treatment effect for the 2021 campaign activity had a similar shape to the effect in 2019; however, the peak was lower (an increase of 2.8 percentage points), and the decay was faster (δ 2021 = 0.890, p < 0.001). Due to this faster decay, the effect had receded to a negligible – near zero – value in the last quarter of 2021.
The 2022 campaign period had a much larger initial effect compared to previous years – peaking at a 9.7 percentage point increase in vegetarian product sales. However, the decay was also faster than in previous years (δ 2022 = 0.818, p < 0.001).
Consistency of observed treatment effects
In order to check the consistency of treatment effects, we randomly selected one workplace cafeteria to establish if the findings from the aggregate data were manifested at a single cafeteria level. The models fitted for this cafeteria suggested a differential pattern of effects.
Specifically, no campaign effects were identified for vegan sales; further, for the proportion of vegetarian sales, effects were only identified for the 2019 campaign activity. This suggests that the campaign effects are likely to have differed across workplace cafeterias. For full details of the results, please see section 1.4 of the Supplementary Appendix.
Discussion
We conducted an interrupted time series analysis to investigate the impact of a recurring Veganuary campaign, using five years of data from a large UK catering company. The results of this study indicate that the campaign has had a consistent positive impact on the sales of both vegan and vegetarian products across workplace cafeterias, although its success differed according to year. When observed, the positive effects of the campaign typically persisted beyond the immediate campaign period.
In terms of wholly plant-based (vegan) options, statistically significant increases in the proportion of vegan products purchased were noted for the 2020, 2021 and 2022 campaigns, with the largest uplifts noted for the latter two periods. While, when viewed in isolation, the absolute increases appear small – a 1.6 percentage point increase in 2020, a 2.1 percentage point increase in 2021 and a 2.1 percentage point increase in 2022 – they represent substantial and significant increases over the baseline levels of consumption (2.05% and 1.68% of total sales in the same weeks of 2017 and 2018, respectively). The proportional increases in the sale of vegan products relative to the baseline level were 86–113%.
Vegetarian sales also rose in three of the four years in which the campaign ran; however, statistically significant increases were observed in 2019 (a 3.2 percentage point increase), 2021 (a 2.8 percentage point increase) and 2022 (a 9.7 percentage point increase). The uplifts in vegetarian consumption over the baseline (11.74% and 12.50% in January 2017 and 2018) were smaller relative to those for vegan products, aside from in 2022, likely because the baseline consumption of vegetarian products was higher. This was an initial increase of 23–79% in the proportion of total weekly sales for vegetarian products relative to the baseline level, depending on the year. The effect sizes observed in this study are broadly comparable with those observed in the literature (Garnett et al., Reference Garnett, Balmford, Sandbrook, Pilling and Marteau2019; Trewern et al., Reference Trewern, Chenoweth, Christie and Halevy2022).
The effects of the campaigns often endured. We found that the increases in sales of vegan products persisted over time aside from in 2022: the 2020 and 2021 campaign effects’ decays were gradual, meaning small increases in consumption appeared to be present in subsequent years. As noted in the results section, the 2022 decay coefficient did not meet the threshold for statistical significance, perhaps suggesting that the campaign effect may have diminished in a form that differed from the autoregressive pattern fitted for the 2020 and 2021 effects.Footnote 7
As for vegetarian products, the impact of the campaigns in the first two years was relatively persistent: for 2019, positive effects appeared to be present in 2020; and for 2021, the effects appeared to be present until the end of that year. This is an advance over many papers in the current literature, where the longevity of changes in sustainable sales over subsequent years was not measured (Garnett et al., Reference Garnett, Balmford, Sandbrook, Pilling and Marteau2019), or measured for a shorter period of time (Trewern et al., Reference Trewern, Chenoweth, Christie and Halevy2022).
However, it should be noted that it is likely that there was heterogeneity in the effectiveness of the intervention across workplace cafeterias. When examining data for a randomly selected cafeteria, similar effects for vegan products were not observed and similar effects for vegetarian products were only observed for the 2019 campaign.
In this study, it appeared that altering the availability of vegan and vegetarian products positively influenced consumption. The years in which plant-based products accounted for a higher proportion of products were the years in which significant increases in sales were observed; further, statistically significant associations between vegan/vegetarian product availability and sales were noted. These results suggest that, when used in collaboration with promotional material that increases salience, increasing the availability of vegan and vegetarian items in cafeteria menus can have an ongoing positive impact on sales. Such an approach also appears to be effective in other settings, including supermarkets: similar interventions have resulted in enduring increases in the sale of plant-based products, including in less affluent areas (Trewern et al., Reference Trewern, Chenoweth, Christie and Halevy2022). This observation about the importance of availability is also congruent with the findings of Garnett et al. (Reference Garnett, Balmford, Sandbrook, Pilling and Marteau2019), Pechey et al. (Reference Pechey, Cartwright, Pilling, Hollands, Vasiljevic, Jebb and Marteau2019) and Public Health England (2018).
The rapidly increasing consumption of plant-based options may have played some unmeasurable role in the observed larger effects in recent years. Over the past decade, there have been considerable increases in both the proportion of the population who identify as vegan and the number of consumers who have tried plant-based options. A study analysing food consumption data from the National Diet and Nutrition Survey found that consumption of plant-based foods increased from 6.7% in 2008–2011 to 13.1% in 2017–2019 (p < 0.01) (Alae-Carew et al., Reference Alae-Carew, Green, Stewart, Cook, Dangour and Scheelbeek2022). Previous research has observed that once actions become embedded in a culture or society, widespread behaviour change often follows (Gelfand & Jackson, Reference Gelfand and Jackson2016); therefore, in this case, the rapid “mainstreaming” of veganism and plant-based consumption may have had an impact on consumption.
Nevertheless, this study is suggestive that a Veganuary campaign – which involves increasing the availability of plant-based options on a menu and promoting them – can have a sustained impact on behaviour. There is mounting evidence that offering plant-based food by default can increase consumption (Reisch & Sunstein, Reference Reisch and Sunstein2021; Krattenmacher et al., Reference Krattenmacher, Casal, Dutkiewicz, Huchard, Sanders, Treich, Wadiwel, Williams, Bègue, Cardilini and Dhont2023). This study suggests that a less forceful approach can also be effective and may be a useful tool in meeting Net Zero commitments (BEIS, 2021): such campaigns could be instituted by companies who have climate and sustainability commitments, as a means of meeting those commitments. Similar interventions could also be easily implemented by public institutions that have catering facilities and that want to promote healthy and sustainable diets, such as hospitals, schools or universities (Krattenmacher et al., Reference Krattenmacher, Casal, Dutkiewicz, Huchard, Sanders, Treich, Wadiwel, Williams, Bègue, Cardilini and Dhont2023).
This study involved the application of a robust analytical technique to interrogate an expansive, dynamic dataset encompassing 2,255,404 meals and 1,838 products. The dataset included workplace cafeterias from five client companies that a large contract catering company served, with geographically dispersed workplace cafeterias spanning much of the United Kingdom. It provided a unique opportunity to examine the effects of an annual campaign focusing on promoting plant-based meal options which was of a relatively large scale.
However, this study also has several limitations, which are discussed in more detail in Section 1.5 of the Supplementary Appendix. First, the exclusion procedure could have led to selection bias in the set of workplace cafeterias included in the final dataset. We excluded workplace cafeterias with more than 5% missing data or that had missing data for two consecutive weeks, in order to ensure quality of data after imputation. While further investigatory analysis – in which we re-ran our primary model including additional cafeterias with higher levels of missing data, or removing the two largest cafeterias – provided results similar to those reported (see Supplementary Tables S16 and S17 in the Supplementary Appendix), the results of this study should be considered with the potential for selection bias in mind.
Second, the campaign was only implemented in a limited number of cafeterias in the United Kingdom, which belonged to a selected set of client companies served by the large catering company. While the number of cafeterias in this study's dataset was large compared to many in the literature, the extent to which the results may be generalised – that is, whether similar interventions could be implemented at scale (including internationally) – remains unclear.
Third, limited information was available about the details of the annual campaign activities and the fidelity of the implementation of the campaign activities across the cafeterias. Differential level of fidelity could contribute to the inconsistency of effects between the aggregate level and the individual workplace cafeteria level; lower fidelity was also likely to be a problem during Covid-19, when supply chain issues were serious.Footnote 8 A lack of information on implementation restricts our ability to conduct more detailed and in-depth examination of the mechanisms that drove the intervention effects and the heterogeneity across years and branches. Therefore, such examination should be conducted in future research.
Conclusion
This study provides unique evidence regarding the potential efficacy – and longevity – of the effects of Veganuary campaign activity which increased the availability and salience of plant-based meal options. Additionally, the intervention investigated in this study is relatively low cost – particularly as plant-based options are reducing in cost (Proveg, 2022) – and relatively straightforward to implement compared to other interventions such as customer education and individual lifestyle counselling. Therefore, similar approaches may play an important role in helping to accelerate the widespread adoption of sustainable diets.
Supplementary material
To view supplementary material for this article, please visit https://doi.org/10.1017/bpp.2023.27.
Data availability
Due to a non-disclosure agreement with the data owner, we are unable to share the data used for this study. However, we will make our analysis code available in a public repository upon publication. The study protocol was pre-registered and publicly available on the Open Science Framework (https://osf.io/3zwhs).
Funding
This study was funded by Food Standards Agency, project number: FS900208. Food Standards Agency was not involved in the design, execution, analysis and interpretation of the data, or writing of the study.
Competing interest
The authors declare none.


 Open access