


1. Introduction
The knowledge of heat-transfer rates from spherical particles at high flux levels can significantly contribute towards designing energy systems associated with space industries and nuclear reactors. The primary mode of heat transfer in such energy systems is film boiling in which a vapour layer wraps the heated spherical surface preventing its contact with the liquid. Film boiling can be characterized as natural convection film boiling and forced convection film boiling. In natural convection film boiling the motion of the liquid over the heated specimen is caused by the viscous drag forces of the rising vapour acting on the liquid whereas in forced convection film boiling the liquid is forced to flow over the heated specimen. The information about the film boiling phenomenon can be used to determine core cooling ability after certain hypothetical nuclear accidents that result in extensive core melting. The concept of film boiling has also been utilized in the area of naval applications for drag reduction techniques by inserting a vapour layer in-between the surface and the surrounding liquid (Vakarelski et al. Reference Vakarelski, Marston, Chan and Thoroddsen2011).
Theoretical and experimental investigation on film boiling of saturated liquid such as carbon tetrachloride, benzene, ethyl alcohol, n-hexane over a cylinder were performed by Bromley, LeRoy & Robbers (Reference Bromley, LeRoy and Robbers1953). They reported that for high velocity flows the separation angle was close to  $90^\circ$, whereas for sufficiently low velocities the separation angle approaches 180 $^\circ$. Motte & Bromley (Reference Motte and Bromley1957) used the same experimental set-up as Bromley et al. (Reference Bromley, LeRoy and Robbers1953) with some modifications to study subcooled (when the temperature of the liquid is below its boiling point) forced convection film boiling over a cylinder with turbulence. It was found that with an increase in subcooling and velocity, the heat transfer rate also increases. Bradfield (Reference Bradfield1967) also studied film boiling over a sphere using experimental techniques, and concluded that the minimum temperature of the sphere above the boiling temperature of liquid required to sustain the film boiling increases linearly with an increase in subcooling. Transient subcooled forced convection film boiling over a sphere was experimentally investigated by Walford (Reference Walford1969). Different regimes of film boiling over the sphere have been identified, and the subsequent heat flux behaviour in those regimes was reported.
Kobayasi (Reference Kobayasi1965) theoretically investigated film boiling heat transfer from a sphere moving downward in a liquid and proposed a general solution for predicting the boiling heat transfer coefficient as a function of certain parameters such as Reynolds number, liquid–vapour viscosity ratio, Prandtl number, size of the sphere and the kinematic viscosity of the liquid. However, the findings of Kobayasi (Reference Kobayasi1965) were not accurate owing to the incorrect pressure used for the theoretical derivation (Hesson & Witte Reference Hesson and Witte1966).
To derive the theoretical heat transfer rate, Bromley et al. (Reference Bromley, LeRoy and Robbers1953) and Kobayasi (Reference Kobayasi1965) used an imposed pressure gradient from the free stream. Additionally, Bernoulli's theorem was applied to get an additional equation in terms of the frictional loss in vapour. The problem was further simplified by considering saturated liquid flow around the body. When the liquid is at saturation temperature there will be no heat flux going into the bulk liquid, and all the heat leaving the sphere is used in vaporizing and superheating the vapour. As the heat transfer phenomenon is straightforward in the case of saturated liquid, the energy conservation equation is not solved, and the calculations in the liquid become simple. However, in practical situations, the liquids are not saturated. Therefore, an energy equation should be solved both in the liquid and the vapour phase to obtain an accurate temperature distribution to properly characterize the heat transfer process around the body. In the present investigation, we solve the energy equation in both the liquid and the vapour phases to obtain the temperature distribution in both phases.
Witte (Reference Witte1967, Reference Witte1968a,Reference Witteb) and Witte & Orozco (Reference Witte and Orozco1984) carried out experimental and theoretical investigations of forced convection film boiling from a sphere moving in a liquid. The experiment of Witte (Reference Witte1968a) used a transient technique in which a heated sphere attached to a swinging-arm apparatus was passed through a pool of liquid sodium. The heat transfer rates from the sphere to the liquid sodium were measured, and were found to be in good agreement with the theoretical expressions for heat transfer from a sphere during forced convection with the assumption of potential flow in liquid sodium. Witte (Reference Witte1968b) assumed a linear profile for velocity in the vapour film and reported the forced convection film boiling from a sphere in a saturated liquid. The effect of a nonlinear velocity profile within the vapour film on subcooled flow film boiling from a sphere is analysed by Witte (Reference Witte1967) and Witte & Orozco (Reference Witte and Orozco1984). While calculating the vapour boundary layer thickness, Witte (Reference Witte1967) neglected the effect of radiation, and argued that for highly subcooled liquid the energy required for the vaporization of liquid can be ignored in comparison with the heat energy going into the bulk liquid. In contrast, Witte & Orozco (Reference Witte and Orozco1984) included the heat energy required to vapourize the liquid and concluded that the results based on the nonlinear velocity profile produce results comparable to the experiments. The liquid velocity at the vapour–liquid interface was calculated from the potential flow theory in all the investigations. Additionally these theoretical investigations did not consider buoyancy in their analysis. We will demonstrate in § 3 that buoyancy plays a crucial role in obtaining results that are similar to the experiments.
Dhir & Purohit (Reference Dhir and Purohit1978) performed theoretical and experimental investigations to determine the effect of flow velocity, subcooling and initial sphere temperature on film boiling heat transfer from a sphere. Their theoretical analysis, although including the effect of buoyancy, was restricted only to natural convection film boiling over a sphere where the surrounding liquid was stagnant. The vapour film was assumed to be stable, and very thin in comparison with the radius of the sphere, so that the nonlinear behaviour of the film can be neglected. With an increase in both sphere and bulk water temperature, Dhir & Purohit (Reference Dhir and Purohit1978) observed a decrease in the film boiling heat transfer coefficient owing to an increase in the vapour film thickness. They also reported that the minimum temperature of the sphere to sustain a stable film depends only on subcooling, and increases linearly with subcooling.
An experimental study of transient film boiling on different geometries (spheres, cylinders, flat plates) with different coolant velocities was also conducted by Jouhara & Axcell (Reference Jouhara and Axcell2009). Their study on the nature of the vapour–liquid interface and the collapse modes has revealed a new model for film collapse, in which an explosive liquid–solid contact is followed by film reformation and the motion of a quench front over the hot surface. The heat transfer coefficients and heat fluxes during film boiling were found essentially to depend on the temperature of the body and water subcooling. A theoretical model was also developed that predicted the heat transfer coefficients to within  $10\,\%$ of experimental values for water subcooling above 10 K. However, their theoretical model was restricted to plane surfaces only.
In this investigation, we develop a theoretical model to determine the heat transfer characteristics and boundary layer separation behaviour owing to film boiling from a heated spherical particle moving slowly in water under the influence of buoyancy unprecedented to the earlier theoretical studies. A comparison of our theoretical model with the experimental study of Jouhara & Axcell (Reference Jouhara and Axcell2009), and the theoretical model of Witte & Orozco (Reference Witte and Orozco1984), is also performed to access the efficacy of our model.
The methodology for the development of the theoretical model is presented in § 2. Results from our model are discussed in § 3 and the conclusions drawn from this study are given in § 4.
2. Methodology
The schematic of film boiling over a sphere is shown in figure 1. When the liquid comes in contact with the heated sphere, a vapour layer is formed around the sphere as the temperature of the sphere is higher than the saturation temperature of the liquid. Heat conduction occurs through the vapour layer. A portion of this heat is utilized in vaporizing the liquid that adds to the vapour layer, increasing the vapour layer thickness. Another portion of the heat is diffused into the bulk liquid. Figure 1 manifests the vapour layer and the liquid layer around the sphere. The vapour boundary layer moves past the heated sphere and is influenced by both the sphere and the liquid layer. The liquid layer only feels the influence of the vapour layer and is not in direct contact with the sphere. We aim to theoretically determine the heat transfer rates during the film boiling from the sphere including the effects of buoyancy. Our analysis is based on the following assumptions:
Schematic of film boiling over a heated sphere moving in the direction of gravity in water showing temperature  $T_b$ at the surface of sphere, $T_{sat}$ at the vapour liquid interface and $T_w$ in the bulk water.

(i) the liquid–vapour interface is smooth and is in dynamic equilibrium;
(ii) the temperature of the sphere is uniform;
(iii) physical properties of vapour and liquid are evaluated at mean film temperature;
(iv) heat transfer across the vapour layer takes place by conduction only;
(v) inertial effects in the momentum and energy equations of vapour are neglected;
(vi) the flow of liquid around the sphere is governed by potential flow theory;
(vii) the vapour film is axially symmetric.
All of the above-mentioned assumptions are justified from the available theoretical and experimental studies. Bradfield (Reference Bradfield1966) observed that the ripples formed during film boiling in the surrounding liquid at rest tend to dampen as the liquid starts moving. As the velocity of the liquid around the body is increased, the liquid–vapour interface becomes unstable. The velocity range we use in the current investigation is well below the limit for an unstable interface and therefore, it is reasonable to assume a smooth liquid–vapour interface. The uniformity of the temperature of the sphere is justified for low Biot numbers (a non-dimensional quantity that represents the ratio of the thermal resistances inside the body and at the surface of the body)  $Bi = {h L}/{k}$, where $L$ is characteristic length of the body, $k$ is the thermal conductivity of the body, $h$ is convective heat transfer coefficient. Bradfield (Reference Bradfield1967) also found that the maximum discrepancy in heat flux calculations was less than $2\,\%$ if uniform temperature distribution is assumed within the specimen as compared with the case when calculations are performed considering variability in temperature distribution within the sphere. The physical properties of the vapour and the liquid phase were computed by Bromley et al. (Reference Bromley, LeRoy and Robbers1953) from well-defined expressions developed to calculate the average value of the physical property. However, it was concluded that for simplicity all physical properties can be evaluated at the mean film temperature except for the latent heat of vaporization. This justifies our third assumption. Burns (Reference Burns1989) concluded that the film thickness obtained experimentally, and calculated assuming heat transfer across the film by conduction, manifests no significant difference. Therefore, the heat transfer across the vapour film can be assumed to take place solely by conduction. Similar assumptions were made by Bromley et al. (Reference Bromley, LeRoy and Robbers1953) and Motte & Bromley (Reference Motte and Bromley1957). Our fifth assumption is justified owing to the fact that the thickness of the vapour layer is very small in comparison with the diameter of the sphere (Bromley et al. Reference Bromley, LeRoy and Robbers1953; Kobayasi Reference Kobayasi1965; Witte Reference Witte1967; Witte & Orozco Reference Witte and Orozco1984; Jouhara & Axcell Reference Jouhara and Axcell2009). Also, the Péclet number for the range of parameters used in this investigation is small and is consistent with our final solution. Assumption (vi) is justified from the study of Kutateladze (Reference Kutateladze1959) where it has been shown that the assumption of potential flow or viscous flow in the liquid does not make a significant difference.
2.1. Liquid region
We consider the liquid–vapour interface as smooth, and in dynamic equilibrium. Therefore, the shear stress acting on the liquid at the liquid–vapour interface is equal to the shear stress on the vapour at the liquid-vapour interface, and we can write
 \begin{equation} \tau_l = \tau_v \implies \mu_v \left.\frac{\partial{u}}{\partial{y}} \right |_v =\mu_l \left.\frac{\partial{u}}{\partial{y}} \right |_l \implies \left.\frac{\partial{u}}{\partial{y}} \right |_l =\frac{\mu_v}{\mu_l} \left.\frac{\partial{u}}{\partial{y}} \right |_v. \end{equation}
The value of  ${\mu _v}/{\mu _l}$ for water is very small ${\ll }1$. Therefore, according to the sixth assumption, the velocity distribution in bulk liquid is (refer to the Appendix for a detailed derivation)
 \begin{equation} u_r={-}3U\frac{r-R}{R}\cos\theta ,\quad u_\theta=\frac{3}{2} U\sin\theta, \end{equation}
where,  $\theta$ is the azimuthal angle measured from the stagnation point, $r$ is the radial direction, $U$ is the incoming free stream velocity of liquid, $u_r$ is the velocity in the radial direction, $u_\theta$ is the velocity in the azimuthal direction, $R$ is the radius of the sphere.
From figure 1, we can write
(i) $y=r-R$ and
(ii)
$\theta ={x}/{R}$,


where  $x$ is the curvilinear coordinate along the surface of the sphere, and $y$ is the curvilinear coordinate normal to the $x$ direction.
We can transform  $u_r$ and $u_\theta$ in the curvilinear coordinate system as follows:
 \begin{gather} u_r={-}3U\frac{r-R}{R}\cos\theta ={-}3U\frac{y}{R}\cos\frac{x}{R}, \end{gather}
 \begin{gather} u_\theta=\frac{3}{2} U \sin \theta = \frac{3}{2} U \sin \frac{x}{R}. \end{gather}
Next, we consider the energy equation for the liquid in the spherical coordinate system,
 \begin{equation} u_r\frac{\partial{T}}{\partial{r}} + \frac{u_\theta}{r}\frac{\partial{T}}{\partial{\theta}} +\frac{u_\phi}{r\sin\theta} \frac{\partial{T}}{\partial{\phi}} = \alpha_l\left(\frac{\partial^2{T}}{\partial{r^2}} + \frac{2}{r} \frac{\partial{T}}{\partial{r}} \right), \end{equation}
where  $\alpha _l$ is the thermal diffusivity of liquid and $T$ is temperature. Since the flow is assumed to be axially symmetric and there is no component of velocity in the $\phi$ direction, we can write (2.5) as follows:
 \begin{equation} u_r\frac{\partial{T}}{\partial{r}} + \frac{u_\theta}{r}\frac{\partial{T}}{\partial{\theta}} = \alpha_l\left(\frac{\partial^2{T}}{\partial{r^2}} + \frac{2}{r} \frac{\partial{T}}{\partial{r}} \right). \end{equation}
 Sideman (Reference Sideman1966) demonstrated that if heat transfer is assumed to take place in a thin layer near the interface, the term scaling with  $({1}/{r}) ({\partial {T}}/{\partial {r}})$ can be neglected in comparison with the term ${\partial ^2{T}}/{\partial {r^2}}$. Therefore, under this assumption we can modify the (2.6) as follows:
 \begin{equation} u_r\frac{\partial{T}}{\partial{r}} + \frac{u_\theta}{r}\frac{\partial{T}}{\partial{\theta}} = \alpha_l\frac{\partial^2{T}}{\partial{r^2}}. \end{equation}
We use the information from figure 1 for the following transformations:
 \begin{equation} u_\theta =u_l,\ u_r =v_l \;\ x= r\theta \implies {{\rm d}x} = r\,{\rm d}\theta\ ;\ y = r-R \implies {{\rm d} y}= {\rm d}r, \end{equation}
where,  $u_l$ and $v_l$ are the velocities of the liquid in $x$ and $y$ directions, respectively, ${{\rm d} x}$ is the derivative at a given $r$. Substituting (2.8) in (2.7) we get
 \begin{equation} u_l\frac{\partial{T}}{\partial{x}} + v_l\frac{\partial{T}}{\partial{y}} = \alpha_l\frac{\partial^2{T}}{\partial{y^2}}. \end{equation}
 The boundary conditions corresponding to (2.9) considering  $R+\delta \sim R$ are as follows:
(i)
$y \to \infty, T=T_w, \theta \geq 0$;(ii)
$y = 0 , T=T_{sat}, \theta \geq 0$; and(iii)
$0< y \leq \infty, T=T_w, \theta = 0$.


Here,  $T_{sat}$ is the saturation temperature of the liquid, $T_w$ is the temperature of bulk water, $\delta$ is the vapour layer thickness. To convert the partial differential equation (2.9) to an ordinary differential equation, whose solution is already known, we use the transformation of variables (Sideman Reference Sideman1966; Witte & Orozco Reference Witte and Orozco1984) as follows:
 \begin{align} \Delta T= T- T_{sat},\quad \psi=y\sin^2 \theta ,\quad \eta=\int _{0}^{\theta}\sin^3\theta \,{\rm d}\theta ={-}\frac{3}{4}\cos\theta+ \frac{1}{12}\cos3\theta + \frac{2}{3}. \end{align}
Substituting (2.3) and (2.4) into (2.9) and using the variable transform (2.10a–c) leads to
 \begin{equation} \frac{\partial{\Delta T}}{\partial{\eta}}= \frac{2R\alpha_l}{3U} \frac{\partial^2{\Delta T}}{\partial \psi^2}. \end{equation}
Using  ${M}= {2R\alpha _l}/{3U}$ and defining $\beta =({T-T_w})/({T_{sat}-T_{w}})$, we can write
 \begin{equation} \frac{\partial{\beta}}{\partial{\eta}} = M \frac{\partial^2{\beta}}{\partial \psi^2}. \end{equation}
The boundary conditions corresponding to (2.12) are
(i)
$\psi \to \infty, \eta \geq 0 , \beta =0$,(ii)
$\psi =0 , \eta \geq 0 , \beta =1$ and(iii)
$0< \psi \leq \infty, \eta =0 , \beta =0$.


The partial differential equation (2.12) can be converted to an ordinary differential equation using the method of combinations of variables. Defining  $\beta = \psi ^a\, \eta ^b$, where $a$ and $b$ are constants and substituting in (2.12), we get
 \begin{equation} \frac{\psi^2}{M\eta} = \frac{a(a-1)}{b} =\mathrm{constant}. \end{equation}
 The new variable can be of the form  $({c \psi ^2}/{\mathrm {M}\eta } )^d$. Let us define the new variable as ${\gamma = {\psi }/}{\sqrt {4M\eta }}$ (obtained by choosing $d=1/2$ and $c=1/4$) and hence we can write $\beta (\psi, \eta )= \beta (\gamma )$. After expressing the derivatives of $\beta$ in (2.12) in terms of $\gamma$ we get an ordinary differential equation as follows:
 \begin{equation} \frac{{\rm d}^2 \beta}{{\rm d}\gamma^2} + 2\gamma\frac{{\rm d}\beta}{{\rm d}\gamma} =0. \end{equation}
The boundary conditions corresponding to (2.14) will become
(i)
$\gamma =0, \beta =1$ and(ii)
$\gamma =\infty, \beta =0$.


The solution of (2.14) is of the form
 \begin{equation} \frac{T-T_w}{T_{sat}-T_w} = {\rm erf}_c\left(\frac{\psi}{2\sqrt{\mathrm{M}\eta}} \right). \end{equation}
 Equation (2.15) represents the temperature distribution in the liquid, and we can use it to calculate the heat flux,  $q^{\prime \prime }_b$, into the bulk liquid as follows:
 \begin{equation} q^{\prime\prime}_b={-}k_l\left.\left(\frac{\partial{T}}{\partial{y}}\right)\right |_{y=0} = \frac{k_l\Delta T_w \sin ^2 \theta}{\sqrt{{\rm \pi} M\eta}}, \end{equation}
where  $k_l$ is the thermal conductivity of the liquid.
2.2. Vapour region
We write the momentum equation in the  $x$ direction in the vapour region following figure 1 as follows:
 \begin{equation} \rho_v \left(u\frac{\partial{u}}{\partial{x}} + v\frac{\partial{u}}{\partial{y}}\right)={-}\frac{\partial{p}}{\partial{x}} + \Delta \rho g \sin\theta + \mu_v \frac{\partial^2{u}}{\partial{y^2}}, \end{equation}
where  $\Delta \rho = \rho _l-\rho _v$, $\rho _l$ and $\rho _v$ are the densities of liquid and vapour, respectively, and $g$ is the acceleration due to gravity, $u$ and $v$ are the velocities of the vapour in $x$ and $y$ directions, respectively. In stable film boiling regime the bulk liquid motion is considered to be in the curvilinear $x$ direction. For the range of flow velocity considered in this investigation, the Mach number is ${\ll }1$, and hence any compressibility effect is neglected. Neglecting inertial effects in the momentum equation of the vapour owing to the fact that the thickness of the vapour layer is very small in comparison with the diameter of the sphere results in the following equation:
 \begin{equation} \frac{\partial^2{u}}{\partial{y^2}} = \frac{1}{\mu_v}\left(\frac{\partial{p}}{\partial{x}} - \Delta \rho g \sin\theta\right). \end{equation}
The boundary conditions corresponding to (2.18) are
(i)
$y=0, u=0$ and(ii)
$y=\delta, u=3(U \sin \theta )/2$.


Since the vapour layer thickness  $(\delta )$ is thin, the streamwise variation of pressure in the liquid layer as given by the Bernoulli equation is impressed on the vapour layer (Witte Reference Witte1967). Therefore, using Bernoulli's equation in the liquid layer we can write
 \begin{equation} p + \frac{1}{2}\rho_l u_l^2 = \textrm{constant}.\end{equation}
Since the size of the sphere is small the net variation of the gravitational contribution around the sphere in above equation will be negligible. From (2.3) we can write  ${u_l=(3/2)U} \sin \theta = ({3}/{2}) U \sin ({x}/{R})$ and modify equation (2.19) as follows:
 \begin{equation} \frac{{\rm d}p}{{\rm d} x}={-} \rho_l u_l \frac{{\rm d} u_l}{{\rm d} x}={-}\frac{9}{8}\left(\frac{\rho_l U^2}{R} \right)\sin 2\theta . \end{equation}
Substituting (2.20) in (2.18) and solving for the corresponding boundary conditions we get
 \begin{equation} u = \frac{3}{2} U\sin\theta \frac{y}{\delta} + \left( \frac{9}{8}\frac{\rho_l U^2}{\mu_v R} \sin\theta \cos\theta + \frac{\Delta\rho g \sin \theta}{2\mu_v} \right)\left( y\delta - y^2 \right). \end{equation}
 We can see that the velocity in (2.21) is comprised of a linear term,  $({3}/{2}) U\sin \theta ({y}/{\delta })$, and two nonlinear terms, $({9}/{8})({\rho _l U^2}/{\mu _v R}) \sin \theta \cos \theta$ and $({\Delta \rho g \sin \theta })/{2\mu _v}$. The first nonlinear term is due to the imposed pressure gradient by the potential flow of liquid, whereas the second nonlinear term represents the effect of buoyancy. Witte & Orozco (Reference Witte and Orozco1984) in their theoretical model did not consider buoyancy effects. Therefore, if we neglect the buoyancy, then nonlinearity in the velocity profile is sustained only by the imposed pressure. We can further see that the first nonlinear term is proportional to the square of the velocity, and at low velocities, the nonlinear term is dominated by the buoyancy effects.
2.3. Temperature distribution in vapour layer
In (2.21) the vapour layer thickness,  $\delta$, is an unknown. Determination of $\delta$ is important for understanding the heat transfer phenomenon. To compute $\delta$ we start with the energy equation for the vapour layer in the $x$ direction as follows:
 \begin{equation} u\frac{\partial{T}}{\partial{x}} + v\frac{\partial{T}}{\partial{y}} = \alpha \frac{\partial^2{T}}{\partial{y^2}}. \end{equation}
The corresponding boundary conditions for (2.22) are
(i)
$y=0 ,u=0 , T=T_b$ and(ii)
$y=\delta, u=({3}/{2})U \sin \theta, T=T_{sat}$,


where  $T_b$ is the temperature of the sphere. Using assumptions (iv) and (v) (see 2), (2.22) can be written, and solved as follows:
 \begin{equation} \frac{\partial^{2} T}{\partial{y^2}} = 0 \implies T=C_1y +C_2. \end{equation}
Substituting the corresponding boundary condition in (2.23) we get
 \begin{equation} T= T_b + \left(T_{sat} - T_b \right) \frac{y}{\delta}. \end{equation}
This equation represents the temperature distribution in the vapour layer.
2.4. Vapour boundary layer thickness
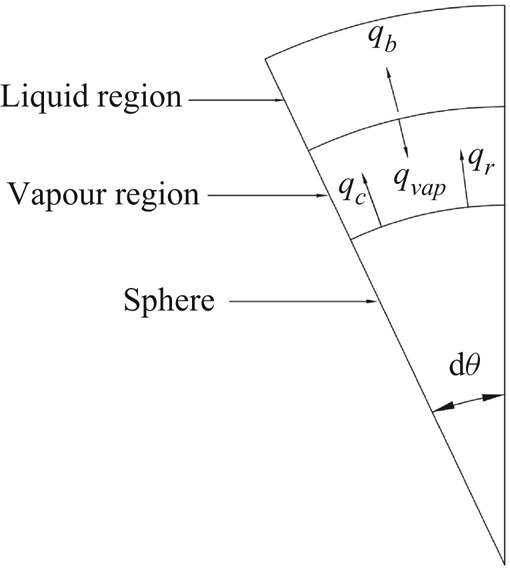
Next, we consider the heating provided by the sphere that results in the vaporization of liquid at the vapour–liquid interface, and superheating of the newly formed vapour above  $T_{sat}$. Heat energy due to conduction and radiation from the sphere reaches the vapour liquid interface. Since the bulk water is below the saturation temperature of the water, a part of this heat energy available at the interface is utilized in vaporizing and superheating the liquid, whereas the remaining part is diffused into the bulk liquid. From the energy balance on a differential element as shown in figure 2 we can write
 \begin{equation} {\rm d}q_c + {\rm d}q_r ={\rm d}q_{vap} + {\rm d}q_b, \end{equation}
where:
(i)
${\rm d}q_c$ is heat transfer due to conduction across vapour film, $q^{\prime \prime }_c= {k_v(T_b-T_{sat})}/{\delta }$ (we get this by substituting (2.24) in the Fourier's law of heat conduction);(ii)
${\rm d}q_r$ is heat transfer due to radiation , $q^{\prime \prime }_r= \sigma \epsilon (T^4_b - T^4_{sat})$;(iii)
${\rm d}q_{vap}$ is heat utilized in vaporizing the liquid;(iv)
${\rm d}q_b$ is sensible heat energy going in water, $q^{\prime \prime }_b= ({k_l\Delta T_w \sin ^2 \theta })/{\sqrt {{\rm \pi} \mathrm {M}\eta }}$.


Energy balance over elemental area of sphere.
The energy flux utilized in the vaporization of liquid can be written as
 \begin{equation} {\rm d}q_{vap}=h'_{fg}\,{\rm d}w = h'_{fg}\,{\rm d}(\rho_v A_c\bar{u}), \end{equation}
where  ${\rm d}w$ is the increase of mass flow rate in the vapour layer due to vaporization, $h_{fg}$ is the latent of vaporization,
 \begin{equation} h'_{fg}= h_{fg}\left(1 + \frac{0.4 C_{p_l} ( T_b - T_{sat})}{h_{fg}} \right) \end{equation}
is the modified latent heat of vaporization (Bromley et al. Reference Bromley, LeRoy and Robbers1953; Witte Reference Witte1967; Witte & Orozco Reference Witte and Orozco1984) that accounts for the temperature variation in the vapour field and super heating of vapour above  $T_{sat}$, $A_c= 2{\rm \pi} R\delta \sin \theta$ is the flow cross-section of the film, and $\bar {u}$ is the average vapour velocity at any $\theta$.
The average velocity in the vapour film is calculated as follows:
 \begin{align} \bar{u}=\frac{1}{\delta}\int_{0}^{\delta}u\,{{\rm d} y} = \frac{1}{\delta} \int_{0}^{\delta} \left( \frac{3}{2} U \sin\theta \frac{y}{\delta} + \left(\frac{9}{8}\frac{\rho_l U^2}{\mu_v R} \sin\theta \cos\theta + \frac{\Delta \rho g \sin \theta}{2\mu_v} \right)\left( y\delta \!-\! y^2 \right)\right) \,{{\rm d}y} \end{align} $\implies$
 \begin{equation} \bar{u} = \frac{3}{4}U\sin\theta + \frac{3 \rho_l\ U^2}{16 \mu_v R}\sin\theta\cos\theta \delta^2 + \frac{\Delta \rho g\sin\theta}{12\mu_v}\delta^2. \end{equation}
 \begin{align} {\rm d}q_{vap}=h'_{fg}\,{\rm d}\left(\rho_v 2{\rm \pi} R\delta\sin\theta \left( \frac{3}{4}U\sin\theta + \frac{3 \rho_l\ U^2}{16 \mu_v R}\sin\theta\cos\theta \delta^2 + \frac{\Delta \rho_l g\sin\theta}{12\mu_v}\delta^2 \right) \right) \end{align} $\implies$
 \begin{align} {\rm d}q_{vap}=h'_{fg} \frac{{\rm d}}{{\rm d}\theta} \left(\rho_v 2{\rm \pi} R\delta\sin\theta \left( \frac{3}{4}U \sin\theta + \frac{3 \rho_l\ U^2}{16 \mu_v R}\sin\theta\cos\theta \delta^2 + \frac{\Delta \rho_l g\sin\theta}{12\mu_v}\delta^2 \right) \right)\,{\rm d}\theta. \end{align}
From (2.25) we can write
 \begin{equation} \frac{k_v \left(T_b - T_{sat}\right)}{\delta}\,{\rm d}A + q''_r \,{\rm d}A = {\rm d}q_{vap} +q''_b \,{\rm d}A, \end{equation}
where,  ${\rm d}A = 2{\rm \pi} R^2 \sin \theta \,{\rm d}\theta$ is the differential area element on the sphere, and $k_v$ is the thermal conductivity of the vapour. Substituting, ${\rm d}A$ , $q^{\prime \prime }_r$ and $q^{\prime \prime }_b$ in above equation, we get
 \begin{equation} \frac{{\rm d}q_{vap}}{2{\rm \pi} R^2 \sin\theta \,{\rm d}\theta}= \frac{k_v \left(T_b - T_{sat}\right)}{\delta} + \sigma\epsilon(T^4_b - T^4_{sat}) - \frac{k_l\Delta T_w \sin ^2 \theta }{\sqrt{{\rm \pi} \mathrm{M}\eta}}. \end{equation}
Substituting (2.31) in (2.33), and separating  ${{\rm d}\delta }/{{\rm d}\theta }$ we obtain
 \begin{align} \dfrac{{\rm d}\delta}{{\rm d}\theta}= \dfrac{\begin{array}{l} \left(\dfrac{k_v \left(T_b - T_{sat}\right)}{\delta}+ \sigma\epsilon(T^4_b - T^4_{sat})-\dfrac{k_l\Delta T_w \sin ^2 \theta }{\sqrt{{\rm \pi} M\eta}} \right.\\ \left.\quad -\dfrac{h'_{fg}\rho_v}{R}\left(\dfrac{3U \cos\theta \delta}{2} + \dfrac{3 \rho_l U^2}{16\mu_v R}(3\cos^2\theta -1)\delta^3 + \dfrac{\Delta \rho g \cos\theta}{6\mu_v}\delta^3 \right)\right)\end{array}}{ \dfrac{h'_{fg}\rho_v}{R} \left( \dfrac{3 U \sin\theta}{4} + \dfrac{9\rho_l U^2}{16\mu_v R}\sin\theta \cos\theta\delta^2 + \dfrac{\Delta \rho g \sin\theta}{4 \mu_v}\delta^2 \right)}.\end{align}
The non-dimensional form of (2.34) is as follows (the steps to non-dimensionalize equation (2.34) is given in the Appendix):
 \begin{align} \dfrac{{\rm d}\left(\dfrac{\delta}{D}\right)}{{\rm d}\theta} &= \dfrac{1}{1+ \dfrac{3\rho_l}{2\rho_v}Re_v \left(\dfrac{\delta}{D}\right)^2 \cos\theta + \dfrac{1}{3}\left(\dfrac{\delta}{D}\right)^2 \dfrac{G_r}{Re_v}} \left(\dfrac{2 J_v}{3 Pe_v\sin\theta\left(\dfrac{\delta}{D}\right)}+\dfrac{2 q_r}{3 \rho_v U h'_{fg} \sin\theta} \right.\nonumber\\ &\quad - \left. 2\left(\dfrac{\delta}{D}\right)\cot\theta-\dfrac{1}{2} \dfrac{\rho_l}{\rho_v}Re_v \left(\dfrac{\delta}{D}\right)^3\left(\dfrac{3\cos^2\theta -1}{\sin\theta}\right)- \dfrac{2}{9}\dfrac{Gr}{Re_v}\left(\dfrac{\delta}{D}\right)^3 \cot\theta \right. \nonumber\\ &\quad \left.- \dfrac{2 \dfrac{\rho_l}{\rho_v} J_l \sin\theta}{3\left( \dfrac{{\rm \pi} Pe_l}{3}\left(\dfrac{2}{3}-\cos\theta + \dfrac{\cos^3\theta}{3} \right) \right)^{{1}/{2}}} \right).\end{align}
Here,  $Re_v={\rho _v U D}/{\mu _v}$ is the vapour Reynolds number, $Gr=g ({\rho _l}/{\rho _v}-1) ({D^3}/{\nu _v ^2})$ is the Grashof number (representing the ratio of buoyancy force to the viscous force acting on a fluid), $J_v=({C_{p_v} (T_b-T_{sat})})/{h'_{fg}}$ and $J_l=({C_{p_l}(T_{sat}-T_w)})/{h'_{fg}}$ are the vapour and liquid Jakob numbers, respectively (representing the sensible heat absorbed or released during the liquid vapour phase change in comparison with the latent heat), $Pe_v={D U}/{\alpha _v}$ and $Pe_l={D U}/{\alpha _l}$ are the vapour and liquid Péclet numbers, respectively (representing the ratio of convection by thermal diffusion). We will solve (2.35) by a Runge–Kutta fourth-order method, for the initial conditions obtained by imposing ${{\rm d}\delta }/{{\rm d}\theta }|_{\theta =0}=0$. The condition is justified owing to the fact that the vapour layer thickness is initially very small, and grows along the sphere surface due to the addition of vapour because of boiling. Therefore, at $\theta =0$ this increase in vapour layer is negligible.
2.4.1. Initial condition
We will now use  ${{\rm d}\delta }/{{\rm d}\theta }|_{\theta =0}=0$ or $({{\rm d}({\delta }/{D})})/{{\rm d}\theta }|_{\theta =0}=0$ in (2.35) to get the initial conditions,
 $$\begin{gather} \frac{2 J_v}{3 Pe_v}+\frac{2 q_r \frac{\delta}{D}}{3 \rho_v U h'_{fg}} - 2 \left(\frac{\delta}{D}\right) ^2-\frac{\rho_l}{\rho_v}Re_v\left(\frac{\delta}{D}\right)^4 -\frac{2}{9}\frac{Gr}{Re_v}\left(\frac{\delta}{D}\right)^4 \nonumber\\ -\left. \frac{2 \dfrac{\rho_l}{\rho_v} J_l \sin ^2\theta \dfrac{\delta}{D}}{3\left( \dfrac{{\rm \pi} Pe_l}{3}\left(\dfrac{2}{3}-\cos\theta + \dfrac{\cos^3\theta}{3} \right) \right)^{{1}/{2}}}\right|_{\theta=0} =0. \end{gather}$$
The last term in (2.36) is solved separately as follows (the steps to solve the last term in (2.36) is given in the Appendix):
 \begin{equation} \lim_{\theta\to 0} \left. \dfrac{2 \dfrac{\rho_l}{\rho_v} J_l \sin ^2\theta \dfrac{\delta}{D}}{3\left( \dfrac{{\rm \pi} Pe_l}{3}\left(\dfrac{2}{3}-\cos\theta + \dfrac{\cos^3\theta}{3} \right) \right)^{{1}/{2}}}\right|_{\theta=0}= \dfrac{4}{\sqrt {3 {\rm \pi}Pe_l}} \dfrac{\rho_l}{\rho_v}J_l \dfrac{\delta}{D}, \end{equation}
substituting (2.37) in (2.36) we get
 \begin{align} &\frac{2 J_v}{3 Pe_v}+\frac{2 q_r}{3 \rho_v U h'_{fg}}\left(\frac{\delta}{D}\right) - 2 \left(\frac{\delta}{D}\right) ^2-\frac{\rho_l}{\rho_v}Re_v\left(\frac{\delta}{D}\right)^4 -\frac{2}{9}\frac{Gr}{Re_v}\left(\frac{\delta}{D}\right)^4 \nonumber\\ &\qquad - \frac{4}{\sqrt {3 {\rm \pi}Pe_l}} \frac{\rho_l}{\rho_v}J_l \left(\frac{\delta}{D}\right)=0 \end{align} $\implies$
 \begin{align} \left(\frac{\rho_l}{\rho_v}Re_v \!+\!\frac{2}{9}\frac{Gr}{Re_v}\right) \left(\frac{\delta}{D}\right)^4 + 2 \left(\frac{\delta}{D}\right) ^2+ \left( \frac{4}{\sqrt {3 {\rm \pi}Pe_l}} \frac{\rho_l}{\rho_v}J_l - \frac{2 q_r}{3 \rho_v U h'_{fg}}\right)\left(\frac{\delta}{D}\right) - \frac{2 J_v}{3 Pe_v}=0. \end{align}
Equation (2.39) is solved and the real, non-negative values of  ${\delta }/{D}$ are the initial conditions to solve (2.35). Equation (2.39) consists of various non-dimensional terms which are required to be evaluated from the properties of vapour and liquid evaluated at corresponding mean film temperature. The mean film temperature for vapour is $({T_b+T_{sat}})/{2}$ and for liquid is $({T_{sat}+T_w})/{2}$. Note that (2.35) has a singularity at ${\theta =0^\circ} \ \mathrm {and} \ 180^\circ$. Therefore, the initial condition required to solve (2.35) by a Runge–Kutta method is given at some $\theta$ near to $0^\circ$, and not exactly at $\theta = 0^\circ$.
After calculating the variation of  $\delta (\theta )$ we can compute the heat transfer coefficient, and the Nusselt number. We consider the fact that the energy leaving the sphere surface has two components, namely conduction across the vapour film and radiation (see figure 2). Therefore, an energy balance enables us to write
 \begin{gather} h_\theta(T_b - T_{sat})= \frac{k_v (T_b - T_{sat})}{\delta} + q_r, \end{gather}
 \begin{gather} h_\theta = \frac{k_v}{\delta} + \frac{q_r}{T_b - T_{sat}}, \end{gather}
where  $h_\theta$ represents the local heat transfer coefficient. The local Nusselt number, $Nu_{\theta }$ is defined as ${h_{\theta } D}/{k_{v}}$, and therefore can be written as
 \begin{equation} Nu_\theta = \frac{D}{\delta} + \frac{D q_r}{k_v (T_b - T_{sat})}. \end{equation}
 From the local Nusselt number, we can calculate the average Nusselt number using the total sphere area  $4{\rm \pi} R^2$ as follows:
 \begin{equation} Nu = \frac{1}{2} \int_{0}^{\theta_s} Nu_\theta\sin\theta \,{\rm d}\theta, \end{equation}
here  $\theta _s$ is the angle at which separation takes place. The use of $\theta _s$ in (2.43) indicates the validation of our analytical solutions until the point of separation, and the average heat flux over the sphere in the region downstream of the separation point is not accounted for during the calculation of $Nu$. We further use (2.43) to calculate the averaged heat transfer coefficient,
 \begin{equation} h= \frac{Nu D}{k_v}. \end{equation}
2.4.2. Flow separation
We can use (2.21), and apply  ${\partial {u}}/{\partial {y}}|_{y=0} = 0$ to determine the angle of separation. This boundary condition is used because the point at which the flow separates will have a velocity profile such that the gradient of velocity with respect to the normal to the surface becomes zero. Now
 \begin{equation} \cos\theta_s ={-} \left( \dfrac{\dfrac{3U}{2\delta^2_s} + \dfrac{\Delta \rho g}{2\mu_v}}{\dfrac{9 \rho_l U^2}{8\mu_v R}}\right) ={-} \left(\frac{4\mu_v R}{3 \rho_l U \delta_s ^2} + \frac{4 R g \Delta \rho}{9 U^2 \rho_l} \right), \end{equation}
where  $\delta _s$ is the thickness of the vapour layer at the point of separation. The vapour layer grows as we move in the direction of $\theta$. As we reach a point where $\theta =\theta _s$, $\delta$ is equal to $\delta _s$.
Equation (2.45) does not predict the separation angle directly, rather it needs to be solved simultaneously with (2.35). We can also observe from (2.45) that  $\theta _s > {{\rm \pi} }/{2}$. The second term in (2.45) represents the effect of buoyancy and scales with ${1}/{U^2}$. This signifies that at low velocities this term will grow rapidly and will suppress the separation resulting in an increase in the separation angle (see § 3).
3. Results
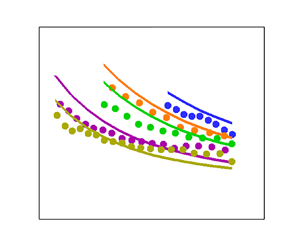
The comparison of the variation of heat transfer coefficient with sphere temperature between the present model and the experiments of Jouhara & Axcell (Reference Jouhara and Axcell2009), is shown in figure 3(a). We also show the corresponding comparison between the model of Witte & Orozco (Reference Witte and Orozco1984) and the experimental study of Jouhara & Axcell (Reference Jouhara and Axcell2009) in figure 3(b). Our model achieves a very good agreement with the results from the experiments. The model of Witte & Orozco (Reference Witte and Orozco1984) manifests a significant departure from the experimental results. The reason being the inclusion of buoyancy in our model that successfully captures the delayed separation. We further discuss the key role of buoyancy in delaying the separation at low velocities in the upcoming text.
Comparison of the heat transfer coefficient with sphere temperature between (a) present study, and the experiments of Jouhara & Axcell (Reference Jouhara and Axcell2009), (b) Witte & Orozco (Reference Witte and Orozco1984) and Jouhara & Axcell (Reference Jouhara and Axcell2009).

The vapour boundary layer thickness  $\delta$ increases with an increase in temperature of water ( $T_w$), and an increase in sphere temperature ( $T_b$) as can be observed from figures 4(a) and 4(b), respectively. With an increase in the temperature of water $T_w$, the contribution of vapour film to the net energy exchange between the sphere and the surrounding liquid decreases. Therefore, the energy going into the bulk liquid decreases, and the amount of total energy available for vaporization of liquid increases resulting in an increase in the vapour boundary layer thickness. Similarly, with an increase in sphere temperature $T_b$, the energy available for vaporization of the liquid increases resulting in an increase in vapour boundary layer thickness. At low velocities, the adverse pressure gradient weakens, and buoyancy (acting upwards) pushes the fluid against this weak adverse pressure gradient to delay the separation. Our model captures this separation delay for different $T_w$ and $T_b$, as manifested in figure 4(a,b). The model of Witte & Orozco (Reference Witte and Orozco1984), owing to the exclusion of buoyancy, predicts significantly earlier separation at low velocities as indicated by the rapid rise in the vapour boundary layer thickness in figure 4(a,b). Equation (2.35) has a singularity at $\theta =180^\circ$, and therefore to avoid any perturbations in the results due to a sudden increase in the value of $\delta$ at $\theta =180^\circ$, we have not plotted the results until $180^\circ$.
Variation of vapour boundary layer thickness over sphere at free stream velocity  $U = 0.01\, {\rm m}\,{\rm s}^{-1}$ with (a) bulk water temperature $T_w$ at $T_b = 400\,^{\circ } {\rm C}$ and (b) sphere temperature $T_b$ at $T_w = 70\,^{\circ }{\rm C}$.

We report a decrease in the vapour boundary layer thickness with an increase in free stream velocity  $U$ for a given value of the sphere and the water temperature in figure 5. It can be observed from figure 5(a) that the separation is delayed (shown by the sudden increase in $\delta$) with decreasing velocity. When the velocity becomes sufficiently low there is no separation, which is similar to the observations of Bromley et al. (Reference Bromley, LeRoy and Robbers1953). In comparison with our model, the model of Witte & Orozco (Reference Witte and Orozco1984) does not show any variation of separation angle with velocity (see figure 5b). To understand the reason for the separation even at low velocities we analyse the expression of the angle of separation $(\cos \theta _s = - ({4\mu _v R}/({3 \rho _l U \delta _s ^2}) ))$ from the model of Witte & Orozco (Reference Witte and Orozco1984). At a given $T_w$ and $T_b$ the product of $U$ and $\delta _s^2$ remains constant as shown in table 1. Therefore, the denominator in the expression of $\cos \theta _s$ will remain a constant and consequently the separation angle will remain the same with velocity.
Variation of vapour boundary layer thickness over the sphere at different velocities for given sphere and bulk water temperature obtained from (a) present study and (b) the model of Witte & Orozco (Reference Witte and Orozco1984).

Model of Witte & Orozco (Reference Witte and Orozco1984) at  $T_w = 70^\circ {\rm C}$, $T_b = 350^\circ {\rm C}$, $D = 20\,{\rm mm}$.

Our expression for  $\theta _s$ is composed of two terms, $({4\mu _v R})/({3 \rho _l U \delta _s ^2})$ and $({4 R g \Delta \rho })/({9 U^2 \rho _l})$. The second term represents the influence of buoyancy and scales with ${1}/{U^2}$. Therefore, decreasing the velocity, $U$, increases the second term. Table 2 demonstrates the variation of the first and second terms with velocity for a given $T_b$ and $T_w$. We can observe that as we decrease the velocity, the value of $\delta _s$ increases, the first term decreases, and the second increases. It can also be observed that the second term is negligible at high values of $U$, and does not contribute much in delaying the separation at high velocity. However, at low velocities, the contribution of buoyancy (second term) becomes significant resulting in separation delay.
Present model at  $T_w = 70\,^\circ {\rm C}$, $T_b = 350^\circ {\rm C}$, $D=20\,{\rm mm}$.

We create a three-dimensional surface plot (see figure 6a) of the velocity, at which the first and the second terms in the expression for separation angle become equal at different sphere and water temperatures. We present a data set comprising of the values of the first and the second terms in the expression for separation angle in table 3. Comparative three-dimensional surface plots (figure 6b) of the variation of the separation angle with respect to the sphere and the water temperature are also generated by using the corresponding parameters of figure 6(a) for the present model, and the model of Witte & Orozco (Reference Witte and Orozco1984). From figure 6(b) it is observed that for low values of velocities the surface generated from the present model is farther away from the surface generated by the model of Witte & Orozco (Reference Witte and Orozco1984) and as the velocity is increased the two surfaces in figure 6(b) come closer to each other. Therefore, at higher velocities even when the first and the second terms in the expression of separation angle are equal, the buoyancy effects may not be significant as the difference in the separation angle obtained from the present model and the model of Witte & Orozco (Reference Witte and Orozco1984) decreases. Hence, we can conclude that at a particular sphere and bulk water temperature, the influence of buoyancy is significant at lower velocities where the difference in the separation angle for present model and model of Witte & Orozco (Reference Witte and Orozco1984) is significant. Clearly, the model of Witte & Orozco (Reference Witte and Orozco1984) underpredicts the separation angle at all velocities owing to the exclusion of buoyancy in their analysis.
(a) Surface plot of velocity, at which the first and the second terms in the expression for separation angle become equal, at different sphere and bulk water temperature obtained from the present study. (b) Comparison of the surface plot of separation angle for the corresponding parameters of panel (a) obtained from present study and model of Witte & Orozco (Reference Witte and Orozco1984). An example point is shown in panel (a) and the corresponding point is marked in panel (b).

A representative dataset for figure 6(a).

According to (2.20) the pressure gradient is favourable in the bottom half of the sphere ( $\theta <90^\circ$) whereas it is adverse in the top half ( $\theta >90^\circ$) of the sphere. Buoyancy favours the flow of the vapour in both the lower and the upper halves. When the velocity is high the adverse pressure gradient in the top half is also large, and even though buoyancy supports the vapour flow, the flow may separate. As the velocity decreases, the adverse pressure gradient in the top half of the sphere decreases, and buoyancy dominates the vapour flow resulting in delayed or no separation. Figure 7(a,b) represent the non-dimensional velocity profiles at different angles for high and low velocities, respectively. At high velocity (figure 7a) it can be observed that separation takes place in the top half of the sphere but at low velocity (figure 7b) we do not observe any separation. To further access the role of buoyancy in suppressing the separation we plot the three components in (2.21) in figure 8 for two different velocities at two different angles. We can observe that for $U = 1\, {\rm m}\,{\rm s}^{-1}$ and $0.2\, {\rm m}\,{\rm s}^{-1}$ at $\theta = 60^\circ$, which represents a location at the bottom half of the sphere, both the pressure and the buoyancy are assisting the flow of vapour (see figure 8a,c). However, at $\theta = 105^\circ$, which represents a location at the upper half of the sphere, the pressure gradient is adverse and it competes with buoyancy to get the flow separated for $U = 1\, {\rm m}\,{\rm s}^{-1}$ and delay the separation for $U = 0.2\, {\rm m}\,{\rm s}^{-1}$ (figures 8b and 8d, respectively).
Non-dimensional velocity profile (refer to (2.4) for the expression of  $u_\theta$) at (a) $U = 1\, {\rm m}\,{\rm s}^{-1}$, $T_w = 70\,^\circ$C, $T_b = 400\,^\circ$C and (b) $U = 0.2\, {\rm m}\,{\rm s}^{-1}$, $T_w = 70\,^\circ$C, $T_b = 400\,^\circ$C.

Dimensional velocity profile (refer to (2.21)) at different values of  $\theta$ for $U=1\, {\rm m}\,{\rm s}^{-1}$ and $U=0.2\, {\rm m}\,{\rm s}^{-1}$.

4. Conclusion
A theoretical investigation is performed to understand the influence of buoyancy on the heat transfer characteristics and boundary layer separation behaviour due to film boiling from a slowly moving heated sphere. The novelty of this study lies in the inclusion of the buoyancy in the governing equation – unprecedented in the previous theoretical investigations for a spherical body. In the present analytical model the momentum and the energy equations are solved in the vapour phase to obtain the velocity and the temperature distribution in terms of the vapour layer thickness. We apply an energy balance at the vapour–liquid interface to determine the vapour layer thickness. The flow of liquid around the sphere is considered to be governed by potential theory, and the energy equation in liquid is then solved for the known velocity distribution.
We find that the film boiling heat transfer coefficient decreases with an increase in sphere and bulk water temperature owing to a subsequent increase in the vapour layer thickness. This behaviour of the heat transfer coefficient resembles closely the experimental results reported by Jouhara & Axcell (Reference Jouhara and Axcell2009). We also found that buoyancy plays a very significant role at low velocities in delaying the separation and allows the heat transfer calculation from a larger area. We have included buoyancy in the expression of the vapour velocity that resulted in capturing the delayed separation phenomenon similar to the observations of Bromley et al. (Reference Bromley, LeRoy and Robbers1953) and Kobayasi (Reference Kobayasi1965). We further analysed the dependence of the flow separation behaviour on the relative magnitudes of the pressure gradient and buoyancy. At high velocity the pressure gradient overshadows the buoyancy effects, and the flow separates. However, at sufficiently low velocities, buoyancy drives the flow against the adverse pressure gradient, and separation is not observed. Therefore, it can be concluded that the inclusion of buoyancy is imperative for capturing the correct variation of the heat transfer characteristics, and the boundary layer separation phenomenon at low velocities.
Acknowledgements
We would also like to thank the anonymous referees whose helpful suggestions improved the quality of this paper.
Funding
We gratefully acknowledge the support of the Science and Engineering Research Board, Government of India grant no. SERB/ME/2020318. We also want to thank the Office of Research and Development, Indian Institute of Technology Kanpur for the financial support through grant no. IITK/ME/2019194.
Declaration of interests
The authors report no conflict of interest.
Appendix A
Steps to derive (2.2a,b).
From potential flow solution around the sphere we finally arrive at the following velocity distribution:
 \begin{gather} u_r={-}U\left(1-\left(\frac{R}{r}\right)^3\right)\cos\theta, \end{gather}
 \begin{gather} u_\theta =U\left(1+\frac{1}{2}\left(\frac{R}{r}\right)^3\right)\sin\theta. \end{gather}
Our region of concern lies very near to the sphere. Since the vapour layer thickness is very small in comparison with the radius of sphere, we can say that  ${r}/{R}\sim 1$, and (A1) can be transformed as follows:
 \begin{equation} \left. \begin{aligned} u_r & ={-}U\cos\theta \left( \frac{r^3 - R^3}{r^3} \right),\\ \implies\quad u_r & ={-}U\cos\theta(r-R)\left(\frac{r^2 + R^2 + rR}{r^3}\right),\\ \implies \quad u_r & ={-}U\cos\theta\left(\frac{r-R}{R}\right)\left( \frac{r^2R + R^3 + rR^2}{r^3}\right),\\ \implies \quad u_r & ={-}U\cos\theta\left(\frac{r-R}{R}\right)\left(\frac{R}{r}+ \frac{R^2}{r^2} + \frac{R^3}{r^3} \right). \end{aligned} \right\} \end{equation}
In the limit  $\frac {r}{R} \sim 1$ we can write
 \begin{equation} u_r ={-}3U\frac{r-R}{R}\cos\theta. \end{equation}
Similarly  $u_\theta$ can be written as
 \begin{equation} u_\theta = \frac{3}{2}U\sin\theta. \end{equation}
Steps to non-dimensionalize equation (2.34).
Consider (2.34),
 \begin{align} \dfrac{{\rm d}\delta}{{\rm d}\theta}&= \dfrac{1}{\dfrac{h'_{fg}\rho_v}{R} \left( \dfrac{3 U \sin\theta}{4} + \dfrac{9\rho_l U^2}{16\mu_v R}\sin\theta \cos\theta\delta^2 + \dfrac{\Delta \rho g \sin\theta}{4 \mu_v}\delta^2 \right)}\left( \dfrac{k_v \left(T_b - T_{sat}\right)}{\delta}\right.\nonumber\\ &\quad + \sigma\epsilon(T^4_b - T^4_{sat})\,-\dfrac{k_l\Delta T_w \sin ^2 \theta }{\sqrt{{\rm \pi} M\eta}}\, -\dfrac{h'_{fg}\rho_v}{R}\left(\dfrac{3U \cos\theta \delta}{2} \right. \nonumber\\ &\quad\left. + \left. \dfrac{3 \rho_l U^2}{16\mu_v R}(3\cos^2\theta -1)\delta^3 + \dfrac{\Delta \rho g \cos\theta}{6\mu_v}\delta^3 \right) \right) . \end{align}
To non-dimensionalize the above equation we first divide the numerator and denominator by  $({h'_{fg}\rho _v}/{R})({3 U \sin \theta }/{4})$. We first consider the non-dimensionalization of denominator as follows:
 \begin{equation} \dfrac{h'_{fg}\rho_v}{R} \left( \dfrac{3 U \sin\theta}{4} + \dfrac{9\rho_l U^2}{16\mu_v R}\sin\theta\cos\theta\, \delta^2 + \dfrac{\Delta \rho g \sin\theta}{4 \mu_v}\delta^2 \right), \end{equation} $\implies$
 \begin{equation} \frac{h'_{fg}\rho_v}{R}\frac{3 U \sin\theta}{4} \left( 1 + \frac{3 \rho_l U \cos\theta\delta^2}{4\mu_v R} + \frac{ \Delta \rho g \delta^2}{3 \mu_v U} \right) , \end{equation} $\implies$
 \begin{equation} \frac{h'_{fg}\rho_v}{R}\frac{3 U \sin\theta}{4} \left( 1 + \frac{3}{2}\frac{\rho_l}{\rho_v}\frac{\rho_v U D}{\mu_v}\left(\frac{\delta}{D}\right)^2\cos\theta + \frac{\Delta \rho g}{3U}\frac{\delta^2}{\mu_v} \right), \end{equation} $\implies$
 \begin{equation} \frac{h'_{fg}\rho_v}{R}\frac{3 U \sin\theta}{4} \left( 1 + \frac{3}{2}\frac{\rho_l}{\rho_v} Re_v\left(\frac{\delta}{D}\right)^2\cos\theta + \frac{\Delta \rho g}{3U}\frac{\delta^2}{\mu_v} \right) , \end{equation} $\implies$
 \begin{equation} \frac{h'_{fg}\rho_v}{R}\frac{3 U \sin\theta}{4} \left( 1 + \frac{3}{2}\frac{\rho_l}{\rho_v} Re_v\left(\frac{\delta}{D}\right)^2\cos\theta + \frac{Gr}{3Re_v}\left(\frac{\delta}{D} \right)^2 \right). \end{equation}
 Now, dividing the numerator and denominator by  $({h'_{fg}\rho _v}/{R}) ({3 U \sin \theta }/{4})$, we can rewrite the denominator as
 \begin{equation} 1 + \frac{3}{2}\frac{\rho_l}{\rho_v} Re_v\left(\frac{\delta}{D}\right)^2\cos\theta + \frac{Gr}{3Re_v}\left(\frac{\delta}{D} \right)^2. \end{equation}
Now, consider the numerator of (2.34),
 $$\begin{gather} \dfrac{1}{\dfrac{h'_{fg}\rho_v}{R} \dfrac{3 U \sin\theta}{4}} \dfrac{1}{D}\left( \dfrac{k_v \left(T_b - T_{sat}\right)}{\delta}+ \sigma\epsilon(T^4_b - T^4_{sat})-\dfrac{k_l\Delta T_w \sin ^2 \theta }{\sqrt{{\rm \pi} M\eta}}\right.\nonumber\\ \left.\quad -\dfrac{h'_{fg}\rho_v}{R}\left(\dfrac{3U \cos\theta \delta}{2} + \right. \left. \dfrac{3 \rho_l U^2}{16\mu_v R}(3\cos^2\theta -1)\delta^3 + \dfrac{\Delta \rho g \cos\theta}{6\mu_v}\delta^3 \right) \right). \end{gather}$$
Term  ${1}/{D}$ in the above expression comes from the non-dimensionalization of the left-hand side of (2.34) and ${\textrm {d}\delta }/{\textrm {d}\theta }$ is written as ${\textrm {d}(\delta /D)}/{\textrm {d}\theta }D$. We now non-dimensionalize all the terms of the above equation, Consider the first term,
(i)
(A14)\begin{equation} \dfrac{1}{D}\dfrac{\dfrac{k_v \left(T_b-T_{sat}\right) }{\delta}} {\dfrac{h'_{fg}\rho_v}{R} \dfrac{3U \sin\theta}{4}}, \end{equation}$\implies$
(A15)\begin{equation} \frac{2 Cp_v (T_b - T_{sat})}{3h_{fg}} \frac{k_v}{Cp_v \rho_v U\sin\theta \delta} , \end{equation}$\implies$
(A16)\begin{equation} \frac{2J_v}{3\dfrac{\rho_v Cp_v}{k_v}U D \dfrac{\delta}{D}\sin\theta}, \end{equation}$\implies$
(A17)\begin{equation} \frac{2J_v}{3Pe_v\dfrac{\delta}{D}\sin\theta}. \end{equation}Consider the second term,
(ii)
(A18)\begin{equation} \frac{1}{D}\frac{q_r}{\dfrac{h'_{fg}\rho_v}{R} \dfrac{3 U \sin\theta}{4}}, \end{equation}$\implies$
(A19)\begin{equation} \frac{2q_r}{3\rho_v U h_{fg}\sin\theta}. \end{equation}Consider the third term,
(iii)
(A20)\begin{equation} \frac{1}{D}\frac{\dfrac{k_l\Delta T_w \sin ^2 \theta }{\sqrt{{\rm \pi} M\eta}}}{\dfrac{h'_{fg}\rho_v}{R} \dfrac{3 U \sin\theta}{4}}, \end{equation}$\implies$
(A21)\begin{equation} \frac{2Cp_l (T_{sat}-T_w)}{3 h'_{fg}}\frac{k_l}{Cp_l\rho_v}\frac{\sin\theta}{\sqrt{{\rm \pi} M \eta}}\frac{1}{U}, \end{equation}$\implies$
(A22)\begin{equation} \frac{2}{3}J_l\alpha_l\frac{\rho_l}{\rho_v}\frac{\sin\theta}{\sqrt{{\rm \pi} M \eta}}\frac{1}{U}. \end{equation}Substituting the values of
$M$ and $\eta$ we get$\implies$
(A23)\begin{equation} \dfrac{2}{3}J_l\dfrac{\rho_l}{\rho_v}\sin\theta\dfrac{1}{\sqrt{\left( \dfrac{{\rm \pi} Pe_l}{3} \left( \dfrac{2}{3}-\cos\theta+\dfrac{\cos ^3 \theta}{3} \right) \right)}}. \end{equation}Consider the fourth term,
(iv)
(A24)\begin{equation} \frac{1}{D}\dfrac{\dfrac{h'_{fg}\rho_v}{R}\dfrac{3U \cos\theta}{2}\delta}{\dfrac{h'_{fg}\rho_v}{R} \dfrac{3 U \sin\theta}{4}}, \end{equation}$\implies$
(A25)\begin{equation} 2\cot\theta\left(\frac{\delta}{D}\right). \end{equation}Consider the fifth term,
(v)
(A26)\begin{equation} \frac{1}{D}\frac{\dfrac{h'_{fg}\rho_v}{R}\dfrac{3 \rho_l U^2}{16\mu_v R}(3\cos^2\theta -1)\delta^3}{\dfrac{h'_{fg}\rho_v}{R} \dfrac{3 U \sin\theta}{4}}, \end{equation}$\implies$
(A27)\begin{equation} \frac{1}{2}\left(\frac{\delta}{D}\right)^3\frac{D}{\mu_v}\rho_l U \left(\frac{3\cos^2\theta-1}{\sin\theta} \right), \end{equation}$\implies$
(A28)\begin{equation} \frac{1}{2}\left(\frac{\delta}{D}\right)^3\frac{\rho_l}{\rho_v} \frac{\rho_v U D}{\mu_v} \left(\frac{3\cos^2\theta-1}{\sin\theta} \right), \end{equation}$\implies$
(A29)\begin{equation} \frac{1}{2}\left( \frac{\delta}{D} \right)^3 \frac{\rho_l}{\rho_v}Re_v \left(\frac{3\cos^2\theta-1}{\sin\theta}\right). \end{equation}Consider the sixth term,
(vi)
(A30)\begin{equation} \frac{1}{D} \frac{\dfrac{\Delta \rho g \cos\theta}{6\mu_v}\delta^3}{\dfrac{h'_{fg}\rho_v}{R} \dfrac{3 U \sin\theta}{4}}, \end{equation}$\implies$
(A31)\begin{equation} \frac{2}{9}\left( \frac{\delta}{D} \right)^3 D^2 \cot\theta \frac{\Delta \rho g}{U \mu_v}, \end{equation}$\implies$
(A32)\begin{equation} \frac{2}{9}\left( \frac{\delta}{D} \right)^3 \frac{Gr}{Re_v}\cot\theta. \end{equation}


Arranging all the terms, we finally get
 \begin{align} \dfrac{{\rm d}\left(\dfrac{\delta}{D}\right)}{{\rm d}\theta} &= \dfrac{1}{1+ \dfrac{3\rho_l}{2\rho_v}Re_v \left(\dfrac{\delta}{D}\right)^2 \cos\theta + \dfrac{1}{3}\left(\dfrac{\delta}{D}\right)^2 \dfrac{G_r}{Re_v}} \left(\dfrac{2 J_v}{3 Pe_v\sin\theta\left(\dfrac{\delta}{D}\right)}+\dfrac{2 q_r}{3 \rho_v U h'_{fg} \sin\theta} \right.\nonumber\\ &\quad -\left. 2\left(\dfrac{\delta}{D}\right)\cot\theta-\dfrac{1}{2} \dfrac{\rho_l}{\rho_v}Re_v \left(\dfrac{\delta}{D}\right)^3\left(\dfrac{3\cos^2\theta -1}{\sin\theta}\right)- \dfrac{2}{9}\dfrac{Gr}{Re_v}\left(\dfrac{\delta}{D}\right)^3 \cot\theta \right. \nonumber\\ &\left.\quad -\dfrac{2 \dfrac{\rho_l}{\rho_v} J_l \sin\theta}{3\left( \dfrac{{\rm \pi} Pe_l}{3}\left(\dfrac{2}{3}-\cos\theta + \dfrac{\cos^3\theta}{3} \right) \right)^{{1}/{2}}} \right). \end{align}
Steps to solve expression (2.37).
Equation (2.37) has to be solved separately as follows:
 \begin{equation} \lim_{\theta\to 0} \left. \frac{2 \dfrac{\rho_l}{\rho_v} J_l \sin ^2\theta \dfrac{\delta}{D}}{3\left( \dfrac{{\rm \pi} Pe_l}{3}\left(\dfrac{2}{3}-\cos\theta + \dfrac{\cos^3\theta}{3} \right) \right)^{{1}/{2}}}\right . \end{equation}
The above equation can be written as
 \begin{equation} \lim_{\theta\to 0} \dfrac{2 \dfrac{\rho_l}{\rho_v} J_l \sin ^2\theta \dfrac{\delta}{D}}{3\left( \dfrac{{\rm \pi} Pe_l}{9}\left(2- 3\cos\theta + \cos^3\theta \right) \right)^{{1}/{2}} }, \end{equation} $\implies$
 \begin{equation} 2 \frac{\rho_l}{\rho_v} \frac{J_l}{\sqrt{{\rm \pi} Pe_l}}\frac{\delta}{D} \lim_{\theta\to 0} \frac{ \sin ^2\theta }{\left(2- 3\cos\theta + \cos^3\theta \right)^{{1}/{2}} }. \end{equation}
Now, consider the denominator inside the limit in (A36). It can be written as
 \begin{equation} \left(1-\cos\theta \right)\left( 1-\cos\theta \right) \left( 2 + \cos \theta \right) , \end{equation} $\implies$
 \begin{equation} 4 \sin ^4 \frac{\theta}{2} \left(2 + \cos\theta\right) . \end{equation}
The numerator inside the limit in (A36) can be written as
 \begin{equation} \sin^2 \theta = 4 \sin^2\dfrac{\theta}{2}\cos^2\dfrac{\theta}{2}. \end{equation}
Therefore, (A36) can be written as
 \begin{equation} 2 \dfrac{\rho_l}{\rho_v} \dfrac{J_l}{\sqrt{{\rm \pi} Pe_l}}\dfrac{\delta}{D} \lim_{\theta\to 0} \dfrac{ 4 \sin^2\dfrac{\theta}{2}\cos^2\dfrac{\theta}{2} }{\left(4 \sin ^4 \dfrac{\theta}{2} \left(2 + \cos\theta\right)\right)^{{1}/{2}}}, \end{equation} $\implies$
 \begin{gather} 2 \dfrac{\rho_l}{\rho_v} \dfrac{J_l}{\sqrt{{\rm \pi} Pe_l}}\dfrac{\delta}{D} \lim_{\theta\to 0} \dfrac{ 4 \sin^2\dfrac{\theta}{2}\cos^2\dfrac{\theta}{2} }{2 \sin ^2 \dfrac{\theta}{2}\left(2 + \cos\theta\right)^{{1}/{2}} }, \end{gather}
 \begin{gather} 2 \dfrac{\rho_l}{\rho_v} \dfrac{J_l}{\sqrt{{\rm \pi} Pe_l}}\dfrac{\delta}{D} \lim_{\theta\to 0} \left. \dfrac{ 2 \cos^2\dfrac{\theta}{2}}{\left(2 + \cos\theta\right)^{{1}/{2}} }\right . \end{gather}
Substituting the limit we get
 \begin{equation} \dfrac{4}{\sqrt {3 {\rm \pi}Pe_l}} \dfrac{\rho_l}{\rho_v}J_l \dfrac{\delta}{D}. \end{equation}
Therefore, we can finally write,
 \begin{equation} \lim_{\theta\to 0} \left. \dfrac{2 \dfrac{\rho_l}{\rho_v} J_l \sin ^2\theta \dfrac{\delta}{D}}{3\left( \dfrac{{\rm \pi} Pe_l}{3}\left(\dfrac{2}{3}-\cos\theta + \dfrac{\cos^3\theta}{3} \right) \right)^{{1}/{2}} }\right|_\theta={-} \dfrac{4}{\sqrt {3 {\rm \pi}Pe_l}} \dfrac{\rho_l}{\rho_v}J_l \dfrac{\delta}{D}. \end{equation}


 Open access