


Introduction
Host specificity is a fundamental parasite phenotype and is hypothesized to influence infectious disease emergence (Woolhouse and Gowtage-Sequeria, Reference Woolhouse and Gowtage-Sequeria2005). Parasites range from specialists that infect 1 or a few (often closely related) host species to generalists that infect many host species across varying degrees of taxonomic levels. Theoretical and empirical investigations have largely focused on testing whether host specificity is determined by evolutionary trade-offs between generalist and specialist strategies (Visher and Boots, Reference Visher and Boots2020). One type of trade-off that would favour the evolution of specialists over generalists involves antagonistic pleiotropy, wherein an allele that increases a parasite’s fitness in 1 host, decreases its fitness in another host (Visher and Boots, Reference Visher and Boots2020). Under a scenario of antagonistic pleiotropy, one might expect a single population of a generalist to evolve into distinct genetic populations that specialize on each of the generalist’s host species. The establishment of such genetic population structure might then lead to sympatric speciation of the generalist into various specialists. In the case of vector-transmitted parasites, generalists might also establish population structure because of vector biting preference. While there is evidence that generalists beget specialists over evolutionary time (Loiseau et al., Reference Loiseau, Harrigan, Robert, Bowie, Thomassen, Smith and Sehgal2012), closely related generalists have been identified in some groups (Mouillot et al., Reference Mouillot, Krasnov, Shenbrot, Gaston and Poulin2006; Ellis and Bensch, Reference Ellis and Bensch2018) suggesting that generalists may not always evolve into specialists.
Few studies have investigated the population genetic structure of generalist parasites among their host species in the wild. In a study of a generalist nematode parasite of sympatric ungulates, Archie and Ezenwa (Reference Archie and Ezenwa2011) found no population genetic differentiation in the nematode among its host species. Conversely, the seabird tick Ixodes uriae shows host-specific genetic population structure across its distribution (McCoy et al., Reference McCoy, Chapuis, Tirard, Boulinier, Michalakis, Bohec, Maho and Gauthier-Clerc2005). Sympatric speciation and changes in host specificity, whether or not preceded by the establishment of genetic population structure, can happen rapidly. For example, the ancestor of the 2 mosquito-vectored parasites Plasmodium falciparum and P. praefalciparum appears to have acquired a gene through introgression (Otto et al., Reference Otto, Gilabert, Crellen, Böhme, Arnathau, Sanders, Oyola, Okouga, Boundenga, Willaume, Ngoubangoye, Moukodoum, Paupy, Durand, Rougeron, Ollomo, Renaud, Newbold, Berriman and Prugnolle2018) that allowed it to infect both gorillas and humans. This was followed by a relatively small number of mutations restricting P. falciparum to humans (Galaway et al., Reference Galaway, Yu, Constantinou, Prugnolle and Wright2019) and its sister species (P. praefalciparum) to gorillas; the 2 parasites appear to have diverged about 50 kya (Otto et al., Reference Otto, Gilabert, Crellen, Böhme, Arnathau, Sanders, Oyola, Okouga, Boundenga, Willaume, Ngoubangoye, Moukodoum, Paupy, Durand, Rougeron, Ollomo, Renaud, Newbold, Berriman and Prugnolle2018).
Avian haemosporidians (often called avian malaria and related parasites) are nearly globally distributed dipteran-vectored protozoan parasites (Valkiūnas, Reference Valkiūnas2005). Genetic lineages of avian haemosporidians are defined by a barcoding region of the parasite cytochrome b gene (Bensch et al., Reference Bensch, Hellgren and Pérez-Tris2009) and exhibit great variation in host specificity (Ellis and Bensch, Reference Ellis and Bensch2018). The avian haemosporidian species Haemoproteus majoris is composed of several genetic lineages including both generalists and specialists (Nilsson et al., Reference Nilsson, Taubert, Hellgren, Huang, Palinauskas, Markovets, Valkiūnas and Bensch2016). In southern Sweden, the H. majoris lineage WW2 frequently infects warblers from the genera Phylloscopus and Sylvia and, to a lesser degree, host species of other genera (Huang et al., Reference Huang, Ellis, Jönsson and Bensch2018b; Ellis et al., Reference Ellis, Huang, Westerdahl, Jönsson, Hasselquist, Neto, Nilsson, Nilsson, Hegemann, Hellgren and Bensch2020). The prevalence of WW2 is positively correlated with parasitemia among host species, and WW2 has higher prevalence and parasitemia in Phylloscopus and Sylvia warblers than in other host species (Huang et al., Reference Huang, Ellis, Jönsson and Bensch2018b). While avian haemosporidian vectors have often been shown to be generalist biters (e.g. Medeiros et al., Reference Medeiros, Hamer and Ricklefs2013), the vectors of WW2 in southern Sweden are unknown. However, at a similar latitude in Lithuania, the biting midges Culicoides pictipennis, C. segnis and C. kibunensis have been put forward as potential vectors of H. majoris (Žiegytė et al., Reference Žiegytė, Bernotienė and Palinauskas2022). All 3 species have been found in southern Sweden where WW2 has been studied (unpublished data). An initial investigation of 4 parasite nuclear genes showed no genetic population structure in WW2 among its host species and little genetic variation overall (Nilsson et al., Reference Nilsson, Taubert, Hellgren, Huang, Palinauskas, Markovets, Valkiūnas and Bensch2016). However, it remains unclear if those results hold across a broader sample of the parasite genome.
Sequencing avian haemosporidian genomes is challenging because of the high abundance of host DNA in a sample of infected host blood (Videvall, Reference Videvall2019). Several techniques have been used to overcome this obstacle including transcriptome sequencing (Videvall et al., Reference Videvall, Cornwallis, Ahrén, Palinauskas, Valkiūnas and Hellgren2017; Galen et al., Reference Galen, Borner, Williamson, Witt and Perkins2020) and genomic sequence capture (Huang et al., Reference Huang, Hansson, Palinauskas, Valkiūnas, Hellgren and Bensch2018a; Barrow et al., Reference Barrow, Allen, Huang, Bensch and Witt2019; Ellis et al., Reference Ellis, Kalbskopf, Ciloglu, Duc, Huang, Inci, Bensch, Hellgren and Palinauskas2022). While transcriptome sequencing requires preserving RNA, sequence capture can be performed on previously collected DNA, making it particularly useful for retrospective analyses.
Huang et al. (Reference Huang, Ellis, Jönsson and Bensch2018b) designed sequence capture probes based on the genome of H. tartakovskyi and used those probes to capture and sequence part of the genome of WW2. We used the WW2 sequences from Huang et al. (Reference Huang, Ellis, Jönsson and Bensch2018b) to design new sequence capture probes targeting 1.13 Mbp of WW2 genes, ca. 5% of the parasite genome (Bensch et al., Reference Bensch, Canbäck, DeBarry, Johansson, Hellgren, Kissinger, Palinauskas, Videvall and Valkiūnas2016). We then performed sequence capture on WW2 infections identified in wild birds captured in southern Sweden (Huang et al., Reference Huang, Ellis, Jönsson and Bensch2018b; Ellis et al., Reference Ellis, Huang, Westerdahl, Jönsson, Hasselquist, Neto, Nilsson, Nilsson, Hegemann, Hellgren and Bensch2020). We used the resulting genomic data to test whether WW2 showed population genetic structure among its host species and genera and to identify the genes, if any, that show the greatest evidence of host-specific structure.
Materials and methods
Sample identification
In a previous study, we quantified the parasitemia of WW2 in avian DNA samples collected at lake Krankesjön (55°41′N, 13°26′E) in southern Sweden between 2013 and 2016 (Huang et al., Reference Huang, Ellis, Jönsson and Bensch2018b). We identified 48 samples with relatively high parasitemia values and representing a diversity of host species for use in this study (host species information presented in Supplementary Table S1). Of those 48 infections, 34 passed our variant filtering (see Bioinformatic processing subsection) and were analysed further.
Sequence capture
Sequence capture uses biotinylated RNA probes to capture genetic sequences of interest. As a basis for probe design, we identified 1497 regions from nuclear exons (hereafter ‘loci’) from WW2 sequenced in a previous sequence capture study that used probes targeting H. tartakovskyi (GenBank BioProject accession number PRJNA448510; Huang et al., Reference Huang, Ellis, Jönsson and Bensch2018b). To those sequences, we added the nearly complete WW2 mitochondrial genome (5850 bp) amplified from a sample that we used for sequence capture (sample H11; Supplementary Table S1). The mitochondrial genome (GenBank accession number: PP797599) was PCR amplified and sequenced following the protocol outlined in Ciloglu et al. (Reference Ciloglu, Ellis, Duc, Downing, Inci and Bensch2020). Finally, we added sequences of the caseinolytic protease C (clpC) gene of the apicoplast genome, based on the available sequences of 2 congeneric parasites, H. magnus (GenBank accession number: EU254647.1) and H. passeris (EU254653.1). We put all sequences together into a single FASTA file and provided this to TATAA Biocenter, a company that works with Arbor Biosciences to distribute myBaits probes. Arbor Biosciences removed 32 of the nuclear loci from the file, leaving 1468 targeted loci (1465 nuclear exon regions, the mitochondrial genome, and the 2 congeneric clpC sequences). The sequence names and corresponding gene identification numbers targeted from the H. tartakovskyi genome (Bensch et al., Reference Bensch, Canbäck, DeBarry, Johansson, Hellgren, Kissinger, Palinauskas, Videvall and Valkiūnas2016) are provided in Supplementary Table S2. We also included the latest gene annotation and descriptions in Supplementary Table S2 using the H. tartakovskyi annotation in version 67 of the PlasmoDB website (https://plasmodb.org/; Alvarez-Jarreta et al., Reference Alvarez-Jarreta, Amos, Aurrecoechea, Bah, Barba, Barreto, Basenko, Belnap, Blevins, Böhme, Brestelli, Brown, Callan, Campbell, Christophides, Crouch, Davison, DeBarry, Demko, Doherty, Duan, Dundore, Dyer, Falke, Fischer, Gajria, Galdi, Giraldo-Calderón, Harb and Harper2024); several of the genes from the original study (Bensch et al., Reference Bensch, Canbäck, DeBarry, Johansson, Hellgren, Kissinger, Palinauskas, Videvall and Valkiūnas2016) did not map or are not annotated as genes in the latest PlasmoDB version. For genes of interest with high F ST values among infections in the host genera Phylloscopus and Sylvia, we provide original gene annotations and descriptions (Bensch et al., Reference Bensch, Canbäck, DeBarry, Johansson, Hellgren, Kissinger, Palinauskas, Videvall and Valkiūnas2016) if they differ from the latest annotation. We found the latest gene annotation information by mapping the originally identified genes of H. tartakovskyi (Bensch et al., Reference Bensch, Canbäck, DeBarry, Johansson, Hellgren, Kissinger, Palinauskas, Videvall and Valkiūnas2016) to the current PlasmoDB reference genome with BWA MEM v.0.7.17 (Li, Reference Li2013), converting the resulting SAM file to bam format with Samtools v.1.19.2 view (Danecek et al., Reference Danecek, Bonfield, Liddle, Marshall, Ohan, Pollard, Whitwham, Keane, McCarthy, Davies and Li2021) and then to bed format with bedtools v.2.30.0 bamtobed (Quinlan and Hall, Reference Quinlan and Hall2010) and finally extracting the gene information with bedtools intersect and further processing in R v.4.2.2 (R Core Team, 2022) with tidyverse packages (Wickham et al., Reference Wickham, Averick, Bryan, Chang, McGowan, François, Grolemund, Hayes, Henry, Hester, Kuhn, Pedersen, Miller, Bache, Müller, Ooms, Robinson, Seidel, Spinu, Takahashi, Vaughan, Wilke, Woo and Yutani2019). The FASTA file of targeted loci is provided in Supplementary File 1. Arbor Biosciences then provided us with a FASTA file of 16 850 probes, each 120 bp in length, covering our targeted sequences using 2× tiling (Supplementary File 2).
We received the synthesized probes as part of the myBaits hybridization capture for targeted NGS kit. We used this in conjunction with the Swift Biosciences Accel-NGS 2S Hyb DNA Library Kit and KAPA HiFi HotStart ReadyMix PCR Kit to perform sequence capture on our samples following the manufacturer’s instructions. Briefly, we sheared the 48 DNA samples using an M220 Focused-ultrasonicator (Covaris, MA, USA) and then built indexed Illumina libraries from all samples. We next made 6 pools, each made up of 8 libraries at equimolar concentrations, and we performed the sequence capture on each pool separately. We sequenced the captured DNA on an Illumina MiSeq (paired-end 300bp) at the Lund University DNA Sequencing Facility. All raw sequence data are available on GenBank (accession number: PRJNA1111424).
Bioinformatic processing
We assessed the quality of raw sequencing data with FastQC v.0.11.9 (https://www.bioinformatics.babraham.ac.uk/projects/fastqc/). We then removed sequencing adapters and performed quality trimming using Trim Galore v.0.6.6 (https://github.com/FelixKrueger/TrimGalore) with the following flags: −−quality 20, −−length 50. We next mapped the paired reads to the target sequences (Supplementary File 1) using BWA MEM v.0.7.17 (Li, Reference Li2013). We used SAMtools v.1.19.2 (Danecek et al., Reference Danecek, Bonfield, Liddle, Marshall, Ohan, Pollard, Whitwham, Keane, McCarthy, Davies and Li2021) to generate mapping statistics (SAMtools stats) and convert the resulting mapped read files to sorted bam format (SAMtools view and sort). Next, we marked duplicates in the bam files with Picard v.3.1.1 (https://github.com/broadinstitute/picard) MarkDuplicates and added read group information to the bam files with Picard AddOrReplaceReadGroups. We then indexed the bam files with SAMtools index and called variants with GATK v.4.3.0 (Poplin et al., Reference Poplin, Ruano-Rubio, DePristo, Fennell, Carneiro, Van Der Auwera, Kling, Gauthier, Levy-Moonshine, Roazen, Shakir, Thibault, Chandran, Whelan, Lek, Gabriel, Daly, Neale, MacArthur and Banks2017; Auwera and O’Connor, Reference Auwera and O’Connor2020) HaplotypeCaller with the flags -ploidy 1 (to designate haploid samples) and -ERC GVCF; we prepared the reference file (Supplementary File 1) for HaplotypeCaller with SAMtools faidx and Picard CreateSequenceDictionary. We combined the resulting gzipped GVCF files with GATK CombineGVCFs followed by GATK GenotypeGVCFs. We ran most of these steps with the GNU Parallel program v.20230122 (Tang, Reference Tang2023). After generating a single gzipped VCF file for all sequenced samples, we examined variant statistics in VCFtools v.0.1.16.4 (Danecek et al., Reference Danecek, Auton, Abecasis, Albers, Banks, DePristo, Handsaker, Lunter, Marth, Sherry, McVean and Durbin2011) and BCFtools v.1.17 (Danecek et al., Reference Danecek, Bonfield, Liddle, Marshall, Ohan, Pollard, Whitwham, Keane, McCarthy, Davies and Li2021) and R with packages in the tidyverse. We used BCFtools to examine variants in the barcoding region of the mitochondrial genome (mtDNAgenome_CP59298, positions 4447–4925); samples with variants in that region were assumed to be mixed lineage infections and were removed from the VCF file and not analysed (all variants in that region had a minimum quality score of 30). Hard filtering VCF files is a balance between retaining samples and variable sites and removing poor quality variant calls. We filtered the VCF file with VCFtools using the following flags: −−max-missing 0.5 −−minQ 30 −−min-meanDP 4 −−max-meanDP 250 −−minDP 4 −−maxDP 250. Finally, sites in the VCF file with missing data were converted back to haploid format (from ‘./.’ to ‘.’) using BCFtools fixploidy. The filtering left us with 34 samples and 1399 variable sites (1017 single nucleotide polymorphisms [SNPs] and 411 insertions/deletions [indels]; some variable sites include both SNPs and indels) among the samples in our final VCF.
Statistical analysis
We conducted a principal components analysis (PCA) in PLINK v.1.90 (Purcell et al., Reference Purcell, Neale, Todd-Brown, Thomas, Ferreira, Bender, Maller, Sklar, De Bakker, Daly and Sham2007). We started by removing variants in linkage disequilibrium calculated using 5 kb windows, a 10 bp step size, and an r2 cut-off value of 0.20. Next, we ran the PCA on the reduced dataset and plotted the samples in multivariate space with R and packages in the tidyverse. We calculated the Weir and Cockerham weighted F ST and F ST per variable site among host species and genera using VCFtools (−−weir-fst-pop). However, we downloaded a forked version of VCFtools (https://github.com/jydu/vcftools.git) that was modified to allow haploid variants, which we did with the flag – haploid. For several variable sites with high F ST between the 2 best sampled genera (Phylloscopus and Sylvia), we conducted a BLAST search of the sequenced target region (i.e. gene) on GenBank to make sure the pattern was not caused by host reads mapping to those sites. Avian genes were not among the top BLAST hits for any of the sites, and we therefore conclude that the results reflect true parasite genetic differences (results not shown). We were also interested in classifying variants as synonymous or non-synonymous. To do this we extracted consensus sequences using BCFtools consensus and organized the output into multiple sequence alignments (MSAs) using custom awk code. We then aligned the MSAs of loci with high F ST between the 2 best sampled genera (Phylloscopus and Sylvia) with their corresponding genes from the H. tartakovskyi assembly in version 67 of the PlasmoDB website using Geneious v.11.1.5 (http://www.geneious.com/). Next, we extracted exon regions only from the MSAs and imported them into R as FASTA files with the R package ape v.5.7.1 (Paradis and Schliep, Reference Paradis and Schliep2019). We then used the R package pegas v.1.3 (Paradis, Reference Paradis2010) to identify the haplotypes (function haplotype()) within each MSA and count the number of nucleotide (function dist.dna (model = ‘N’)) and amino acid (functions trans(code = 1) and dist.aa()) differences between the haplotypes (alignments were confirmed to be in the correct reading frame based using the corresponding reference gene). We calculated nucleotide diversity (π; −−window-pi 1000) and Tajima’s D (−−TajimaD 1000) over 1 kb windows using the forked version of VCFtools for all infections and infections of Phylloscopus and Sylvia hosts separately; we compared π and Tajima’s D between infections of the 2 host genera using paired t-tests (paired because the same genomic windows were compared) with the R function t.test() (paired, non-parametric Wilcoxon tests gave similar results and are not reported). Finally, we read our VCF file into R with the package vcfR v.1.15.0 (Knaus and Grünwald, Reference Knaus and Grünwald2017) and conducted an analysis of molecular variance (AMOVA) in the package poppr v.2.9.6 (Kamvar et al., Reference Kamvar, Tabima and Grünwald2014) with the function poppr.amova() using the hierarchical strata of host genus and host species within genus as explanatory variables, the ade4 implementation of AMOVA, and the argument missing = ‘ignore’. We tested the significance of the AMOVA results with the randtest() function with 999 randomizations (nrepet = 999) in the package ade4 v.1.7-22 (Chessel et al., Reference Chessel, Dufour and Thioulouse2004; Dray and Dufour, Reference Dray and Dufour2007; Dray et al., Reference Dray, Dufour and Chessel2007; Bougeard and Dray, Reference Bougeard and Dray2018; Thioulouse et al., Reference Thioulouse, Dray, Dufour, Siberchicot, Jombart and Pavoine2018). We visualized the phylogenetic relationships among host species by making a consensus phylogeny of 100 trees from the posterior distribution of the analysis from birdtree.org (Jetz et al., Reference Jetz, Thomas, Joy, Hartmann and Mooers2012); we did this with the functions consensus.edges() in the R package phytools v.2.0-3 (Revell, Reference Revell2012) and functions in ape.
Results
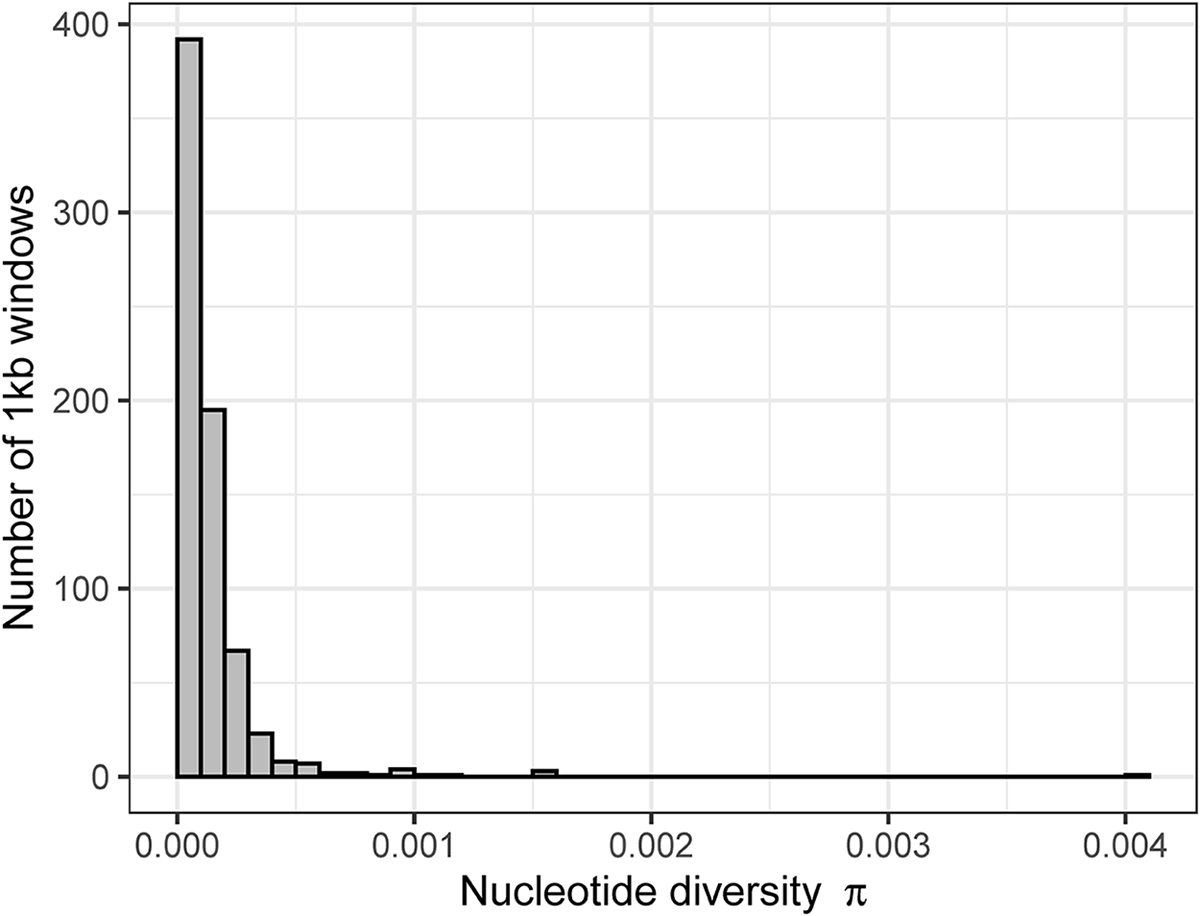
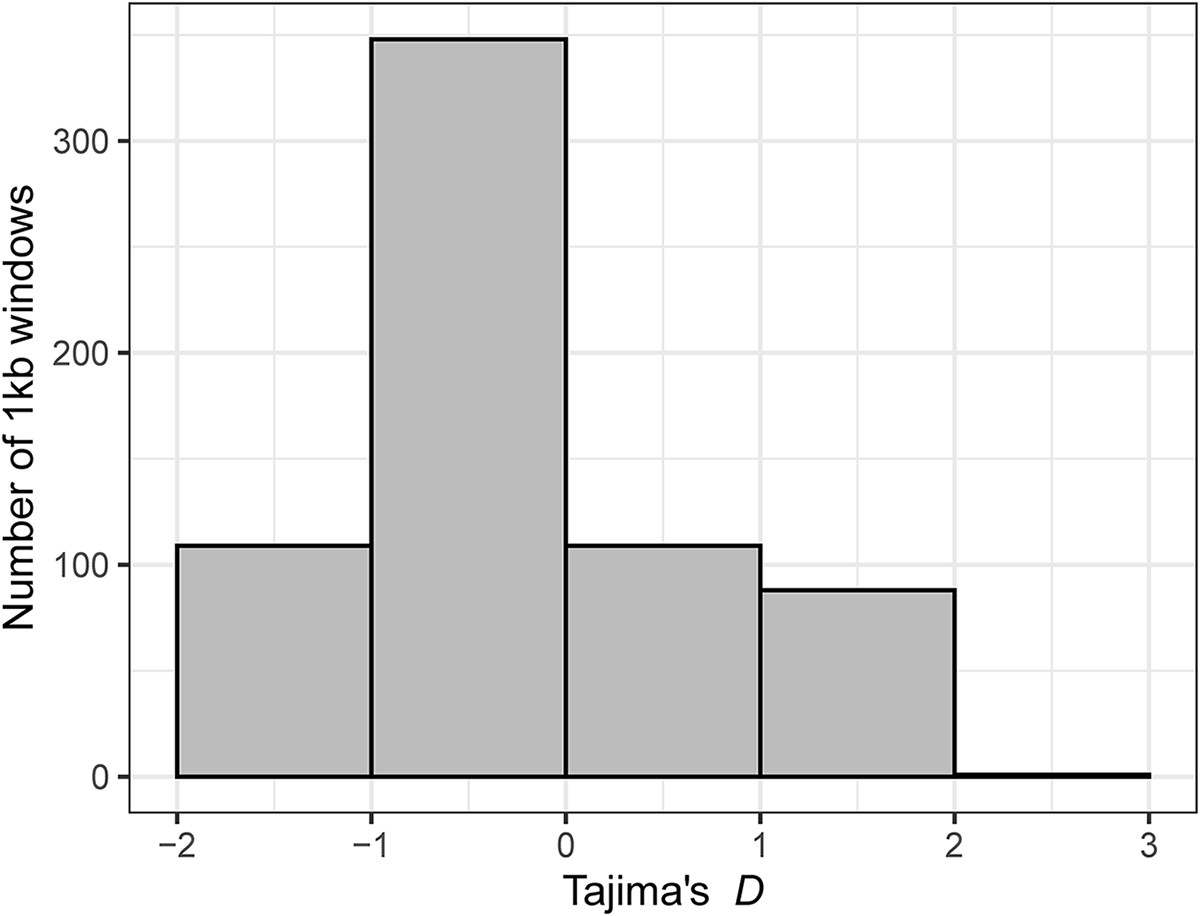
We identified 14 infections with variant calls in the barcoding region of the mitochondrial genome. Because such variation in that region is suggestive of mixed lineage infections (in the avian haemosporidian system, 1 nucleotide difference in the barcoding region of cytochrome b is considered a unique lineage; Bensch et al., Reference Bensch, Hellgren and Pérez-Tris2009), we removed those samples from the analysis. After additional quality filtering, our final VCF file included 34 samples (i.e. infections) and 1399 variable sites (Supplementary File 3) representing infections from 10 host species and 5 host genera (Table 1; Supplementary Fig. S1). Nucleotide diversity (π) ranged from 2.85 × 10⁻⁵ to 4.04 × 10⁻³ (mean = 1.38 × 10⁻⁴ ± 2.21 × 10⁻⁴ S.D.; Figure 1). Tajima’s D ranged from −1.84 to 2.16 (−0.29 ± 0.883; Figure 2). While π was higher in infections of Phylloscopus hosts than in infections of Sylvia hosts (Supplementary Fig. S2; t = 14.03, D.F. = 338, P < 0.001), Tajima’s D was lower in infections of Phylloscopus hosts than in infections of Sylvia hosts (Supplementary Fig. S3; t = −7.52, D.F. = 292, P < 0.001).
Distribution of nucleotide diversity (π) in the parasite lineage WW2 calculated over 1 kb windows.
Distribution of Tajima’s D values in the parasite lineage WW2 calculated over 1 kb windows.
Number of infections (N) of the lineage WW2, parasite H. majoris, analysed by host species after variant filtering and removing mixed parasite lineage infections

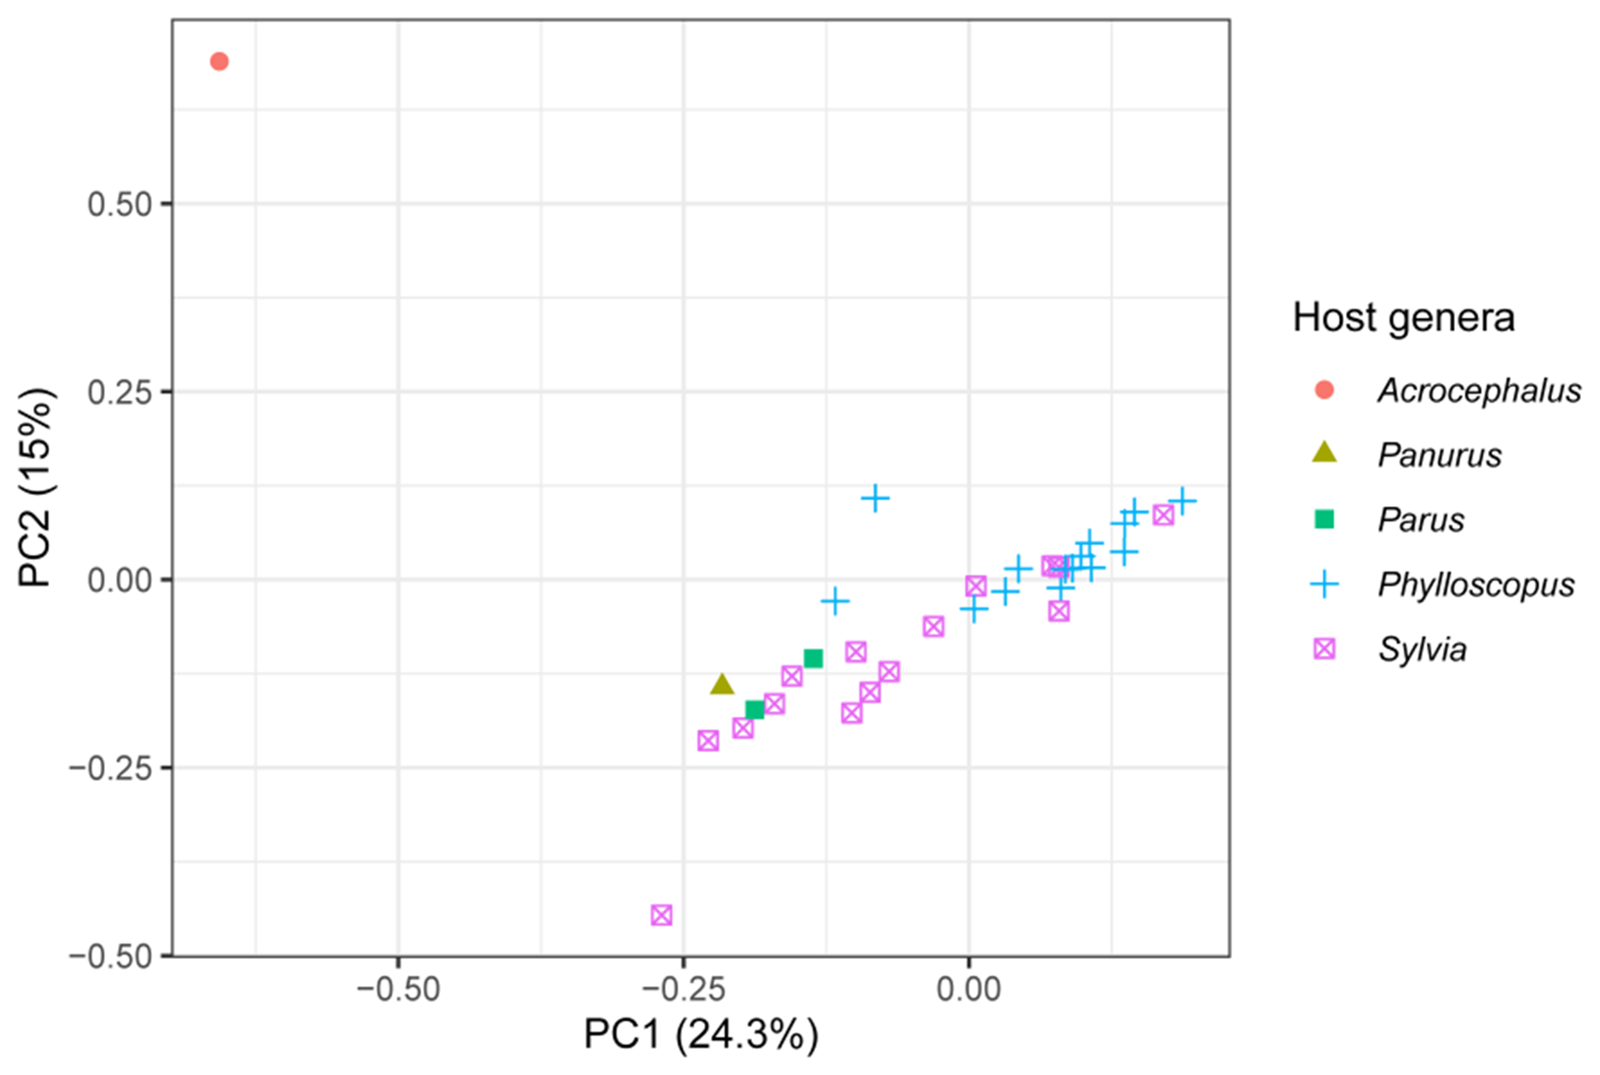
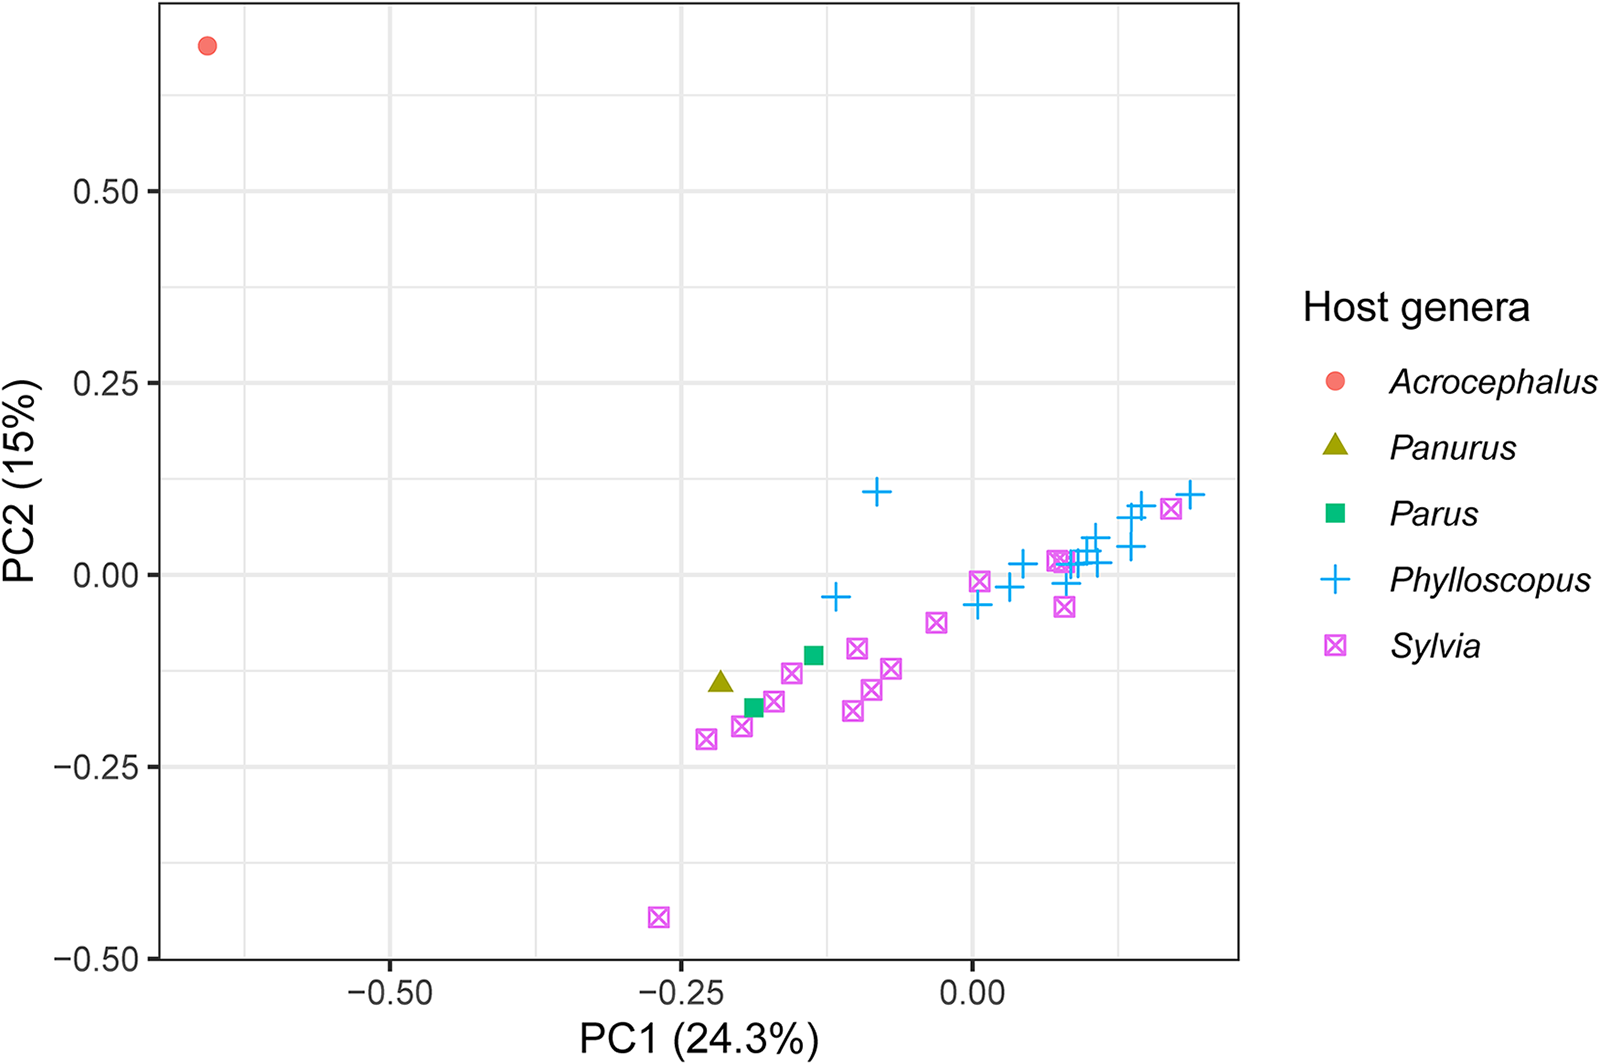
The 2 best sampled host genera were Phylloscopus and Sylvia and they mostly separated in the multivariate space of a PCA along the first 2 principal component axes, representing 24.3% and 15% of the variation in the genetic data from the PCA’s 20 axes, respectively (Figure 3). The lone infection of Acrocephalus scirpaceus also separated from the other infections (Figure 3). The loadings of the variable sites on the first 2 principal components are presented in Supplementary Table S3.
The first 2 principal components from a PCA of genetic variation among isolates of the parasite lineage WW2 with host genus highlighted. Infections from the 2 best sampled host genera, Phylloscopus and Sylvia, mostly separate along the first 2 principal components. The variation in the genetic data explained by each principal component is presented in the axis labels. The PCA used 20 axes in total.
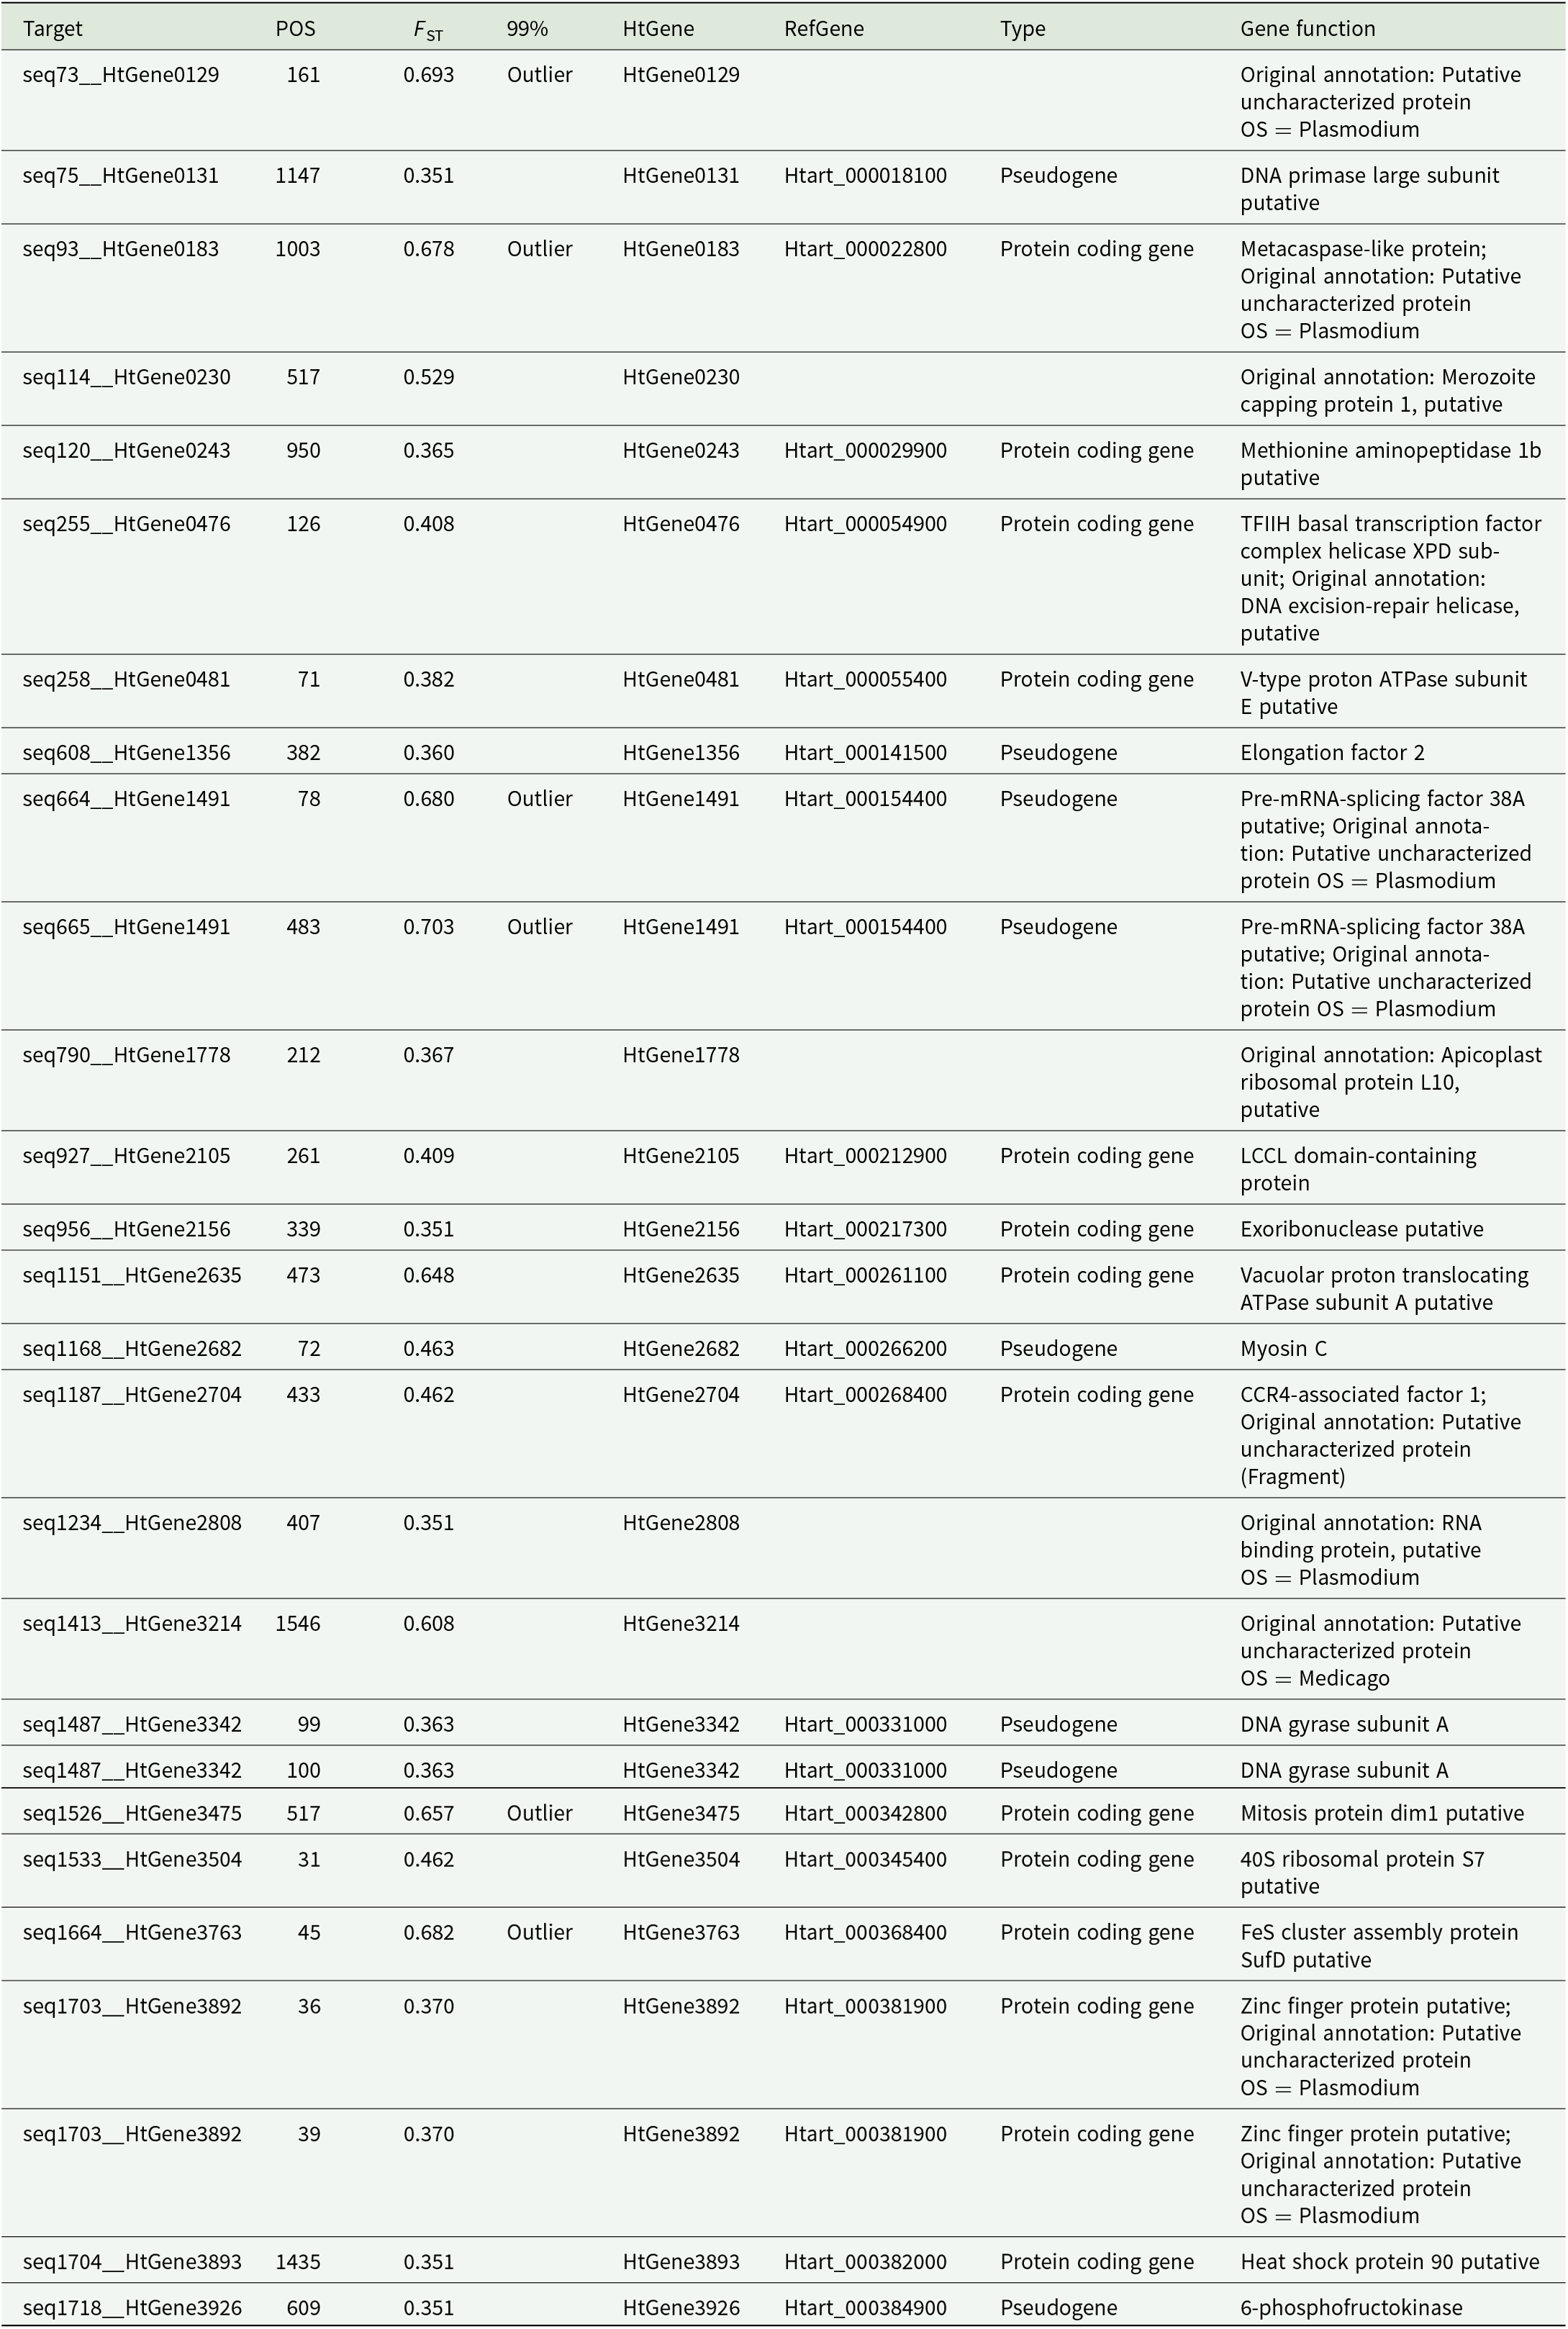
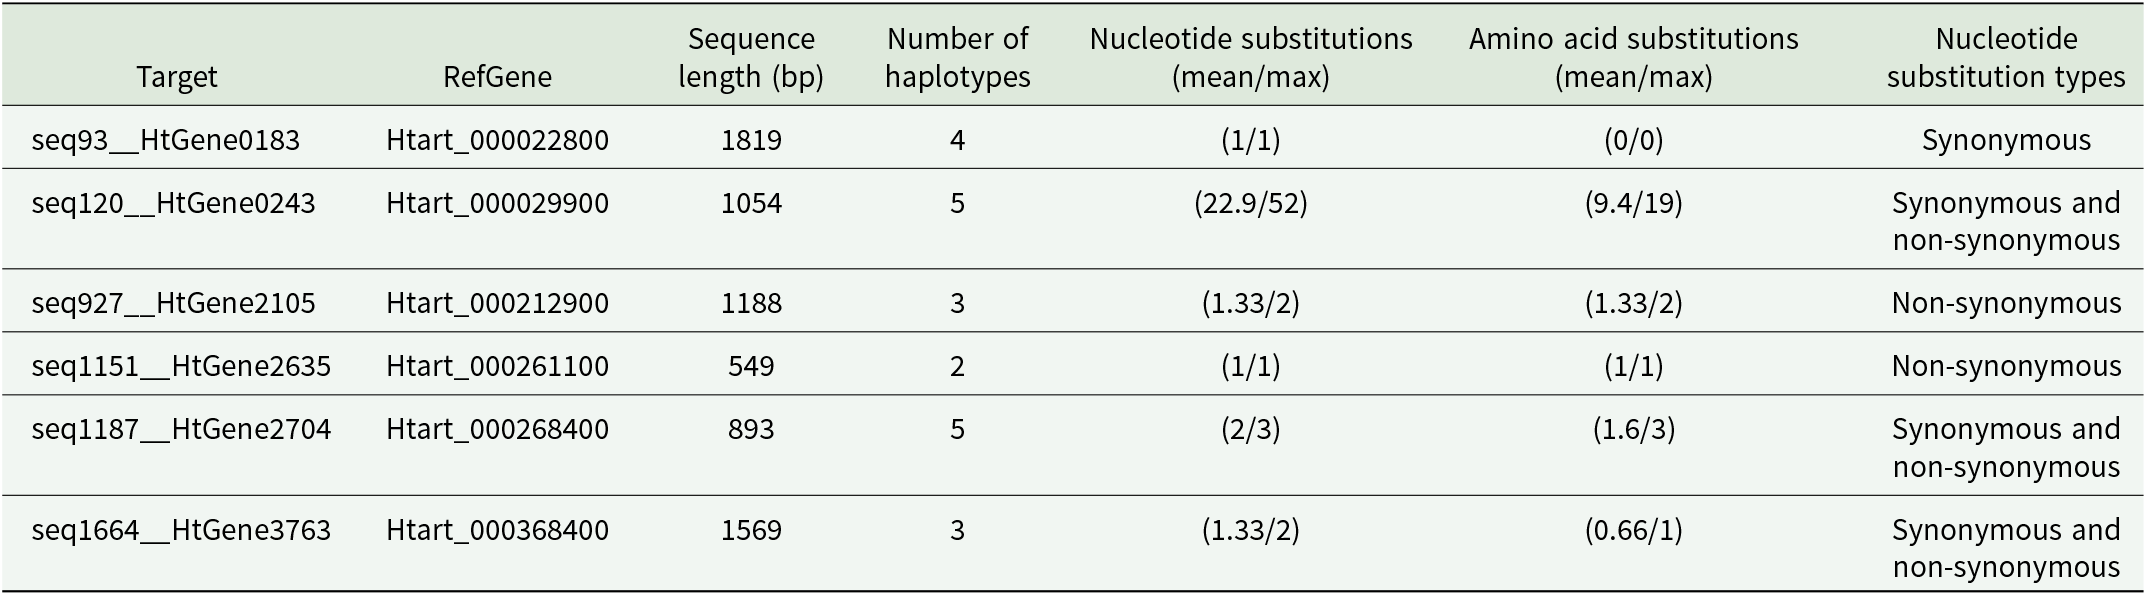
The weighted F ST among all genera with more than 1 host species in the data (Phylloscopus, Sylvia and Parus) was 0.084 and among species with more than 1 infection (Table 1) was 0.065. The weighted F ST between infections of the host genera Phylloscopus and Sylvia was 0.023. When comparing those 2 genera, there were 524 variable sites with F ST > 0. We calculated the 95th (0.351) and 99th (0.655) percentiles of the 524 positive F ST values. There were 27 F ST values higher than the 95th percentile, including 6 higher than the 99th percentile (Table 2). Only 1 of these high F ST values appeared to be related to infection pathways (HtGene0230, merozoite capping protein 1; Table 2). We were able to calculate the number of synonymous and non-synonymous substitutions for 6 genes (annotated as protein coding genes in the reference genome) with high F ST values and found both synonymous and non-synonymous mutations (Table 3). The remaining genes could not be classified for various reasons (e.g. only 1 haplotype in the exon region of the reference, challenges with identifying the correct reading frame after alignment).
Variable sites of the parasite lineage WW2 with FST values between infections in the hosts of the genera Phylloscopus and Sylvia. Only variable sites with FST values greater than the 95th percentile of all positive FST values are shown and sites with FST values greater than the 99th percentile (column 99%) are indicated as ‘outliers’. Target refers to the targeted sequence that the sequence capture probes were designed to capture; POS is the position on that sequence that was variable; HtGene is the name of the gene in the original published assembly of the reference H. tartakovskyi genome; RefGene is the corresponding gene name in the latest assembly; type indicates whether the region is characterized as a protein coding gene or pseudogene in the latest assembly; gene function is the annotated description of the gene in the latest assembly, and the note ‘original annotation’: refers to the annotated description from the original assembly; both the latest and the original assembly descriptions are provided if the gene annotation differs between the assemblies. Missing RefGene and type values indicate that the gene from the original assembly is not annotated in the latest assembly. The FST values for the variable sites are also shown
Target loci (target) with high FST values among Phylloscopus and Sylvia hosts (Table 2) were aligned with exons in the corresponding protein coding genes in the reference H. tartakovskyi assembly (RefGene); we were able to determine nucleotide substitution types (synonymous or non-synonymous) among haplotypes of 6 genes. We present the number of haplotypes per gene, the haplotype sequence length, mean and maximum number of nucleotide substitutions among haplotypes, and the corresponding mean and maximum number of amino acid substitutions in the translated haplotype sequences
An AMOVA revealed significantly more variation than expected by chance among infections in different host genera (43.25% of the variance, P = 0.014) and less variation among infections of the same host species than expected by chance (52.32%, P = 0.001; Table 4).
Results of analysis of molecular variance (AMOVA). the sources of variation were infections among host genera (‘host genera’), infections among host species within host genera (‘host species within genera’), and infections in host species (‘infections within host species’). Degrees of freedom (DF), sum of square deviations (SSD), mean square deviations (MSD), variance and its percent of the total variance; phi is the population differentiation statistic. The p value for each source of variance from a randomization test is also presented. Infections differed among host genera more than expected by chance and infections within host species differed less than expected by chance

Discussion
Using population genomic data from a vector transmitted generalist parasite, we found population structure among infections of different host genera, but not among infections of congeneric host species (Table 4). Infections of the 2 best sampled host genera, Phylloscopus and Sylvia, mostly separated in multivariate space of a PCA (Figure 3). The population structure was associated with genes that were largely unrelated to infection pathways (Table 2). However, 5 of 6 genes with high F ST values between Phylloscopus and Sylvia hosts included non-synonymous mutations (Table 3). Lack of sufficient variation among the infections precluded more direct tests of selection (e.g. McDonald and Kreitman, Reference McDonald and Kreitman1991). Nevertheless, the large proportion of non-synonymous mutations is suggestive of selection. We therefore cannot distinguish between vector-mediated parasite isolation and host-mediated selection in causing the population genetic structure we observed. Nucleotide diversity (π; Figure 1) and, to a lesser extent, Tajima’s D (Figure 2) were negatively skewed. The latter is consistent with a demographic history of historical bottleneck in the parasite followed by population growth. We also identified several mixed lineage infections, which we did not analyse. However, future long-read sequencing may allow for analysis of such mixed lineage infections.
Parasite population structure caused by host-specific selection would plausibly be reflected in high F ST values in genes involved in infection pathways, particularly genes that code for proteins that interact with host cell proteins. This may also be true of population structure among host genera since aspects of the host immune system are evolutionary conserved (O’Connor et al., Reference O’Connor, Strandh, Hasselquist, Nilsson and Westerdahl2016). Only gene HtGene0230 had a high F ST among host genera and was involved in infection pathways (Table 2). In the original annotation of the H. tartakovskyi reference genome (Bensch et al., Reference Bensch, Canbäck, DeBarry, Johansson, Hellgren, Kissinger, Palinauskas, Videvall and Valkiūnas2016), this gene was annotated as merozoite capping protein 1 (MCP1). MCP1 may be involved in the attachment of the merozoite to host red blood cells (Klotz et al., Reference Klotz, Hadley, Aikawa, Leech, Howard and Miller1989). However, in the latest annotation of the H. tartakovskyi genome, the sequence is no longer annotated as a gene (Table 2). Despite the paucity of infection pathway genes contributing to WW2’s population structure among Phylloscopus and Sylvia hosts (Table 2), 5 of 6 investigated genes included non-synonymous nucleotide substitutions separating their haplotypes (Table 3). Parasites may also experience selection in genes in response to different host physiologies, and those genes may not necessarily be related to infection pathways. Another possibility is that genes with high F ST among host genera are linked to infection related genes that we did not sequence. Besides host-specific selection, vectors of WW2 may have different preferences for bird genera; we cannot distinguish between these 2 possibilities with our data. Furthermore, host selection and vector preference may be operating simultaneously. Our results emphasize the need to better study vectors in this system and to characterize more genes in WW2’s genome. Characterizing parasite gene transcription during infection (Videvall et al., Reference Videvall, Cornwallis, Ahrén, Palinauskas, Valkiūnas and Hellgren2017) and among host species (in the case of generalists) remains an important endeavour (Garcia-Longoria et al., Reference Garcia-Longoria, Palinauskas, Ilgūnas, Valkiūnas and Hellgren2020). Furthermore, we sequenced relatively high intensity infections and it is unclear if lower intensity infections would show the same patterns.
Tajima (Reference Tajima1989) examined the relationship between the number of segregating sites and the average number of pairwise differences between sequences of individuals in a neutrally evolving population. The D statistic was described as the difference between the pairwise nucleotide differences and the number of segregating sites (the latter scaled by sample size) divided by the standard deviation of that difference (Tajima, Reference Tajima1989). Negative values of D suggest more rare alleles than expected under a neutrally evolving population. A large negative D might result from a gene under selection, but here we found negative values between −1 and 0 of D across many of the genes surveyed (Figure 2). This result would appear consistent with a historical bottleneck followed by population expansion, since a growing population could produce an excess of new mutations (Hartl, Reference Hartl2020). While it is unclear what could have caused this, one can speculate. The closest relative to WW2 and the other H. majoris lineages might be a specialist of the host Sylvia borin (e.g. SYBOR15 was used as the closest relative of H. majoris in an analysis by Nilsson et al., Reference Nilsson, Taubert, Hellgren, Huang, Palinauskas, Markovets, Valkiūnas and Bensch2016). Such a switch from specialist to generalist may have caused a bottleneck, followed by rapid population growth as the parasite began infecting additional host species. Indeed, Tajima’s D values were lower in infections of Phylloscopus hosts than in infections of Sylvia hosts (Supplementary Fig. S3) as might be expected if Phylloscopus hosts are more recent hosts of WW2. Testing for a relationship between evolutionary shifts in host specificity and parasite population genetics awaits better supported parasite phylogenies (perhaps through mitochondrial genome sequencing; Pacheco et al., Reference Pacheco, Matta, Valkiūnas, Parker, Mello, Stanley, Lentino, Garcia-Amado, Cranfield, Kosakovsky Pond and Escalante2018; Ciloglu et al., Reference Ciloglu, Ellis, Duc, Downing, Inci and Bensch2020) and additional population genomics studies of related parasites. Furthermore, deeper sequencing would allow for quantification of haplotype diversity within individual infections (Videvall et al., Reference Videvall, Cornwallis, Ahrén, Palinauskas, Valkiūnas and Hellgren2017); such diversity may also be relevant for understanding the relationship between host shifts and parasite speciation.
We have demonstrated genetic population structure of a generalist parasite among the genera of its hosts. The mechanism underlying this population structure remains unknown. Our results suggest that parasites are able to diverge and perhaps eventually speciate in sympatry, although isolation among host species in sympatry is not necessarily equivalent to sympatric speciation (Pérez-Tris et al., Reference Pérez-Tris, Hellgren, Križanauskienė, Waldenström, Secondi, Bonneaud, Fjeldså, Hasselquist and Bensch2007). This result is important for considering modes of parasite speciation (Pérez-Tris et al., Reference Pérez-Tris, Hellgren, Križanauskienė, Waldenström, Secondi, Bonneaud, Fjeldså, Hasselquist and Bensch2007; Ricklefs et al., Reference Ricklefs, Outlaw, Svensson-Coelho, Medeiros, Ellis and Latta2014). Future work will need to establish the relationship between parasite population structure and speciation, the frequency with which generalist parasites show signals of genetic population structure among their host species in sympatry, and the mechanisms underpinning such genetic population structure. The field of avian haemosporidian evolutionary ecology has grown rapidly over the last 2 decades with the development of DNA barcoding of parasite lineages (Bensch et al., Reference Bensch, Stjernman, Hasselquist, Örjan, Hannson, Westerdahl and Pinheiro2000; Hellgren et al., Reference Hellgren, Waldenström and Bensch2004) and the establishment of a unifying database to facilitate comparative analyses (Bensch et al., Reference Bensch, Hellgren and Pérez-Tris2009). Novel genomic techniques like sequence capture hold promise for again advancing the field to allow for informative tests of novel hypotheses and a better general understanding of vector-transmitted parasite evolution.
Supplementary material
The supplementary material for this article can be found at https://doi.org/10.1017/S0031182024001641.
Data availability statement
All raw sequence data are available on GenBank (accession number: PRJNA1111424).
Acknowledgements
We thank Shawn Polson (Center for Bioinformatics and Computational Biology, University of Delaware) for conducting an initial analysis of a subset of the data. We thank Tomas Johansson (Lund University) for performing the sequencing. The variant calling and filtering pipelines included elements of code from Shawn Polson’s analysis and code for other pipelines written by Amelia Harrison and Madolyn MacDonald (Center for Bioinformatics and Computational Biology, University of Delaware) and from several online tutorials; VAE is very appreciative of all the examples and help. VAE also thanks Eloisa H. Reis Sari for discussing and providing insights into the results of the study. We thank two reviewers for providing helpful feedback on an earlier version of the manuscript.
Author contributions
VAE and SB designed the study. VAE, MD, AC, OH, and SB contributed to data collection. VAE performed bioinformatic and statistical analyses and wrote the first draft of the manuscript and all authors contributed to and approved the final version of the manuscript.
Financial support
We performed bioinformatic and statistical analyses on the University of Delaware’s BIOMIX cluster, which is supported by Delaware INBRE (NIH/NIGMS P20 GM103446), NIH Shared Instrumentation Grant (S10OD028725), the State of Delaware, and the Delaware Biotechnology Institute. VAE was supported by funding from USDA Hatch (DEL00774, DEL00854, and NE1943) and from the Carl Tryggers Foundation (CTS16:53). The study was also supported by the Swedish Research Council through grants to OH (VR 2016–03419 and 2021-03663) and to SB (VR 2017-03937).
Competing interests
The authors declare there are no conflicts of interest.
Ethical standards
Not applicable.


 Open access