

The gradual decline in repetitive force development that defines muscle fatigue can be attenuated by exercise training or dietary modulation of carbohydrate intake to optimise glycogen storage and availability, but there are no other recognised physiological approaches to fatigue prevention. Increased membrane phospholipid incorporation of long-chain n-3 PUFA (LC n-3 PUFA) DHA (22 : 6n-3), obtained from the diet via fish or fish oil (FO), is associated with increased efficiency of oxygen utilisation in the heart independent of heart rate( Reference Pepe and McLennan 1 ) and improved cardiac work recovery after ischaemic stress( Reference Pepe and McLennan 1 , Reference Abdukeyum, Owen and McLennan 2 ). Dietary FO is also associated with increased whole human body oxygen efficiency during exercise( Reference Peoples, McLennan and Howe 3 ), implicating modified skeletal muscle O2 consumption. In humans and other vertebrates, DHA is the most unsaturated fatty acid present in cell membranes, accounting for up to 5 % of all phospholipid fatty acids in most tissues. However, skeletal muscle( Reference Charnock, Abeywardena and Poletti 4 – Reference Storlien, Jenkins and Chisholm 7 ) has a predisposition to greater DHA incorporation, well beyond its relative percentage among circulating fats( Reference Charnock, Abeywardena and Poletti 4 , Reference McLennan 8 ). Skeletal muscle shares this propensity for concentrated phospholipid DHA incorporation with other highly excitable tissues (myocardium, brain and retina)( Reference Charnock, Abeywardena and Poletti 4 , Reference Owen, Peter-Przyborowska and Hoy 5 , Reference McLennan 8 – Reference Moriguchi, Loewke and Garrison 11 ). These parallels in membrane fatty acid composition, together with certain shared physiological properties( Reference Wasserstrom 12 ), imply an important role for adequate intake of LC n-3 PUFA supporting striated muscle physiology( Reference McLennan 13 ).
High dietary intakes of FO in the rat are associated with apparent resistance of contracting skeletal muscles to fatigue( Reference Peoples and McLennan 14 , Reference Peoples and McLennan 15 ). Earlier in vitro studies have suggested a role of essential fatty acids (both n-6 PUFA and n-3 PUFA) in maintaining skeletal muscle function, compared with animals fed an essential fatty acid-deficient diet( Reference Ayre and Hulbert 16 ). In these and other animal and human studies, physiological effects of LC n-3 PUFA have largely been investigated in relation to high intakes of FO( Reference Storlien, Jenkins and Chisholm 7 , Reference McLennan 13 ), commonly ranging from 5 to over 10 % of diet by weight in animals or 5 to 8 g/d in humans. However, dose–response studies show that the rat responds to very small dietary intakes of FO with large changes in myocardial membrane DHA incorporation( Reference Slee, McLennan and Owen 17 ). This suggests that physiological changes may be achieved with lower, nutritionally relevant dietary interventions.
Although few studies have already revealed the potential influences of LC n-3 PUFA on skeletal muscle function, the single twitch model of contraction used in those dietary studies( Reference Peoples and McLennan 14 , Reference Peoples and McLennan 15 ) or tetanic stimulation protocols in other fatigue studies may not best represent submaximal and usual muscle activity( Reference Jones 18 , Reference Allen, Lamb and Westerblad 19 ). Moreover, the translation of results to human nutrition must be made cautiously, as the high doses of FO previously used( Reference Peoples, McLennan and Howe 3 , Reference Peoples and McLennan 14 , Reference Peoples and McLennan 15 ) are well beyond what could be obtained in the human diet.
The present study used the in vivo muscle function model of autologous pump-perfused hindlimb in anaesthetised rats. We developed this model( Reference Peoples, Hoy and Henry 20 ) so that the experiments could be carried out at physiological temperature to avoid the widely accepted influence of temperature on fatigue development and at physiological blood flow and arterial oxygen content so that the muscle could be oxygenated at physiological levels throughout and not randomly subjected to hypoxia or ischaemia( Reference Allen, Lamb and Westerblad 19 , Reference Lunde, Verburg and Eriksen 21 ). The autologous pump perfusion also ensured that muscle blood flow was controlled independently of intra-experimental fluctuations or dietary influences on cardiac output or blood pressure( Reference Peoples, Hoy and Henry 20 ). For this study, we further incorporated a stimulation protocol for the sciatic nerve: gastrocnemius–soleus–plantaris muscle bundle designed as a more physiological model to mimic functional fatigue. Two FO doses, derived from the studies of Slee et al.( Reference Slee, McLennan and Owen 17 ), were chosen to best replicate human nutritional and therapeutic supplement equivalents, respectively. This study tested the hypothesis that membrane change produced by low intakes of FO would be associated with resistance to physiologically relevant muscle fatigue.
Methods
Animals
In total, eighteen adult male Sprague–Dawley rats were housed two per cage at 23–25°C on a 12 light–12 h dark cycle at the University of Wollongong’s Animal facility. Experiments were approved by the University of Wollongong Animal Care and Ethics Committee and were conducted according to the Australian Code of Practice for the Care and Use of Animals for Scientific Purposes (National Health and Medical Research Council; https://www.nhmrc.gov.au/guidelines-publications). The research was conducted according to the ARRIVE guidelines for reporting in vivo animal experiments( Reference Kilkenny, Browne and Cuthill 22 ).
Rats were obtained at 7 weeks of age (Animal Resources Centre) and fed a standard laboratory chow before randomly allocating them to be fed one of the three pre-fabricated diets ad libitum for 15 weeks from 8 to 10 weeks of age. The diets were prepared as previously developed for similar animal feeding studies( Reference Peoples and McLennan 15 , Reference Slee, McLennan and Owen 17 ). Based on the American Institute of Nutrition AIN 93M diet( Reference Reeves 23 ), they contained a balanced mix of macronutrients and micronutrients to avoid any nutritional deficiencies. All diets contained 10 % fat by weight (100 g/kg). Two sources of fat were used in this study to produce a control diet (10 % olive oil (OO)), low FO (LowFO) diet (0·31 % FO, 9·7 % OO) or a moderate FO (ModFO) diet (1·25 % FO, 8·75 % OO). OO was provided as ‘extra light’ OO, being largely devoid of the antioxidant polyphenols found in less-refined oils. OO consisted principally of oleic acid (18 : 1, 75 %) and provided a minimum concentration of linoleic acid (LA) (18 : 2n-6) to avoid essential fatty acid deficiency( Reference Abdukeyum, Owen and McLennan 2 ). The FO was provided as HiDHA tuna fish oil (Nu-Mega Lipids), containing 29 % DHA and 7 % EPA, 20 % palmitic acid (16 : 0) and 14 % oleic acid as the major fatty acids. The fatty acid profiles of the control and FO diets are provided in Table 1. The energy intake from these diets, based on a 300 g rat eating 20 g/d, was approximately 325 kJ/d. The LowFO diet (3·1 g/kg) was selected to emulate a human dietary EPA+DHA intake of 0·24 % energy calculated equivalent to a human intake of 570 mg/d EPA+DHA and is a dose that approximately doubles myocardial DHA-relative percentage( Reference Slee, McLennan and Owen 17 ). The ModFO diet (12·5 g/kg) was selected to emulate a human therapeutic supplement EPA+DHA intake of 1·0 % energy equivalent to 2·3 g/d EPA+DHA and is a dose that produces changes in n-3 PUFA relative percentage that approach the asymptote of the dose–response curve for n-3 PUFA incorporation in cardiac( Reference McLennan 8 , Reference Slee, McLennan and Owen 17 ) and skeletal muscles( Reference Owen, Peter-Przyborowska and Hoy 5 ). This ModFO dose, already shown to be cardioprotective, is the lowest dose that has been tested physiologically to date( Reference McLennan, Owen and Slee 24 ).
Dietary fatty acid composition for diets with different concentrations of fish oil (FO)
Control diet, 0% FO; LowFO, 0·31 % low FO diet; ModFO, 1·25 % moderate FO diet; OO, olive oil; OA, oleic acid; LA, linoleic acid; LNA, linolenic acid; AA, arachidonic acid.
Surgical hindlimb preparation
The in vivo autologous, pump-perfused rat hindlimb preparation used in the present study has been described in detail and validated physiologically( Reference Peoples, Hoy and Henry 20 , Reference Hoy, Peoples and McLennan 25 ). In brief, rats were anaesthetised (pentobarbitone sodium, 60 mg/kg i.p.) and maintained throughout the experiment with supplementary injections of 20 mg/kg i.p. pentobarbitone sodium. Rat body temperature was maintained at 37°C with the aid of a heated perspex chamber maintained at 31 (sem 1)°C and an ancillary radiant heat lamp. Animals were ventilated at 60 breaths/min, and systemic blood pressure was monitored via the carotid artery. The left sciatic nerve was isolated for electrical stimulation of the hindlimb and the gastrocnemius–soleus–plantaris muscle bundle was attached to a force transducer (FT03C; Grass Technologies) at the Achilles tendon. A pump-perfusion system supplied the hindlimb muscles of the left leg below the knee with oxygenated arterial blood( Reference Peoples, Hoy and Henry 20 ). The femoral vein was cannulated for post-muscle blood sampling with venous blood returned passively to the systemic circulation. The extracorporeal perfusion circuit was primed with 6 % dextran (w/v) (dextran 60; Sigma-Aldrich) and 5000 IU heparin/100 ml (Sigma-Aldrich) in normal saline. The extracorporeal circuit plus the perfused muscle held a total volume of approximately 3 ml.
Blood flow and muscle stimulation
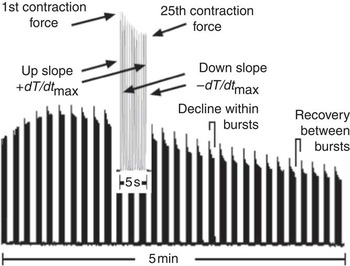
Once all cannulations were in place and blood flowed freely throughout the system, the pump was engaged to perfuse the left leg at 1 ml/min, supporting resting blood flow requirements( Reference Peoples, Hoy and Henry 20 ), for 30 min equilibration before stimulating muscle contraction. Hindlimb perfusion pressure was monitored via a pressure transducer (Argon CDXIII; Maxim Medical) distal to the pump. The sciatic nerve was stimulated at supramaximal voltage to elicit muscle contraction and the muscle stretched to the optimal length for maximal twitch contraction force. Perfusion flow was increased to 1·5 ml/min to support the increased oxygen demand( Reference Peoples, Hoy and Henry 20 ) for the duration of the muscle contraction protocol. Contractions were evoked using 5 s burst trains of pulses (5 Hz, 7–12 V, 0·05 ms) with 10 s duty cycle for 5 min (Fig. 1).
Typical experimental trace from the contracting rat hindlimb illustrating force development during a 5-min stimulation protocol (5 Hz, 5 s duty cycle) with (inset) one 5 s burst expanded to show the key derived measures of force and rate of force development (±dT/dt max).
Muscle samples and fatty acid analysis
Gastrocnemius and soleus muscles were separated from the contralateral, unstimulated hindlimb during surgical preparation of the perfused limb, and the left ventricle was collected on completion of the hindlimb stimulation protocol, after euthanasia by rapid exsanguination under anaesthesia. Samples were rapidly taken from three sites: the left ventricle free wall; the entire soleus muscle cleared of connective tissue; and the lateral superficial gastrocnemius muscle belly. All samples were rapidly frozen and stored at –80°C. Skeletal and cardiac muscle samples (100–200 mg) underwent total lipid extraction using a modification of the Folch method( Reference Folch, Lees and Sloane Stanley 26 ). Phospholipids were isolated from the total muscle lipid by solid-phase extraction using silica Sep-pak™ cartridges (Waters). Fatty acid methyl esters were prepared by direct transesterification( Reference Lepage and Roy 27 ) of phospholipids and analysed by GC( Reference Slee, McLennan and Owen 17 ) using a Shimadzu GC-17A (Shimadzu Australasia) with flame ionisation detection. Individual fatty acid peaks on the chromatogram were identified by comparison with authentic fatty acid methyl ester standards (Sigma-Aldrich Corporation) and Nu Chek Prep Inc. and expressed as percentage of total fatty acids in the phospholipid fraction. Peroxidisability index was calculated as the sum of bis-allelic hydrogen atoms (located on the methylene carbon atoms between two double bonds) according to the following formula: (% dienoic acids×1)+(% trienoics×2)+(% tetraenoics×3)+(% pentaenoics×4)+(% hexaenoics×5)( Reference Kubo, Saito and Tadokoro 28 ).
Data analysis and calculations
Contractile force was recorded and contraction characteristics were analysed using LabView for Windows with custom programming. Force and contraction characteristics were analysed for the 1st and the 25th (last) contraction in each 5 s contraction burst (Fig. 1). Fatigue was recorded as follows: (a) as the decline in developed force from 1st to 25th contraction within each burst; and (b) as the decline in force between contraction bursts over time. The rate of fatigue between bursts was determined, from both 1st and 25th contractions in each burst, as the time taken for the individual contraction-developed force to decline to 50 % of the maximum peak contraction force.
Statistics
Researchers were blinded to the allocation of animals to dietary groups until data collection and analysis were completed. Sample size calculation for membrane fatty acids estimated n 4 to detect 25 % relative change in DHA (80 % power for dose, α=0·05, mean 7.69 %, sd=1·35 %( Reference Slee, McLennan and Owen 17 )) and for contractile function, based on a 2 Hz continuous stimulation protocol, n 5 was required to detect 35 % increase in time to fatigue (80 % power, α=0·05, mean 522 s, sd=142 s). Results are expressed as mean values with their standard errors of the mean. Two-way repeated measures ANOVA was used to analyse between-muscle-type differences and effects of diet on fatty acid incorporation into muscle tissues, with tissue and diet main effects and (diet×tissue) interaction, followed by Tukey’s post hoc comparison of means (Statistix for Windows; Analytical Software). Statistical significance was accepted at P<0·05.
Results
Effects of diet on body weight and muscle weight
One rat was lost to the experiment due to excessive blood loss during preparative surgery, with no experimental data obtained, leaving the final numbers as follows: Control n 6; LowFO n 4; ModFO n 7 for all measures. After 15 weeks of dietary intervention, there were no significant dietary differences in body mass (Control: 463 (sem 30) g, LowFO: 457 (sem 44) g, ModFO: 464 (sem 12) g) (P>0·05); gastrocnemius–soleus–plantaris mass (Control: 3·02 (sem 0·12) g, LowFO: 3·15 (sem 0·15) g, ModFO: 3·03 (sem 0·09) g) (P>0·05) or in the ratio of gastrocnemius–soleus–plantaris mass:tibia length (Control: 6·91 (sem 0·24), LowFO: 7·30 (sem 0·24), ModFO: 6·89 (sem 0·15)) (P>0·05).
Effect of muscle type on membrane phospholipid fatty acid composition
Statistically significant, between-tissue differences were observed for most fatty acids. In control animals, the few exceptions were as follows: no between-tissues differences in the minor LC n-3 PUFA, DPA (<1 %) or EPA (not detected) or in LA (18 : 2n-6), which was the most abundant individual fatty acid at about 20 % of the total. There were no differences in membrane peroxidisability index between tissues in control animals (Table 2).
Percentage of fatty acid composition of membrane phospholipids of heart and hindlimb muscles from rats after dietary fish oil (FO) supplementation for 15 weeks (Mean values with their standard errors; n 4–6 per group)
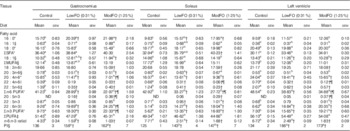
LowFO, low FO diet; ModFO, moderate FO diet; ΣSFA, sum of SFA; ΣMUFA, sum of MUFA; ΣPUFA, sum of PUFA; PI, peroxidisability index (peroxidisability index was calculated from the formula: (% dienoic acids×1)+(% trienoics×2)+(% tetraenoics×3)+(% pentaenoics×4)+(% hexaenoics×5))( Reference Kubo, Saito and Tadokoro 28 ).
a,b,c Between tissues (within diets): mean values with unlike superscript letters were significantly different from those of other tissues within that diet.
Within tissues (between diets): † P<0·05 v. control diet; ¶ P<0·05 v. LowFO diet. Overall between tissues (all diet groups combined): * P<0·05 LV≠sol≠gastroc; || P<0·05 gastroc ≠sol, LV; § P<0·05 sol≠gastroc, LV; ‡ P<0·05 LV≠sol, gastroc.
In control animals, the gastrocnemius muscle had significantly lower percentages of the SFA stearic acid 18 : 0 and MUFA oleic acid 18 : 1 compared with either soleus or myocardium, which were not significantly different to each other. In contrast, gastrocnemius had significantly higher percentages of the SFA palmitic acid 16 : 0 and LC n-3 PUFA DHA, as well as lower ratio of n-6:n-3 PUFA, than either the soleus or myocardium, which were not significantly different to each other (Table 2). In the soleus and myocardium, the principal SFA 18 : 0 was found at twice the percentage of 16 : 0, whereas in gastrocnemius the two were approximately equal. There were significant variations with tissue type in total relative percentages of SFA (gastrocnemius>soleus, myocardium), MUFA (soleus>myocardium, gastrocnemius) and PUFA (myocardium>gastrocnemius, soleus).
With respect to LC PUFA (Table 2), the gastrocnemius muscle exhibited greater 22 : 6n-3 DHA and total n-3 PUFA and exhibited lower 20 : 4n-6 arachidonic acid (AA), 18 : 2n-6 LA, total n-6 PUFA percentages and n-6:n-3 PUFA ratio, compared with either the soleus or the left ventricle (all P<0·001). The soleus further differed from the left ventricle in having lower percentages of 20 : 4n-6 AA and total n-6 PUFA (all P<0·001). The LC n-3 PUFA 20 : 5n-3 EPA was not detectable in any of the muscle tissues from control animals.
Effect of fish oil diets on membrane fatty acid composition
There were significant effects of FO diets on both types of skeletal muscle and cardiac membrane composition (Table 2). The major effects of dietary FO were increased percentages of DHA (22 : 6n-3, P<0·001) and reduced AA (20 : 4n-6, P<0·001). Smaller changes were observed in other fatty acids, including reduced percentages of LA (18 : 2n-6, P<0·001) and a small but statistically significant incorporation of EPA (20 : 5n-3, P<0·001). These changes resulted in increased relative percentage of total n-3 PUFA (P<0·001) and peroxidisability index (P<0·001) and decreased relative percentage of total n-6 PUFA (P<0·001) and n-6:n-3 PUFA ratio (P<0·001). The incorporation of n-3 PUFA in exchange for n-6 PUFA was greater in the gastrocnemius muscle (all P<0·05, diet×tissue interaction).
In the gastrocnemius muscle, the higher dose ModFO diet was associated with significant further decrease in relative percentage of AA and increased DHA compared with the LowFO diet, with further reduced total n-6 PUFA and increased total n-3 PUFA (P<0·05) (Table 2). In the soleus muscle and myocardium, the ModFO diet was associated with a small but significant further lowering in the relative percentage of total n-6 PUFA (P<0·05) compared with the LowFO diet but no significant differences in DHA, LA, AA or any other major individual fatty acid or total n-3 PUFA (Table 2).
Force characteristics
Maximum peak contractile force was reached within the first few 5 s bouts of 5 Hz stimulation. The 1st contraction in each repeated 5 s bout was characterised by a rapid decline from bout to bout over 2–2·5 min to a plateau level, which was maintained over the final minutes of the protocol (Fig. 2(a)). The developed tension of the 25th (last) contraction in repeated bouts also declined rapidly from bout to bout over 1–1·5 min to a plateau level maintained over the final minutes of the protocol (Fig. 2(b)). Peak developed force declined from contraction to contraction (1–25) within the 5 s bouts (Fig. 3).
Effect of diet on force production (N/100 g muscle mass) of gastrocnemius–soleus–plantaris muscle bundle during repeated burst (5 Hz, 5 s duty cycle) stimulation for 5 min. (a) Force of the 1st contraction in each burst and (b) force of the 25th (last) contraction in each burst. Horizontal broken lines represent 50 % of maximum contraction (see Fig. 1 for illustration), arrows (solid=Control diet; broken=FO diets) show coincidence of the (a) 1st and (b) the 25th contraction in a burst with its decline to <50 % of the maximum. Bars represent mean values with their standard errors of the mean. Filled bars: Control diet n 6; shaded bars: LowFO diet n 4; open bars: ModFO diet n 7. * LowFO, ModFO different from control (P<0·05). FO, fish oil; LowFO, low FO diet; ModFO, moderate FO diet. ![]() , Control;
, Control; ![]() , LowFO;
, LowFO; ![]() , ModFO.
, ModFO.

There were no dietary differences in the maximum peak force (Control: 222 (sem 14); LowFO: 212 (sem 4); ModFO: 218 (sem 9) N/100 g muscle mass) (P>0·05). Peak developed force declined over time and significant diet×time interactions were evident (contraction 1: P=0·020, contraction 25: P<0·001). A significantly longer time was taken for the 1st contraction force to decline by 50 % in the FO groups compared with control (Table 3) (P<0·02) (Fig. 2(a)), and developed force was better sustained in the FO groups throughout and at the end of the 5 min of contractions (Fig. 2) (contraction 1, contraction 25: P<0·001). There were no significant differences between LowFO and ModFO groups (contraction 1: P=1·000, contraction 25: P=0·993).
Effect of dietary fish oil (FO) on time (s) to decline to 50 % of the maximum for contraction and relaxation parameters of the 1st and the 25th (last) contractions in repetitive 5 s burst stimulation(Mean values with their standard errors)
LowFO, low FO diet; ModFO, moderate FO diet.
*P<0·05 v. control diet.
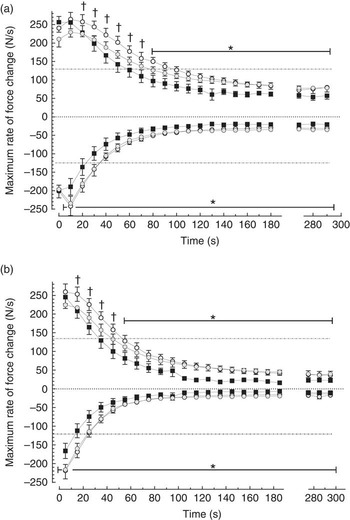
Peak developed force declined within each 5 s burst (contractions 1–25), and over the first 60 s there was significantly less within-burst decline in the FO groups compared with control (Fig. 3). The FO groups took significantly longer for the 25th contraction peak developed force to decline by 50 % (Table 3) (P<0·05). Maximum rates of force development and relaxation (Fig. 4) slowed down markedly over the first 60–100 s, and the decline in contraction and relaxation velocity was significantly greater in the control muscle than in FO muscles over the duration of the stimulation protocol. There were no significant differences between the LowFO and ModFO diets (Fig. 4).
Effect of diet on differences in developed force (N/100 g muscle mass) within bursts (below axis) and recovery between bursts (above axis) of (5 Hz, 5 s duty cycle) stimulation over 5 min. Within-burst changes represent short-term fatigue over 5 s. Between bursts represent recovery of contractile force in the 1st contraction of a new burst relative to the 25th (last) contraction of the previous one (see Fig. 1 for illustration). Bars represent mean values with their standard errors of the mean. Filled bars: Control diet n 6; shaded bars: LowFO diet n 4; open bars: ModFO diet n 7. * LowFO, ModFO different from control (P<0·05); † LowFO, ModFO different from control (P<0·02). LowFO, low fish oil diet; ModFO, moderate fish oil diet. ![]() , Control;
, Control; ![]() , LowFO;
, LowFO; ![]() , ModFO.
, ModFO.

Effect of diet on maximum rate of force development (dT/dt
max above axis) and maximum rate of force decline (–dT/dt
max below axis) in individual contractions (N/100 g per s) during repeated burst (5 Hz, 5 s duty cycle) stimulation for 5 min. (a) 1st contraction and (b) 25th (last) contraction in each 5 s burst (see Fig. 1 for illustration). Horizontal broken lines represent 50 % of the maximum. Filled symbols: Control diet n 6; shaded symbols: LowFO diet n 4; open symbols: ModFO diet n 7. Symbols and bars represent mean values with their standard errors of the mean. * LowFO, ModFO different from control (P<0·05). † ModFO different from control (P<0·02). LowFO, low fish oil diet; ModFO, moderate fish oil diet. ![]() , Control;
, Control; ![]() , LowFO;
, LowFO; ![]() , ModFO.
, ModFO.
Hindlimb perfusion pressure and resistance
There were no significant differences in resting hindlimb perfusion pressures across dietary groups (at 1 ml/min: Control 73 (sem 11) mmHg; LowFO 77 (sem 2); ModFO 76 (sem 4) and at 1·5 ml/min: Control 106 (sem 13) mmHg; LowFO 109 (sem 6); ModFO 104 (sem 5)). Mean hindlimb perfusion pressure (at 1·5 ml/min) decreased during muscle contractions in FO dietary groups (P<0·05) with a non-significant trend in the control group (P=0·08) (Control 92 (sem 13) mmHg; LowFO 85 (sem 3); ModFO 88 (sem 4)). There were no significant differences in perfusion pressure between dietary groups at rest or during muscle activity (P>0·05). A significantly greater percentage fall in mean hindlimb vascular resistance occurred during muscle contraction in the FO dietary groups compared with control (P=0·010).
Discussion
Membrane phospholipid fatty acid composition of rat skeletal muscle was highly responsive to dietary FO, and elevated incorporation of DHA was associated with resistance to muscle fatigue. This was achieved with a low-dose human nutritional equivalent of 1–2 fishmeals/week with little further dose-related changes, in either the membrane composition or the contraction parameters, obtained from the higher dose human therapeutic equivalent of 6–7 g of FO/d( Reference Slee, McLennan and Owen 17 ). The tuna fish oil supplement used in this study, with its high proportion of DHA, is consistent with the predominance of DHA in the human diet when obtained through common food fish( Reference Mozaffarian and Wu 29 ) and in contrast to most dietary FO supplements that commonly provide EPA:DHA in the ratio 180:120 mg/g. The in vivo hindlimb perfusion model permitted the examination of dietary effects on muscle function and fatigue under well-oxygenated, well-perfused and appropriate physiological conditions( Reference Peoples, Hoy and Henry 20 ). Effects on fatigue could be directly attributable to the change in muscle function without the potential confounding effects of dietary FO on cardiovascular function or behaviour. The membrane changes and fatigue resistance were achieved using much lower dietary LC n-3 PUFA concentrations than values previously reported in the literature. From these intakes, both of which were within a range that could reasonably be modulated nutritionally in man, skeletal muscle and myocardium incorporated high relative percentages of LC n-3 PUFA DHA into membrane phospholipids. Muscle types exhibited differences in fatty acid composition in accord with their contrasting physiological functions and fibre-type characteristics. Soleus muscle and myocardium had comparable patterns of fatty acid incorporation, including high DHA incorporation, in contrast to the fast twitch, fatigable gastrocnemius muscle, which incorporated even higher relative percentages of DHA.
The lower of the two FO doses increased gastrocnemius and soleus muscle membrane DHA incorporation by 10 % of the total fatty acids, despite providing <1 % of all the fatty acids in the diet. In contrast, LA diminished slightly in the membranes, despite being present at 8 % of dietary fat and in an n-6:n-3 PUFA ratio of 5:1 in the lowFO diet, with the LA concentration almost ten times that of DHA. Concomitant reductions occurred in membrane AA of <4 % in skeletal muscle or 6 % in the heart. Thus, skeletal muscle of the rat incorporated DHA into membrane phospholipids well above its relative percentage in the diet, as seen with high dietary FO doses( Reference Owen, Peter-Przyborowska and Hoy 5 ) and against an unfavourable ratio of n-6:n-3 PUFA. This finding confirms studies of skeletal muscle from developing rats and studies of rat myocardium that show that the absolute delivery of DHA is more important than its ratio to n-6 PUFA( Reference Stark, Lim and Salem 6 , Reference Slee, McLennan and Owen 17 ), even at these low intakes of LC n-3 PUFA. Although there can be no doubt that dietary n-6:n-3 PUFA ratio powerfully influences n-3 PUFA membrane incorporation when it is dependent upon the shorter-chain precursor α-linolenic acid (18 : 3n-3)( Reference Tu, Muhlhausler and Yelland 30 ), this is due to competition for enzyme sites for desaturation or elongation, limiting metabolic conversion to EPA and DHA. The present study demonstrated that the incorporation into membrane phospholipids is not subject to the same competition and confirms the previously reported lack of influence of dietary n-6 PUFA on LC n-3 PUFA incorporation into rat myocardium( Reference Slee, McLennan and Owen 17 ) or for clinical effect( Reference Griffin 31 ). Striated muscle membranes preferentially incorporate DHA, and this is further illustrated by the very low incorporation of EPA into skeletal muscle or myocardium, despite significant dietary presentation in this study or when it is provided in a purified form in the diet( Reference McLennan, Howe and Abeywardena 32 ) or as high EPA FO that delivers plasma fatty acid EPA well in excess of DHA( Reference McLennan 8 ). Some tissues such as platelets preferentially incorporate EPA, and the underlying physiological basis for differential incorporation is not known.
The slow-contracting, oxidative and fatigue-resistant soleus muscle, which provides slow-to-fatigue ankle stability and balance is in many ways similar to the ventricular myocardium. The soleus muscle and the myocardium share a common isoform of myosin heavy chain that exhibit low basal rates of ATP consumption (termed MHCslow in type I muscle fibres and MHC β in ventricular myocardium)( Reference Sieck and Regnier 33 ). The ATP reserve capacity associated with MHCslow and the lower ATP cost for any developed tension in type I fibres( Reference Han, Proctor and Geiger 34 ) confer ATP conservation and fatigue resistance on soleus muscle( Reference Howlett and Hogan 35 ). In contrast, in terms of fibre type, the portion of the gastrocnemius muscle sampled for fatty acid analysis in this study typically comprises mainly fast glycolytic/type IIb fibres with few of the slow-twitch, oxidative and fatigue-resistant type I fibres that almost exclusively make up the soleus muscle( Reference Delp and Duan 36 , Reference Armstrong and Phelps 37 ). Type II fibres are characteristically glycolytic, fast-twitch and provide short-term power generation. They are rich in MHC2 isoforms( Reference Sieck and Regnier 33 ), which exhibit high rates of ATP consumption and low ATP reserve( Reference Han, Proctor and Geiger 34 ), making them rapidly subject to fatigue with extended use. Preferential incorporation of DHA into the fast-contracting, powerful gastrocnemius muscle compared with the slower-contracting soleus has previously been reported in developing rats( Reference Stark, Lim and Salem 6 ). A similar very high incorporation of DHA into faster compared with slow muscle types is emphasised in species such as the rattlesnake and the hummingbird, which possess muscle groups of even more extreme contrast in contraction speed within them( Reference Infante, Kirwan and Brenna 38 ). The higher retention of DHA in the gastrocnemius of non-supplemented rats may reflect an adaptive response to the higher maximum rates of ATP turnover of the largely fast-twitch gastrocnemius muscle fibres compared with the soleus and heart.
The dietary FO-induced proportional increases in membrane DHA increased the unsaturation and peroxidisability index of the muscle membranes, forecasting increased risk of oxidative damage( Reference Kubo, Saito and Tadokoro 28 ) and fatigability( Reference Powers and Jackson 39 ); however, this is contrary to what was borne out in the physiological measures of fatigue. Similarly, in the myocardium, the increase in peroxidisability induced by increased membrane DHA is paradoxically associated with reduced ischaemia–reperfusion fatty acid peroxidation and oxidative damage( Reference Kubo, Saito and Tadokoro 28 , Reference Erdogan, Fadillioglu and Ozgocmen 40 ). This has been attributed to an adaptive increase in the activity of superoxide dismutase and other endogenous antioxidant enzymes( Reference Erdogan, Fadillioglu and Ozgocmen 40 – Reference Molinar-Toribio, Pérez-Jiménez and Ramos-Romero 42 ). It suggests that chronically increased membrane peroxidisability induces chronic but non-damaging oxidative stress and adaptation in the same way that acute exercise induces oxidative stress, yet chronic exercise up-regulates antioxidant mechanisms and promotes fatigue resistance( Reference Gomes, Silva and de Oliveira 43 ). Alternatively, it was recently reported that anti-arrhythmic actions of DHA are enhanced by concomitant promotion of oxidation by H2O2 and inhibited by antioxidants, effects attributed to the specific non-enzymatic oxidative production of DHA-derived neuroprotectins( Reference Roy, Oger and Thireau 44 ). Irrespective of the mechanism, increased peroxidisability of the membranes by enhanced DHA content is associated with protective rather than damaging effects under oxidative stress.
Non-dietary, adaptive increases in DHA incorporation and lower tissue n-6:n-3 PUFA ratio( Reference McLennan and Abeywardena 45 ) occur commonly in response to stresses in a variety of tissues including human exercising skeletal muscle( Reference Helge, Wu and Willer 46 ), ageing human heart( Reference Gudbjarnason 47 ), human placenta at altitude( Reference Tissot van Patot, Murray and Beckey 48 ), chronic hypoxic rat heart( Reference Balkova, Jezkova and Hlavackova 49 ) and chronic catecholamine stress in rat heart( Reference Gudbjarnason 47 ). An adaptive increase can be seen across mammalian species (including man) in relation to high BMR or resting heart rate, where the whale with its very low heart rate and high LC n-3 PUFA intake has very low myocardial DHA, in contrast to the mouse that has a very high heart rate, yet very high cardiac DHA-relative percentage, despite low LC n-3 PUFA intake( Reference McLennan and Abeywardena 45 , Reference Gudbjarnason 47 ). In direct contrast, dietary intervention to raise cardiac DHA is associated with slower heart rates and preconditioning protection against these stresses( Reference Abdukeyum, Owen and McLennan 2 , Reference McLennan 13 , Reference McLennan and Abeywardena 45 ). A similar observation applies to the restriction of acute muscle fatigue with dietary n-3 PUFA( Reference Peoples and McLennan 14 , Reference Peoples and McLennan 15 ) in contrast to the preferential incorporation of DHA and lower n-6:n-3 PUFA ratio in the more rapidly fatiguing gastrocnemius( Reference Stark, Lim and Salem 6 ), and this may be related to the greater metabolic stress prevalent in type II fibres.
The upper dose ModFO (1·25 % FO) diet induced DHA incorporation in the gastrocnemius to the same extent as reported previously with high dose 7 % FO supplementation in the similar, mixed fibre-type m. vastus lateralis ( Reference Peoples and McLennan 14 ). In the present study, there was little displacement of tissue LA compared with earlier studies that used high FO doses. With diets in those studies delivering six times the DHA dose and a n-6:n-3 PUFA ratio of <0·2, it is evident that the previous studies used FO doses far in excess of requirements for maximal effect.
The modulation of rat muscle phospholipid fatty acid composition, as a result of these small FO intakes, induced marked resistance to muscle fatigue in vivo without influencing the initial peak force of contraction of the hindlimb. Fatigue in the contracting hindlimb could be characterised in terms of extent of decline in twitch force within the 25 contractions of any 5 s burst; extent of decline in twitch force from burst to burst (which has a recovery component); the time course of the decline in twitch force; the decline in maximum rate of force production and relaxation; and the time course of those changes. The dietary FO markedly attenuated the decrease in muscle force production and extended the time course of well-sustained isometric force production. In other words, the hindlimb muscles of animals fed FO were able to complete more contractions at a force closer to their peak isometric tension. In skeletal muscles, when force is sustained at a higher relative tension over time, it is explained by the optimal coupling relationship between cellular ATP demand, inherently the efficiency of ATP use by the contracting cell, and the metabolic supply( Reference MacIntosh and Shahi 50 , Reference Hogan, Richardson and Kurdak 51 ). Furthermore, although muscles sustained higher peak contractile force for longer after FO feeding, the attenuation in decline in rates of force production and relaxation also implies an optimal coupling of net Ca2+ turnover and cellular ATP maintenance, most importantly associated with the powerful but fatigable, fast-twitch fibres( Reference Lindstedt, McGlothlin and Percy 52 ).
Notably, the greatest effect of dietary FO, retarding fatigue, occurred in the earliest phase of contraction, which corresponds to the highest rate of tension decline from peak force. With single-pulse or tetanic burst contractions, fatigue occurs much more rapidly in fast, type II muscle fibres than in slow, type I fibres in shortening or isometric contractions( Reference Allen, Lamb and Westerblad 19 , Reference Lunde, Verburg and Eriksen 21 ). This response is likely due to the greater part of the hindlimb muscle bundle representing fast, type II fibres, densely packed with sarcoplasmic reticulum (SR) and expressing high sarcoplasmic reticulum Ca2+ATPase (SERCA) concentration, a requirement to sustain rapid force production and relaxation. Highly effective SERCA, such as those in the powerful muscle fibres, rely on the phospholipid environment to carry out rapid removal of calcium against its concentration gradient( Reference Infante 53 ). There is strong evidence that when DHA makes up a high proportion of the membrane fatty acids, this process of Ca2+ pumping is optimised( Reference Infante, Kirwan and Brenna 38 ), thus sustaining force production in the periods of rapid fatigue.
Although this study demonstrates a clear association between dietary fatty acids, muscle incorporation of DHA and fatigue resistance, it does not identify the mechanisms of fatigue that are affected. As FO feeding does not modify glycogen storage or attenuate metabolic acidosis during fatiguing muscle stimulation( Reference Peoples and McLennan 15 ), we can exclude the two most common interventional approaches used ahead of exercise to improve muscle function: promotion of glycogen storage and metabolic alkalosis inducible by sodium bicarbonate ingestion( Reference Raymer, Marsh and Kowalchuk 54 ). We must, therefore, consider one or more of the many other cellular mechanisms potentially underlying fatigue resistance( Reference Lunde, Verburg and Eriksen 21 , Reference Allen, Lamb and Westerblad 19 ). Although they are not readily directly examinable in vivo ( Reference Allen, Lamb and Westerblad 19 ), some insight into the potential mechanisms of action of LC n-3 PUFA fatigue resistance may be gained from comparison with interventions that, in contrast to FO, enhance muscle fatigue.
The pattern of improved muscle function by FO relative to control contrasts with the effects that the β 2 adrenoceptor agonist clenbuterol has on muscle function. Chronic clenbuterol treatment has found some popularity in body building for its promotion of muscle hypertrophy, but it significantly slows relaxation and decreases resistance to fatigue in fast-twitch muscle fibres( Reference Sirvent, Douillard and Galbes 55 ). Clenbuterol’s functional effects appear linked to intra-cellular Ca2+ homoeostasis, especially the leakage of SR Ca2+ ( Reference Sirvent, Douillard and Galbes 55 ). The decline in SR Ca2+ and slow SR Ca2+ re-uptake, with the latter contributing to slowed isometric relaxation, are believed to underpin fatigue in both fast- and slow-twitch muscles under tetanic( Reference Hortemo, Munkvik and Lunde 56 ) or non-tetanic stimulation( Reference Verburg, Thorud and Eriksen 57 , Reference MacIntosh, Glumpak and MacNaughton 58 ). If FO were to prevent SR Ca2+ leakage and promote SR Ca2+ re-uptake, this could explain the fatigue resistance. Indeed, such an effect has been observed in the myocardium in which altered Ca2+ handling is recognised to play a part in DHA action in myocardial intra-cellular signalling, with modulated SR Ca2+ leakage implicated in cardiac pacemaker slowing and arrhythmia prevention in cardiac muscles( Reference McLennan 13 ). Both direct and indirect evidence shows increased efficiency of SR Ca2+ handling as a basis for the prevention of arrhythmia( Reference Pepe and McLennan 1 , Reference Roy, Oger and Thireau 44 ) and reduced mitochondrial Ca2+ uptake as a basis for increased oxygen efficiency( Reference Pepe and McLennan 1 ) or as the basis for reduced mitochondrial pyruvate dehydrogenase activity( Reference Pepe, Tsuchiya and Lakatta 59 ) in the rat myocardium after FO feeding. However, the evidence is equivocal with another study finding that dietary FO has little influence on cardiac SERCA activity and may even increase cardiac mitochondrial Ca2+-ATPase activity( Reference Croset and Kinsella 60 ). Moreover, an in vitro study of SR function of skeletal muscle from rats fed DHA also revealed reduced SERCA activity and increased Ca2+ leakage( Reference Fajardo, Bombardier and Irvine 61 ), which would predict slower relaxation and increased energy requirements and fatigability, the opposite to what is actually observed in vivo during muscle contraction in the present study. Further studies are needed to investigate the role of altered Ca2+ homoeostasis on the effects that membrane incorporation of DHA has on muscle fatigue.
Further studies are also required to identify effects more specifically in fast- and slow-twitch fibre types in accordance with differences in DHA incorporation. The improved muscle function during the early fast-fatiguing component of the non-tetanic repetitive burst stimulation protocol implicates fast, type II fibres in a primary role in this study, in line with the predominance of the gastrocnemius muscle in the contracting bundle. However, slow type I fibres and involvement of the soleus muscle are also implicated in DHA effects by the sustained greater force and better sustained rates of force development observed after the early fatigue phase, as well as the continued greater recovery between contraction bouts after FO feeding. Although the myocardium typically does not fatigue acutely, contractile function and relaxation do decline significantly during heart failure and this can be counteracted by feeding FO( Reference McLennan, Abeywardena and Dallimore 62 , Reference Duda, O’Shea and Stanley 63 ). The patterns of enhanced skeletal muscle fatigue in rats with heart failure( Reference Lunde, Verburg and Eriksen 21 ) suggest that a benefit could be gained by increasing membrane DHA.
This study demonstrates that marked changes in muscle membrane fatty acid composition together with resistance to muscle fatigue are achievable in rat skeletal muscle with only small dietary supplements of LC n-3 PUFA, in a range readily compatible with human nutrition( Reference McLennan 13 ). The low effective dose and the DHA-rich tuna fish oil supplement replicate human dietary patterns achievable from a low–moderate intake of fish, and provide a basis for translating to humans the physiological observations made in this study and those previously made using high doses of FO in animals. Furthermore, tissue differences in membrane fatty acid composition suggest specific incorporation of fatty acids reflective of physiological function, with the fatigue-resistant slower-contracting soleus muscle and myocardium exhibiting many compositional similarities in contrast with the highly fatigable fast-contracting gastrocnemius muscle. Of particular note, although it is generally incorporated well in all striated muscles, DHA was innately incorporated in higher relative percentages in the gastrocnemius compared with the soleus muscle and myocardium without any dietary intervention as well as in response to FO feeding, perhaps reflecting an adaptive response to the higher peak metabolic demand and fatigability of the predominant type II muscle fibres. The large changes in composition and function achieved with only small additions of FO to the diet suggest that DHA may be an essential component of striated muscle for optimal healthy function and that the failure to include regular fish or FO in the diet might lead to a deficiency reflected in susceptibility to muscle fatigue.
Acknowledgements
The authors thank Clover Corporation and Nu-Mega Lipids (Australia) for their generous donation of high-DHA tuna fish oil.
This research received no specific grant from any funding agency, commercial or not-for-profit sectors. The research was supported by the donation of high-DHA tuna fish oil from Clover Corporation and Nu-Mega Lipids (Australia).
R. H., G. E. P. and P. L. M. conceived and designed the research; R. H. collected and analysed the data; R. H. and P. L. M. statistically analysed the data; and R. H., G. E. P. and P. L. M. interpreted the data and provided important intellectual content for drafting the manuscript. P. L. M. had the primary responsibility for the final content.
There are no conflicts of interest.


