

Habitual consumption of unhealthy diets will have long-term negative effects on population health status and the patterns of disease. A common approach to improve dietary practices is the promotion of population-specific food-based dietary recommendations (FBR) that provide guidance on healthy food choices( Reference Anderson, Black and Harris 1 ). To be effective, FBR must promote food choices that correspond with a population's habitual dietary practices and ensure nutrient adequacy( 2 ).
The formulation of FBR is complex, time-consuming and often based on a consensus-building process that relies on subjective expert opinion( 2 ). To improve this process, simple iterative approaches were developed using food group composites or population-specific menus with healthy nutrient profiles( 2 , Reference Murphy and Barr 3 ). Their disadvantage is that they do not take into account variability in individual food choices, resulting in an overestimation of positive impacts on dietary adequacy at the population level( Reference Murphy and Barr 3 ). To help overcome this limitation, a two-step model was developed that combined a food pattern approach with diet simulation( Reference Katamay, Esslinger and Vigneault 4 ). Models based on linear programming were also developed to select the best set of FBR from among alternatives( Reference Ferguson, Darmon and Briend 5 – Reference Santika, Fahmida and Ferguson 7 ). These more recent models identify FBR that help ensure that a population's nutrient needs are met. However, they do not simulate distributions of ‘actual’ dietary intakes, which limits the conclusions that can be drawn. For example, they cannot be used to predict the changes in the percentage of the population at risk of inadequate nutrient intakes after the successful adoption of a set of FBR. Furthermore, the Canadian model does not control the energy intake distribution and all simulated diets have identical food patterns that conform to a specific set of FBR( Reference Katamay, Esslinger and Vigneault 4 ). Thus, energy intake distributions may deviate from reality in unpredictable ways in relation to the mean, variance or shape of the energy intake distribution. In reality, a population's habitual energy intake distribution will probably remain constant because it is driven by each individual's energy requirement( 8 ).
To overcome the above limitations, we developed a probabilistic model that simulates both a population's food group patterns and energy requirement distributions at baseline and after the introduction of alternative sets of FBR. This new model simulates actual dietary practices both before and after the successful introduction of a set of FBR, which allows standardised predictions of the extent of improvements in a population's diet following the successful introduction of alternative sets of FBR (i.e. both baseline and post-intervention intake distributions are simulated). Furthermore, one can evaluate the robustness of the model by comparing observed and simulated baseline dietary intakes. Such information will provide a strong theoretical justification for the selection of a set of FBR, and it will predict their maximum impact on dietary adequacy. In the present study, the model is described and its application illustrated using a hypothetical population of 12- to 18-month-old breast-feeding children consuming a simple cereal-based diet low in animal source foods. This diet is typical of rural diets in low-income countries. However, the model also can be used to simulate the impact of alternative sets of FBR on dietary adequacy for populations in high-income countries.
Methods
Data requirements to define model parameters
Dietary survey data are used to define model parameters. Specifically, dietary data are required to define the list of foods consumed by the target population, and then for each food, its median serving size (g/d for consumers), its probability of being selected from within its food group and its food composition data. In addition, data are required to define the target population's intake distribution for food groups, expressed as the number of servings of foods consumed per week from different food groups (low, median and high numbers of servings per week).
Model
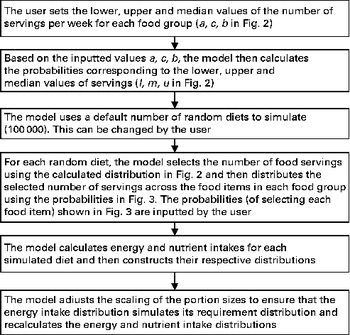
The mathematical details of the model are given in the appendix (see online supplementary Appendix) and what follows is a general description of the model. The model is probabilistic. It simulates a random distribution of 7 d diets at baseline and after the successful adoption of a set of FBR. In this context, baseline 7 d diets are simulations of foods currently consumed by the target population, i.e. the observed baseline diets from which model parameters are derived. The reason for simulating the observed baseline diets was to standardise the predicted benefits of FBR. The outputs from each simulation (i.e. the simulated diets at baseline and then after the adoption of each FBR being tested) are simulated energy and nutrient intake distributions for the target population and the simulated percentage of the target population at risk of inadequate nutrient intakes. The number of simulated outputs depends on the number of FBR tested.
In all simulations, energy intake distributions were constrained to be the same as baseline for all sets of FBR tested, and to correspond with energy requirement distributions of the target population. Nutrient intake distributions from these simulated diets were estimated. The percentage of the population at risk of inadequate nutrient intakes at baseline and after the successful adoption of a set of FBR was estimated by calculating the percentage of simulated nutrient intakes falling below the estimated average requirement for each nutrient.
A diet is defined by the number of servings of food items consumed per week. Each food item belongs to a food group. Figure 1 shows the schematic matrix of one diet. The food groups are the columns (e.g. A = vegetables, B = fruits, etc.) and the food items are the rows (e.g. within vegetables, 1 = potato, 2 = green beans, etc.; within fruits, 1 = banana, 2 = apple, etc.).
Schematic diagram of one diet. The diet consists of five food groups (A to E). Food group A contains two servings of food item 2, one serving of food item 3, one serving of food item 5; food group B contains three servings of food item 3; food group C contains one serving of food item 1 and four servings of food item 4; food group D contains one serving of food item 1; food group E contains one serving of food item 1 and one serving of food item 3. In total, the diet consists of four servings of food group A, three servings of food group B, five servings of food group C, one serving of food group D and two servings of food group E. Each ● indicates one serving of the selected food item.

The mathematical model to simulate the baseline and endline (i.e. after the successful adoption of a set of FBR) dietary intakes of energy and nutrients can be described in four steps. The first step generates, for each diet, the number of servings of foods from each food group per week. The number of servings is simulated as integers. We assume a triangular-like probability distribution, as shown in Fig. 2.
Discrete probability distribution of the number of servings of food items from a food group. The number of servings is bounded between a and b and its median is c. (A colour version of this figure can be found online at http://www.journals.cambridge.org/bjn).
In Fig. 2, the x-axis is the number of servings per week and the y-axis is the probability; a and b are, respectively, the lower and upper bounds of the number of servings per week and c is the median; l, u and m are the probabilities associated with a, c and b, respectively. Only three input parameters are required to specify the aforementioned distribution: the lower and upper bounds of the number of servings and the median number of servings per week for a food group, which would be obtained from quantitative dietary survey data, such as data from semi-quantitative FFQ, dietary recalls or diet records. For a given set of parameters (a, c and b), the probabilities l, u and m are calculated using probability theory (see online supplementary Appendix A.1). We have chosen a triangular-like probability distribution because the number of servings is discrete and because it can represent a skewed (asymmetric) distribution. Other distributions could be used if there is sufficient evidence to justify their use. We used a minimal number of constraints to calculate the probabilities l, u and m for any valid set of the parameters a, b and c. Once the number of servings for each food group is selected randomly, for a given simulated diet, based on the aforementioned distribution, the second step distributes this number among the food items within each food group according to another set of given distributions (Fig. 3).
Schematic of the discrete probability distribution function for selecting food items within a food group. There are three food items present in the food group. p 1, p 2 and p 3 are, respectively, the probabilities of selecting food items 1 to 3 within the food group. If q is the total number of servings of the food group, then the number of servings for each food item is q× p 1, q× p 2 and q× p 3, respectively (to the nearest integer value).
In the third step, the content of energy and nutrients in each diet is calculated by multiplying the grams of each food item in each diet by its energy and nutrient contents per gram, and summing the energy and nutrient contents of all the food items in each diet to give its total content for each nutrient (see online supplementary Appendix A.2).
In the fourth step, portion sizes of all food items are adjusted using a scalar to ensure that the distribution of the simulated energy content of the diet is as close as possible to the energy requirement distribution of the target population. This adjustment was achieved mathematically by manipulating the value of the scalar until the mean and the variance of the simulated energy content are as close as possible to those of the population energy requirements (see online supplementary Appendix A.3). Step 3 is repeated to calculate the energy and nutrient intake distributions.
Estimation of the percentage of the population at risk of inadequate nutrient intakes
The percentage of the population at risk of inadequate nutrient intakes is estimated by calculating the percentage of each simulated nutrient intake distribution that falls below its estimated average requirement. For Fe, this method will not accurately estimate the proportion at risk of inadequate Fe intakes for pre-menopausal women and young children because of their skewed requirement distributions( Reference Allen, de Beoist and Dary 9 ). Instead, for these target groups, the tabular approach should be applied using the data from the simulated Fe intake distribution( Reference Allen, de Beoist and Dary 9 ).
Simulating a set of food-based dietary recommendations
A set of FBR can be presented either in the form of a minimum number of servings per d or week that should be consumed from the selected food groups or subgroups (e.g. consume at least three servings of fruit per d) or in the form of a minimum number of servings per d or week that should be consumed from selected food items within a food group (e.g. consume one serving of banana per week).
To simulate a set of FBR, the same basic steps are followed as for the baseline diet with the following changes that vary depending on whether the set of FBR includes recommendations for specific foods, food groups or subgroups:
-
A. A FBR to consume a number of servings of food items from a specific food group or subgroup. In this case, when a minimum number of G g servings from the food group g is recommended, then the following changes are applied:
-
1 Set the minimum number of servings from the food group g (i.e. set the parameter a in Fig. 2) to G g .
-
2 If the minimum number of servings in the recommendation is greater than the baseline median (b) or the upper end of the distribution (c) at baseline (i.e. when the new a≥ b or c), the values of b and c are changed iteratively using mathematical optimisation, such that they are as close as possible to the original values (see online supplementary Appendix A.1, step 2).
-
3 Select the number of food servings per week from the food group g according to the new triangular-like probability distribution with these new parameters.
-
-
B. A FBR to consume a specific food item(s). In this case, when a minimum number of F f servings per week of the food item f from the food group g (with G g equal to the total number of servings of food items within this food group) is recommended, then the following changes are applied:
-
1 Let the new value of G g be equal to the old value of G g minus F f .
-
2 Repeat the previous step if there are further food items from the food group g in the set of FBR being tested.
-
3 If G g >0, then distribute G g food items according to the given discrete food distribution of food items within the food group g. If G g ≤ 0, then there are no remaining servings to distribute to the other foods in the food group g.
-
The above-mentioned two procedures were carried out for the entire set of FBR. Afterwards, as described previously in the baseline case, the portion sizes were scaled to ensure that the simulated energy intake distribution, for a population adhering to the set of recommendations, is as close as possible to that of the baseline. The only user-entered values were G g and F f . Figure 4 summarises schematically the simulation steps for the calculation of the baseline energy and nutrient intake distributions before the introduction of the set of FBR.
Simulation steps for the calculation of baseline values before the introduction of food-based dietary recommendations. In the illustrative example, 50 000 random diets were simulated.
Illustrative example
The following example simulates the adoption of the two sets of FBR to compare their predicted impacts on the percentage of the population at risk of inadequate vitamin C, vitamin B12 and riboflavin intakes in relation to the simulated baseline rates (i.e. before the adoption of the FBR). The illustrative target population is a population of 12- to 18-month-old toddlers. Only three nutrients were selected to keep this illustration simple.
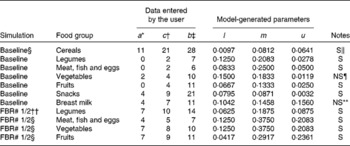
The model parameters derived from the dietary survey data were a list of foods, and for each food, its median serving size (g/d for only the consumers), its probability of being selected from within its food group and its food composition data, an extract of which is shown in Table 1. For example, one food item from the food list was boiled rice. It had an average serving size of 50 g/d, a probability of selection from the cereal food group of 0·595, and food composition data for energy, vitamin C, riboflavin and vitamin B12 (the food composition data are not shown). The data used in this illustrative example, for the food group distributions shown in Fig. 2 for the baseline and FBR simulations, are given in Table 2. The original baseline data entered by the user (a, b and c) as well as the simulated parameters for the triangular shape (l, u and m) are also given. The data used to define these model parameters were collected using 1 d weighed food records.
An extract* from the food list used in the illustrative example
* Data were used in the model for three of the seven food groups modelled.
† The foods modelled for each food group. These foods represent those consumed by at least 5 % of the children surveyed.
‡ The serving sizes are the median serving size per meal for all children who consumed the food.
§ The probabilities equal the frequency with which each food item was reported divided by the sum of frequencies for all food items in the food group. For example, the frequencies of consumption for boiled rice, fried rice, porridge and fortified infant cereal were 88, 5, 52 and 3, respectively. The probabilities of selection for these food items were, therefore, 88/148 = 0·595, 5/148 = 0·034, 52/148 = 0·351 and 3/148 = 0·02, respectively. For breast milk, we assumed that all children were breast-fed and hence the probability was equal to 1.
Calculated probabilities (l, m, u) per food group for each of the given sets of parameters (a, c, b) of the triangular-like distributions of food servings (Fig. 2)
FBR, food-based dietary recommendations.
* At baseline, the parameter represents a value in the lower tail of the observed intake distribution for the number of servings per week consumed from each food group. For example, this value could represent the 5th or 10th percentile of the target population's intake distribution for the selected food group. It can also represent the number or minimum number of servings in a FBR.
† The parameter represents the median of the observed intake distribution for the number of servings per week consumed from each food group.
‡ The parameter represents the upper tail of the observed intake distribution for the number of servings per week consumed from each food group. For example, this value could equate to the 90th or 95th percentile of the target population's intake distribution for the selected food group.
§ Baseline represents the food patterns observed for the target population before a set of FBR are successfully adopted.
∥ ‘S’ means that a solution was obtained for the probabilities (l, m, u) corresponding to the user-defined values of the parameters.
¶ ‘NS’ means that no solution was obtained for the given user-defined set of parameters. The original values (a= 3, b= 10, c= 4) did not generate a valid triangular distribution; for these cases, the parameter values were revised through an iterative procedure to generate numbers close to the originals and for which a solution for the probabilities (l, m, u) was obtained.
** ‘NS’ means that no solution was obtained for the given user-defined set of parameters. The original values (a= 3, b= 11, c= 4) did not yield a solution; for these cases, the parameter values were revised through an iterative procedure to generate numbers close to the originals and for which a solution for the probabilities (l, m, u) was obtained.
†† ‘FBR 1/2’ means food-based recommendations 1 and 2 that were evaluated.
The two sets of modelled FBR, in this example, differed in their level of specificity, to illustrate the model outputs. These FBR were as follows:
FBR#1
-
Consume
-
Breast milk every day
-
Cereals every day
-
At least one serving per d of vegetables
-
At least one serving per d of fruit
-
At least four servings per week of meat, fish or eggs
-
At least one serving per d of legumes
-
FBR#2
-
Consume
-
Breast milk every day
-
Cereals every day, of which at least one serving per d must be a fortified toddler cereal
-
At least one serving per d of vegetables, of which at least five servings per week must be spinach
-
At least one serving per d of fruit
-
At least four servings per week of meat, fish or eggs, of which at least one serving per week must be chicken liver
-
At least one serving per d of legumes
-
Simulate a set of food-based recommendations
The next step is to simulate the adoption of the two sets of FBR using the same basic steps as for the baseline diet with the changes listed in Table 2. Specifically, the lower food group parameter (i.e. a) was increased from 0, 0, 2 and 0 to the recommended 7, 4, 7 and 7 servings per week of foods in the legumes, meat–poultry–fish–eggs, vegetable and fruit food groups, respectively, in both sets of FBR. The other model parameters (i.e. b and c) were modified as appropriate (see Table 2 and the above-listed procedure A).
As in the baseline case, the energy intake distribution was simulated for diets that respected each set of FBR (see the online supplementary Appendix A.2), and then the portion sizes were scaled, as described before, to ensure that the simulated energy intake distribution of the recommendation is as close as possible to that of the baseline. The nutrient intake distributions were simulated, and the percentage of the population at risk of inadequate vitamin C, vitamin B12 and riboflavin intakes was calculated for each of the three simulated scenarios (i.e. baseline and after the successful adoption of FBR#1 and FBR#2) using the WHO's estimated average requirement for 1- to 3-year-old children( Reference Allen, de Beoist and Dary 9 ).
Results
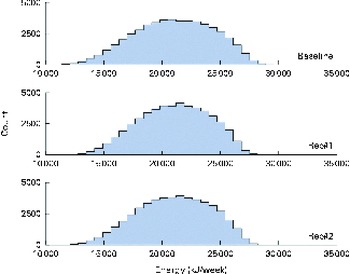
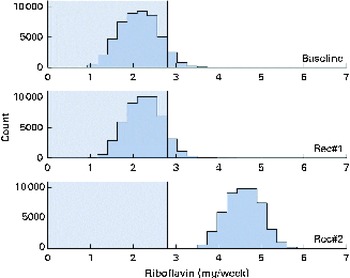
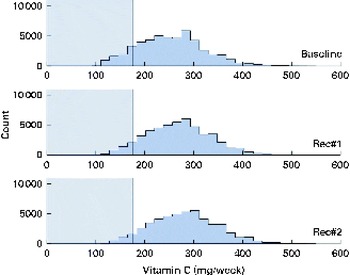
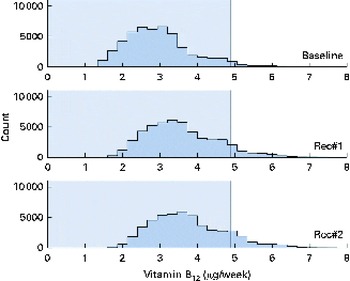
A total of 50 000 diets were simulated for each of the three scenarios. The estimated energy intake distributions (means and standard deviations) were similar at baseline and after the introduction of the two different sets of recommendations (Table 3 and Fig. 5), which allowed standardised comparisons of the mean nutrient intakes and the percentage of the population at risk of inadequate nutrient intakes across the three scenarios (Table 3 and Figs. 6–8). Likewise, as expected, the nutrient intake distributions shifted to the right after introducing the two sets of FBR, and the largest change occurred with the more specific set of the two sets of recommendations, i.e. FBR#2. In this example, the model predicted the increases in the mean intakes of vitamin C, B12 and riboflavin from baseline that ranged from 5 to 20 % for FBR#1 and 11 to 114 % for FBR#2 (Table 3). This resulted in a decrease in the percentage of the population at risk of inadequate nutrient intakes of 2–7 percentage points for FBR#1 and 9–92 percentage points for FBR#2 (Table 3). These results highlighted the nutritional benefits, especially for riboflavin, of promoting the second instead of the first set of recommendations, i.e. a 92 percentage point v. a 2 percentage point reduction in the percentage of the population at risk of inadequate riboflavin intakes (Table 3). Indeed, based on these analyses, successful promotion of FBR#2 will probably ensure adequate vitamin C and riboflavin intakes in this target population (i.e. < 10 % of the population at risk of inadequate nutrient intakes). Such comparisons show the nutritional advantages of promoting FBR#2 instead of FBR#1 to improve dietary adequacy in this target population. This example also shows that the FBR do not substantially decrease the percentage of the population at risk of inadequate vitamin B12 intakes (Table 3), indicating that alternative strategies from those tested are needed to improve vitamin B12 intakes.
Simulated mean intakes of energy and selected nutrient intakes and the percentage of the population at risk of inadequate nutrient intakes at baseline and after the adoption of two sets of food-based recommendations* (Mean values and standard deviations)
* All simulated diets adhere to the set of food-based recommendations that were assessed.
† Baseline intakes of energy and selected nutrients represent a simulation of the target population's usual energy and nutrient intakes at present (i.e. the observed intakes before the food-based dietary recommendations are adopted).
‡ The percentage of at risk of inadequate nutrient intakes estimated using the fixed cut-off point approach( Reference Allen, de Beoist and Dary 9 ) and the FAO/WHO's estimated average requirements for 1- to 3-year-old children( Reference Allen, de Beoist and Dary 9 ).
§ Intakes of energy and selected nutrients estimated from the diets simulated to adhere to the following set of food-based diet recommendations: breast-feed daily on demand; consume at least one serving each of fruit, vegetables and legumes every day and animal source foods at least four times per week.
∥ Intakes of energy and selected nutrients estimated from the diets simulated to adhere to the following set of food-based diet recommendations: breast-feed daily on demand; consume at least one serving each of fruit, vegetables and legumes every day, animal source foods at least four times per week, spinach at least 5 d per week, liver at least once per week and a fortified toddler cereal every day.
Simulated energy intake distributions at baseline and after the introduction of two sets of food-based recommendations (Rec). Each distribution was generated from 50 000 simulated diets. (A colour version of this figure can be found online at http://www.journals.cambridge.org/bjn).
Simulated riboflavin intake distributions at baseline and after the introduction of two sets of food-based recommendations (Rec) in relation to the estimated average requirements (EAR) for riboflavin (i.e. 0·4 mg/d). Each distribution was generated from 50 000 simulated diets. (A colour version of this figure can be found online at http://www.journals.cambridge.org/bjn).
Simulated vitamin C intake distributions at baseline and after the introduction of two sets of food-based recommendations (Rec) in relation to the estimated average requirement (EAR) for vitamin C (i.e. 25 mg/d). Each distribution was generated from 50 000 simulated diets. (A colour version of this figure can be found online at http://www.journals.cambridge.org/bjn).
Simulated vitamin B12 intake distributions at baseline and after the introduction of two sets of food-based recommendations (Rec) in relation to the estimated average requirement (EAR) for vitamin B12 (i.e. 0·7 μg/d). Each distribution was generated from 50 000 simulated diets. (A colour version of this figure can be found online at http://www.journals.cambridge.org/bjn).
Discussion
Main results
A model was developed from first principles to simulate a population's intakes of energy and nutrients by simulating 7 d diets from their fundamental components: food groups; food items within the food groups; number of daily servings of food items (per d or per week); serving sizes (g/d); energy and nutrient contents of different food items (per 100 g). Characteristics of 7 d diets, for a population, are inherently variable because of inter-subject differences in the types of food items consumed each week and in the number of servings of individual food items consumed per week. This meant that a probabilistic model was more appropriate than a deterministic model to simulate a population-level diet. The parameters of the probabilistic model were selected to model a population's observed food selection patterns, resulting in simulated energy and nutrient intake distributions at baseline. The impacts of FBR were modelled by increasing from baseline the lower levels of relevant model parameters (i.e. the number of servings per week from food groups or food items) and adjusting food portion sizes to maintain isoenergetic intake distributions. This process of adjusting energy intake distributions to standardise the results across the FBR/baseline simulations allowed meaningful inter-FBR comparisons. To model FBR, the width of the relevant food pattern distributions was reduced and food portion sizes were scaled, which is based on a reasonable assumption that individuals will not increase their energy intakes when adopting a set of FBR. We took the conservative approach of scaling all food items instead of a set of individual food items, such as dietary staples, because actual practices are unpredictable.
The model can be used in practice to test and compare the impact of alternative sets of FBR on nutrient adequacy at the population level. From the model results, the user can select the best set of FBR from among the alternatives for improving dietary adequacy, as illustrated here for FBR#2. They can predict the maximum improvements in dietary adequacy expected after the successful adoption of a set of FBR. Such information allows programme planners to set realistic programme goals and evaluation indicator levels for target populations at high risk of inadequate nutrient intakes (i.e. rural populations in low-income countries). The results also identify the nutrients that may require alternative intervention strategies, such as supplementation or fortification, to improve nutrient status, as shown here for vitamin B12.
Strengths of the model
This model makes a significant advance to the literature on operations research models to support panels or programme planners formulating population-specific FBR. Current models do not control the modelled energy intake distribution or predict changes from baseline in the percentage of the population at risk of inadequate nutrient intakes when evaluating a set of dietary recommendations( Reference Murphy and Barr 3 ). This energy consideration is important because individuals maintain their energy needs independent of the food group patterns in their diet. The strength of simulating both baseline (i.e. the observed diets) and endline dietary intake distributions is that it standardises the predicted improvements in dietary adequacy following the successful adoption of FBR, and provides comparative data (i.e. observed v. simulated mean dietary intakes) with which the model's outputs can be evaluated.
From a theoretical perspective, another main strength of this model is its transparency and generalisability. Mathematical models that are used as decision tools in practice are sometimes criticised because they appear as a ‘black-box’ from the perspective of the user. This model was formulated analytically in a stepwise manner to clearly define model parameters and model outputs. In addition, the conditions under which the solutions of the model exist and reflect an observed behaviour can be determined (i.e. one can assess whether the predicted intake distributions at baseline have modelled the actual observed intakes). The analytical formulation of the model maps unambiguously to its numerical implementation, and this makes it easier for others to generalise the use of the model.
Weaknesses of the model
As in the case of any model, this model has several weaknesses. One of its main weaknesses is that a solution of the probabilistic triangular-like pattern shown in Fig. 2 does not always exist for any pre-specified values of the median and bounds of the number of servings (per week) of each food item. For these circumstances, we have provided an iterative method to obtain a solution by changing to a minimal extent the maximum and median values for the number of servings from those that are specified. A second potential weakness of the model is that, in theory, it is not always possible to guarantee that the modelled variance of energy intake is as close as possible to the observed variance. This scenario happens if the variability in the model is much larger than that in the data. However, this is unlikely to happen when the model parameters are based on the observed dietary patterns. In the situation that it happens, the model should be re-parameterised to reduce its variability, for example by selecting different parameters that define the distributions shown in Figs. 2 and 3. A third weakness of the model is that it is difficult to ascertain the degree to which the solutions are sensitive to the triangular-like pattern of the probabilistic profiles shown in Fig. 2. Other patterns could have been used. However, in our view, a triangular shape represents the most flexible pattern and is a common observed shape for food group distributions. A fourth weakness of the model is the uniform adjustment of all food portion sizes to maintain isoenergetic intake distributions at baseline and after the introduction of alternative sets of FBR. In reality, individuals may choose to reduce the consumption of a select group of foods or eliminate some foods from their diets. However, without empirical evidence to support selective adjustments in specific food portion sizes, the conservative approach of adjustments in uniform portion size was taken, which is more likely to underestimate instead of overestimate the impact of FBR on dietary adequacy. A fifth weakness of the model is that the optimisation does not constrain the asymmetry in the probability distribution of the number of servings. The reason for not constraining the distribution is that the constraint level would be recommendation dependent (and arbitrary), which limits the extent to which results can be generalised/compared across different sets of recommendations. This limitation may cause, for some recommendations, an overestimation of nutrients in simulated diets. For example, in Table 2 (last row), the probability to eat eleven servings of fruits (0·2361) in the FBR is higher than the probability to eat the recommended seven servings (0·0417) and the baseline probability to eat eleven servings of fruits (0·0250; Table 2, row 5).
In conclusion, a probabilistic model was developed to simulate realistic population intake distributions for energy and nutrients under different dietary regimens. The model can predict maximum benefits in populations where dietary adequacy is difficult to achieve (i.e. low-income countries) as well as overall benefits in any target population (i.e. low- or high-income countries). This model can be used by expert panels as a decision support tool to predict the impacts of alternative sets of FBR on dietary adequacy. In the present study, only one application of this model was illustrated. However, it could be used in multiple ways to inform nutrition programme planners or to advocate for nutrition policy change. Future studies could evaluate model sensitivity to uncertainty in model parameter estimates, including the process of scaling food serving sizes to resolve a discrepancy between simulated mean energy intakes and the target population's estimated average energy requirements. Future studies could also validate the modelled energy and nutrient intake distributions at baseline using empirical data from diverse populations. Indeed, such validations could be systematically done each time the model was set up using the dietary data that defined model parameters, and changes made to the model parameters as appropriate.
Supplementary material
To view supplementary material for this article, please visit http://dx.doi.org/10.1017/S0007114514000695
Acknowledgements
The present study was partially funded by the WHO's Department of Maternal, Newborn, Child and Adolescent Health, Geneva.
The authors' responsibilities were as follows: E. F. and A. B. conceived the idea of the study; Z. C. developed the mathematics of the model; R. S. contributed to the development of the mathematics, implemented the model and carried out the simulations; Z. C. and E. F. wrote the first draft of the manuscript. All authors were involved in the interpretation of the results and finalising of the manuscript.
None of the authors had a conflict of interest.


