


INTRODUCTION
How does personal experience of climate change shape political attitudes and behavior? Since 2017, climate disasters in the United States have displaced more than 5 million people, killed 4,500, and caused $765 billion in damages (Krieger Reference Krieger2022). Worldwide, disasters take a daily toll of 12,000 people displaced, 115 killed, and $202 million in infrastructural damage (Douris and Kim Reference Douris and Kim2021). These costs underscore the pressing consequences of climate change for political, social, and economic well-being. By rendering climate change visible and immediate, disasters may help overcome barriers to climate action. A burgeoning literature examines the effects of these disasters on climate attitudes (Bergquist and Warshaw Reference Bergquist and Warshaw2019; Egan and Mullin Reference Egan and Mullin2012; Whitmarsh Reference Whitmarsh2008), mitigation (Baccini and Leemann Reference Baccini and Leemann2021) and adaptation policies (Healy and Malhotra Reference Healy and Malhotra2009), and pro-environment voting (Garside and Zhai Reference Garside and Zhai2022; Hazlett and Mildenberger Reference Hazlett and Mildenberger2020), consumption (Spence et al. Reference Spence, Poortinga, Butler and Pidgeon2011), and collective action (Boudet et al. Reference Boudet, Giordono, Zanocco, Satein and Whitley2020).
We extend this literature by offering the first exploration of how climate disasters shape attitudes on climate-induced migration.Footnote 1 This represents a central question for climate and migration policymaking given the massive expected scale of climate-driven displacement. Rigaud et al. (Reference Rigaud, de Sherbinin, Jones, Bergmann, Clement, Ober and Schewe2018) anticipate 143-million climate migrants worldwide by 2050. Likewise, Xu et al. (Reference Xu, Kohler, Lenton, Svenning and Scheffer2020) estimate that 1.5-billion people may be climate-displaced from the Global South by 2070. At this scale, aggressive climate mitigation may be the only way to avert mass displacement (Marotzke, Semmann, and Milinski Reference Marotzke, Semmann and Milinski2020). While most contemporary climate migration occurs in the Global South, developed countries are also vulnerable. Several million Americans have been displaced by environmental disasters since 2005. Our findings bear directly on how Americans might respond to climate-displaced people in their communities.
Understanding climate migration attitudes and how these are affected by climate disasters is also theoretically important. First, evidence suggests climate migrants are viewed distinctly from other categories of migrants like refugees (Arias and Blair Reference Arias and Blair2022; Spilker et al. Reference Spilker, Nguyen, Koubi and Böhmelt2020). Disentangling the microfoundations of attitudes on climate migration contributes to broader theory-building about the social–psychological underpinnings of migration attitudes (Verkuyten, Mepham, and Kros Reference Verkuyten, Mepham and Kros2018) and to our understanding of the generalizability of models of migration attitudes (Hainmueller and Hopkins Reference Hainmueller and Hopkins2014). Second, climate migration attitudes are distinct from belief in anthropogenic climate change or support for climate action (Arias and Blair Reference Arias and Blair2022). By studying attitudes on climate migration, mitigation, and science in one setting, this article helps clarify common causes of these beliefs. This effort is important for crafting general theories of climate attitudes, which requires integrating research about climate change beliefs with broader attention to perceptions of climate change’s human impacts (Hornsey et al. Reference Hornsey, Harris, Bain and Fielding2016).
Third, our analyses bear on a larger literature on disaster exposure and retrospection, which considers whether citizens respond rationally to exogenous phenomena like hurricanes (e.g., Gasper and Reeves Reference Gasper and Reeves2011; Heersink, Peterson, and Jenkins Reference Heersink, Peterson and Jenkins2017). If people are reflexively influenced by events beyond politicians’ control, “blind” retrospection might short-circuit democratic accountability (Achen and Bartels Reference Achen and Bartels2016; Busby, Druckman, and Fredendall Reference Busby, Druckman and Fredendall2017), incentivizing politicians to eschew optimal policies (Bechtel and Hainmueller Reference Bechtel and Hainmueller2011; Healy and Malhotra Reference Healy and Malhotra2009). Existing scholarship offers relevant evidence on myopia in climate change mitigation (Stokes Reference Stokes2016) and adaptation policymaking (Anderson, DeLeo, and Taylor Reference Anderson, DeLeo and Taylor2023; Bechtel and Mannino Reference Bechtel and Mannino2021) but has not considered climate migration. We offer new evidence on citizens’ responses to climate displacement following disasters—responses that shape policies on preparedness, relief, and integration.
To assess the causal effect of disaster exposure on attitudes toward climate migration and climate change, we leverage a preregistered, difference-in-differences design enabled by Hurricane Ian. Ian made landfall in Florida on September 28, 2022, and caused mass devastation. The storm was the third costliest disaster in U.S. history, killing 155 people, displacing more than 50,000, and causing $113 billion in damages (Krieger Reference Krieger2022).Footnote 2 Hurricane Ian interrupted a high-frequency survey we fielded in Florida, Louisiana, Texas, and North Carolina between August 11 and October 28, 2022. Pairing our representative survey with remotely sensed, climatological microdata, we estimate the causal effect of Hurricane Ian on five main outcomes: (1) the salience and importance of climate migration, (2) support for policies to assist climate migrants, (3) the salience and importance of climate change, (4) support for policies to address climate change, and (5) climate science beliefs. We also fielded a follow-up survey in March 2023 to probe the durability of Hurricane Ian’s impacts.
We document several important findings. First, hurricane exposure heightened the salience of climate migration and support for policies to assist climate migrants. In severely impacted counties, these positive effects lasted at least 1 month and cross-cut partisanship, gender, education, age, and other important correlates of climate attitudes. Second, hurricane exposure increased the perceived importance of and willingness to tackle climate change. Respondents in hard-hit areas became more supportive of costly policies for climate adaptation and mitigation. Evidence from voting on climate-related ballot initiatives in Florida corroborates our attitudinal findings. Third, hurricane exposure increased belief in climate science, including acknowledgement of climate change’s anthropogenic causes and link to hurricanes. Fourth, the effects of hurricane exposure were short-lived. A survey 6 months after Hurricane Ian revealed no persistent effects. This suggests that while disasters may open brief windows for climate action, they are unlikely to mobilize durable shifts.
This research article thus makes three major contributions to the broader literature. First, we offer the only evidence that climate disasters mobilize support for policies to address climate migration. Shifting attention to climate displacement is of critical importance since its near-term scale is large and the microfoundations of public opinion on climate migration are poorly understood (Arias and Blair Reference Arias and Blair2022; Spilker et al. Reference Spilker, Nguyen, Koubi and Böhmelt2020). By demonstrating the mobilizing effect of climate disasters on climate migration beliefs, this article extends findings from other settings about how personal and familial trauma can mobilize prosocial migration attitudes (Hartman and Morse Reference Hartman and Morse2020; Williamson et al. Reference Williamson, Adida, Lo, Platas, Prather and Werfel2021). Our evidence is consistent with a political–psychological model of attitude formation based on visceral experiences that has only recently been applied in climate scholarship (Egan and Mullin Reference Egan and Mullin2012; Reference Egan and Mullin2017). Our findings also suggest citizens respond rationally to disasters, increasing political pressure to address the causes and consequences of extreme climatic events through sensible policymaking (Ashworth, de Mesquita, and Friedenberg Reference Ashworth, de Mesquita and Friedenberg2018; Gasper and Reeves Reference Gasper and Reeves2011), at least in the short term. Second, we study the consequences of disasters in a hard case—the American South—which is at severe risk from climate change but remains a bastion of climate-skeptic, anti-migrant politics. Studying the impact of hurricanes in a setting where climate skepticism intersects with migration opposition illuminates key barriers to and possibilities for climate migration policymaking. Third, by leveraging a preregistered, quasi-experimental design, we contribute causal evidence about the effect of climate disasters on climate beliefs.Footnote 3 This is important because mixed evidence on the consequences of climate change for political attitudes and behavior owes largely to measurement differences across studies (Howe et al. Reference Howe, Marlon, Mildenberger and Shield2019). Credible research designs are needed to identify viable pathways for pro-climate policymaking and coalition-building.
PUBLIC OPINION ON CLIMATE CHANGE
Existing research identifies three major correlates of climate attitudes: demographics, risk perceptions, and personal experiences (Egan and Mullin Reference Egan and Mullin2017; Hornsey et al. Reference Hornsey, Harris, Bain and Fielding2016). In addition to shaping individual perceptions about climate mitigation, these factors also affect whether and how individuals attribute extreme weather to the effects of climate change (Ogunbode et al. Reference Ogunbode, Demski, Capstick and Sposato2019). Among the U.S. public, partisanship, education, and gender are the strongest demographic predictors of climate beliefs. The effect of partisanship is unsurprising given polarization of elite rhetoric and trust in science (McCright and Dunlap Reference McCright and Dunlap2011). Numerous studies show liberals are more supportive of climate change mitigation (Boudet et al. Reference Boudet, Giordono, Zanocco, Satein and Whitley2020; Hazlett and Mildenberger Reference Hazlett and Mildenberger2020). Similarly, women (Bush and Clayton Reference Bush and Clayton2023; Leiserowitz Reference Leiserowitz2006) and better-educated individuals (Hornsey et al. Reference Hornsey, Harris, Bain and Fielding2016) are more likely to believe in climate change and support mitigation.
Beyond demographics, risk perceptions—subjective judgments of threat—also influence climate attitudes. Given the long-standing, diffuse threat posed by climate change, values and worldviews powerfully shape climate risk perceptions (Leiserowitz Reference Leiserowitz2006). For instance, people who value hierarchical social organization are less supportive of climate mitigation (Hornsey et al. Reference Hornsey, Harris, Bain and Fielding2016). Likewise, empaths are more supportive of addressing climate displacement (Arias and Blair Reference Arias and Blair2022). Beyond affect, risk perceptions are also shaped by geographic vulnerability and personal experiences. In particular, experiences of extreme weather are associated with increasing belief in climate change (Bergquist and Warshaw Reference Bergquist and Warshaw2019; Brody et al. Reference Brody, Zahran, Vedlitz and Grover2008; Howe et al. Reference Howe, Marlon, Mildenberger and Shield2019; Sambrook et al. Reference Sambrook, Konstantinidis, Russell and Okan2021). In this article, we focus on the attitudinal consequences of Hurricane Ian.
Attitudinal Consequences of Climate Disasters
How do experiences with the effects of climate change—such as extreme weather and climate disasters—affect climate attitudes? A large literature on this question yields mixed findings (Howe et al. Reference Howe, Marlon, Mildenberger and Shield2019); however, on balance most evidence suggests exposure to climate disasters increases climate concern and support for pro-climate policies.
For one, experiences of climate disasters underscore the high costs of climate change for affected populations. By concretizing otherwise abstract risks (Konisky, Hughes, and Kaylor Reference Konisky, Hughes and Kaylor2016; Weber Reference Weber2006), extreme storms and disasters focus attention on the dire and immediate consequences of unmitigated warming. Put differently, through direct personal experience, beliefs about climate change and its associated costs become more certain. In this way, physical vulnerability to the effects of climate change increases climate risk perceptions (Brody et al. Reference Brody, Zahran, Vedlitz and Grover2008).
The occurrence of extreme weather can also prime climate-related issues, increasing their salience in individuals’ minds (Zanocco et al. Reference Zanocco, Boudet, Nilson, Satein, Whitley and Flora2018) and broader public discourse (Boudet et al. Reference Boudet, Giordono, Zanocco, Satein and Whitley2020). By forcing people to reflect on the consequences of climate change and anchoring peoples’ perceptions of those consequences to their own lived experiences, climate disasters may foster pro-climate opinion. Exposure to diverse disasters—including wildfires (Hazlett and Mildenberger Reference Hazlett and Mildenberger2020), heat waves (Egan and Mullin Reference Egan and Mullin2012), floods (Demski et al. Reference Demski, Capstick, Pidgeon, Sposato and Spence2017), and hurricanes (Bergquist, Nilsson, and Wesley Schultz Reference Bergquist, Nilsson and Wesley Schultz2019; Sloggy et al. Reference Sloggy, Suter, Rad, Manning and Goemans2021)—fosters belief in and support for mitigating climate change. Individuals without direct experiences of climate disasters but who reside in climate-vulnerable localities also become more supportive of climate mitigation as a result of their physical proximity to climate-related threats (Bergquist and Warshaw Reference Bergquist and Warshaw2019; Brody et al. Reference Brody, Zahran, Vedlitz and Grover2008).
Nor does personal experience with climate disasters only affect climate attitudes; research also finds that climate disasters shape political behavior. For example, floods (Spence et al. Reference Spence, Poortinga, Butler and Pidgeon2011) and smog (Whitmarsh Reference Whitmarsh2008) increase engagement in climate mitigation actions like energy saving. Recent work further suggests that exposure to climate disasters increases the likelihood of voting for pro-environmental candidates, parties, and ballot initiatives (Hazlett and Mildenberger Reference Hazlett and Mildenberger2020; Visconti Reference Visconti2022). For instance, 2021 floods in Germany increased voting for the Green Party (Garside and Zhai Reference Garside and Zhai2022).
To be sure, the consequences of extreme weather for climate attitudes are not wholly positive. The impacts of disasters are often substantively small (Hornsey et al. Reference Hornsey, Harris, Bain and Fielding2016; Whitmarsh Reference Whitmarsh2008). In addition, public support for mitigation after climate disasters may not translate to decisive policy action (Rowan Reference Rowan2023). Numerous obstacles inhibit climate policymaking despite broad favorability, including concentrated opposition from cost-bearing populations (Gaikwad, Genovese, and Tingley Reference Gaikwad, Genovese and Tingley2022; Stokes Reference Stokes2016), national legislative gridlock (Anderson, DeLeo, and Taylor Reference Anderson, DeLeo and Taylor2023), and biased media (Molder and Calice Reference Molder and Calice2023). In the United States, partisanship also exerts an important moderating effect on the relationship between disaster exposure and climate attitudes. Boudet et al. (Reference Boudet, Giordono, Zanocco, Satein and Whitley2020) and Hazlett and Mildenberger (Reference Hazlett and Mildenberger2020) find that climate disasters exert a greater pro-environment effect in Democratic areas, where preexisting public opinion is more supportive of mitigation. Indeed, disasters may even prompt an anti-climate backlash if partisan-motivated reasoning leads citizens to reject politicians’ subsequent pro-climate appeals (Hai and Perlman Reference Hai and Perlman2022). Still, meta-analytic evidence suggests that exposure to extreme weather generally mobilizes pro-climate attitudes (Howe et al. Reference Howe, Marlon, Mildenberger and Shield2019).
Retrospection after Climate Disasters
Positive effects of exposure to extreme weather on pro-climate attitudes are consistent with a rational, Bayesian updating process. People form climate opinions on the basis of probabilistic judgments about whether prevailing climatic phenomena reflect normal conditions or anthropogenic warming (Deryugina Reference Deryugina2013). Through this process, extreme weather increases mass concern and attribution of disasters to climate change rather than natural meteorological patterns (Akerlof et al. Reference Akerlof, Maibach, Fitzgerald, Cedeno and Neuman2013). Retrospection—the ability to recall, evaluate, and change beliefs and behavior accordingly—underpins this process.
Retrospective evaluation in the wake of climate disasters has important implications for disaster relief and preparedness, democratic accountability, and our understanding of voter rationality. For one, disasters often spur affected communities to reflect on policymakers’ broader performance. Because disaster response is informative about incumbent quality (Ashworth, de Mesquita, and Friedenberg Reference Ashworth, de Mesquita and Friedenberg2018), rational publics regard climate disasters as politically relevant and act to reward or punish politicians on the basis of their post-storm actions. For example, voters only punish incumbents for controllable disaster damage (Healy and Malhotra Reference Healy and Malhotra2010) and pay close attention to mitigatory policy responses and politicians’ defined roles when attributing responsibility (Gasper and Reeves Reference Gasper and Reeves2011).Footnote 4 Recovery is a natural priority for victims engaged in rational updating after climate disasters. However, a myopic, short-term focus on post-disaster relief can distort long-run climate policymaking. Greater electoral rewards for relief than preparedness undercut political incentives for investment in climate policies that could reduce disaster incidence (Healy and Malhotra Reference Healy and Malhotra2009). Potentially durable effects of post-disaster assistance on incumbent support, which stem from lingering voter gratitude, exacerbate this short-sighted focus on relief over readiness (Bechtel and Hainmueller Reference Bechtel and Hainmueller2011). Still, climate disasters should mobilize pro-environment attitudes and beliefs if affected individuals engage in rational (albeit myopic) retrospection in their aftermath.
A competing perspective pioneered by Achen and Bartels (Reference Achen and Bartels2016) suggests that people engage in “blind” retrospection, irrationally punishing politicians for events—like droughts, shark attacks, and unexpected sporting losses—beyond their control.Footnote 5 More specifically, by worsening individuals’ moods and subjective well-being (Busby, Druckman, and Fredendall Reference Busby, Druckman and Fredendall2017) and inducing post-traumatic stress (Marsh Reference Marsh2023), climate disasters can provoke unwarranted backlash against policies and policymakers misattributed as responsible. For instance, following the 1927 Mississippi Flood, President Hoover suffered a large decrease in voteshare in inundated counties, despite distributing substantial post-disaster aid (Heersink, Peterson, and Jenkins Reference Heersink, Peterson and Jenkins2017).Footnote 6 Weak (Hornsey et al. Reference Hornsey, Harris, Bain and Fielding2016; Whitmarsh Reference Whitmarsh2008) or demobilizing consequences (Hai and Perlman Reference Hai and Perlman2022) of climate disasters on climate attitudes could reflect “blind” retrospection, since rational disaster victims should support stronger climate mitigation efforts.
Recency Bias and Effect Persistence
How long-lasting are the effects of climate disasters on climate attitudes? Scholars on both sides of the rational versus “blind” retrospection debate argue that effects are likely to be short-lived. For example, Achen and Bartels (Reference Achen and Bartels2016, 136) suggest that “whatever the voters learn in natural disasters has a very short half-life.” Expectations of short-term effects reflect a more general human tendency known as recency bias—a systematic propensity to discount older information. Because making judgments about abstract, slow-moving phenomena like climate change is cognitively taxing, people rely on heuristics to simplify opinion formation (Kahneman, Slovic, and Tversky Reference Kahneman, Slovic and Tversky1982). Placing a premium on new, salient experiences and information when making judgments is one common heuristic with ample observational (Arndt, Jensen, and Wenzelburger Reference Arndt, Jensen and Wenzelburger2021) and experimental support (Fudenberg and Peysakhovich Reference Fudenberg and Peysakhovich2014). For instance, studies of economic voting (Healy and Lenz Reference Healy and Lenz2014; Nordhaus Reference Nordhaus1975) and political communication (Chong and Druckman Reference Chong and Druckman2010) reveal the primacy of recent over chronologically distant conditions in attitude formation. Unsurprisingly, pro-climate attitudinal effects of climate disasters typically decay within a matter of weeks or months (Egan and Mullin Reference Egan and Mullin2012; Konisky, Hughes, and Kaylor Reference Konisky, Hughes and Kaylor2016).Footnote 7 In rare cases where effects appear durable, persistence is attributable to disaster relief and voter gratitude (Bechtel and Hainmueller Reference Bechtel and Hainmueller2011).Footnote 8 This may give incumbent politicians long-term electoral advantages among disaster-victimized populations but is unlikely to mobilize lasting pro-climate opinion.
CLIMATE DISASTERS AND CLIMATE MIGRATION
While much academic and policy attention is paid to public opinion on migration (Hainmueller and Hopkins Reference Hainmueller and Hopkins2014) and climate change generally (Egan and Mullin Reference Egan and Mullin2017), little work considers public opinion on climate displacement.Footnote 9 To be sure, interdisciplinary scholars have recognized important dynamics related to climate migration. Lawyers have theorized how climate migrants could be integrated into migration conventions (McAdam Reference McAdam2012), and political theorists have weighed moral obligations states have vis-à-vis the climate-displaced (Draper Reference Draper2022). Likewise, economists and demographers have studied the effects of climate change on migration (Hunter, Luna, and Norton Reference Hunter, Luna and Norton2015), and conflict scholars have examined tensions between climate migrants and hosts (Bhavnani and Lacina Reference Bhavnani and Lacina2015; Koubi et al. Reference Koubi, Böhmelt, Spilker and Schaffer2018).Footnote 10 However, systematic analyses of public opinion on climate-induced migration are rare. In particular, we offer—to the best of our knowledge—the first study on how climate disasters affect attitudes on climate migration. This is crucial because environmental disasters are the leading cause of climate-related displacement globally and because public opinion on climate migrants is central to understanding the prospects for their integration in receiving communities (Obokata, Veronis, and McLeman Reference Obokata, Veronis and McLeman2014).
Climate Migration Attitudes
As discussed above, large literatures study public attitudes on climate change (e.g., Egan and Mullin Reference Egan and Mullin2017) and migration (e.g., Hainmueller and Hopkins Reference Hainmueller and Hopkins2014), though specific attitudes on climate migration are less well understood, particularly in the U.S. case.Footnote 11 This represents an important gap because attitudes about climate migration are distinct from belief in anthropogenic climate change or support for climate mitigation (Arias and Blair Reference Arias and Blair2022). For instance, Helbling (Reference Helbling2020) finds similar levels of support for climate migrants among climate-skeptic and environmentalist-minded individuals. This implies a difference between climate migration attitudes and broader views on climate science.
Extending classical models from migration scholarship, prominent research expects mass opposition to climate migrants (Marotzke, Semmann, and Milinski Reference Marotzke, Semmann and Milinski2020).Footnote 12 According to this perspective, public hostility is motivated by hosts’ egocentric concerns about labor market and welfare competition with the climate-displaced (McIntosh Reference McIntosh2008) or sociotropic concerns about migrants’ impacts on receiving communities’ broader cultural and economic well-being (Bhavnani and Lacina Reference Bhavnani and Lacina2015; Hopkins Reference Hopkins2012). An emerging counter-perspective emphasizes how humanitarian considerations (Bansak, Hainmueller, and Hangartner Reference Bansak, Hainmueller and Hangartner2016), and especially perceptions of responsibility (Verkuyten, Mepham, and Kros Reference Verkuyten, Mepham and Kros2018), shape migration attitudes. Arias and Blair (Reference Arias and Blair2022) find broad public favorability toward internal and international climate migrants and show that this positive view is rooted in mass perceptions that climate migrants are involuntarily displaced. Because the disasters that cause climate displacement are beyond their control, people fleeing these disasters are viewed as deserving of empathy and support.
THEORY
We draw on this latter account and wed it with insights from aforementioned scholarship on the attitudinal effects of disaster exposure to understand how climate disasters shape climate migration attitudes, in addition to general climate beliefs.Footnote 13 We specifically consider exposure and attitudes in the context of Hurricane Ian. Though prior studies have examined a variety of climatic events, relatively little work considers hurricanes (but see Bergquist, Nilsson, and Wesley Schultz Reference Bergquist, Nilsson and Wesley Schultz2019; Sloggy et al. Reference Sloggy, Suter, Rad, Manning and Goemans2021). This is important because individuals respond differently to different types of climatic phenomena (Howe et al. Reference Howe, Marlon, Mildenberger and Shield2019). Moreover, hurricanes are the leading cause of internal climate displacement in the United States.
We argue that personal experiences with climate disasters like hurricanes sharpen risk perceptions and make climate change’s impacts more concrete. While climate migration and climate change are conceptually abstract, hurricanes are tangible. Because hurricanes create substantial migratory pressures, they are particularly likely to spur mass evaluations of climate displacement. People in the path of the storm must weigh the costs and risks of fleeing versus remaining, while those in storm-adjacent regions must consider how their communities will respond to potential local influxes of climate-displaced individuals (Hopkins Reference Hopkins2012).
Empathy undergirds favorability toward climate migrants (Arias and Blair Reference Arias and Blair2022), and personal exposure to displacement-inducing storms is particularly likely to stimulate empathic perspective-taking. In much the way that displacement experiences mobilize pro-social refugee attitudes (Hartman and Morse Reference Hartman and Morse2020; Williamson et al. Reference Williamson, Adida, Lo, Platas, Prather and Werfel2021), we expect hurricane victims to reflect on their disaster experiences and become more supportive of policies to benefit climate migrants. Importantly, a mobilizing effect of hurricanes on climate migration attitudes is also consistent with rational retrospection. After disasters, victims in climate-affected regions should be more conscious of future climate displacement-related risks and hence more supportive of ameliorative policies.Footnote 14
H1: Hurricane exposure increases public support for policies to address climate-driven migration.
While Americans’ broader climate opinion is sticky (McCright and Dunlap Reference McCright and Dunlap2011), we argue that personal experiences with hurricanes should also shock these attitudes, increasing support for climate mitigation and belief in anthropogenic climate change. Hurricanes represent a salient manifestation of the risks posed by unmitigated global warming. The severe damage they cause should concretize the high relative costs of climate change for individuals exposed. Rational voters in climate-affected communities should also reward mitigatory policies that reduce the effects of climate change (Gasper and Reeves Reference Gasper and Reeves2011) and especially the risks of future hurricanes.
H2: Hurricane exposure increases public support for climate change mitigation and adaptation policies, and belief in climate science.
While we did not preregister hypotheses about the durability of these effects, literature on recency bias (e.g., Arndt, Jensen, and Wenzelburger Reference Arndt, Jensen and Wenzelburger2021; Nordhaus Reference Nordhaus1975) suggests attitudinal consequences of Hurricane Ian are likely to decay quickly. We offer exploratory evidence on this question.
A QUASI-EXPERIMENT ON HURRICANE EXPOSURE
To test our theory, we administered a preregistered survey on Lucid—a well-known, online platform (Coppock and McClellan Reference Coppock and McClellan2019)—during 2022’s Atlantic hurricane season.Footnote 15 Our survey targeted four states most vulnerable to hurricanes: Florida, Louisiana, Texas, and North Carolina.Footnote 16 We used quota sampling to obtain a respondent pool from these states that approximates the adult population of the United States with respect to census benchmarks for race, ethnicity, gender, and age (Table SI-1).Footnote 17 Given this design, effects may not generalize to the U.S. population as a whole. Still, this particular sample is interesting and important: individuals in the focal states are swing voters cross-pressured by climate change and migration. This makes ours a hard case in which to detect positive effects of hurricane exposure on climate opinion.
From August 11 to October 28, 2022, we fielded a weekly, cross-sectional survey ( $ \approx $
250 respondents) across these states.Footnote 18 This time frame represents the historically most active period of hurricane season, and we (correctly) anticipated that our survey would be interrupted by a storm. Over the study’s duration, we captured 3,202 respondents geolocated to the four states of interest. Following our preregistration plan, we filtered out respondents who finished in the top and bottom deciles of survey duration or who reported ages less than 18 or greater than 99. This left a final sample of 2,563 respondents. Figure 1 maps the distribution of these respondents.
$ \approx $
250 respondents) across these states.Footnote 18 This time frame represents the historically most active period of hurricane season, and we (correctly) anticipated that our survey would be interrupted by a storm. Over the study’s duration, we captured 3,202 respondents geolocated to the four states of interest. Following our preregistration plan, we filtered out respondents who finished in the top and bottom deciles of survey duration or who reported ages less than 18 or greater than 99. This left a final sample of 2,563 respondents. Figure 1 maps the distribution of these respondents.
Geographic Distribution of Survey Respondents
Note: The dashed red line marks Hurricane Ian’s eyepath.

We also fielded an exploratory, follow-up survey from March 7–10, 2023. This follow-up was administered using the same specifications as the original survey and was designed to measure the durability of Hurricane Ian’s impacts. In the follow-up wave, we captured 847 new respondents geolocated to the focal states. Applying the same filters on duration and age from the main sample gave a final follow-up sample of 715 respondents (Figure A-12).
In our surveys, respondents were first asked a demographic battery to gather information on relevant traits and beliefs. Subsequently, outcome variables were measured, with question order randomized across respondents. Section SI-9 reports the questionnaire. We study 27 items (Table 1) related to seven focal concepts of interest: (1) issue importance of climate migration (Cronbach’s $ \alpha $
= 0.57); (2) policy action on climate migration (
$ \alpha $
= 0.57); (2) policy action on climate migration ( $ \alpha $
= 0.74); (3) issue importance of climate change (
$ \alpha $
= 0.74); (3) issue importance of climate change ( $ \alpha $
= 0.72); (4) policy action on climate change (
$ \alpha $
= 0.72); (4) policy action on climate change ( $ \alpha $
= 0.76); (5) climate mitigation policies (
$ \alpha $
= 0.76); (5) climate mitigation policies ( $ \alpha $
= 0.90); (6) climate adaptation policies (
$ \alpha $
= 0.90); (6) climate adaptation policies ( $ \alpha $
= 0.90); and (7) belief in climate science (
$ \alpha $
= 0.90); and (7) belief in climate science ( $ \alpha $
= 0.70). For each concept, we asked three to five questions designed to elicit theoretically relevant opinions.Footnote 19 As specified in our pre-analysis plan, we combined related items into summary indices, which organize our findings and reduce multiple inference concerns. Each index is the average of standardized outcomes weighted by the inverse covariance matrix (Anderson Reference Anderson2008).Footnote 20 Cronbach’s
$ \alpha $
= 0.70). For each concept, we asked three to five questions designed to elicit theoretically relevant opinions.Footnote 19 As specified in our pre-analysis plan, we combined related items into summary indices, which organize our findings and reduce multiple inference concerns. Each index is the average of standardized outcomes weighted by the inverse covariance matrix (Anderson Reference Anderson2008).Footnote 20 Cronbach’s $ \alpha $
(reported above) and principal component analyses (Table A-5) confirm our indices are reliable and unidimensional.
$ \alpha $
(reported above) and principal component analyses (Table A-5) confirm our indices are reliable and unidimensional.
Coding of Dependent Variables

Note: We measure respondent agreement with constituent item statements. We then aggregate these responses into corresponding indices using inverse covariance-weighting. Items are theoretically linked to corresponding, indexed concepts. Principal component analyses lend confidence to the theoretically motivated categorization scheme we employ by confirming items load on a common dimension.
Our survey did not include an experimental manipulation. Rather, we leverage a quasi-experiment posed by Hurricane Ian, which made landfall in Florida on September 28, 2022. Because the storm’s exact track and severity were determined by meteorological conditions, Ian constitutes a plausibly exogenous shock to attitudes. Balance and equivalence tests (Figures A-1 and A-2) bolster this claim, revealing few demographic differences between hurricane-exposed and unaffected respondents. These tests offer encouraging evidence against selective attrition, for instance, as a result of differential, hurricane-induced out-migration.Footnote 21
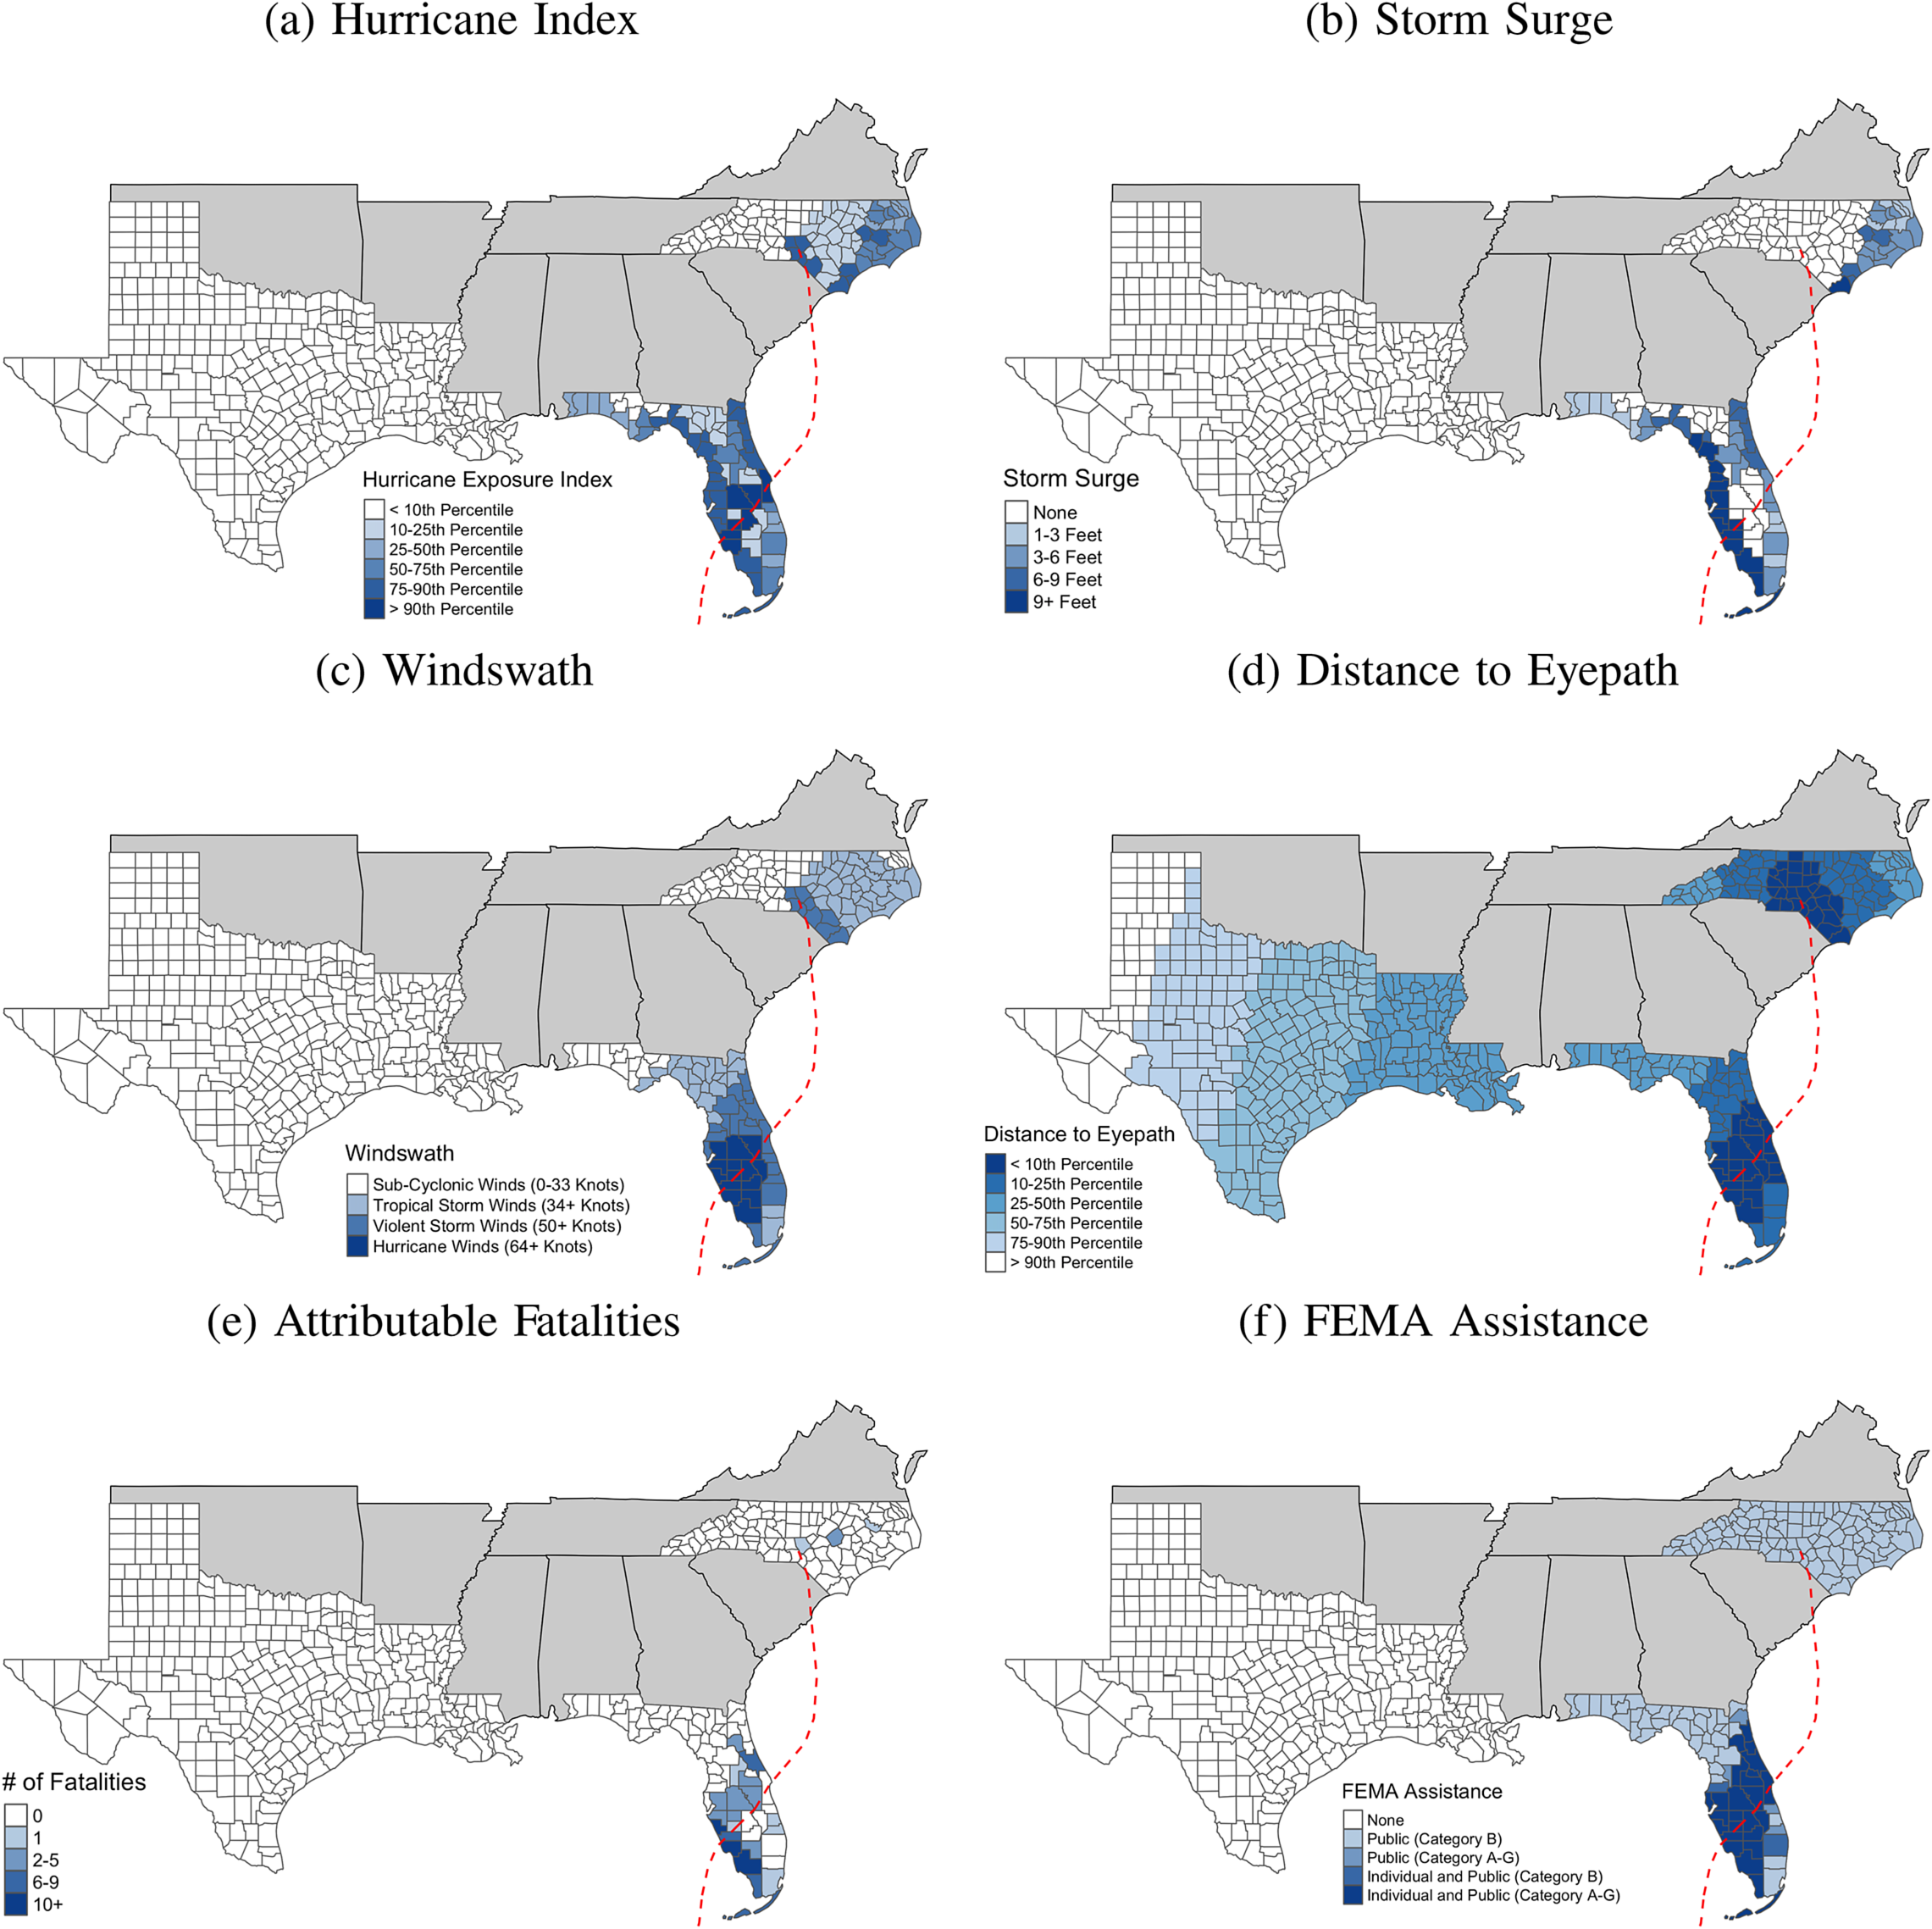
We define hurricane exposure at the county level using microdata on Ian’s eyepath, windswath, and storm surge (Figure 2), which we combine into an index.Footnote 22 We validate our exposure index in Figure 3, which shows our measure is highly correlated with self-reported hurricane exposure but not exposure to other climate disasters. A one-standard-deviation (sd) increase in exposure to Hurricane Ian increased self-reports of hurricane experience by 16–19 percentage points (pp). We also confirm that our hurricane exposure measure is associated with personal familiarity with hurricane-induced displacement (Table SI-4). After Hurricane Ian, respondents in affected counties became 3.2 pp more likely to report knowing someone who had moved because of a hurricane.
Mapping Hurricane Ian
Note: In panel (a), bins represent percentiles of the hurricane exposure index for values greater than the minimum of the index. The dashed red line marks the eyepath of Hurricane Ian.
Validating the Hurricane Exposure Measure
Note: Bars are 90% and 95% confidence intervals. Exposure is a continuous, z-standardized index combining information on Hurricane Ian’s eyepath, windswath, and storm surge. Estimations include covariates from Table 2. The dashed red line marks 0. Full tabular results are in Tables SI-2 and SI-3.

Our difference-in-differences approach compares respondent attitudes in exposed and unexposed counties before and after landfall. The identifying assumption is that in the absence of Hurricane Ian, exposed and unaffected counties would experience common trends in outcomes. In Figures SI-1, SI-2, and A-3, we provide graphical evidence of parallel pre-trends in event studies. That outcomes are consistently parallel in the pretreatment period builds confidence in the design. Formally, we estimate a least-squares equation:
 $$ {Y}_{i,c,t}={\displaystyle \begin{array}{l}{\alpha}_c+{\beta}_t+\delta \left({\mathrm{Hurricane}\ \mathrm{Exposure}}_c\right)\times \left({\mathrm{Post}}_t\right)\\ {}+\hskip2px \gamma \left({X}_i\right)+\epsilon, \end{array}} $$
where i indexes respondents, c indexes counties, and t indexes the survey date. $ {Y}_{i,c,t} $
are climate attitudes,
$ {Y}_{i,c,t} $
are climate attitudes, $ {\alpha}_c $
are county fixed effects,
$ {\alpha}_c $
are county fixed effects, $ {\beta}_t $
are date fixed effects, and
$ {\beta}_t $
are date fixed effects, and $ {X}_i $
is a vector of individual-level covariates. We interact
$ {X}_i $
is a vector of individual-level covariates. We interact $ {\mathrm{Hurricane}\ \mathrm{Exposure}}_c $
, a time-invariant measure of county-level storm severity, with
$ {\mathrm{Hurricane}\ \mathrm{Exposure}}_c $
, a time-invariant measure of county-level storm severity, with $ {\mathrm{Post}}_t $
, an indicator for dates on or after landfall. Constitutive terms of the interaction do not appear separately because they are fully absorbed by county and time fixed effects. The coefficient
$ {\mathrm{Post}}_t $
, an indicator for dates on or after landfall. Constitutive terms of the interaction do not appear separately because they are fully absorbed by county and time fixed effects. The coefficient $ \delta $
captures the extent to which Hurricane Ian induced a differential change in attitudes in exposed counties relative to counties unaffected by Hurricane Ian. This estimate represents the causal effect of Hurricane Ian on climate attitudes.
$ \delta $
captures the extent to which Hurricane Ian induced a differential change in attitudes in exposed counties relative to counties unaffected by Hurricane Ian. This estimate represents the causal effect of Hurricane Ian on climate attitudes. $ \epsilon $
are heteroskedasticity-robust, county-clustered standard errors. Estimates are scaled using sampling weights.Footnote 23
$ \epsilon $
are heteroskedasticity-robust, county-clustered standard errors. Estimates are scaled using sampling weights.Footnote 23
RESULTS
Our survey returns a rich set of results, which corroborate our core expectations. In Table 2, we present the main findings across our seven focal outcomes. The hurricane exposure index and all outcome indices are z-standardized, so effects are readily interpretable as standard deviation shifts. We observe large, distinguishable positive effects of hurricane exposure on pro-climate attitudes. All covariates are in the expected direction, increasing confidence in our specifications. Moreover, the effects of hurricane exposure we document are substantively important compared with demographic traits known to shape Americans’ climate attitudes, like partisanship, education, age, and gender.
Hurricane Exposure and Climate Attitudes
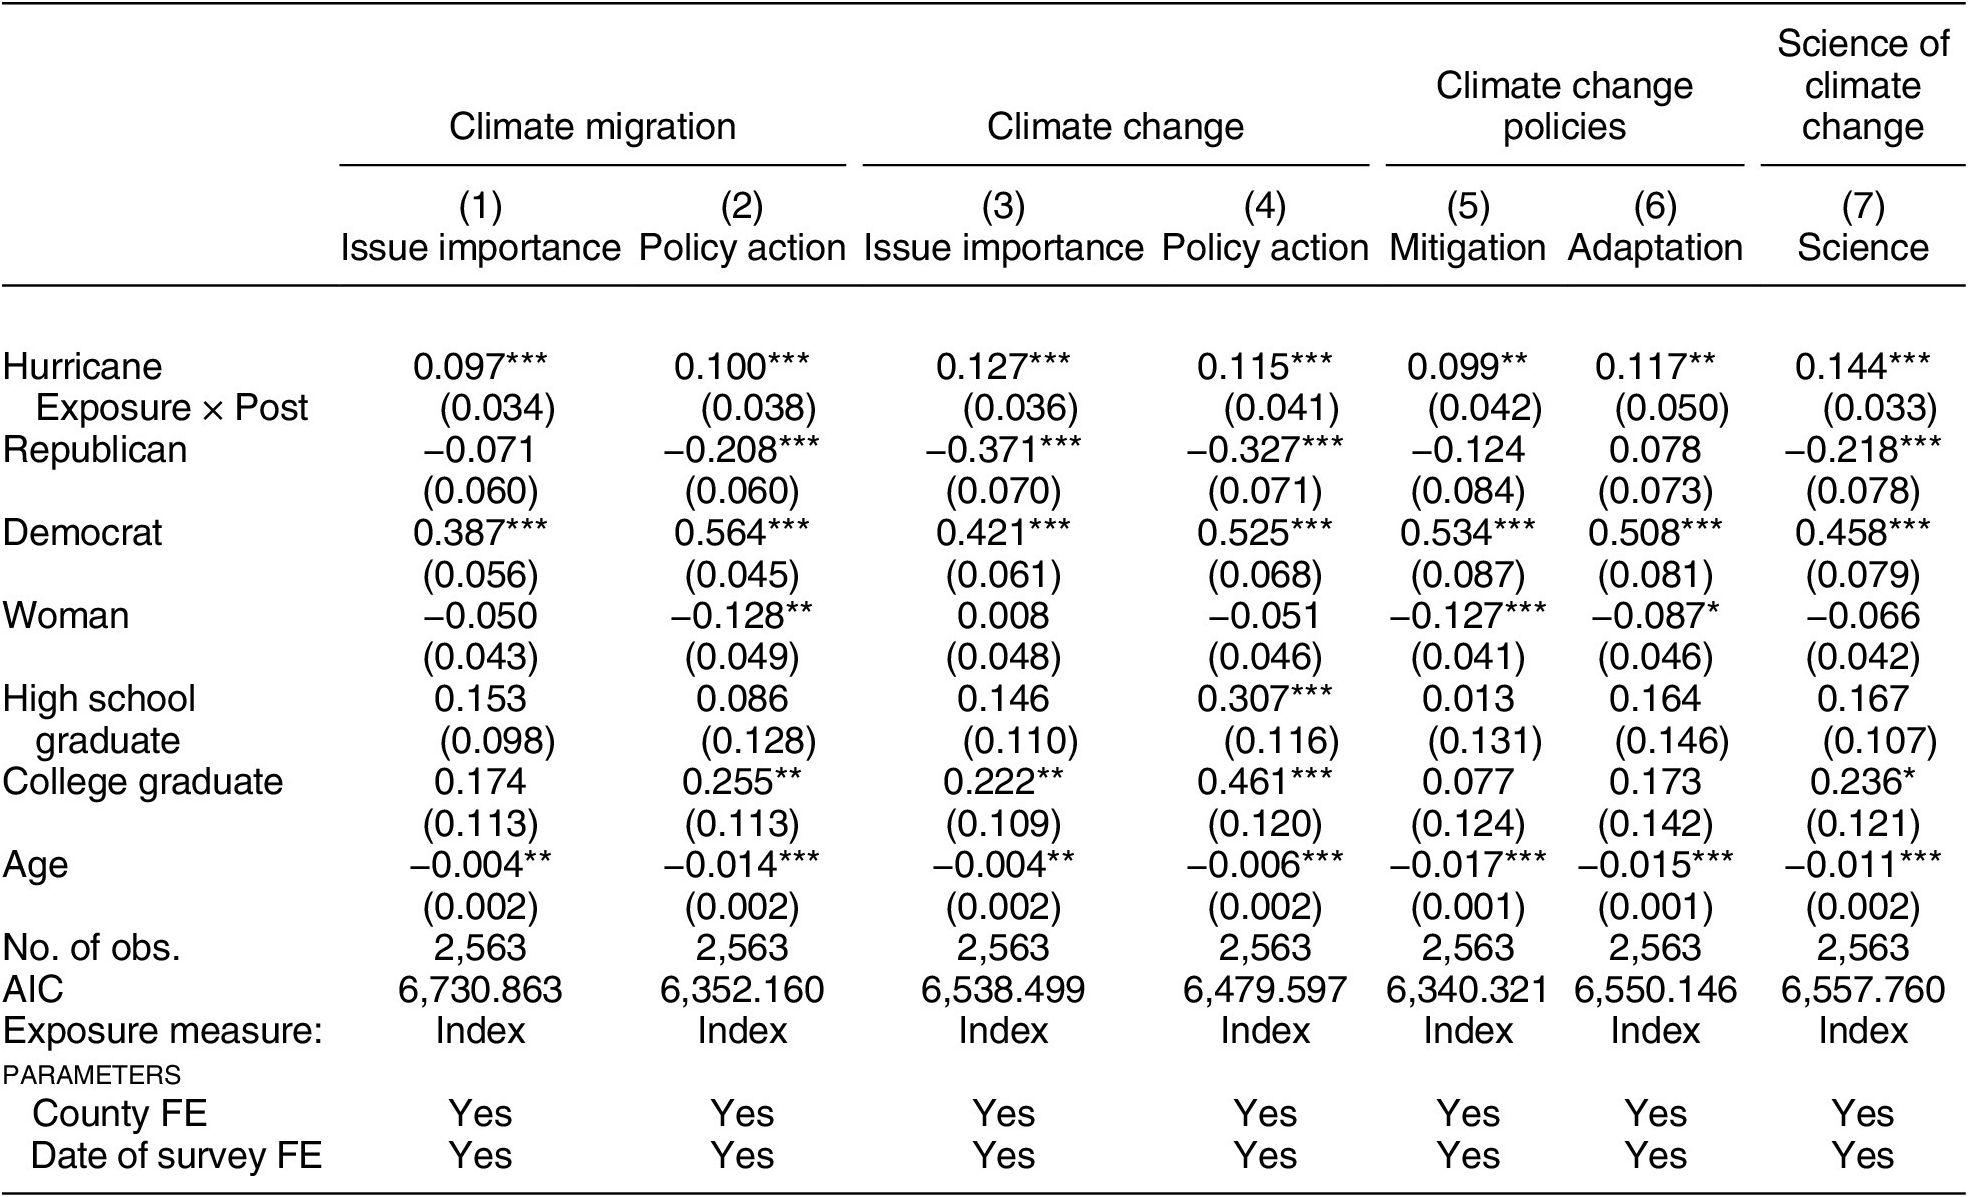
Note: Robust, county-clustered standard errors are in parentheses. Post is an indicator for all dates on or after September 28, 2022, when Hurricane Ian made landfall. Exposure is a continuous, z-standardized index combining information on Ian’s eyepath, windswath, and storm surge. Estimates are scaled using sampling weights. * $ p<0.10 $
, **
$ p<0.10 $
, ** $ p<0.05 $
, ***
$ p<0.05 $
, *** $ p<0.01 $
.
$ p<0.01 $
.
Results in columns 1 and 2 bear on Hypothesis 1—the effect of hurricane exposure on climate migration attitudes. We estimate that a one-standard-deviation increase in exposure to Hurricane Ian increased the perceived issue importance of climate migration (0.097 sd), and endorsement of policy action to support climate migrants (0.1 sd). In the 10 most-affected counties in our sample—home to 3.3-million swing voters in two electorally important states—respondents’ perceived issue importance of and support for policy action on climate migration increased nearly one-third of a standard deviation after Hurricane Ian, relative to respondents in unaffected counties.Footnote 24 Demographic covariates can also help us interpret the substantive importance of Hurricane Ian. Intuitively, Democrats attach more importance to climate migration (0.387 sd) and are more supportive of policy action to assist climate migrants (0.564 sd). These estimates accord with ample evidence on Democrats’ pro-climate (Egan and Mullin Reference Egan and Mullin2017) and pro-migrant attitudes (Hainmueller and Hopkins Reference Hainmueller and Hopkins2014). Hurricane Ian’s impact on climate migration beliefs is substantively meaningful given the importance of party identification—the storm’s effect was 17%–25% as large as the effect of Democratic partisanship.
In columns 3–7, we test Hypothesis 2, examining broader climate attitudes. Consistent with work documenting a positive impact of climate disasters on support for climate action (e.g., Bergquist and Warshaw Reference Bergquist and Warshaw2019; Egan and Mullin Reference Egan and Mullin2012), we find that a one-standard-deviation increase in exposure to Hurricane Ian increased the perceived importance of climate change (0.127 sd) and support for climate policy action (0.115 sd). In terms of specific climate policies, Ian mobilized support for mitigation (0.099 sd) and adaptation measures (0.117 sd). We also find that a one-standard-deviation increase in storm exposure increased belief in climate science (0.144 sd). In the 10 most-affected counties, Hurricane Ian catalyzed respondents’ pro-climate opinion by 0.31–0.45 sd across these outcomes, relative to respondents in unexposed counties.Footnote 25 Compared to Democratic partisanship, the effects of hurricane exposure are striking. Across these outcomes, Ian’s effect was 19%–31% as large as the effect of Democratic identification. Given how difficult it is to shift Americans’ partisan-rooted climate attitudes (McCright and Dunlap Reference McCright and Dunlap2011), this is a noteworthy finding and illustrates the intensity of hurricane experience.
Constituent Items
Our primary dependent variables are composite indices that aggregate many individual survey items into theoretically relevant concepts. These indices afford several advantages, including mitigating multiple inference concerns (Anderson Reference Anderson2008, 1484). Nevertheless, we recognize that items comprising our indices may themselves be substantively interesting. Taking the same specifications from Table 2, we examine constituent items and depict results in Figure 4. In all panels, black estimates represent the benchmark index effects from Table 2, while gray estimates denote effects of hurricane exposure on constituent items. All items are coded dichotomously, so gray estimates are interpretable as percentage point shifts.
Hurricane Exposure and Climate Attitudes
Note: Bars are 90% and 95% confidence intervals. Estimates show the effect of hurricane exposure on attitudes. Exposure is a continuous, z-standardized index combining information on Hurricane Ian’s eyepath, windswath, and storm surge. Black markers denote focal indices, while gray markers denote constituent indicator variables that comprise each index. Black estimates are scaled such that effects are interpretable as standard deviation shifts. Gray estimates are scaled such that effects are interpretable as percentage point shifts. Estimations include covariates from Table 2. The dashed red line marks 0. Full tabular results are in Tables D-8–D-14.

In Figure 4 (panels a and b), we study climate migration outcomes. A one-standard-deviation increase in hurricane exposure increased respondent perceptions that addressing climate migration was a top priority (5.8 pp). Hurricane Ian also made respondents more supportive of tax increases to resettle internal climate migrants (4.4 pp), more favorable toward politicians who promised to help climate migrants (4.9 pp), and more supportive of international cooperation to assist climate migrants (3.3 pp).Footnote 26 In sum, we find robust evidence that Hurricane Ian mobilized favorable responses to climate displacement, heightening its salience and support for costly policies to benefit the climate-displaced.
Figure 4 (panels c–f) studies the impacts of hurricane exposure on items that comprise the main climate change indices. Hurricane Ian increased agreement that addressing climate change is a top priority (7.3 pp) and perceptions that climate change has serious impacts (6.5 pp). Exposure also increased support for tax increases to address climate change (6.3 pp) and agreement that the United States (4.2 pp) and international community (4.3 pp) should do more to reduce climate change. In terms of mitigation, hurricane-exposed respondents became more supportive of clean energy investments (5.9 pp), restrictions on fossil fuel extraction (2.9 pp), and tighter fuel efficiency standards (5.9 pp). On adaptation, Hurricane Ian increased support for climate-proofing military bases (5.1 pp), strengthening coastlines (6 pp), and flood retrofitting (5.8 pp). Finally, Figure 4 (panel g) reveals that hurricane exposure increased acknowledgment of climate change’s anthropogenic causes (6.3 pp) and the link between climate change and hurricane severity (8.4 pp).
Political Behavioral Impacts
One natural concern is that our main estimates represent effects of Hurricane Ian on respondents’ opinions but not political behavior. Indeed, extant work on disaster exposure tends to study attitudinal or behavioral consequences in isolation (e.g., Deryugina Reference Deryugina2013; Visconti Reference Visconti2022). Analyses that bridge this divide offer a path forward for understanding total effects of climate disasters. Did Hurricane Ian’s mobilizing effect on pro-climate opinion shape real-world behavior of the storm’s victims?
To explore this question, we exploit a novel opportunity in Florida, the state most severely impacted by Ian. Florida’s general election was held on November 8, 2022, roughly 5 weeks after Hurricane Ian and 1 week after our initial survey ended. We assemble data on ballot initiatives and voteshare for the cross section of Florida counties in the 2022 general election to offer descriptive evidence on hurricane exposure and voting.Footnote 27 Formally, we estimate
 $$ \begin{array}{rll}{Y}_c={\alpha}_e+\delta ({\mathrm{Hurricane}\ \mathrm{Exposure}}_c)+\gamma ({X}_c)+\epsilon, & & \end{array} $$
where c indexes counties and e indexes emergency commands—the multicounty regions within which hurricane response was organized. $ {Y}_c $
are vote outcomes,
$ {Y}_c $
are vote outcomes, $ {\alpha}_e $
are emergency command fixed effects, and
$ {\alpha}_e $
are emergency command fixed effects, and $ {X}_c $
is a vector of county-level covariates. The coefficient
$ {X}_c $
is a vector of county-level covariates. The coefficient $ \delta $
captures the correlation between county-level hurricane exposure and general election voting.
$ \delta $
captures the correlation between county-level hurricane exposure and general election voting. $ \epsilon $
are heteroskedasticity-robust, county-clustered standard errors.
$ \epsilon $
are heteroskedasticity-robust, county-clustered standard errors.
When Florida voters went to the polls, they considered three legislatively referred state constitutional amendments, including one climate-related proposal. Specifically, voters were asked to approve an amendment that would prohibit tax assessors from taking flood-proofing improvements into consideration when determining property values.Footnote 28 By affording a tax break to homeowners invested in flood mitigation, this amendment aimed to support climate adaptation.Footnote 29 Indeed, politicians who supported the amendment explicitly framed it as a pro-climate policy response that could alleviate hurricane-induced displacement, noting: “[the amendment helps] mitigate the impacts of flooding and sea level rise that would damage our homes, disrupt businesses and displace families and employees” (Kirkland Reference Kirkland2021).
The partisan politics of the proposed flood amendment were complex. Framed as a pro-climate policy, the amendment initially received unanimous bipartisan support in the Florida State Legislature when it was tabled by Republican Linda Chaney. Nevertheless, some Democrats urged constituents to vote against the amendment during the referendum in November 2022, deriding the proposal as a tax break for wealthy beach-front homeowners (Ballotpedia 2022). Ultimately, the amendment required a 60% supermajority to pass and failed with 57.3% of the vote.
However, as revealed in Table 3, hurricane exposure had an important influence on climate-related voting. A one-standard-deviation increase in exposure to Hurricane Ian correlated with a 0.4–0.9 pp increase in voteshare for the tax break. In terms of the supermajority threshold, severely affected counties were 8–11.4 pp more likely to reach 60% approval. Moreover, effects hold even after controlling for average county-level income per capita (columns 4 and 8). These results dovetail with extant evidence on pro-environmental voting (Baccini and Leemann Reference Baccini and Leemann2021; Hazlett and Mildenberger Reference Hazlett and Mildenberger2020) and with our survey-based finding that Ian caused increasing support for climate adaptation and specifically flood retrofitting. Moreover, the effect of hurricane exposure on ballot support was specific to the climate-related amendment voters considered. Columns 7 and 8 of Table 3 show that Hurricane Ian had no distinguishable impact on the likelihood of a county passing other amendments. Together, these results represent suggestive evidence that hurricane exposure fostered pro-climate political engagement in affected counties. Future work should leverage designs like ours to further evaluate attitudinal and behavioral impacts of climate disasters.
Hurricane Exposure and Voting on Florida Ballot Initiatives

Note: Robust, county-clustered standard errors are in parentheses. Exposure is a continuous, z-standardized index combining information on Ian’s eyepath, windswath, and storm surge. Full tabular results are in Table A-3. * $ p<0.10 $
, **
$ p<0.10 $
, ** $ p<0.05 $
, ***
$ p<0.05 $
, *** $ p<0.01 $
.
$ p<0.01 $
.
ROBUSTNESS
Returning to our main attitudinal results, we probe robustness in a variety of additional specifications, all of which corroborate the large, positive effect of Hurricane Ian on climate opinion. In Tables SI-5–SI-7 and A-4, we explore a number of alternative measures of hurricane exposure, including components of our index (e.g., windswath and storm surge) and a binary decomposition of the index, which takes a value of 1 for counties above the median and 0 otherwise. Whereas our main index captures the county-level intensity of Hurricane Ian, this binary measure averages over substantive, scale effects of hurricane severity.
Second, in Tables A-5 and A-6, we verify that similar results emerge using alternative outcome indices constructed by principal component analysis or by averaging constituent items. Third, we confirm that the estimates hold while matching hurricane-exposed and unexposed respondents on demographic covariates (Table A-7). Fourth, while the regressions include pertinent controls, we confirm that the estimated effects are robust to incorporating a broader array of covariates, like race and religiosity (Table A-8). Fifth, we find that the main effects are robust to alternative error clustering (Tables A-9 and A-10), sampling weights (Figure A-6), and estimators (Table A-11).
For omitted time-varying variables to bias our estimates, they must vary daily across counties. Three relevant confounders stand out: local politics, migration, and hurricane-induced displacement. We lack daily information on these covariates, so instead we draw on pretreatment measures. In Table A-12, we incorporate these pre-hurricane, county-level controls flexibly by interacting them with date fixed effects. To capture local politics, we take the county-level Republican voteshare from the 2020 Presidential election. To capture migration trends, we take 2021 county-level net migration rate. To capture hurricane-related displacement, we study data from Waze, a traffic-mapping application. Before Ian, Waze partnered with the Florida government to track evacuation-related road hazards. We use these data to estimate the population-normalized intensity of hurricane-induced traffic before landfall. Results are robust to accounting for these potential confounders.
Of course, while we account for many theoretically relevant factors, it remains possible that omitted variables could bias our results. We conduct several sensitivity approaches to assess the degree of confounding from unobservables that would be required to alter the substantive interpretation of our findings. Using a test proposed by Cinelli and Hazlett (Reference Cinelli and Hazlett2020), we benchmark confounding from unobservables against observed covariates. Figure A-7 reveals that even a confounder three times stronger than Democratic partisanship—the most important predictor of Americans’ climate attitudes—would be insufficient to alter the results. Table A-13 and Figure A-8 yield similar evidence using related tests (Blackwell Reference Blackwell2014; Oster Reference Oster2019). Together, these sensitivity analyses suggest unobserved confounding would have to be implausibly strong to alter the main conclusions.
A number of supplemental tests also extend our core analyses. In Table A-14, we exploit Hurricane Ida, the strongest hurricane of 2021, as a placebo. Hurricane Ida made landfall in Louisiana a year before our survey and caused significant damage from coastal Texas to the Florida Panhandle. Counties exposed to Ida should be similar to counties exposed to Ian, but we should not observe an effect of Ida, conditioning on exposure to Ian. Reestimating the core specifications while studying Ida exposure confirms this. Additionally, in Figure A-10, we consider a placebo survey outcome—support for strengthening the U.S. military. We expect this outcome to be unaffected by hurricane exposure and estimate support by repeating the focal specifications from Table 2. Encouragingly, Ian had no effect on this unrelated placebo outcome. Finally, in Figure A-11, we test whether the main effects decay with distance from Hurricane Ian’s eyepath. Although hurricanes affect large areas, their destructive power is greatest along the eyepath. Work by Hazlett and Mildenberger (Reference Hazlett and Mildenberger2020) finds climate disasters often have highly localized effects. We find that large, precise effects of Ian decay by 100–500 miles of distance from the eyepath.
HETEROGENEOUS EFFECTS
Do the effects of Hurricane Ian vary across demographic subgroups? Identifying how key traits moderate the impact of hurricane exposure is central for understanding the mechanisms by which climate disasters shape attitudes and for understanding how political coalitions for pro-climate policymaking might be formed after disasters. We preregistered tests for heterogeneous effects across many theoretically relevant dimensions and focus on two particularly crucial traits—partisanship and income—in Table 4.Footnote 30
Heterogeneous Effects of Hurricane Exposure on Climate Attitudes

Note: Robust, county-clustered standard errors are in parentheses. Post is an indicator for all dates on or after September 28, 2022 when Hurricane Ian made landfall in the United States. Exposure is a continuous, z-standardized index combining information on Hurricane Ian’s eyepath, windswath, and storm surge. Demographic covariates are partisanship, education, gender, and age. Estimates show the effect of Hurricane Exposure× Post in subsamples defined by the respective trait denoted in the panel title. Full tabular results are in Tables A-15 and A-18. * $ p<0.10 $
, **
$ p<0.10 $
, ** $ p<0.05 $
, ***
$ p<0.05 $
, *** $ p<0.01 $
.
$ p<0.01 $
.
In the top panel of Table 4, we study how respondent partisanship shapes responsiveness to Hurricane Ian. To do so, we repeat the core specifications from Table 2, while subsetting the sample to Democrats and Republicans, respectively. Recent work suggests that disasters only induce pro-climate behavior in Democratic areas (Hazlett and Mildenberger Reference Hazlett and Mildenberger2020). In contrast, we find little systematic evidence of heterogeneity by individual partisanship. Republicans’ and Democrats’ attitudes on climate migration and climate change are equally responsive to hurricane exposure. The only heterogeneous effect we document is greater responsiveness of Republicans’ beliefs in climate science: whereas exposure to Hurricane Ian had virtually no effect on Democrats’ beliefs in climate science, a one-standard-deviation increase in exposure increased Republicans’ beliefs by 0.22 sd. This likely owes to a ceiling effect among Democrats, whose baseline belief in climate science is much greater than that of Republicans. In general, we find evidence that the pro-climate impacts of Hurricane Ian cross-cut partisanship.Footnote 31 Pro-environment views may be mobilized on both sides of the aisle following large-scale climate disasters.
In the bottom panel of Table 4, we study how respondent income shapes responsiveness to Hurricane Ian. For these tests, we split the sample at the median of income and repeat the core specifications from Table 2 for low- and high-income subsamples. Considering income differences in the effect of climate disasters is critical for three reasons. First, the world’s poor are disproportionately climate-vulnerable, facing heightened food insecurity and physical risk from disasters (Hallegatte et al. Reference Hallegatte, Bangalore, Bonzanigo, Fay, Kane, Narloch and Rozenberg2015). Second, as a consequence of their disproportionate vulnerability, low-income people face the greatest climate-related migratory pressures (Rigaud et al. Reference Rigaud, de Sherbinin, Jones, Bergmann, Clement, Ober and Schewe2018) but are least able to afford displacement to climate-resilient communities. For instance, during hurricanes, low-income individuals are less able to afford evacuating and more likely to rely on public shelters for housing assistance (Riad, Norris, and Barry Ruback Reference Riad, Norris and Barry Ruback1999). Third, as a result of sociotropic, nativist concerns, poor climate migrants face the staunchest backlash from receiving communities (Marotzke, Semmann, and Milinski Reference Marotzke, Semmann and Milinski2020).
We find that compared with high-income respondents, low-income respondents’ climate attitudes are consistently more responsive to hurricane exposure. A one-standard-deviation increase in exposure to Hurricane Ian increased low-income respondents’ pro-climate opinions by 0.12–0.26 sd across outcomes. The difference in effect sizes between low- and high-income respondents is large and distinguishable for six of seven indices. Together, these findings are strongly suggestive of rational retrospection. Climate disasters are most impactful in shaping beliefs of individuals most vulnerable to climate change, least able to afford moving from severely impacted areas, and most reliant on public assistance in the event of displacement.
EFFECT PERSISTENCE
Are the effects of hurricane exposure durable? Previous work suggests climate disasters have short-lived consequences (Egan and Mullin Reference Egan and Mullin2012; Konisky, Hughes, and Kaylor Reference Konisky, Hughes and Kaylor2016). As discussed above, one prominent explanation for temporal decay in disasters’ effects is recency bias (Kahneman, Slovic, and Tversky Reference Kahneman, Slovic and Tversky1982). Climate disasters may mobilize a rapid spike in pro-climate opinion in the short run before new developments attenuate their catalyzing effects, causing attitudes to revert to baseline levels. Yet Hurricane Ian was a devastating storm with lingering infrastructural impacts. The intensity of storm damage in Ian-affected counties could render the main effects durable.
Our original survey ran for 4 weeks after Hurricane Ian made landfall, allowing us to probe short-run effect persistence. Event study estimates (Figures SI-1 and SI-2) reveal that the main effects of interest all persisted for at least the first month after landfall. Our political behavioral results (Table 3) also comport with this finding. Florida voters in counties more severely impacted by Hurricane Ian were more supportive of pro-climate proposals 5 weeks after landfall.
To further assess effect persistence, we fielded an exploratory follow-up survey on a new sample of respondents (Figure A-12) in March 2023, roughly 6 months after Hurricane Ian. Results from this follow-up are depicted in Figure 5, alongside baseline estimates from Table 2. Corresponding with previous studies, we find that the effects of hurricane exposure attenuate in our follow-up survey.Footnote 32 Whereas the main effects were large and precise for at least 1 month after Hurricane Ian, all effects of hurricane exposure become null by 6 months post-storm. Our design is unable to reveal precisely when the effects of Hurricane Ian attenuated between our original and follow-up surveys, but the relatively short-lived effects we document accord with existing findings on climate attitudes (e.g., Egan and Mullin Reference Egan and Mullin2012) and recency bias (e.g., Nordhaus Reference Nordhaus1975). Probing how durable effects of disaster exposure are, and disentangling causal mechanisms, remains an important avenue for future research.
Effects of Hurricane Exposure in a 6-Month Follow-Up
Note: Bars are 90% and 95% confidence intervals. Exposure is a continuous, z-standardized index combining information on Hurricane Ian’s eyepath, windswath, and storm surge. Black markers denote estimates from the main sample (Table 2). Gray markers are coefficients from the follow-up sample fielded in March 2023 and represent the correlation between hurricane exposure and attitudes. Estimations include covariates from Table 2. The dashed red line marks 0. Full tabular results are in Table 2 (black estimates) and Table A-20 (gray estimates).

We also explore heterogeneity in effect persistence.Footnote 33 Two especially relevant dimensions that could impact the durability of Ian’s effects are the occurrence of additional disasters and provision of post-disaster relief. To assess the first possibility, we study how exposure to a subsequent, late-season hurricane—Nicole—moderated Ian’s effects. Hurricane Nicole made landfall in Florida on November 10, 2022, 2 weeks after our initial survey ended. Although Nicole was a much weaker storm than Ian, it impacted similar areas, affecting portions of Florida and North Carolina (Figure SI-3). Multiple disaster exposure could magnify the effects of Hurricane Ian by reinforcing the pressing need for climate mitigation or blunt effects of Ian by distracting public attention (Arndt, Jensen, and Wenzelburger Reference Arndt, Jensen and Wenzelburger2021) and muting climate risk perceptions among doubly victimized populations (Leppold et al. Reference Leppold, Gibbs, Block, Reifels and Quinn2022). In Table SI-10, we find suggestive evidence of the latter. The persistence of Hurricane Ian’s pro-climate effects is greater among respondents exposed to Hurricane Ian but not Hurricane Nicole than among respondents exposed to both storms.
To test how post-storm aid shaped the persistence of Hurricane Ian’s effects, we assemble data on individual and public assistance distributed by the Federal Emergency Management Agency (FEMA) in areas impacted by Hurricane Ian. At the time of our follow-up survey, FEMA had already disbursed more than $1.5 billion in relief to Ian’s victims. We lack information on whether respondents themselves had received assistance but define an indicator for counties that had received federal aid by the time of our follow-up. Disaster relief may foster effect persistence by generating voter gratitude (Bechtel and Hainmueller Reference Bechtel and Hainmueller2011), or it may undermine effect persistence by inducing beneficiaries to focus myopically on recovery over mitigation (Healy and Malhotra Reference Healy and Malhotra2009). Disaster relief that enables victims to remain in their original communities, for instance, by funding home repairs, may also undercut specific support for policies to benefit climate migrants. Climate-induced migratory pressures are greater for individuals exposed to hurricanes and who have not received federal relief that could make staying feasible.Footnote 34 Consistent with this logic, Table SI-11 reveals that the positive effect of Hurricane Ian on climate migration attitudes was longer-lasting for respondents in counties that had yet to receive federal relief. This finding underscores a tradeoff for pro-environment policymakers responding to disasters—providing relief aid improves victims’ welfare but potentially undermines the durability of disasters’ pro-climate effects.
We leverage rich demographic data from our follow-up survey—as in Table 4—to further consider whether effects are more durable among various population subgroups (Tables SI12–SI-16). These tests reveal scant evidence of heterogeneity in the persistence of Hurricane Ian’s effects across demographic traits. In sum, we find relatively short-lived effects of Hurricane Ian on victims’ climate attitudes. This suggests that while climate disasters open brief windows for policy action on climate migration and climate change, political opportunities are fleeting. Public officials interested in climate mitigation may be able to advance the pro-climate agenda by seizing on public favorability in the aftermath of disasters; however, policymaking timelines are often slower than disaster-induced surges of mass support. Discordance between electoral timetables and windows-of-favorability around disasters constrain prospects for major climate policy advances as a result of climate disasters. Still, pro-environment policymakers and candidates may be able to leverage favorable public opinion. As our behavioral results (Table 3) suggest, climate disasters can mobilize pro-climate voters when they occur in temporal proximity to elections. Policymakers should also take repeat disasters and post-disaster relief into consideration and target population subgroups for whom disasters have longer-lasting effects. Communities with single (rather than multiple) disaster exposure, and that do not receive post-disaster relief, represent one potential pro-climate coalition.
CONCLUSION
Public attitudes on climate migration and climate change bear crucially on policymaking in the United States. In particular, popular opinion shapes the prospects for integrating climate-displaced people into host communities and the feasibility of political progress on climate mitigation. The scale of climate displacement between, and especially within countries, is large and growing. Yet the microfoundations of climate migration beliefs remain poorly understood. Existing evidence suggests that these beliefs are distinct from broader climate or migration attitudes (Arias and Blair Reference Arias and Blair2022), making opinion on climate migration theoretically interesting and empirically relevant. We advance scholarship by offering a unified framework for understanding how climate disasters shape attitudes on climate change and climate migration. To the best of our knowledge, ours is the first study to consider how disasters—the leading cause of climate-related displacement worldwide—impact relevant mass beliefs.Footnote 35
We specifically study how a severe climate disaster, Hurricane Ian, shaped public opinion in the Republican-dominated American South. Our study focuses on attitudes in four Southern swing states, where climate-skeptic and anti-migrant politics intersect and where voters are cross-pressured by climate change and migration. Using a preregistered, quasi-experimental design, we find that climate disasters mobilize favorability toward climate migrants and support for tackling climate change. In counties more severely impacted by Hurricane Ian, respondents became more supportive of policies to assist the climate-displaced, more supportive of policy action to mitigate climate change and more willing to acknowledge core tenets of climate science. These attitudinal effects also appear to translate to political behavior. Exposure to Hurricane Ian was correlated with support for pro-climate proposals in Florida’s 2022 general election. Together, these results are consistent with rational, rather than “blind,” retrospection among disaster-affected populations. Experience of Hurricane Ian concretized risks of climate change and climate displacement, spurring support for relevant, ameliorative policies.
In contrast to some prior research, we also find that the mobilizing effects of hurricane exposure cross-cut partisanship. This salutary finding suggests it may be possible to forge broad-based coalitions of support for climate action in the wake of disasters, even in highly polarized settings like the United States. Additionally, our results call attention to the particular importance of vulnerable, low-income populations in climate advocacy and policymaking. We find that the pro-climate effects of Hurricane Ian were greatest for low-income respondents. These individuals are at the greatest risk from climate change and hence face the greatest climate migratory pressures. Yet low-income people also confront unique obstacles when weighing displacement as a response to climate change. Poor individuals are least able to afford migrating and tend to face the greatest backlash from hosts when they are climate-displaced. Thus, policymakers and climate activists should consider prevailing socioeconomic inequalities when designing disaster response and preparedness policies and climate advocacy campaigns. Doing so is key for ensuring impoverished disaster victims are afforded equitable options for climate adaptation and for enabling safe and dignified migration among those victims who opt to flee.
Unfortunately, pro-climate effects of climate disasters are temporally limited, constraining politicians’ abilities to leverage up-swings in pro-climate opinion to implement major climate policies. We find that Hurricane Ian’s effects lasted at least 1 month but decayed within 6 months. Our design is unable to identify precisely how long Ian’s effects lasted, and this represents an important priority for future research. The relatively short-term consequences of Ian we document are consistent with recency bias, a human tendency to discount older information and experiences when forming opinions (Kahneman, Slovic, and Tversky Reference Kahneman, Slovic and Tversky1982). Still, by boosting public support, hurricanes do open brief windows of opportunity within which climate action is possible. Election-time climate disasters may be particularly likely to generate concerted pro-climate political mobilization.
Finally, this article underscores the pressing need for further research on climate-induced migration. Unpacking the interrelationship between beliefs about climate displacement and climate change is critical for crafting unified theories of climate-related opinion and for clarifying canonical models of migration attitudes. Future studies should examine the generalizability of our findings in Global South settings. More work is also needed to conclusively identify whether disasters increase other-regarding sympathy for foreign climate migrants, in addition to locally displaced people.Footnote 36 Another fruitful avenue for research concerns the provision of post-disaster relief. How does disaster assistance shape migration decisions of climate victims and their reception by host communities? Fourth, work is needed to understand multiple disaster exposure. While recurrent disasters may magnify support for climate action, repeat climate victims could also become accustomed to extreme weather in a manner that undercuts pro-climate impacts. In sum, urgent action is needed to address the challenges posed by climate change and specifically climate-induced migration. Our findings should inform theory-building and climate advocacy strategies and offer insights for practitioners developing comprehensive climate mitigation policies.
SUPPLEMENTARY MATERIAL
To view supplementary material for this article, please visit https://doi.org/10.1017/S0003055424000352.
DATA AVAILABILITY STATEMENT
Research documentation and data that support the findings of this study are openly available at the American Political Science Review Dataverse: https://doi.org/10.7910/DVN/XPTMGF.
ACKNOWLEDGMENTS
We kindly thank Helen Milner, Amanda Kennard, Alex Gazmararian, Josh McCrain, Dahyun Choi, Johnathan Guy, Sayumi Miyano, and Ishana Ratan for helpful comments and advice.
FUNDING STATEMENT
This research was funded by the Kleinman Center for Energy Policy at the University of Pennsylvania.
CONFLICT OF INTEREST
The authors declare no ethical issues or competing interests in this research.
ETHICAL STANDARDS
The authors declare the human subjects research in this article was reviewed and approved by the Institutional Review Board at the University of Pennsylvania (Protocol number: 851979). The authors affirm that this article adheres to the principles concerning research with human participants laid out in APSA’s Principles and Guidance on Human Subject Research (2020).


 Open access
Comments
No Comments have been published for this article.