


Introduction
Environmental stresses—conditions that disrupt metabolic, growth, and/or developmental processes of organisms (Lichtenthaler Reference Lichtenthaler1998)—are expected to have influenced biotic turnover during all major Phanerozoic mass extinctions. However, besides the disappearance of certain lineages, there are few tangible imprints of environmental stress in the fossil record. Microsporogenesis, the process of pollen production, is among the most vulnerable phases in the life cycle of seed plants to environmental stress (De Storme and Geelen Reference De Storme and Geelen2014). Deviations in microsporogenesis could alter pollen and spore shape and size and, given that palynomorph walls are highly resistant to decay, these malformations may be archived in the fossil record. Morphological deviations in palynomorphs therefore might provide a unique paleoenvironmental stress proxy for terrestrial ecosystems.
Increased spore abnormalities and pollen malformations in palynological assemblages are interpreted to be among the few instances of a detectable biotic stress response during the end-Devonian, end-Permian, and end-Triassic crises (Visscher et al. Reference Visscher, Looy, Collinson, Brinkhuis, van Konijnenburg-van Cittert, Kürschner and Sephton2004; Foster and Afonin Reference Foster and Afonin2005; Looy et al. Reference Looy, Collinson, van Konijnenburg-van Cittert, Visscher and Brain2005; Kürschner et al. Reference Kürschner, Batenburg and Mander2013; van de Schootbrugge and Wignall Reference van de Schootbrugge and Wignall2016; Hochuli et al. Reference Hochuli, Schneebeli-Hermann, Mangerud and Bucher2017; Lindström et al. Reference Lindström, Sanei, van de Schootbrugge, Pedersen, Lesher, Tegner, Heunisch, Dybkjær and Outridge2019; Gravendyck et al. Reference Gravendyck, Schobben, Bachelier and Kürschner2020; Marshall et al. Reference Marshall, Lakin, Troth and Wallace-Johnson2020). In pollen, these malformations have been observed predominantly in saccate forms (Foster and Afonin Reference Foster and Afonin2005).
Natural History of Saccate Pollen
Saccate grains are wind-dispersed, consisting of a corpus—central body containing the microgametophyte—and sacci—spongeous, inflated regions of the outermost pollen wall (exine) (Fig. 1A). Saccate grains are characteristic of several major Paleozoic, Mesozoic, and Cenozoic seed plant lineages, including conifers, cordaites, peltasperms, corystosperms, and glossopterids (Clement-Westerhof Reference Clement-Westerhof1974; Grauvogel-Stamm Reference Grauvogel-Stamm1978; Millay and Taylor Reference Millay and Taylor1979; Balme Reference Balme1995; Lindström et al. Reference Lindström, McLoughlin and Drinnan1997). The saccate condition has evolved in both prepollen and pollen. Saccate prepollen was produced by medullosan seed ferns, walchian conifers, and some cordaites (Millay et al. Reference Millay, Eggert and Dennis1978; Poort and Veld Reference Poort and Veld1997; Poort et al. Reference Poort, Clement-Westerhof, Looy and Visscher1997). These prepollen are characterized by having a proximal aperture indicative of zooidogamy, that is, fertilization by motile antherozoids, but lacking a distal thinning (leptoma) and the ability to form a pollen tube (Millay and Taylor Reference Millay and Taylor1974; Poort et al. Reference Poort, Visscher and Dilcher1996). The earliest saccate prepollen appeared in the Late Devonian (383–372 Ma; Foster and Balme Reference Foster, Balme, Krumann and Doyle1994; Aubry et al. Reference Aubry, Van Couvering, Christie-Blick, Landing, Pratt, Owen and Ferrusquia-Villafranca2009) and diversified during the Pennsylvanian (323–299 Ma; Poort et al. Reference Poort, Visscher and Dilcher1996; Traverse Reference Traverse2007). These grains were usually monosaccate, having a single large saccus, although the saccus in several fossil lineages is indented close to the central body, giving the false resemblance of a bisaccate condition (Poort et al. Reference Poort, Clement-Westerhof, Looy and Visscher1997; Rothwell et al. Reference Rothwell, Mapes and Hernandez-Castillo2005). The bisaccate condition, in which the central body bears two symmetrical sacci (Fig. 1A), first appeared during the Middle to Late Pennsylvanian and became the most abundantly and widely produced form in gymnosperms from the early Permian (299–273 Ma) onward (Kosanke Reference Kosanke, Tschudy and Scott1969). Presently, saccate pollen continues to be produced by ~375 extant species in the conifer families Pinaceae and Podocarpaceae (Leslie Reference Leslie2010).
Schematic of phenotypically normal pollen and observed malformation types in bisaccate pollen compared in this study. A, Phenotypically normal bisaccate grain. B–D, Asymmetrical sacci: B, enlarged and reduced sacci; C, fused/confluent sacci; D, encircling sacci. E–H, Atypical number of sacci: E, asaccate grain; F, unisaccate grain; G, trisaccate grain; H, tetrasaccate grain. I–K, Conjoined grains: I, dyad; J, triad; K, tetrad (decussate). L, M, Giant grains: L, giant monad; M, giant dyad. N–P, unseparated grains: N, dyad; O, triad; P, tetrad.

The saccate condition is thought to play a role in the dispersal and pollination process in wind-pollinated taxa (Schwendemann et al. Reference Schwendemann, Wang, Mertz, McWilliams, Thatcher and Osborn2007; Leslie Reference Leslie2008). Computational models and experiments show that sacci reduce the settling speed of pollen grains and thus increase the potential dispersal distance (Schwendemann et al. Reference Schwendemann, Wang, Mertz, McWilliams, Thatcher and Osborn2007). Additionally, sacci play an important role in the pollination process of many extant members of Podocarpaceae and Pinaceae. These conifers produce ovulate cones with inverted ovules, which are gravitropically orientated (downward-facing) and exude, or condense from water vapor, pollination droplets around the micropyle in which wind-dispersed pollen are captured. Sacci aid in pollinating inverted ovules by increasing the buoyancy of the grains, enabling their floatation against gravity through the pollination droplet, up toward the micropyle. Once there, the pollen grain germinates and initiates the fertilization process (Salter et al. Reference Salter, Murray and Braggins2002; Leslie Reference Leslie2008, Reference Leslie2010).
Microsporogenesis in Conifers
In extant conifers, pollen formation (microsporogenesis) occurs in three distinct phases: (1) the microspore mother cell stage (in which meiosis I, II, and cytokinesis occur), (2) the tetrad stage, and (3) the free microspore stage (Fig. 2). Before meiosis, the microspore mother cell partly breaks down its primary cell wall, and a thin surface coat is deposited between its plasma membrane and remnants of the primary cell wall (Kurmann Reference Kurmann, Blackmore and Knox1990). Early in meiosis, the tapetum deposits a callose wall between the microspore mother cell surface coat and its plasma membrane, and callose continues to be deposited selectively throughout meiosis I and II until the end of the tetrad stage (Kurmann Reference Kurmann, Blackmore and Knox1990). Callose separates developing pollen grains, prevents fusion between their outer walls (exine) (Nishikawa et al. Reference Nishikawa, Zinkl, Swanson, Maruyama and Preuss2005), and serves as scaffolding against which microspores deposit the surface coat and exine (Kurmann Reference Kurmann, Blackmore and Knox1990). During this process, each microspore secretes a surface coat—a primexine layer—between the plasma membrane and enveloping callose wall over the entire grain surface, including the regions where future sacci are generated (Dickinson and Bell Reference Dickinson and Bell1970). The formation of the different parts of the exine proceed stepwise in the tetrad stage. Observations of microsporogenesis of Pinus banksiana Lambert show that saccus formation initiates early in the tetrad stage, when regionalized spaces develop between the inner surface of the primexine layer and the plasma membrane (Dickinson and Bell Reference Dickinson and Bell1970). The shape, number, and orientation of sacci therefore are developmentally determined in the early tetrad stage and formed by the end of the tetrad stage
Developmental stages in bisaccate pollen sporogenesis including hypothesized developmental origins of pollen malformation types. A, B, Giant grains: A, giant monad; B, giant dyad. C–E, Conjoined grains: C, dyad; D, triad; E, tetrad (decussate). F–L, Saccus malformations: F, asaccate grain; G, unisaccate grain; H, enlarged and reduced sacci; I, fused/confluent sacci; J, encircling saccus; K, trisaccate grain; L, tetrasaccate grain. M–O, Unseparated grains: M, dyad; N, triad; O, tetrad. Microsporogenesis sequence schematics adapted from Ferguson (Reference Ferguson and Evermann1904).
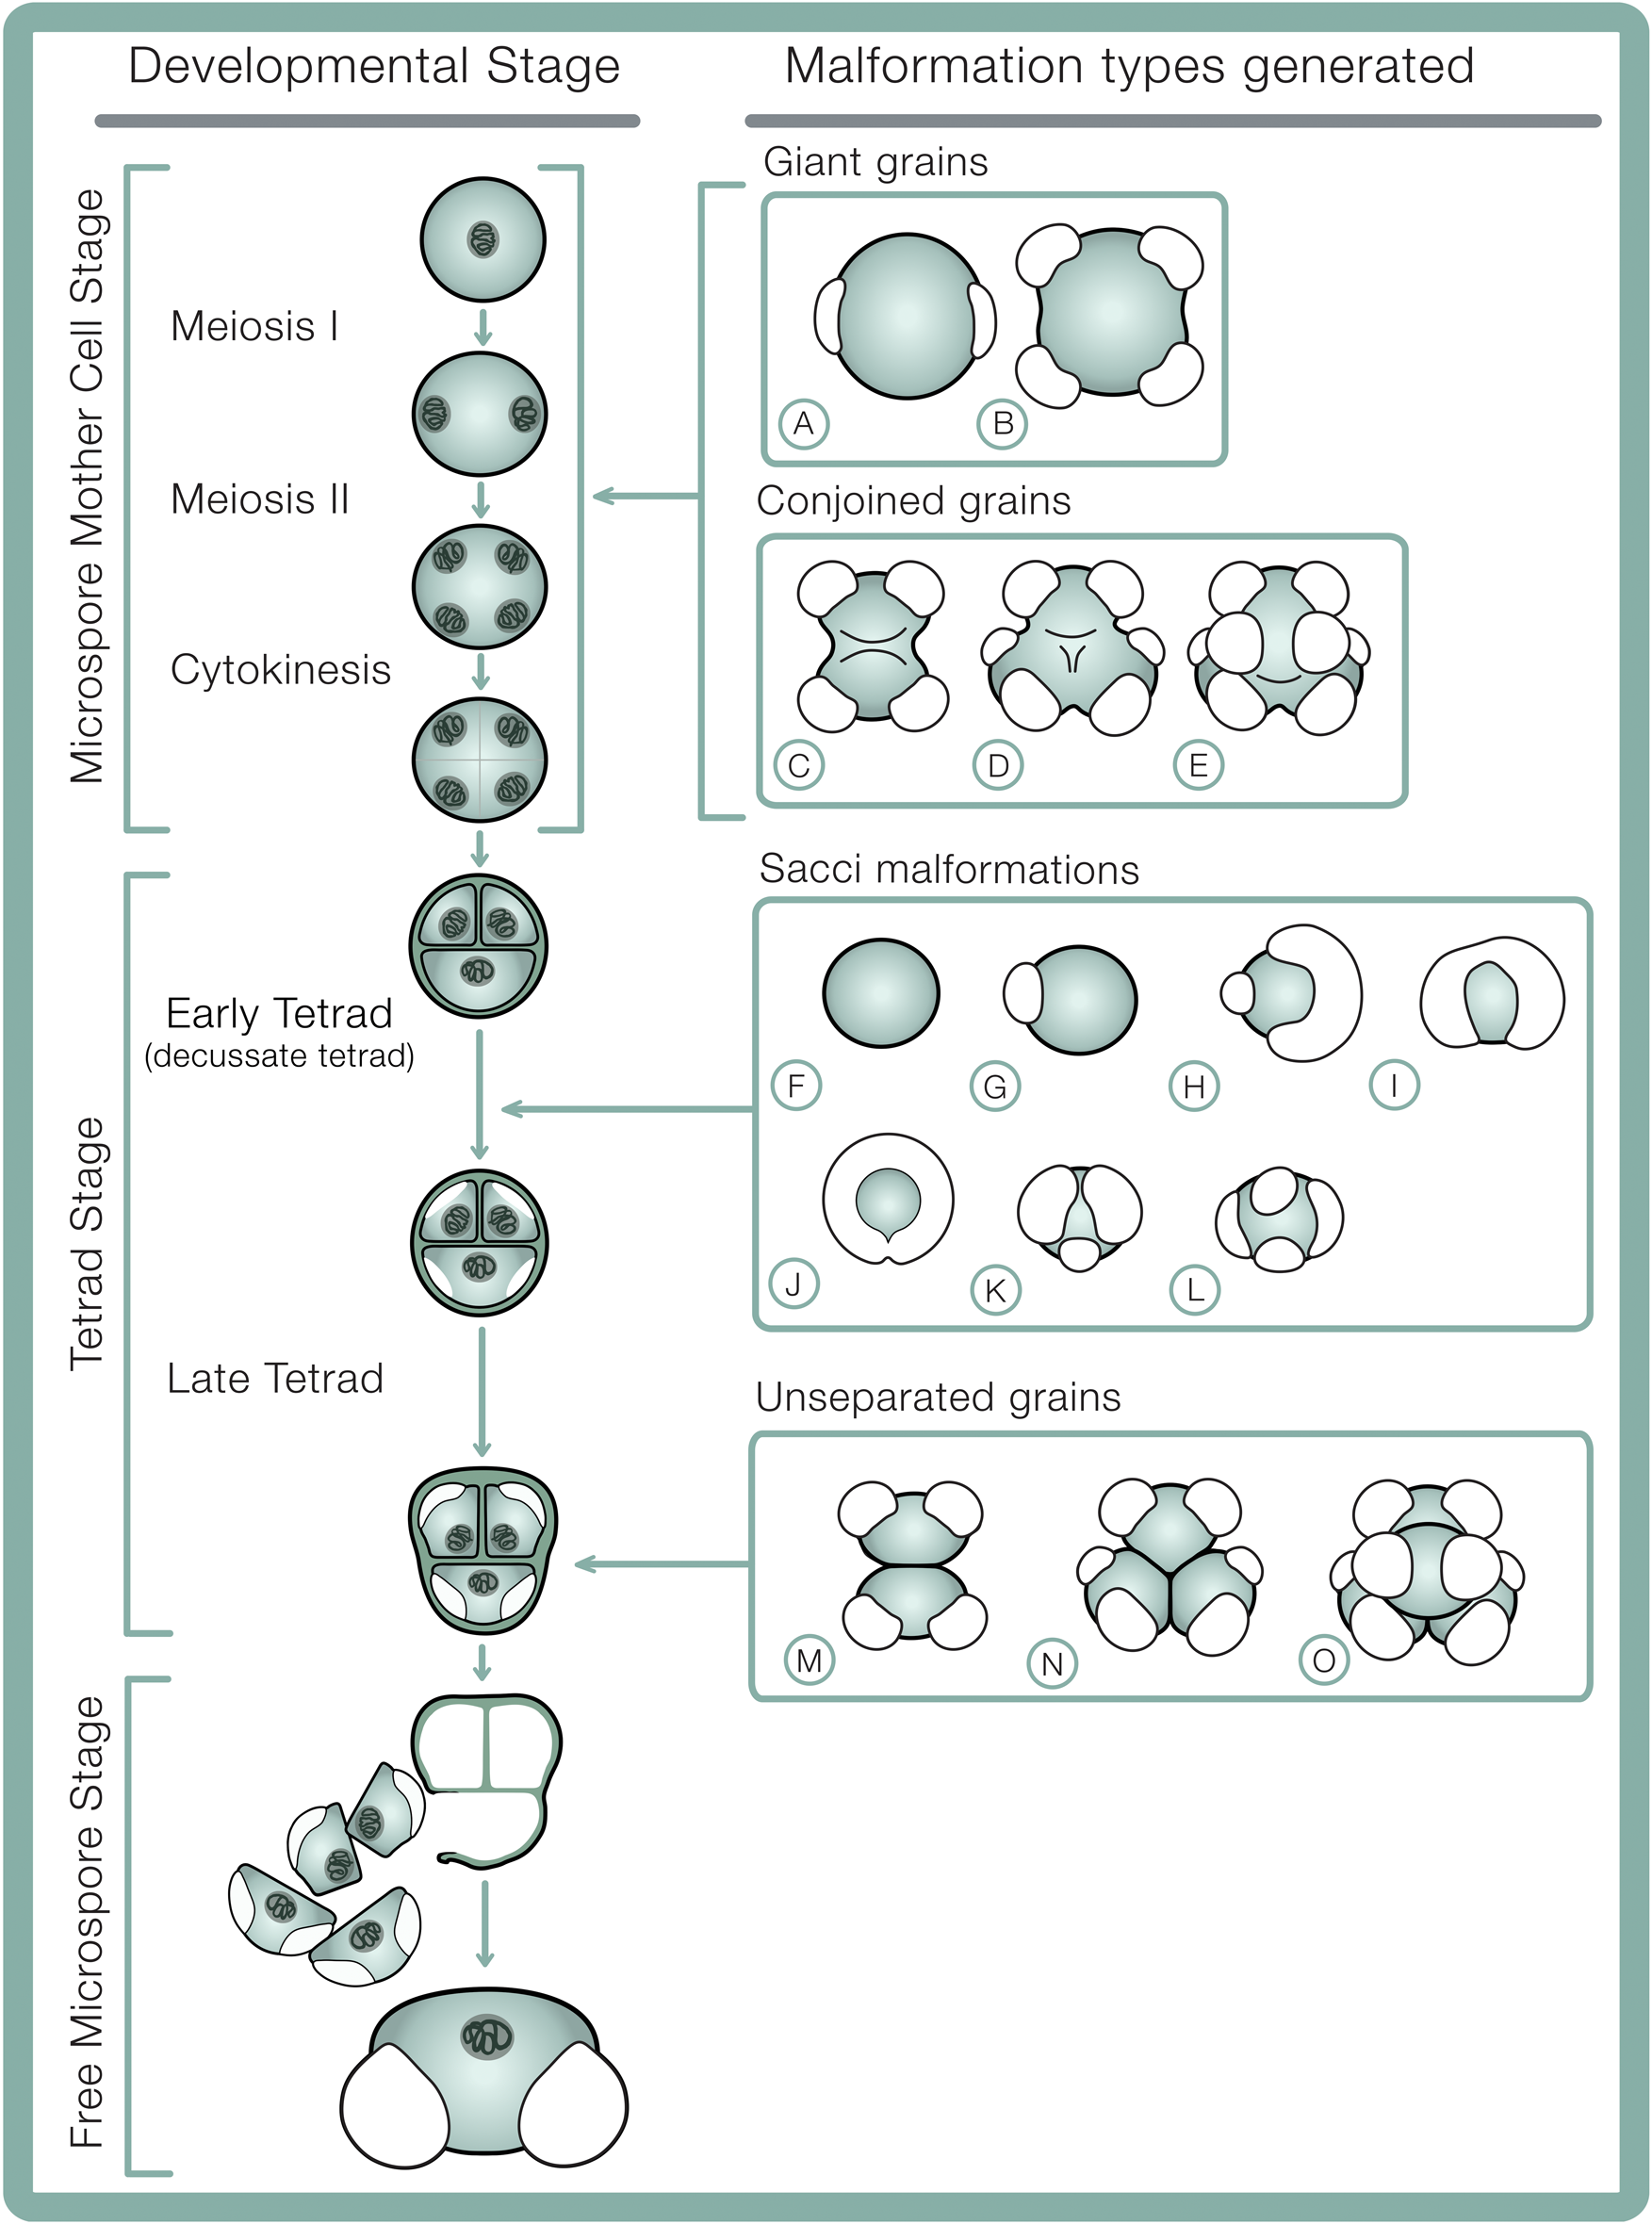
At the end of the tetrad phase, the callose wall, plasma membrane, and surface coats dissolve (Lou et al. Reference Lou, Zhu, Yang, Nick and Opatrny2014), and the microspores separate (Kurmann Reference Kurmann, Blackmore and Knox1990). The intine layer forms between the exine and the microspore plasma membrane, while continuous accumulation of sporopollenin increases the exine thickness (Kurmann Reference Kurmann, Blackmore and Knox1990). Polysaccharides in the free pollen grains expand greatly, separating the intine and exine layers, further inflating the sacci from initial ellipsoids contained within the tetrad to more spherical, spongeous forms in free pollen grains. This inflation of the sacci is accompanied by an ~300% increase in corpus volume and near doubling of the thickness of the outer exine (Dickinson and Bell Reference Dickinson and Bell1970). This synchronous expansion of the outer exine elsewhere in the grain as the sacci expand suggests sacci represent a relatively minor modification of normal exine structure (Dickinson and Bell Reference Dickinson and Bell1970). Pollen grains are released from the microsporangium after several more mitotic divisions.
Saccate Pollen Malformation and Environmental Stress
Saccate pollen malformations manifest in a range of forms, some of which coincide within individual, conjoined, or unseparated grains (Fig. 1). Malformations in the past and present are primarily documented in bisaccate pollen types and include specimens with asymmetrical sacci (Fig. 1B–D), grains having fewer or more than two sacci (Fig. 1E–H) (Wilson Reference Wilson1965), but may also occur as conjoined (fused)] grains (Fig. 1I–K), giant grains (Fig. 1L,M), and unseparated grains in which the walls of each palynomorph are fully formed but unfused at contact points (Fig. 1N–P) (Wilson Reference Wilson1965; Pocknall Reference Pocknall1981; Tretyakova and Noskova Reference Tretyakova and Noskova2004; Foster and Afonin Reference Foster and Afonin2005; Benca et al. Reference Benca, Duijnstee and Looy2018). Although dispersed saccate grains with malformations are not uncommon, intervals of heightened malformation frequencies (despite considerable time- and/or spatial-averaging in palynological samples) tend to coincide with times of great ecological and environmental perturbation, such as the end-Permian crisis (Visscher et al. Reference Visscher, Looy, Collinson, Brinkhuis, van Konijnenburg-van Cittert, Kürschner and Sephton2004; Foster and Afonin Reference Foster and Afonin2005; Looy et al. Reference Looy, Collinson, van Konijnenburg-van Cittert, Visscher and Brain2005; van de Schootbrugge and Wignall Reference van de Schootbrugge and Wignall2016). This association implies pollen malformations may result directly from environmental stresses associated with biotic crises.
Malformed pollen grains have been observed in modern conifers under numerous environmental stresses such as sharp decreases in temperature (Christiansen Reference Christiansen1960; Chira Reference Chira1967), warming and drying climate (Bazhina et al. Reference Bazhina, Kvitko and Muratova2007a; Noskova et al. Reference Noskova, Tretyakova and Muratova2009), photochemical and industrial pollution (Renzoni et al. Reference Renzoni, Viegi, Stefani and Onnis1990; Mičieta and Murín Reference Mičieta and Murín1996; Presnukhina and Kalashnik Reference Presnukhina and Kalashnik2003), geochemical pollution (Tretyakova and Noskova Reference Tretyakova and Noskova2004), pathogenic fungal attack/disease (Bazhina et al. Reference Bazhina, Kvitko and Muratova2007a), heightened ultraviolet-B radiation (UV-B; 280 to 315 nm) (Benca et al. Reference Benca, Duijnstee and Looy2018), and nuclear radiation (Sirenko Reference Sirenko2001). Aside from nuclear radiation, these stresses are not limited to anthropogenic activities, and therefore could have been experienced by gymnosperms before the Industrial Revolution. High levels of malformed bisaccate pollen thus have potential as an indicator of various environmental stressors from the Pennsylvanian to the present.
Foster and Afonin (Reference Foster and Afonin2005) proposed a benchmark of more than 3% malformations in dispersed fossil and extant pollen yields as indicative of environmental stress. However, the observations used to generate this benchmark are difficult to compare, as they are drawn from geographically disparate localities lacking environmental controls. These studies also contrast in terms of sampling methodologies, sample size, and categorizations of malformations (see Foster and Afonin Reference Foster and Afonin2005) and include members of both Pinaceae and Podocarpaceae. Although the saccate pollen of these conifer lineages are both structurally and functionally similar, and likely ancestral within extant groups in which they occur (Leslie et al. Reference Leslie, Beaulieu, Crane, Knopf and Donoghue2015), their microgametophytes are produced by different cellular division patterns (Sporne Reference Sporne1965; Fernando et al. Reference Fernando, Lazzaro and Owens2005). Furthermore, morphological character evolution analyses of saccate pollen in extant and extinct seed plants suggest that the modern saccate pollen morphology could have evolved independently within extant conifer families, as well as in other extinct seed plants (Leslie Reference Leslie2008; Doyle Reference Doyle2010).
If members of the Pinaceae and Podocarpaceae—which diverged before the end of the Paleozoic (Hilton and Bateman Reference Hilton and Bateman2006; Blomenkemper et al. Reference Blomenkemper, Kerp, Hamad, DiMichele and Bomfleur2018; Leslie et al. Reference Leslie, Beaulieu, Holman, Campbell, Mei, Raubeson and Mathews2018)—develop similar morphological deviations under unstressed, near-ambient conditions, then malformation expression is more likely to be shared among other stem lineages that produce saccate pollen. Also, if pollen yields of both families exhibit low morphological variability under near-ambient conditions and higher variability under environmental stress, then paleoenvironmental stresses are likely to account for fossilized pollen malformations irrespective of their botanical affinities. The purpose of this study is threefold: (1) determine malformation type frequency and relative abundances of malformation types (assemblages) produced by extant Pinaceae and Podocarpaceae genera grown under near-ambient conditions, (2) determine whether these baseline malformation type frequencies and assemblages are expressed in a phylogenetically independent manner in modern conifers, and (3) compare how baseline malformation type frequencies and assemblages compare with conifers grown under anomalous environmental stress. To do this, we conducted a baseline study comparing malformation frequencies and assemblages of 14 conifer species grown under near-ambient conditions. We then compared these baseline malformation frequencies and assemblages with those of supplementally UV-B–irradiated Pinus mugo Turra ‘Columnaris.’ In addition to these comparisons, we propose possible developmental origins and ontogeny of different malformation types based on previous cytological literature of modern conifers.
Materials and Methods
Pollen Sample Collection: Baseline Conifers under Near-ambient Conditions
Pollen yields were compared between 14 species representing 8 genera within Podocarpaceae and 6 within Pinaceae (Table 1). Thirteen of these species have bisaccate pollen grains, and one has trisaccate grains, Dacrycarpus dacrydioides (Rich.) de Laub.. Among the bisaccate species, two have poorly developed “vestigial” sacci: Phyllocladus trichomanoides Don and Lagarostrobos franklinii (Hook.) Quinn (Leslie et al. Reference Leslie, Beaulieu, Crane, Knopf and Donoghue2015). For each species, five pollen cones were harvested in 2015–2017 from single reproductively mature tree specimens. These conifers were all cultivated in lowland (30.8–236 m above sea level) botanical gardens, arboretums, university plantings, and residential zones in the continental United States (Supplementary Table 1). Pollen cones were collected between 0 and 2 m above the ground during years in which most trees sampled experienced moderate climatic conditions during microsporogenesis (for details, see Supplementary Table 2). Twelve of 14 sampled trees were irrigated routinely throughout the year via automated sprinklers or drip-irrigation systems. Cedrus libani Rich. and Prumnopitys andina (Poepp. ex Endl.) de Laub. were not provided supplemental water. While P. andina received sufficient water from rainfall during microsporogenesis, C. libani was sampled during a drought year in Berkeley, California, USA. Additionally, 13 out of 14 species were cultivated in open settings, while P. andina grew in the understory of a tree stand dominated by Pseudotsuga menziesii (Mirbel) Franco. Conifer specimens selected for this study had to be mature to produce pollen cones for sampling, and therefore were situated outdoors in their historic planting sites. Given this constraint, tree specimens invariably experienced variation in background microclimatic conditions associated with anthropogenically altered landscapes. We therefore use the term “near-ambient” to describe the variable garden, arboretum, and residential environmental conditions.
In situ saccus malformation incidence of taxa within the Podocarpaceae and Pinaceae.

Pollen cones were collected using stainless steel forceps just before or after opening (indicated by cone yellowing, expansion, and elongation). Dependent on the size, each pollen cone was subsequently placed in a plastic 1.7 ml microcentrifuge tube or a 50 ml centrifuge tube (C2170, Denville Scientific) containing a solution of 95% ethanol (C2H6O; CAS no. 64-17-5) to preserve the sample and avoid sample loss and desiccation-induced grain distortion (Traverse Reference Traverse2007).
UV-B Experiment
Sixty clonal replicates of Pinus mugo ‘Columnaris’ were established for a year before initiating the UV-B environmental chamber experiments (for a more detailed description, see Benca et al. Reference Benca, Duijnstee and Looy2018). All specimens were grown in full sunlight in terra cotta clay pots with peat-amended inorganic substrate to encourage mycorrhizal fungal symbiont establishment for the conifers. The substrate surface was covered by opaque biodegradable horticultural paper to reduce radiation stress on mycorrhizal communities (Klironomos and Allen Reference Klironomos and Allen1995).
Thirty P. mugo specimens were subdivided into five groups of six specimens comprising two control groups and three elevated UV-B treatments. The first control group was grown outdoors under ambient, biologically effective (BE) UV-B regimes at University of California, Berkeley—approximately 7.2 kJ m−2d−1BE (Benca et al. Reference Benca, Duijnstee and Looy2018; UVMRP n.d.). The second control group was grown in an environmental chamber without supplemental UV-B.
In March 2014, one outdoor control group was designated and four chamber subgroups were moved into environmental chambers before pollen cone bud formation, though late enough in the season that changes in photoperiod had primed the plants for pollen production. The specimens were acclimatized to the chambers over a 21-day winter dormancy simulation of 14°C day and 8°C night temperatures with a 12.5-hr photoperiod. After the simulated dormancy, each chamber group was confined to its own respective environmental chamber for dosage control. The chambers were programmed to provide 16°C day and 10°C night temperatures with a 14-hr photoperiod to simulate spring conditions, when pollen cone development and maturation occurs in P. mugo. The groups were exposed to control (no UV-B) and three elevated UV-B treatments: 54, 75, and 93 kJ m−2d−1BE, or 7.5×, 10×, and 13× ambient outdoor UV-B flux. Supplemental UV-B radiation was administered using six high-intensity Spectroline XX-15B lamps. The UV-B lamps were programmed to run for 12 hr a day and covered by 0.8-mm-thick cellulose acetate sheets to filter wavelengths in the UV-C spectrum (100–290 nm), the highest-energy UV wavelengths, which are fully absorbed in the atmosphere before reaching Earth's surface.
Pollen cones were harvested approximately 2 days or fewer before or during cone desiccation/pollen release, using stainless steel forceps. Each pollen cone was subsequently placed in a plastic 1.7 ml microcentrifuge tube containing a solution of 95% ethanol. Based on their maturation timing and distance to the UV-B light source, 96 pollen cones were selected for morphological analysis (see Benca et al. Reference Benca, Duijnstee and Looy2018).
Additionally, 1649 pollen grains were collected from 10 outdoor P. mugo ‘Columnaris’ specimens in the spring of 2013. These grains sampled from outdoor trees before the experiment were photographed and compared in a series of morphometric analyses on the basis of saccus size, number, and placement, as well as corpus length and width (Muddiman Reference Muddiman2014). We specifically incorporated the counts of malformed grains with three sacci and the total malformation frequency data from this morphometric study into our comparisons of three sacci malformation frequencies within malformation assemblages.
Pollen Sample Processing
Centrifuge tubes containing individual cones were manually shaken to suspend pollen grains. Disposable soda-lime glass Pasteur pipettes fitted with 3 ml rubber dropper bulbs (cat. nos. 13-678-6A and 03-448-26, Fisherbrand) were used to extract and transfer pollen and ethanol solution subsamples to empty microcentrifuge tubes. Transferred samples were topped with 95% ethanol solution, shaken, and centrifuged at 3800 rpm for 30 s. The same pipette was used to extract ethanol solution and then fill the tube to 75% volume with 10% potassium hydroxide solution (KOH). KOH-containing tubes were then placed for 6 min into wells of a 110 W dry block heater (12621-104, VWR International) set to 131°C. A K-type thermocouple sensor probe attached to a liquid crystal display instant-read digital thermometer (HYELEC MS6501) was used to read the temperature from the bottom center of the wells. Tubes were removed from wells every 45 s while heating, uncapped to release pressure, shaken, and reinserted into the wells. KOH maceration served to leave only the exine of pollen grains intact but transparent (Traverse Reference Traverse2007). After the KOH treatment, tubes were centrifuged, decanted, and then filled with 95% ethanol solution three times. Following decanting, two drops of safranin O dye (C20H19N4Cl; CAS no. 447-73-6) were added to the sample, and the remainder of the tube was topped with 95% ethanol solution. The tube was then shaken and centrifuged. Most of the volume (85%–90%) of the dye solution was decanted, leaving behind a highly concentrated dyed pollen sample. One drop of glycerol (C3H8O3; CAS no. 56-81-5) was added and mixed into the sample using a flat toothpick (Diamond, Jarden).
Sample slides were made by first placing slides on a slide warmer set to 56°C (XH-2002, Premiere, C&A Scientific). A glass pipette/dropper bulb was then used to transfer dyed pollen samples to the centers of standard microscope slides. Subsamples were left on the slide warmer in a fume hood for 5 min to evaporate residual ethanol. Samples were gently mixed with melted glycerin jelly (7.63% gelatin, 53.4% glycerin, and 0.76% phenol; ~1.5-mm3-sized cubes before melting). A flat toothpick was used to mix the sample with glycerin jelly and then enclosed by a 22 mm × 30 mm × 0.16 mm glass coverslip (12-544-A, Fisherbrand). Mounted slides remained on the slide warmer (set to 56°C) for an additional 30 min to encourage expansion of the sample medium under the cover glass. Slides cooled off to off-gas residual water and ethanol vapor under the fume hood at ~22°C for 2 days. Cover glasses were then sealed by either paraffin embedding or clear nail polish. Five to eight slides were prepared for each pollen cone.
Sample Analysis
In Excel for Mac (v. 16.9), in silico simulations were used to investigate the effect of pollen subsample size on accurately recognizing background frequencies of pollen malformations, that is, the chance of each sampled pollen grain exhibiting malformation = 0.02 (see Benca et al. Reference Benca, Duijnstee and Looy2018: supplementary fig. S3). These simulations showed that subsample sizes exceeding 600 pollen grains do not produce markedly smaller interquartile ranges in subsample outcome variability relative to the increase in effort their analysis requires (Benca et al. Reference Benca, Duijnstee and Looy2018: supplementary fig. S3). Therefore, for each of the conifers growing under near-ambient conditions, 600 pollen grains were morphotyped from each of the 5 cones sampled, yielding a comparison of 3000 pollen grains per taxon. Additionally, for each of the experimental treatments, 8 pollen cones from three trees were selected, resulting in 14,400 pollen grains per treatment. As a result, observations were made on a total of 99,600 individual pollen grains. Pollen grains were morphotyped using a Leica DM2500 microscope fit with differential interference contrast (to render contrast) with 200× and 400× Plan Fluor objectives and HC Plan s 10×/22 oculars (506503, 506144, and 507807, Leica Microsystems).
In bisaccate taxa, pollen bearing two sacci were counted as phenotypically normal (Fig. 1A). Only in the trisaccate species D. dacrydioides was the presence of three sacci counted as the normal condition. Therefore, pollen grains having more or fewer than two sacci and/or fused sacci were scored as malformations in all species aside from D. dacrydioides. For each pollen cone sample, the presence of three categories of pollen malformations were recorded, namely saccus malformations and conjoined and unseparated grains. Each of these categories was subdivided into different traits—saccate malformations (Fig. 1B–H): (1) enlarged saccus, (2) reduced saccus, (3) confluent sacci, and (4) asymmetrical sacci (any grain having heterogeneity in saccus size), (5) asaccate, (6) unisaccate, (7) trisaccate, and (8) >3 sacci conditions; as well as conjoined and unseparated grains (Fig. 1I–K,N–P) and dyads (conjoined and unseparated pooled) (Fig. 1I,N). Both normal and malformed pollen grains were tallied using a two-key desktop laboratory counter (Clay Adams, Becton, Dickinson). Additionally, because a single pollen grain can exhibit multiple abnormalities, the occurrence of each malformed type was scored independently to determine frequency of specific defects within yields. Malformation types were tallied using a 24-key desktop laboratory counter (Vary Tally, Veeder-Root). All grains were morphotyped by one individual (J.P.B.) to minimize deviations in protocol.
Although conjoined and unseparated grains were also counted and photographed, they were excluded from most comparisons in this study due to their rare occurrence. Aborted pollen, compacted, often shriveled, grains less than half the size of normal palynomorphs of a species (Saylor and Smith Reference Saylor and Smith1966), were also excluded from morphological comparisons, as they lack most diagnostic features that would be taxonomically assignable in fossil pollen assemblages.
Imaging
High-resolution images were taken using a Leica DM2500 microscope using differential interference contrast, a Plan Apo 63× oil objective (506187, Leica Microsystems), and a Nikon Digital Sight DS-Fi1 camera with live feed into a Nikon DS-L2 control unit (Nikon). Extended depth-of-field images were generated using Adobe Photoshop CS6 (Adobe Systems). All studied pollen cone specimens (UCMP 390096-390098, 390101, 390102, 390105, 390107-390111, 390114, 390116, 390117, 390119, 390121, 390122, 390124, 390125, 390127-390129, 390131, 390134-390136, 390138, 390139, 390141, 390145, 390147-390149, 390152, 390153, 390156, 390157, 390159, 390161-390163) from UCMP localities (UCMP PA1420 - 1430, 1441) and associated microscope slides (UCMP 243552, 243561, 243600, 243606, 243608, 243611, 243617, 243630, 243641, 243657, 243659, 243666, 243668, 243672, 243674, 243677, 243678, 243686, 243690, 243692, 243709, 243720, 243722, 243723, 243727, 243741, 243749, 243760, 243771, 243782, 243792, 243798, 243805, 243814, 243815, 243833, 243837, 243842, 243846, 243847, 243857, 243863, 243875, 243876, 243900, 243910, 243916, 243917, 243924, 243941, 243947, 243963, 243967, 243968, 243973, 243982, 243984, 243993, 243997) are deposited in the University of California Museum of Paleontology and are accessible upon request.
Comparing Malformations and Multivariate Analyses
When comparing malformation suites produced by different trees, we distinguished between two different but related data sets. The first contains malformation type frequencies, that is, the number of observed occurrences of specific malformation types in a pollen subsample of a certain size (Supplementary Fig. 1), while the second describes the malformation assemblage only, that is, the relative abundances of malformation types within the observed set of malformed pollen of a tree (Supplementary Fig. 1).
All multivariate analyses were carried out using the statistics software package PAST 3.20 (Hammer et al. Reference Hammer, Harper and Ryan2001). Moreover, to reduce a disproportionate influence of rare malformation types in these multivariate analyses, some types were merged (asymmetrical sacci, enlarged saccus, reduced saccus, confluent sacci, asaccate grains, unisaccate grains, trisaccate grains, grains having >3 sacci, unseparated grains, and dyads [conjoined and unseparated pooled]). Only bisaccate-producing taxa were included in the multivariate analyses.
Exploring Phylogenetic Patterns
To facilitate exploration of potential phylogenetic signals in the composition of pollen assemblages (i.e., malformation assemblages and malformation type frequencies; see Supplementary Fig. 1), we graphically summarized multivariate between-sample dissimilarities in a phylogenetic context (as in Leslie et al. Reference Leslie, Beaulieu, Rai, Crane, Donoghue and Mathews2012)—that is, the frequency distribution of dissimilarity values for all pairwise between-cone or between-tree comparisons, grouped according to their estimated phylogenetic distance. We used Bray-Curtis distances (i.e., 1 − d, where d is the Bray-Curtis similarity index) as a measure of dissimilarity between malformation assemblages of all 13 bisaccate pollen–producing trees included in this study (as represented by the pooled abnormalities found in 3000 pollen grains in 5 pollen cones combined per tree, resulting in 78 pairwise assemblage comparisons). Euclidean distances were used to quantify dissimilarities between the suites of malformation type frequencies of all 65 bisaccate pollen cones within this study, resulting in 10 pairwise comparisons within each species and 1950 comparisons of cones between taxa (600 observed pollen grains per cone). Bray-Curtis and Euclidean distance indices were chosen for their capability to express multivariate differences in, respectively, relative abundance data and absolute frequency data. Employing multivariate phylogenetic comparative methods (mPCMs) was considered, but given the caveats and limited applicability of various existing methods (Adams and Collyer Reference Adams and Collyer2018), we decided against the use of such test statistics. Moreover, rather than being explorative tools to detect potential phylogenetic patterns in multivariate phylogenetically structured data, available mPCMs primarily serve as statistical tests of significance to establish whether observed phylogenetic signals or topological autocorrelations may be coincidental or not. We do not observe such patterns in our data. For these reasons, we concluded that, for the purpose of this study, a better solution was to clearly visualize abnormality suite (dis)similarities versus inferred genetic distance.
Malformation Type Frequencies
Multivariate between-species and within-species variation in malformation type frequencies, that is, counts of various malformation types encountered in 600 pollen grains studied in each cone, was further explored in two ways: (1) by calculating 2080 pairwise dissimilarities (here: Euclidean distance) between all malformation type frequencies of all 65 investigated pollen cones from bisaccate pollen–producing taxa in this study; and (2) by visualization in a canonical variates analysis ordination (CVA; aka linear discriminant analysis). Thus, we examined the differences in suites of malformation type frequencies between the 13 bisaccate species, with 5 studied pollen cones each. The multivariate data—here the enumerated malformation types in 600 grains for each cone—are ordered and spaced along axes that are linear combinations of the frequencies of all malformation types maximizing species separation in ordination space.
Malformation Assemblages
For further comparisons in malformation assemblage data between and among baseline specimens under near-optimal conditions along with UV-B–irradiated P. mugo ‘Columnaris,’ we performed a principal component analysis (PCA). To reduce sample size problems while calculating relative malformation type abundance within the malformed pollen assemblage, especially in taxa with very small malformation assemblages, we compared individual trees here rather than comparing the individual cones. As a result, we compared abnormalities within 3000 studied pollen grains representing 5 pollen cones combined per tree, that is, 5 cones × 600 grains. In the P. mugo UV-B experiments, 600 pollen grains per cone were also studied (Benca et al. Reference Benca, Duijnstee and Looy2018), but each tree was represented by 8, rather than 5, pollen cones. To improve the comparability between the experimental and baseline malformation data, we subsampled the UV-B experimental pollen data for each tree 56 times, also combining malformation data of 5 cones from the UV-B experiment but including all unique possible combinations of 5 cones out of the available 8 per tree.
Results
Pollen Malformations in Baseline Conifers under Near-ambient Conditions
Significant (p < 0.05) differences in the total number of malformations occur between Pinaceae and Podocarpaceae (p = 0.012), as well as their respective genera (p = 1.11 × 10⁻⁸) (Fig. 3, Supplementary Tables 3, 4). Grains with saccus malformations represent 0%–2.5% of total yields in genera within Pinaceae versus 0.2%–10.9% in those of Podocarpaceae. Pollen yields of 12 of the 13 bisaccate species exhibited less than 3% malformations (0%–2.5%).
In situ pollen malformation frequencies in unstressed Podocarpaceae and Pinaceae: A, by species (abbreviated to genus name; Afrocarpus gracilior, Nageia nagi, Podocarpus totara, Dacrycarpus dacrydioides, Phyllocladus trichomanoides, Prumnopitys andina, Lagarostrobos franklinii, Manoao colensoi, Picea orientalis, Cathaya argyrophylla, Pinus parviflora, Cedrus libani, Keteleeria evelyniana, Abies koreana); and B, family. Malformation frequency = 100*(no. malformed grains/600 grains per pollen cone); 5 cones per tree.

Only two members of the Podocarpaceae yielded malformation frequencies of more than 3%: one bisaccate species, Nageia nagi (Thunb.) Kuntze (5.2%–7.0% in individual cones, 6.3% total) and the only trisaccate species studied, Dacrycarpus dacrydioides (5.2%–25.5% in individual cones, 10.9% total). When incorporated into a family-wide comparison, these two outlier species give Podocarpaceae a substantially higher malformation percentage (~3.0%, n = 711 of 24,000 grains, 8 genera) than Pinaceae (0.8%, n = 142 of 18,000 grains, 6 genera) (Fig. 3B). In contrast, when N. nagi and D. dacrydioides are excluded from Podocarpaceae, the total saccus malformation percentage for the family (1.1%, n = 195 of 18,000 grains, 6 genera) is similar to that of Pinaceae.
Although significant differences in saccus malformation percentages per individual cone occur between 12 of the 13 bisaccate genera (p = 0.24 × 10⁻³; Supplementary Table 5), there is no substantial difference between the total saccus malformation percentages between these genera (0%–2.5%). Individual cone comparisons of these bisaccate genera show one outlying cone of Lagarostrobos franklinii, which yielded 6% grains with saccus abnormalities, as opposed to 0%–3.3% malformations for all other individual bisaccate cones sampled (Fig. 3A). Nevertheless, there is a significant difference between the malformation frequencies in bisaccate genera (excluding N. nagi) and the one trisaccate lineage compared (D. dacrydioides) (p = 4.74 × 10⁻¹³; Supplementary Table 6).
The distribution of pollen malformations in the different categories compared varies between genera. However, there is little discernible phylogenetic pattern in trait prevalence between genera within and between Pinaceae and Podocarpaceae, both qualitatively (Fig. 4) and quantitatively through comparing malformation assemblages in terms of relative abundance of malformation types (Fig. 5).
Examples of normal pollen grains in comparison with the range of malformation types observed in each of the 14 conifer species studied. Scales for each species represent 20 μm. For accession and specimen information notation see Supplementary Table 2. All specimens and specimen slides are housed in the University of California Museum of Paleontology in Berkeley, California, USA. Afrocarpus gracilior (Pilg.) Page: (1) normal, (2) fused sacci, (3) asaccate, (4) trisaccate, (5) conjoined dyad. Nageia nagi: (6) normal, (7) fused sacci, (8) asaccate, (9) trisaccate. Podocarpus totara: (10) normal, (11) fused sacci, (12) trisaccate, (13) tetrasaccate, (14) conjoined dyad. Dacrycarpus dacrydioides: (15) normal, (16) fused sacci, (17) asaccate, (18) tetrasaccate, (19) conjoined dyad, (20) unseparated triad, (21) conjoined tetrad. Phyllocladus trichomanoides: (22) normal, (23) asaccate, (24) tetrasaccate, (25) conjoined dyad, (26) conjoined triad, (27) unseparated tetrad. Prumnopitys andina: (28) normal, (29) fused sacci, (30) asaccate, (31) trisaccate, (32) unseparated dyad, (33) unseparated triad. Lagarostrobos franklinii: (34) normal, (35) asaccate, (36) unseparated dyad, (37) unseparated triad. Manoao colensoi (Hook.) Molloy: (38) normal, (39) fused sacci, (40) asaccate, (41) conjoined dyad. Picea orientalis (L.) Link: (42) normal, (43) conjoined dyad. Cathaya argyrophylla: (44) normal, (45) fused sacci, (46) asaccate, (47) trisaccate, (48) unseparated dyad. Pinus parviflora Siebold & Zucc.: (49) normal, (50) fused sacci, (51) asaccate. Cedrus libani: (52) normal, (53) fused sacci, (54) unseparated dyad. Keteleeria evelyniana: (55) normal, (56) fused sacci, (57) trisaccate, (58) unseparated triad. Abies koreana: (59) normal, (60) fused sacci, (61) tetrasaccate, (62) unseparated triad, (63) unseparated tetrad.

Malformation assemblages per genus. Extant conifer phylogeny adapted from Leslie et al. (Reference Leslie, Beaulieu, Rai, Crane, Donoghue and Mathews2012). Legend A indicates the color and shape of pollen icons corresponding with normal saccate condition(s) in each genus. These icons are situated left of the pie charts. Legend B refers to the colors corresponding to specific malformation categories visually represented within the pie charts. Gradient in phylogeny color visually signifies that the conifer phylogeny is in large part generated from molecular techniques influenced heavily by crown diversity and that the relationships between these clades in deeper geologic time is less clear (for further discussion, see Leslie et al. Reference Leslie, Beaulieu, Holman, Campbell, Mei, Raubeson and Mathews2018).

Malformation Assemblage versus Phylogeny
Comparing within–malformation assemblage variation between the most distantly related taxa (between families) yielded an evenly distributed range of Bray-Curtis distances (0.31–1.00) (Fig. 6). These between-family Bray-Curtis distances ranged from among the lowest assemblage dissimilarities (within the 7th percentile) to the maximum observed value. Comparison of specimens between sub–family level groups (with estimated divergence times between 150 and 200 Ma) showed a similar spread between the highest and lowest Bray-Curtis distances of the data set (0.18–1.00; the former being the lowest dissimilarity in the data set). Additionally, within–Cedrus group and within–Prumnopitys group malformation assemblage comparisons both displayed high and low dissimilarity values (0.27–0.75 and 0.34–0.83, respectively; or, in terms of percentiles within the total range: 3rd–66th and 11th–77th, respectively), while all assemblages within the Pinus group exhibit higher dissimilarity values (0.64–0.98; i.e., 52nd–97th percentile). Only the pairwise assemblage comparison between the most recently diverging taxa in this study (the Podocarpus group: ~50 Ma), yielded consistently low Bray-Curtis distance values (0.30–0.42; i.e., 4th–22nd percentile). In a regression between malformation assemblage dissimilarities and the estimated age of the last common ancestor of each pair, a very weak positive slope (0.000234) and correlation (r = 0.102) were seen but were not significant (p > 0.37).
Comparisons of malformation assemblages versus phylogenetic distance. Bray-Curtis distances were used as a measure of dissimilarity. A, Distribution of pairwise malformation assemblage dissimilarities plotted in phylogenetic context (as in Leslie et al. Reference Leslie, Beaulieu, Rai, Crane, Donoghue and Mathews2012). Thickness of the lines at each node represents the median of all pairwise dissimilarities between taxa whose lineages diverged in that particular node (dotted lines denote the interquartile range in pairwise dissimilarity values for nodes connecting more than eight pairs. Abbreviations: ABI, Abies koreana; AFR, Afrocarpus gracilior; CAT, Cathaya argyrophylla; CED, Cedrus libani; KET, Keteleeria evelyniana; LAG, Lagarostrobos franklinii; MAN, Manoao colensoi; NAG, Nageia nagi; PHY, Phyllocladus trichomanoides; PIC, Picea orientalis; PIN, Pinus parviflora; POD, Podocarpus totara; PRU, Prumnopitys andina). B, Frequency distribution (box plots of median, interquartile range, and individual data points) of pairwise comparisons within taxonomic groups. The numbers in the phylogenetic tree in A correspond to the same numbers here. Within the Podocarpaceae and the Pinaceae, the groups are ordered based on the estimated age of their last common ancestor. C, Results of correlation and ordinary least squares (OLS) linear regression analysis of all pairwise dissimilarities as a function of the estimated age of the last common ancestor of both taxa in each pair (the dark green area indicates 95% confidence envelope for the regression).

Malformation Type Frequencies versus Phylogeny
In the comparison of all cones of the bisaccate taxa, no increase was observed in dissimilarity between suites of malformation type frequencies and inferred phylogenetic distance between the compared taxa (Fig. 7). Median Euclidean distances between suites of malformation type frequencies within the Prumnopitys group were the lowest, with the median distance within comparisons between Podocarpaceae and Pinaceae being only slightly higher, while the medians for within–Podocarpus group comparisons were highest (i.e., 6.5 for median Euclidean distances within the Prumnopitys group, 9.7 in pairwise comparisons between Podocarpaceae and Pinaceae, vs. 24.9 within the Podocarpus group). The median distances in malformation type frequency for the remaining bins were similar in value (11.2 within the Cedrus group; 12.0 within the Pinus group; 11.3 between podocarpacean groups; 11.8 between pinacean groups). A significant but weak negative correlation was observed in malformation type frequency dissimilarity versus the estimated age of last common ancestor (r = −0.056; p < 0.014; slope: −0.0059). Median intraspecific dissimilarities in malformation type frequencies between cones (within-tree variability) are smaller than those for interspecific comparisons (5.0 vs. 7.4–24.9).
Comparisons of malformation type frequencies versus phylogenetic distance. Dissimilarities are expressed as Euclidean distances. Only bisaccate-pollen-producing species are included. A, distribution of pairwise dissimilarities in malformation type frequencies plotted in phylogenetic context (as in Leslie et al. Reference Leslie, Beaulieu, Rai, Crane, Donoghue and Mathews2012). Thickness of the lines at each node represents the median of all pairwise dissimilarities between taxa whose lineages diverged in that particular node (dotted lines denote the interquartile range in pairwise dissimilarity values. Abbreviations: ABI, Abies koreana; AFR, Afrocarpus gracilior; CAT, Cathaya argyrophylla; CED, Cedrus libani; KET, Keteleeria evelyniana; LAG, Lagarostrobos franklinii; MAN, Manoao colensoi; NAG, Nageia nagi; PHY, Phyllocladus trichomanoides; PIC, Picea orientalis; PIN, Pinus parviflora; POD, Podocarpus totara; PRU, Prumnopitys andina). B, Frequency distribution (box plots of median, interquartile range, and individual data points) of pairwise comparisons within taxonomic groups. The numbers in the phylogenetic tree in A correspond to the same numbers here. Within the Podocarpaceae and the Pinaceae, the groups are ordered based on the estimated age of their last common ancestor. C, Results of correlation and ordinary least squares (OLS) linear regression analysis of all pairwise dissimilarities as a function of the estimated age of the last common ancestor of both taxa in each pair (the dark green area indicates 95% confidence envelope for the regression).

There are several differences in the suites of malformation type frequencies between taxa (Fig. 8). For example, with a mean CVA loading of 10.9 (ranging from 8.7 to 13.9, while all other taxa combined have loadings from −2.9 to 5.4), Nageia nagi dominates the first CVA axis, which captured 64% of the variance in the total data set, exhibiting a high incidence of malformations: 7.8%–10.7% (mean = 8.9%), with 0%–7.5% (mean = 1.71%) for the other 12 taxa, and more than double that of the second highest scoring taxon (Cathaya argyrophylla Chun & Kuang; mean = 4.3%). Also contributing to its outlier status in the CVA is the fact that N. nagi displayed a high frequency of monosaccate grains within its suite of malformation type frequencies: 3.5%–5.3% monosaccates (mean = 4.4%), with 0%–3.2% (mean = 0.5%) for the other 12 taxa. In N. nagi, ranges in malformation and monosaccate frequencies lie outside the envelope of values for all other bisaccate taxa combined. Higher frequencies of monosaccate abnormalities also distinguish Keteleeria evelyniana Mast. from most of the other taxa, albeit to a lesser degree: 1.8%–3.2% monosaccates (mean = 2.4%). Cathaya argyrophylla also deviated from most species studied, displaying a higher frequency of trisaccate grains: 0.33%–1.67% trisaccates (mean = 0.97%), with 0%–0.50% (mean = 0.08%) for all other taxa. Additionally, C. argyrophylla grains had higher frequencies of asymmetrical sacci than all taxa but N. nagi: 0.50%–3.5% asymmetrical sacci (mean = 1.6%) in C. argyrophylla, 1.0%–3.8% (mean = 2.4%) in N. nagi, and 0%–1.3% (mean = 0.16%) for the 11 remaining bisaccate taxa combined. Phyllocladus trichomanoides mainly differed from most by having on average a higher percentage of asaccate grains in its malformation assemblages: 0.73%, compared with a mean of 0.34% for all other bisaccate taxa. In the CVA, taxa within supergeneric, subfamily groups do not cluster relative to their phylogenetic proximity (see color-coded groupings in Fig. 8).
Canonical variates analysis (CVA) ordination of malformation type frequencies. The first two CVA axes capture about 82% of the total variance in malformation type frequency data, that is, counts of various malformation types encountered in 600 pollen grains studied in each cone. Only bisaccate pollen–producing taxa were included. Shaded areas indicate convex hulls enveloping data for all five cones per species. For clarity, vectors clarifying abnormality type loading on the CVA axes have been translated away from the origin. Abbreviations: Abi, Abies koreana; Afr, Afrocarpus gracilior; Cat, Cathaya argyrophylla; Ced, Cedrus libani; Ket, Keteleeria evelyniana; Lag, Lagarostrobos franklinii; Man, Manoao colensoi; Nag, Nageia nagi; Phy, Phyllocladus trichomanoides; Pic, Picea orientalis; Pin, Pinus parviflora; Pod, Podocarpus totara; Pru, Prumnopitys andina. NB: this analysis reflects the absolute frequency of malformation types, not the relative abundance of types within the malformation assemblage.

Discussion
Developmental Origins of Pollen Malformations in Modern Conifers
Here (and in Appendices 1, 2, Fig. 2, Supplementary Fig. 2), we summarize possible developmental origins of pollen malformation types observed in this study that are applicable to the fossil record by drawing upon historical observations in the cytological literature of extant conifers and seed plants. In studies to date, the developmental origins of certain malformation traits have not explicitly been discussed, given that cytological studies on conifer microsporogenesis mentioning them focus on genotypic rather than phenotypic implications of meiotic deviations (Andersson Reference Andersson1947; Runquist Reference Runquist1968; Bazhina et al. Reference Bazhina, Kvitko and Muratova2007a,Reference Bazhina, Kvitko and Muratovab, Reference Bazhina, Kvitko and Muratova2011; Noskova et al. Reference Noskova, Tretyakova and Muratova2009), while morphological studies addressing malformations do not evaluate their developmental origins (Lakhanpal and Nair Reference Lakhanpal and Nair1956; Srivastava Reference Srivastava1961; Mehra and Dogra Reference Mehra and Dogra1965). However, there are inferences that can be made about malformation origins based on what is known about microsporogenesis in saccate conifers and the nature of some morphological deviations. Saccate pollen malformations in the past and present invariably originate from deviations in microsporogenesis that occur during the microspore mother cell and tetrad stages.
Based on previous cytological studies (see Appendix 1), it appears that irregular spindle activity and chromosome stickiness during anaphase and metaphase of meiosis I and II (Supplementary Fig. 2) may generate pollen grains of various sizes that are often aneuploid (have abnormal numbers of chromosomes), such as giant grains as well as conjoined dyads, triads, and tetrads (Fig. 2A–E). In conjoined grains, the dividing walls between joined palynomorphs are incomplete or missing altogether. Interestingly, conjoined palynomorphs can develop sacci in the same locations and orientations as normal grains in tetrad configuration, as illustrated in Figure 2C–E, suggesting saccus malformations are not necessarily determined by disruptions to meiosis.
The early tetrad stage coincides with peak tapetal activity (Oliver et al. Reference Oliver, Van Dongen, Alfred, Mamun, Zhao, Saini, Fernandes, Blanchard, Sutton, Geigenberger and Dennis2005) and disruptions (see Appendix 2) can inhibit these sporophyte cells from delivering metabolites essential to pollen grain development and function to developing microspores (Ahmed et al. Reference Ahmed, Hall and Demason1992). Saccus development initiates early in the tetrad stage (Ferguson Reference Ferguson and Evermann1904; Wilson Reference Wilson1965) and ends at the end of the tetrad stage (Dickinson and Bell Reference Dickinson and Bell1970). This means malformations in saccus shape, size, orientation, or number must structurally develop while pollen grains are early in the tetrad stage, before the nexine layer is deposited (Fig. 2F–L), capturing morphological fingerprints of environmental stress that are inherently locked into the pollen exine layer and thereby subject to fossilization. Unseparated dyads, triads, and tetrads are composed of grains that are not fused to one another and appear to have fully formed pollen walls at their contact point(s). These configurations most likely result from deviations in the late tetrad stage (Fig. 2M–O), possibly in association with disruptions to callose deposition or breakdown between grains. This causes the outer exine of the proximal contact faces of pollen to be stuck together in original tetrad configuration following incomplete breakdown of the callose wall and surface coat.
Modern Baseline Comparison
Overall, malformations with saccus deviations comprised 0%–6.0% of bisaccate pollen yields per cone and 0%–2.5% of all bisaccate pollen (when excluding Nageia). In contrast, saccus deviations represented 5.2%–25.5% of pollen yields from cones and 10.9% total in the only trisaccate species studied, Dacrycarpus dacrydioides. Pollen malformations comprise less than 3% of pollen in healthy, unstressed bisaccate pollen-producing trees; more than 3% in a bisaccate conifer (Nageia) that likely experienced an environmental stress, that is, anomalously cold temperatures during microsporogenesis); and more than 3% in a healthy, unstressed trisaccate pollen-producing conifer.
Nageia nagi represents the only geographic outlier to our temperate midlatitudinal sampling on the Pacific Coast of the United States (Gainesville, Fla., USA; 29°N; Supplementary Table 1) and displays significantly higher malformation frequency (6.3%) than all other bisaccate genera (0%–2.5%). Although this tree was exposed to higher ambient UV-B regimes than all other taxa studied (Supplementary Table 2), its heightened malformation frequency is more likely a stress response to anomalous below-freezing temperatures (−3.8°C) experienced during microsporogenesis (Supplementary Table 2), as the tree was acclimatized to heighted background UV-B regimes relative to higher latitudes, but not subfreezing temperatures. A similar situation has been observed in malformation-producing Pinus edulis Engelm. studied by Chira (Reference Chira1967). In addition to N. nagi, Cedrus libani contrasted with all other taxa sampled in producing its pollen cones during autumn rather than spring and did experience a summer drought in Berkeley, California, without supplemental irrigation (Supplementary Table 2). Nevertheless, malformations represented less than 3% of pollen yields in this specimen. Although many pollen grains produced by C. libani were aborted, all aborted grains were bisaccate, and none exhibited morphological deviations apart from being undersized and shriveled.
The current study shows that under near-ambient, present conditions, pollen malformations, although always present, are infrequently expressed, and their frequencies do not show significant variation between most modern bisaccate conifer lineages that we compared. Looking for a phylogenetic signal in the comparison of malformation type frequencies between cones of bisaccate taxa, it would be expected that dissimilarity increases with greater phylogenetic distance. However, we observed the contrary—a significant, albeit weak negative correlation between Euclidean distance and estimated time of divergence (Fig. 7). Furthermore, comparisons between Podocarpaceae and Pinaceae yielded the second-lowest median Euclidean distance values. In contrast, comparisons within the group with the youngest divergence times, the Podocarpus group, produced a median Euclidean distance more than twice that of the runner-up (comparisons between pinacean groups). These two contrasting end-members (high dissimilarity within the Podocarpus group and low dissimilarity between Podocarpaceae and Pinaceae) are driving the observed negative correlation. The only aspect consistent with our initial expectations for a straightforward phylogenetic signal was that Euclidean distances between suites of malformation type frequencies within the Prumnopitys group are almost consistently low and displayed the lowest median Euclidean distance of any bin.
Morphological conservatism of bisaccate pollen grains under near-ambient growth conditions suggests that upticks in their malformation frequencies within fossil (Foster and Afonin Reference Foster and Afonin2005), subfossil, and modern assemblages (Wilson Reference Wilson1965; Pocknall Reference Pocknall1981; Tretyakova and Noskova Reference Tretyakova and Noskova2004; Benca et al. Reference Benca, Duijnstee and Looy2018) likely reflect the influence of an environmental challenge on microsporogenesis within gymnosperms. Previous studies have used a benchmark of >3% or >4.5% malformed grains in pollen yields of extant and fossil gymnosperms to infer stressed growing conditions (respectively, Foster and Afonin Reference Foster and Afonin2005; Lindström and McLoughlin Reference Lindström and McLoughlin2007). We also observed <3% pollen malformations in all but two individual cone yields of 12 of the 13 bisaccate pollen–producing genera studied (Fig. 3A). Additionally, these baseline conifers inevitably experienced variable, low-grade, background stresses associated with anthropogenically altered landscapes, such as light pollution, that would not afflict pre-industrial gymnosperms. Such conditions could account for the substantially wider range of meiotic irregularities previously reported in Abies sibirica Ledeb. specimens grown in arboretum settings than in natural ecosystems (Bazhina et al. Reference Bazhina, Kvitko and Muratova2007a). Modern thresholds for environmental stress based on cultivated trees (and to some extent, natural ecosystems) could therefore be higher than in the deep past. Under this consideration, our observation confirms that the lower of the pre-existing benchmarks (>3%; Foster and Afonin Reference Foster and Afonin2005) for dispersed pollen in palynological records (i.e., time-averaged assemblages representing a mixed signal of many pollen-producing individuals in a region) holds well as a conservative estimate and will not have to be raised.
Some of the contrasts in baseline malformation expression and lack of a clear phylogenetic signal we observe between modern bisaccate genera could result from contrasts in developmental timing between taxa. In particular, variability in seasonal timing of meiotic stages has been documented between some members of Pinaceae. For example, conifers such as Larix decidua Miller and Pseudotsuga menziesii halt meiosis at the diplotene stage to undergo winter dormancy, while Tsuga heterophylla (Rafinesque) Sargent overwinters in the pachytene stage (Kurmann Reference Kurmann, Blackmore and Knox1990). In such cases, pollen grains of different taxa might be exposed to contrasting environmental stimuli depending upon which stages of meiosis are undergone before and after dormancy. Additionally, the phase in which meiosis pauses in some taxa may be more sensitive to abiotic stresses than in others, potentially leading to some lineages being more acutely impacted by certain stresses. This variation might contribute to contrasts in malformation expression seen among garden specimens over a single year. For example, a cold snap in autumn might not be experienced during the same stage of meiosis in different conifer species the following spring. However, it is unlikely that this contrast in seasonal timing would confound detecting larger-scale environmental perturbations such as ozone weakening, mercury deposition, or acid rain over depositional timescales and larger spatial scales. The ephemeral, infrequent, and highly local or regional nature of seasonal perturbations such as cold snaps would not likely stand out in space- and time-averaged palynological records.
Pollen Malformation as a Stress Response
In this study, we find that increased frequencies in pollen malformations have the potential to record historical and modern environmental stress in gymnosperms, with some exceptions. Specifically, high morphological plasticity of one of the few remaining conifer lineages producing trisaccate grains (Dacrycarpus dacrydioides) indicates that not all saccate pollen (such as natural trisaccates) are suitable for environmental stress assessments. Additionally, morphological deviations may be diverse and variable within pollen yields of modern conifer populations due to continuous, nonepisodic variation in environmental stress levels experienced by the tree associated with variations in elevation. Further study of pollen malformation occurrence across elevation transects are therefore needed to further evaluate the utility of pollen malformation as an environmental stress proxy. Nevertheless, the share of geographically rare high-elevation pollen in time-averaged palynological samples generally dominated by basinal, rather than upland floras would be limited, and unlikely to significantly skew the palynological record.
Heightened frequencies of pollen malformations may also be interpreted as a symptom of reproductive distress in seed plant populations but may not always be its source. For example, Benca et al. (Reference Benca, Duijnstee and Looy2018) found all UV-B–irradiated Pinus mugo groups sampled for this study aborted their ovules before pollination receptivity, experiencing their reproductive bottleneck through the premature death of their megagametophytes. Furthermore, population-wide sterility in this instance occurred under the lowest end-Permian projected UV-B treatment, in which pollen yields still exhibited less than 3% malformations. This observation indicates that thresholds for some environmental stresses to exert deleterious effects on plant reproductive development can be lower than those required for generating indicative heightened malformation frequencies. The onset of pollen malformation production may therefore be an indicator of severe environmental deterioration.
Although certain morphological deviations in both fossil and modern pollen walls can be inferred to result directly from certain types of developmental disruptions, traceable to specific stages in meiosis I and II (Chira Reference Chira1967; Bazhina et al. Reference Bazhina, Kvitko and Muratova2007a,Reference Bazhina, Kvitko and Muratovab, Reference Bazhina, Kvitko and Muratova2011; Noskova et al. Reference Noskova, Tretyakova and Muratova2009) (Fig. 2), it can be difficult to infer presence of a specific environmental stress using higher frequencies of developmental deviations alone, as they arise from numerous genotype by environment interactions (Veilleux and Lauer Reference Veilleux and Lauer1981). However, it is possible to constrain the range of plausible stresses by integrating bisaccate pollen malformation frequencies with other independent lines of geological evidence, when present. Additional lines of evidence for certain types of past environmental stress may include changes in palynological, paleobotanical, and faunal assemblages; palynomorph wall chemistry (Watson et al. Reference Watson, Sephton, Sephton, Self, Fraser, Lomax, Gilmour, Wellman and Beerling2007; Lomax et al. Reference Lomax, Fraser, Sephton, Callaghan, Self, Harfoot, Pyle, Wellman and Beerling2008; Fraser et al. Reference Fraser, Scott, Forbes, Glasspool, Plotnick, Kenig and Lomax2012); and geographic and temporal proximity to point sources of environmental perturbation, such as volcanic eruptions, as well as geochemical and geophysical data of associated sediments (Broadley et al. Reference Broadley, Barry, Ballentine, Taylor and Burgess2018; Lindström et al. Reference Lindström, Sanei, van de Schootbrugge, Pedersen, Lesher, Tegner, Heunisch, Dybkjær and Outridge2019; Chu et al. Reference Chu, Dal Corso, Shu, Haijun, Paul, Grasby, van de Schootbrugge, Zong, Wu and Tong2021). Moreover, because this malformation baseline study has shown that differences may exist in the composition of malformation types (see next section), it may well be possible that a detailed study of the malformation assemblage composition could be used as a tool for narrowing what specific stressor may have caused elevated levels of bisaccate malformations in palynological records. We demonstrate that a specific environmental stressor—here elevated UV-B exposure—significantly skews the expression of malformation types within pollen assemblages outside the range of variation that would be considered normal, and we advocate further studies into stressor-specific alteration of pollen malformation assemblages and its potential paleoenvironmental proxy value.
Comparing Malformations between Baseline and UV-B-irradiated Conifers
In environmental chamber experiments in which reproductively mature specimens of P. mugo ‘Columnaris’ were exposed to a range of biologically effective UV-B dosages (0×, 7.5×, 10×, and 13× ambient UV-B levels), we showed earlier that the frequency of pollen malformations increased four- to fivefold under the two highest UV-BBE fluxes when compared with background frequencies (approximately 2%) for the two lower UV-B regimes (Benca et al. Reference Benca, Duijnstee and Looy2018). Just as in the current study, different types of malformations had been enumerated (but have not previously been reported), thus making a comparison possible between UV-B–induced malformation assemblages and the baseline of background assemblages across the phylogenetic tree of bisaccate pollen producers. In a PCA of relative abundances of various malformation types within the malformation assemblage of each investigated tree (Fig. 9), it is clear that—within the UV-B experimental data—there is a directionality toward greater contribution of three-sacci aberrancies (unnatural trisaccates) and narrowing of malformation diversity with increasing UV-B stress. By comparison, the malformation assemblages in the unstressed taxa of the current study are much more diverse. Moreover, the spread of unstressed malformation assemblages in ordination space, that is, the main variation in malformation assemblage composition, is perpendicular to (independent of) the type of change induced by UV-B stress in P. mugo.
Principal component analysis (PCA) of malformation assemblages in unstressed conifers and UV-B experiments. Malformation assemblages encountered in 13 taxa in this study are compared to those in Pinus mugo ‘Columnaris’ trees that grew under various UV-B radiation stress regimes (no UV-B and 7.5×, 10×, and 13× ambient outdoor fluxes of biologically effective UV-B radiation for Berkeley, California, USA, in spring, or respectively, 0, 54, 75, and 93 kJ m−2d−1BE UV-B; see Benca et al. Reference Benca, Duijnstee and Looy2018). Relative abundances of malformation types within tree-specific malformation assemblages are used in this analysis. Each malformation assemblage comprises the encountered malformed grains in 3000 investigated pollen grains per tree, that is, 600 grains × 5 pollen cones per tree. In the UV-B experiments, 8 pollen cones per P. mugo ‘Columnaris’ tree were investigated. Shown here are the malformation assemblages of all 56 combinations of 5 cones in a set of 8. The first two PCA axes account for 74% of the variance in the malformation data. Only bisaccate pollen–producing taxa were included. For clarity, vectors indicating abnormality type loading on the PCA axes have been translated away from the origin.

Focusing on the aforementioned prevalence of three-sacci aberrancies in UV-B experiments relative to all pollen abnormalities (Fig. 10), with a fraction of 20% in the outdoor control for P. mugo specimens, three-sacci aberrancies made up a relatively large portion of all pollen malformations when compared with most other unstressed taxa in this study, but similar to that of C. libani, Abies koreana Wilson, Podocarpus totara Benn. ex Don var. aurea, and Cathaya argyrophylla. However, in UV-B–stressed P. mugo specimens, the contribution of three-sacci aberrancies increases with UV-B dosage levels up to around 80%—even more pronounced than the spike in total malformation frequency. Although there was considerable between-cone variation within each treatment group in the UV-B experiments with respect to malformation frequency (see the scatter of small circles in the upper left half of Fig. 10), the relative contribution of three-sacci abberancies to the malformation assemblage was quite constant within each treatment (as confirmed by highly significant regression results in Fig. 10) but varied between the treatments (as illustrated by increasing slopes in the regressions with: low for low UV-B dosages that induced few malformations; high for high UV-B stress levels that triggered high malformation frequencies). This means that any additional malformed pollen grains that were produced as a result of experimentally induced elevated UV-B exposure almost exclusively had three sacci. This suggests that, in addition to malformation frequency, the composition of malformation assemblages encountered in the palynological microfossil record may hold information on ecological stress levels in the terrestrial environment—and potentially even on the type of stressor if future studies were to reveal that it is specifically UV-B stress that causes conifers to produce bisaccate pollen with three sacci.
Frequency of three saccus malformation versus frequency of all pollen malformations in unstressed conifers and UV-B experiments. The lower right part (subdiagonal) shows mean frequencies. Green filled circles represent the taxa in this study (frequencies based on 3000 grains per tree). Larger circles indicate Pinus mugo UV-B experimental data (based on 4800 grains per treatment: 600 grains × 8 pollen cones for each of 3 tree replicates; UV-B treatments (0, 54, 75, and 93 kJ m−2d−1BE) are respectively labeled: noUV, 7.5×UV, 10×UV, and 13×UV; see Benca et al. Reference Benca, Duijnstee and Looy2018) and pooled data for multiple outdoor control trees (based on 1649 grains; labeled 1×UV, 2013). The upper left part (supradiagonal) is similar to the subdiagonal part but mirrored in the diagonal. It shows ordinary least squares (OLS) linear regression of the per-cone three-sacci malformation frequency as function of the total malformation frequency in the UV-B P. mugo experiments (thick lines; shaded areas indicate 95% confidence envelope for the regression). Each small circle is based on 600 grains from a single cone. For clarity, both axes were square-root-transformed to avoid crowding of the many data points occurring at lower frequencies.

Natural Trisaccates and Malformed Bisaccates in the Present and Past
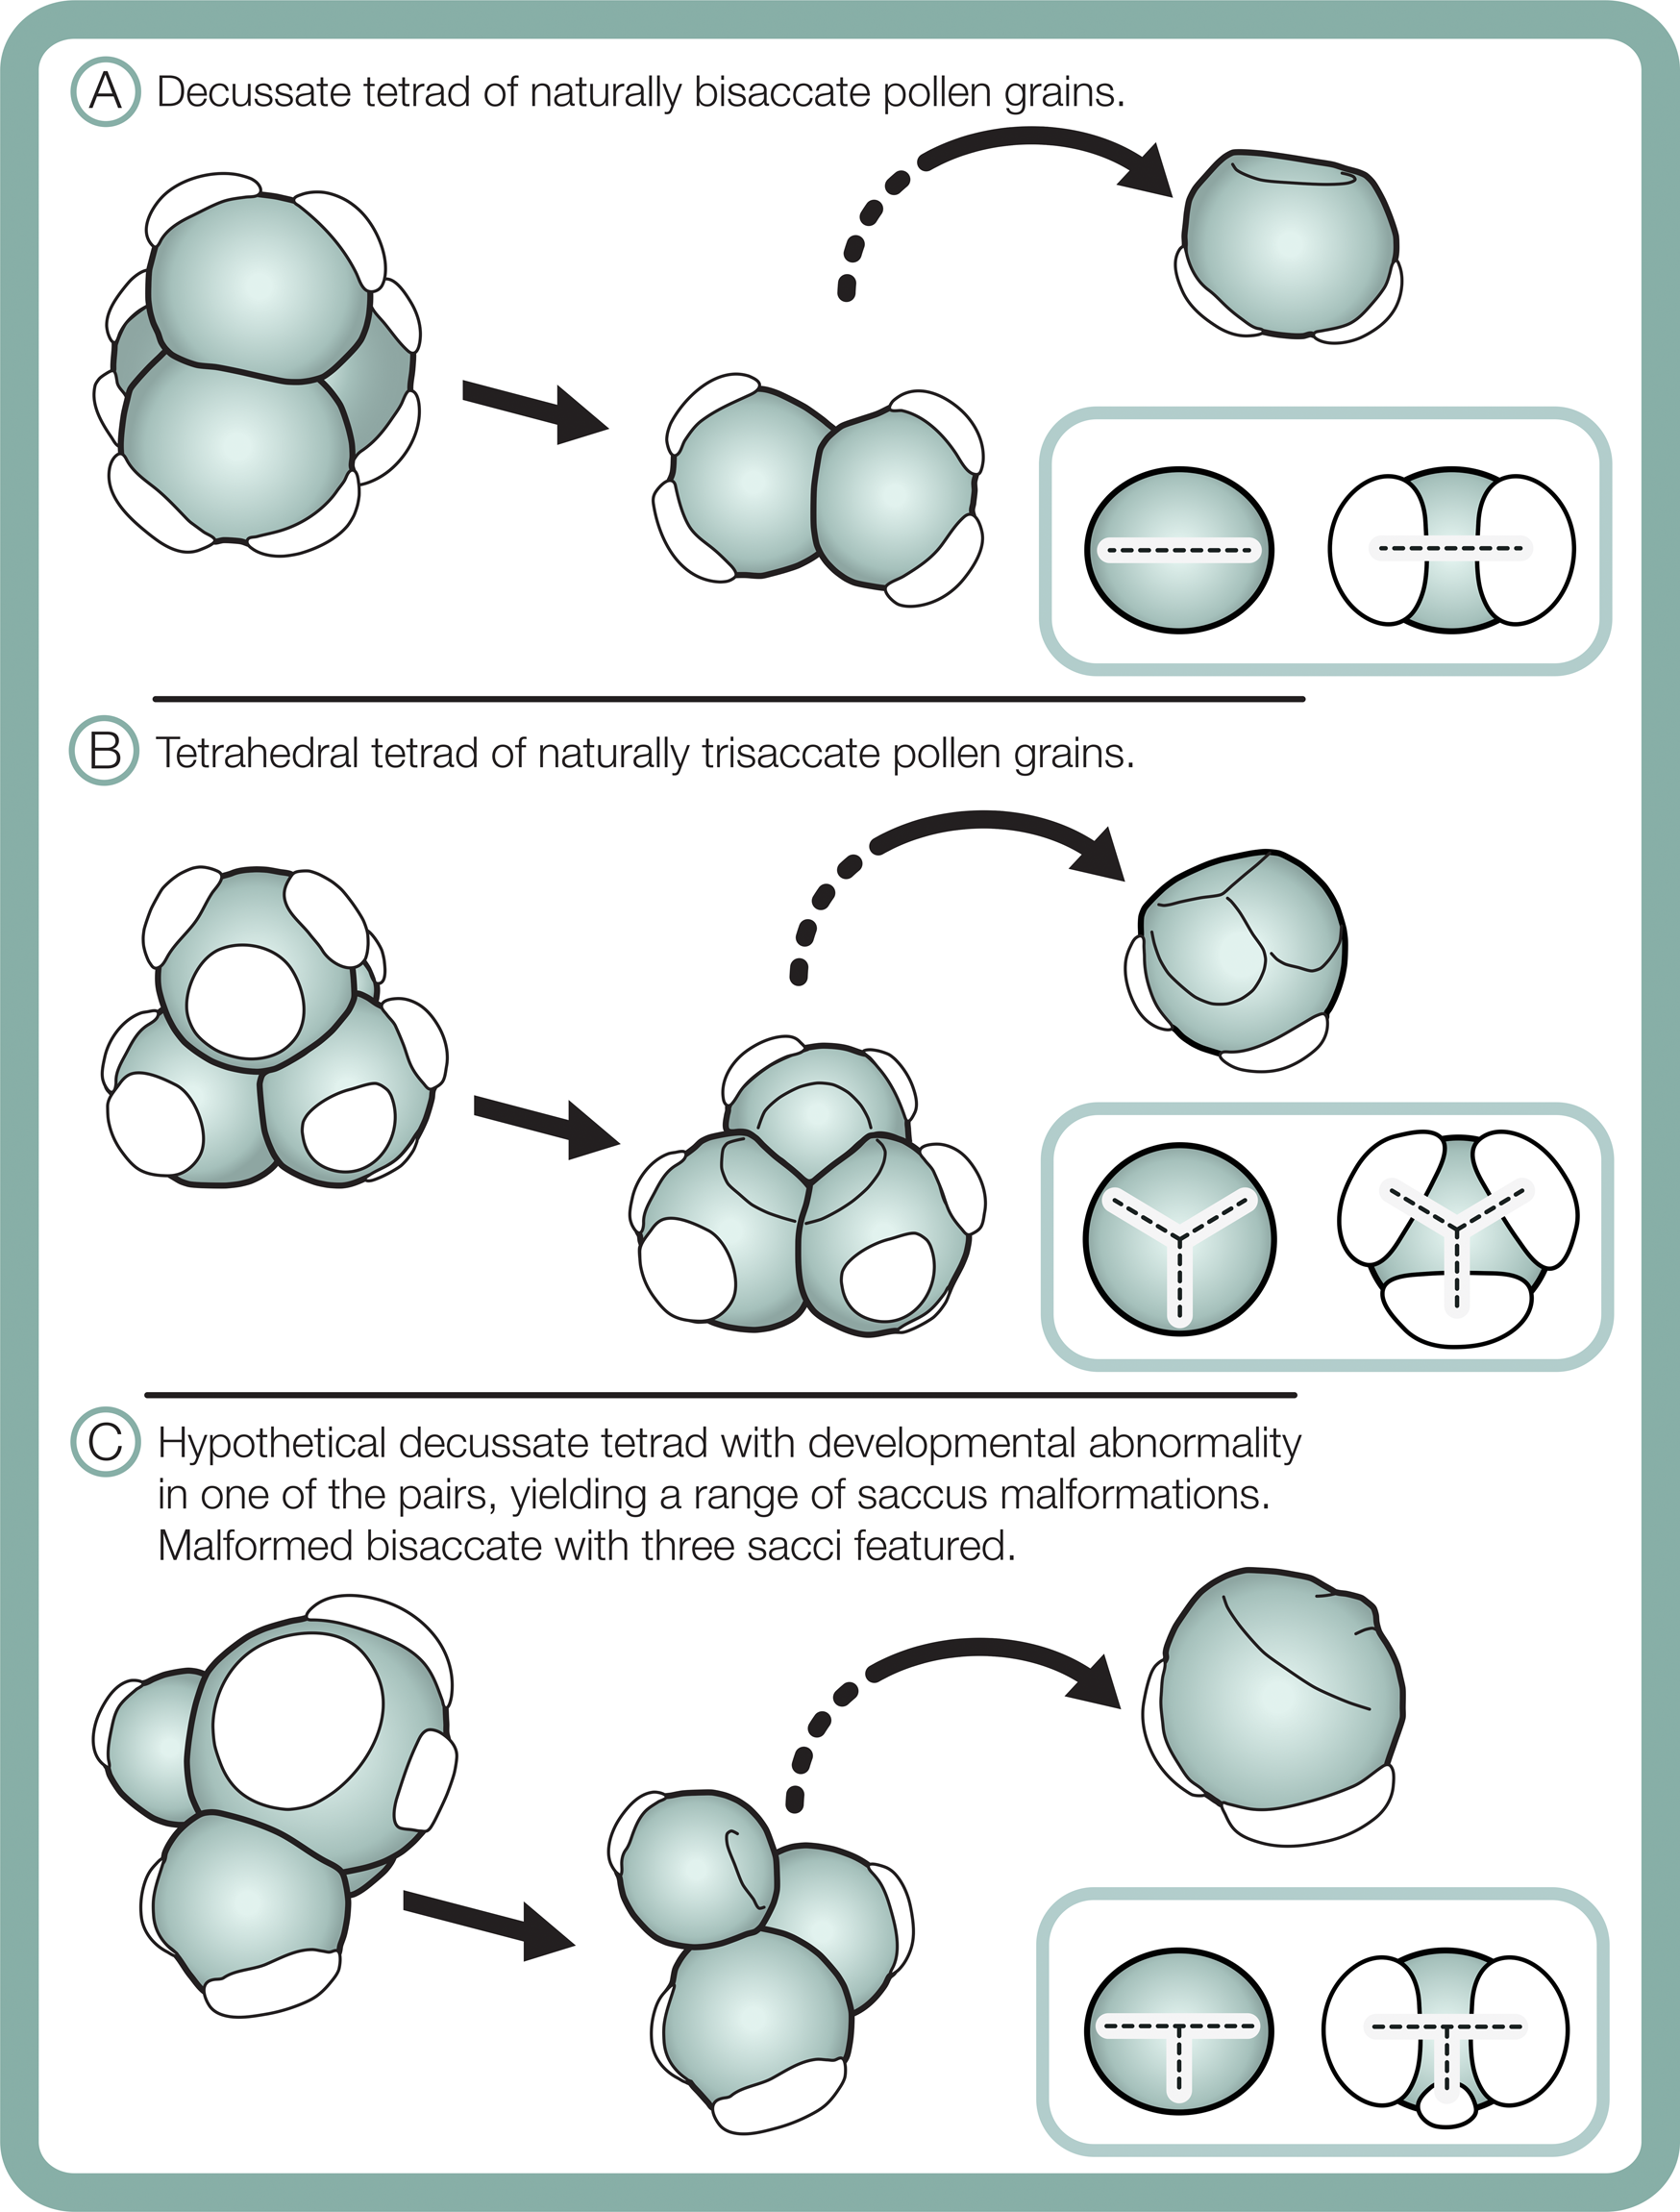
Differences in morphological plasticity in sacci between the studied bisaccate and trisaccate pollen producing extant conifers may result from contrast in pollen shapes and their tetrad configurations during meiosis. Bisaccate pollen grains, such as those of Pinus, are bilaterally symmetric and form in decussate tetrads, in which the four pollen grains are arranged in two pairs oriented in two different planes (Fig. 11A) (Halbritter et al. Reference Halbritter, Ulrich, Grímsson, Weber, Zetter, Hesse, Buchner, Svojtka and Frosch-Radivo2018). In contrast, the naturally trisaccate pollen grains of D. dacrydioides have been documented as occurring in more than one type of tetrad configuration, specifically tetrahedral tetrads, in which the centers of the four grains form a tetrahedron (Fig. 11B) (Halbritter et al. Reference Halbritter, Ulrich, Grímsson, Weber, Zetter, Hesse, Buchner, Svojtka and Frosch-Radivo2018), as well as decussate tetrads (Huynh Reference Huynh1968; Huynh and Sampson Reference Huynh and Sampson1983). Given that sacci form during the tetrad stage, it is likely that the ability of naturally trisaccate pollen such as D. dacrydioides to form in numerous tetrad configurations enables greater variation in saccus number, shape, division, and orientation around the circumference of their radiosymmetric grains than those of naturally bisaccate taxa.
Schematic of tetrad configurations and resulting sacci symmetry in naturally bisaccate pollen grains (A), naturally trisaccate pollen grains (B), and a malformed bisaccate pollen grain having three sacci (C).
Furthermore, changes in saccus arrangement and symmetry, for example, fusion or asymmetry in size and/or shape, may have less influence on buoyancy and flotation against gravity through micropylar pollination drops in radiosymmetric naturally trisaccate grains than in bilaterally symmetric bisaccate grains. Another possibility is that because the bisaccate condition is likely to be ancestral to modern Dacrycarpus (Leslie et al. Reference Leslie, Beaulieu, Crane, Knopf and Donoghue2015), the plasticity of saccus orientation and shape observed may result from this lineage trending toward a fixed trisaccate character state. Regardless, the observation that a modern seed plant lineage with trisaccate pollen grains displays highly variable saccus morphology should caution against use of similar pollen types in the fossil record for environmental stress assessments.
Although comparative morphometric shape analyses are needed, saccus arrangement and proportionality may aid in distinguishing between naturally occurring trisaccate pollen and malformed bisaccate pollen grains having three sacci. In terms of symmetry, sacci in naturally trisaccate circular pollen grains of D. dacrydioides have been shown to initiate at the terminals of a triradiate ridge that sometimes appears during early pollen grain ontogeny (Fig. 11B) (Huynh and Sampson Reference Huynh and Sampson1983). Interestingly, in Tsuga canadensis (L.) Carrière, a member of Pinaceae that also produces its pollen grains in tetrahedral tetrads, the pollen grains exhibit the same triradiate ridge as D. dacrydioides early in ontogeny that later vanishes and forms a single, lateral ring-like saccus fringing their circular grains (Kurmann Reference Kurmann, Blackmore and Knox1990). Radially symmetric saccate grains therefore seem to be generated as a result of developing in tetrahedral tetrads and generating marginal sacci around a circular periphery in both Podocarpaceae and Pinaceae (Fig. 11). Bisaccate grains, in contrast, exhibit bilateral symmetry, resulting from the decussate tetrad arrangement, and establish a dominant single plane of sacci alignment (Fig. 11). In the case of bisaccate malformations having three sacci, any superfluous sacci tend to be smaller than—and not symmetrically aligned with—the plane of the dominant pair (Fig. 11). Consequently, sacci in naturally trisaccate grains are arranged at the terminals of a trilete (almost Y-shaped) radial axis, while those in aberrant bisaccate grains having three sacci are arranged along the terminals of a modified T-shaped axis with two large sacci and one more or less centrally oriented, smaller saccus that is offset from the main axis of symmetry (Fig. 11).
Seed plants interpreted to produce naturally trisaccate pollen grains appear to be rare in the fossil record and seem to be restricted to conifers with a Podocarpaceae and Araucariaceae affinity. Trisaccate pollen (e.g., Microcachryidites, Trichotomosulcites [syn.: Trisaccites], and Podosporites) with a Podocarpaceae affinity are distinctive elements in Jurassic to Cretaceous sediments from southern Gondwana (e.g., Schrank Reference Schrank2010), and some of the Cenozoic forms of the latter taxa are thought to represent the conifer genera Microcachrys and Microstrobos (Mildenhall and Byrami Reference Mildenhall and Byrami2003). Bisaccate and trisaccate Callialasporites pollen were also thought to be associated with Podocarpaceae but have recently been described from an Early Cretaceous araucariaceous pollen cone (Kvaček and Mendes Reference Kvaček and Mendes2020).
Latest Permian trisaccate and/or malformed pollen have been shown to represent aberrant forms of bisaccate taxa since Foster and Afonin (Reference Foster and Afonin2005) depicted morphological deviations within the alete taxa Klausipollenites schaubergeri (Potonie et Klaus) Jansonius and Alisporites sp., and observed similar forms within the taeniate taxa Scutasporites, Lunatisporites, Protohaploxypinus, and Hamiapollenites (Foster and Afonin Reference Foster and Afonin2005; Fijałkowska-Mader Reference Fijałkowska-Mader, Guex, Miller and Torday2020). As a result, some taxa such as the protosaccate pollen Triadispora crassa Klaus, are now interpreted to have aberrant forms historically described as different species (Fijałkowska-Mader Reference Fijałkowska-Mader, Guex, Miller and Torday2020).
Can Past Polyploidization and Hybridization Events Account for Pollen Malformation Spikes in the Fossil Record?—It could be misconceived that high prevalence of abnormal spores and pollen in time-averaged fossil assemblages would indicate widespread hybridization, polyploid evolution, or assumed polyploid advantage under environmental stress. Here we describe the rationale behind these explanations and why they are unlikely to account for teratology spikes in the fossil record on the basis of existing biological data.
A significant positive correlation between pollen grain size and ploidy level has been documented in angiosperms such as Arabidopsis thaliana (L.) Heynhold (Altmann et al. Reference Altmann, Damm, Frommer, Martin, Morris, Schweizer, Willmitzer and Schmidt1994), as well as between spore size traits and genome size in some leptosporangiate ferns (Adiantum pedatum complex; Barrington et al. Reference Barrington, Patel and Southgate2020). By this logic, unreduced pollen grains would be expected to be larger in size than reduced grains produced by the same plant specimen. Although this assumption has yet to be morphometrically tested in modern saccate conifers, oversized (giant and unseparated) grains produced by conifers have been noted as being unreduced (specifically having ≥2n gametes) in previous studies (e.g., Chira Reference Chira1967). Unreduced palynomorphs have also been observed to occur in higher frequencies in hybrids than in non-hybrids (Ramsey and Schemske Reference Ramsey and Schemske1998) and substantially increase in frequency under some environmental stresses such as cold shock in several eudicot angiosperms (Belling Reference Belling1925). Their development represents a major route of polyploid evolution in modern plants (Ramsey and Schemske Reference Ramsey and Schemske1998).
There is also growing interest in the possibility of polyploidizations (whole-genome duplications) being associated with mass extinction events. This prospect was raised by a potential signal of whole-genome duplications around the Cretaceous/Paleocene boundary (~66 Ma) inferred from full-genome sequences of 38 angiosperm species (Vanneste et al. Reference Vanneste, Baele, Maere and Van de Peer2014). Around another crisis, the Triassic/Jurassic transition (~200 Ma), Kürschner et al. (Reference Kürschner, Batenburg and Mander2013) found increased frequencies of fossilized unseparated dyads, triads, tetrads, and oversized grains of the non-saccate pollen Classipolis. These are hypothesized to represent unreduced (2n) conifer pollen grains of the extinct conifer family Cheirolepidiaceae. On this basis, it has been argued that polyploidy in Cheirolepidiaceae around the Triassic/Jurassic transition may have reduced their extinction risk and driven their subsequent diversification (Kürschner et al. Reference Kürschner, Batenburg and Mander2013). Although numerous modern polyploid taxa display greater resistance to pests, reduced nutrient stress sensitivity, lower drought susceptibility, and/or greater ability to persist under extreme temperatures than their diploid congenitors (Levin Reference Levin1983), there are numerous polyploid species countering this trend, and recently formed polyploid species have higher extinction rates than their diploid relatives (Arrigo and Barker Reference Arrigo and Barker2012). On this basis, hypotheses of polyploid advantage in wholly extinct plant lineages are less convincing.
Although few conifer species today are polyploid (~1.5%; Khoshoo Reference Khoshoo1961), Li et al. (Reference Li, Baniaga, Sessa, Scascitelli, Graham, Rieseberg and Barker2015) found evidence based on phylogenomic analyses of transcriptomes from 24 gymnosperms and 3 outgroups (a lycophyte, a fern, and an angiosperm), suggesting early whole-genome duplication events occurred early in the evolutionary history of modern conifers. This study raised the question of whether early polyploid conifer lineages may have experienced a selective advantage over their diploid contemporaries during the end-Permian crisis. However, the window of timing for whole-genome duplication in Pinaceae inferred by Li et al. (Reference Li, Baniaga, Sessa, Scascitelli, Graham, Rieseberg and Barker2015) is temporally broad, spanning the Carboniferous through Triassic Periods (342–200 Ma). Moreover, detection of a polyploid ancestor in modern conifers does not imply that the ancestral lineage had elevated diversification rates, as polyploidy can be neutral, or even detrimental, and still leave behind an ancestral signal within the lineage (Meyers and Levin Reference Meyers and Levin2006; Scarpino et al. Reference Scarpino, Levin and Meyers2014). At this point, there is no strong evidence demonstrating that polyploidization events directly caused increased diversification of plant lineages in the deep past (Mayrose et al. Reference Mayrose, Zhan, Rothfels, Magnuson-Ford, Barker, Rieseberg and Otto2011; Rothfels and Otto Reference Rothfels, Otto and Kliman2016). Additionally, the few studies on modern plants comparing “success” of polyploids versus related diploids on an ecological and geographic basis have failed to identify any advantage for polyploids (Petit and Thompson Reference Petit and Thompson1999; Martin and Husband Reference Martin and Husband2009; Rothfels and Otto Reference Rothfels, Otto and Kliman2016). Therefore, further studies testing hypotheses of polyploid adaptive or exaptive advantages in plants under anomalous environmental stresses are needed.
We caution against extrapolating polyploidization, hybrid proliferation, and assumed polyploid advantage under stress as an explanatory mechanism behind saccate pollen malformation spikes during extinction events (e.g., Neale et al. Reference Neale, Barnes, Robson, Neale, Williamson, Zepp, Wilson, Madronich, Andrady, Heikkilä and Bernhard2021) on the basis of two observations of extant lineages and one from the fossil record: (1) unreduced, malformed pollen grains have been found to be either completely sterile or require specialized conditions to germinate in vitro relative to normal haploid grains (Chira Reference Chira1967), and their presence is associated with a large fraction of defective grains in pollen yields (Bazhina et al. Reference Bazhina, Kvitko and Muratova2007a, Reference Bazhina, Cedaeva and Muratova2019); (2) saccate pollen malformations associate with population-wide sterilization of ovules in UV-B–irradiated conifers (Benca et al. Reference Benca, Duijnstee and Looy2018); and (3) saccate pollen malformation spikes occur amid and/or during deforestation events in the end-Permian crisis (Hochuli et al. Reference Hochuli, Schneebeli-Hermann, Mangerud and Bucher2017; Mishra et al. Reference Mishra, Aggarwal and Jha2018). If anything, malformed saccate pollen grains appear to signal reduced reproductive fitness, that is, lowered capacity of individuals to pass their genes on to subsequent generations, rather than signals of polyploid adaptive advantage, hybrid swarms, or range expansions.
Environmental Stresses Driving Biotic Crises, Pollen Malformations, and Other Teratologies
Localized and widespread environmental stresses can strain the terrestrial biosphere without causing mass mortality of individual plants and animals. Pollen malformations are not the remains of deceased plants killed by a stress, but rather are produced by living plant specimens experiencing environmental stress. Such a perspective is important when considering potential mechanisms leading to biotic turnover attributed to any specific environmental stress. For example, elevated UV-B exposure might be hypothesized as an end-Permian extinction driver through exerting lethal mutagenesis, but this stress could also have destabilized terrestrial food webs by disrupting reproductive cycles of several seed plant lineages (Benca et al. Reference Benca, Duijnstee and Looy2018; Looy et al. Reference Looy, van Konijnenburg-van Cittert and Duijnstee2021). Furthermore, environmental stresses are not mutually exclusive with respect to one another, meaning more than one stress can synchronously exacerbate selective pressures on plant communities, generating pollen malformations in the process. For example, Bazhina et al. (Reference Bazhina, Kvitko and Muratova2007a) noted numerous saccate pollen malformations in drought-stressed modern conifers in Siberia that were exposed to industrial air pollution and were also being attacked secondarily by pathogens.
Care should also be taken when considering ascribing any one environmental stress as a primary driver of multiple mass extinction events. For example, Lindström et al. (Reference Lindström, Sanei, van de Schootbrugge, Pedersen, Lesher, Tegner, Heunisch, Dybkjær and Outridge2019) noted a conspicuous absence of saccate pollen malformations accompanying end-Triassic fern spore teratology spikes and suggested a different environmental stress could have been at play during the end-Triassic crisis than during the end-Permian. Indeed, Phanerozoic mass extinctions are not monolithic in their patterns of biodiversity change and occur across different continental configurations. It is therefore reasonable to expect that these dynamic events in deep time were unfolding under very different environmental contexts. Deviations in the morphology of saccate palynomorphs have potential for capturing numerous stresses across several of these biotic crises; however, they probably result from different developmental deviations than unseparated tetrads of lycopsid spores of the end-Devonian (Marshall et al. Reference Marshall, Lakin, Troth and Wallace-Johnson2020) and end-Permian crises (Visscher et al. Reference Visscher, Looy, Collinson, Brinkhuis, van Konijnenburg-van Cittert, Kürschner and Sephton2004), as well as fern spore teratologies of the end-Triassic (Lindström et al. Reference Lindström, Sanei, van de Schootbrugge, Pedersen, Lesher, Tegner, Heunisch, Dybkjær and Outridge2019). More experimental studies are needed to confirm whether environmental stresses apart from heightened UV-B exposure, such as heightened mercury deposition, heavy metal pollution, and acid rain, can also generate palynological signals consistent with those of the plant fossil record in modern, phylogenetically relevant plant lineages.
Conclusions
This study of saccate pollen malformations across the extant conifer phylogeny demonstrates that phenotypically abnormal grains are produced in variable but low frequencies in most saccate lineages growing under near-ambient conditions. Moreover, the assemblage of malformation types within pollen yields differs between taxa under near-ambient conditions. Pollen malformation assemblages produced by experimentally UV-B–irradiated conifers fall outside the background range of taxa grown under near-ambient conditions, becoming increasingly dissimilar in trees exposed to incrementally higher UV-B fluxes. This suggests that not only the frequency of pollen malformations serves as a proxy for environmental stress, but also the range of malformation types encountered in the fossil record. The range of pollen malformations expressed by plant assemblages might therefore contain signatures specific to certain environmental stresses the parent plants endured. Based on compiled observations from historical cytological studies of modern saccate conifer microsporogenesis, we propose that phenotypic malformations in modern (and fossil) saccate pollen result from a range of developmental disruptions. Our baseline comparison of saccate conifer lineages under near-ambient conditions indicates pollen malformation frequencies typically do not exceed 3% in unstressed species under modern garden settings, suggesting the 3% benchmark of Foster and Afonin (Reference Foster and Afonin2005) holds as a paleoenvironmental stress proxy. This benchmark is conservative given the population-, spatial- and time-averaged nature of palynological samples. Furthermore, our results suggest pollen assemblages of bisaccate seed plants can be used as a paleoenvironmental stress proxy, while those of naturally trisaccate lineages cannot.
Acknowledgments
Thanks to P. Halladin, K. Possee, M. Frank, A. L. Jacobson, E. Fredrickson, and C. Husby for assisting in pollen cone collection; B. Muddiman for analysis; and S. Bohara and D. Erwin for collection management. M. Tomescu and H. Forbes are thanked for permitting pollen cone collection at Humboldt State University and the University of California Botanical Garden, respectively. E. Leopold, S. Zaborac-Reed, T. Dawson, R. Rhew, C. Rothfels, P. Holroyd, J. Game, and H. Visscher provided insightful discussion and/or feedback on earlier versions of the article. We also thank K. Boyce, C. Strömberg, V. Vajda, and an anonymous reviewer for their constructive feedback on the initial and final drafts of this article. This work was supported by National Science Foundation (NSF) Graduate Research Fellowship 1000135655 (to J.P.B), NSF Division of Environmental Biology grant no. 1457846 (to C.V.L.), Paleontological Society Richard Bambach Award (to J.P.B), and the Research Council of Norway through its Centres of Excellence funding scheme to Centre of Earth Evolution and Dynamics (CEED), project number 223272.L. (to C.V.L.). This is University of California Museum of Paleontology Contribution No. 3013.
Data Availability Statement
Data available from the Dryad Digital Repository: https://doi.org/10.5061/dryad.3r2280ghs.
Appendix 1. Deviations in Microspore Mother Cell Stages (Meiosis I, II, and Cytokinesis)
Runquist (Reference Runquist1968) studied pollen development in three genetically asyndetic (or asynaptic—having chromosomes that do not pair in meiosis) specimens of Pinus sylvestris L. growing under near-ambient conditions and described unusual structural characteristics of several malformation phenotypes. Among them were a conjoined dyad with two nuclei, no dividing wall, and encircled by a single saccus; tetrads with division walls cleaving straight through the undivided nuclei of neighboring grains; pollen tetrads resulting from polymitotic division; and grains having four sacci. Such malformed grains were rare, and some were hypothesized to be polyploid. Just prior, Chira (Reference Chira1967) found pollen yields of Pinus edulis experiencing a cold snap with many unreduced (≥2n) grains also displaying numerous malformation traits consistent with those of this study, namely enlarged grains having an encircling saccus or three or four sacci. Half the unreduced grains resulted directly from disruptions to metaphase I and anaphase I, possibly due to fused or parallel metaphase II spindles. The other half were caused by disruptions to anaphase II and metaphase II. In the latter case, unreduced grains resulted from an incomplete second meiotic division via partially damaged metaphase spindles (Chira Reference Chira1967).
Similar observations were made in a subsequent, detailed cytological study of pollen sampled from microstrobili damaged by rust canker (Melampsorella cerastii [Persoon] Schröter) of drought-stressed Abies sibirica experiencing air pollution (Bazhina et al. Reference Bazhina, Kvitko and Muratova2007a) and trees growing under near-ambient conditions (Bazhina et al. Reference Bazhina, Cedaeva and Muratova2019) in Siberia. The earliest meiotic abnormalities observed are chromosome agglutination and chaotic distribution of bivalents during prophase I, documented in Picea obovata Ledebour by Bazhina et al. (Reference Bazhina, Cedaeva and Muratova2019) (Supplementary Fig. 2), followed by meiotic abnormalities occurring during metaphase I—chromosomes outside spindle divisions, early chromosome separation, irregular arrangement of bivalents, and chromosome agglutination observed in A. sibirica (Supplementary Fig. 2) (Bazhina et al. Reference Bazhina, Kvitko and Muratova2007a). During anaphase I, chromosome bridges, lagging chromosomes, chromosomes outside spindle divisions, chaotic chromosome separation, and elongate chromosomes were observed (Supplementary Fig. 2) (Bazhina et al. Reference Bazhina, Kvitko and Muratova2007a). Formation of three poles during anaphase I have also been noted in A. sibirica (Bazhina et al, Reference Bazhina, Kvitko and Muratova2007a) as well as in P. obovata (Supplementary Fig. 2) (Bazhina et al. Reference Bazhina, Cedaeva and Muratova2019). During telophase I through the dyad stage, abnormally shaped nuclei have been documented, among them fused nuclei and micronuclei (Supplementary Fig. 2) (Bazhina et al. Reference Bazhina, Kvitko and Muratova2007a, Reference Bazhina, Cedaeva and Muratova2019).
During metaphase II, second-division chromosome bridges, chaotic chromosome arrangement, chromosomes outside spindle division, early chromosome separation, elongated chromosomes, and chromosome agglutination were observed (Bazhina et al Reference Bazhina, Kvitko and Muratova2007a). During anaphase II, Bazhina et al. (Reference Bazhina, Kvitko and Muratova2007a) observed separation of chaotic chromosomes, chromosome bridges, chromosomes outside spindle divisions, and lagging chromosomes. Generally, 70% of meiotic abnormalities observed in A. sibirica resulted from abnormal chromosome separation, with lagging chromosomes and chromosome bridges from anaphase I being maintained in the nucleus into meiosis II (Bazhina et al. Reference Bazhina, Kvitko and Muratova2007a). Pollen yields in which these meiotic abnormalities were described hosted a range of phenotypic malformations, such as unseparated dyads and asaccate, unisaccate, and trisaccate grains, and these yields were found to have reduced viability, leading to the conclusion that at least some of these deviations could result in pollen sterility (Bazhina et al. Reference Bazhina, Kvitko and Muratova2007a).
Noskova et al. (Reference Noskova, Tretyakova and Muratova2009) also documented many malformed grains in P. sylvestris under a shifting climatic regime in Siberia, specifically prolonging of the warm season later into autumn. Some of these grains were unreduced (≥2n), among them trisaccates and conjoined dyads and tetrads, resulting predominately from simple and complex chromosome and chromatid bridges as well as parallel spindle arrangement in meiosis II. Additionally, Siberian A. sibirica growing under industrial pollution (Presnukhina and Kalashnik Reference Presnukhina and Kalashnik2003) and under near-ambient conditions in an arboretum (Bazhina et al. Reference Bazhina, Kvitko and Muratova2007b) have also displayed a wider spectrum of structural deviations during meiosis, including chromosome fragmentations, chromosome bridges, and ring chromosomes, as well as chromosome ejection and agglutination. Bazhina et al. (Reference Bazhina, Kvitko and Muratova2011) suggested that chromatin agglutination may have accounted for heterogeneity in sizes and shapes of pollen grains observed in studies of A. sibirica under changing climate in Siberia.
Unreduced malformed grains such as giant grains (Fig. 2A,B) or conjoined grains (Fig. 2C–E) in modern conifers can therefore result from a variety of meiotic disruptions, resulting from what Eriksson (Reference Eriksson1968) classified as chromosomal irregularities, such as forms of “stickiness” (a term coined by Beadle [Reference Beadle1933] to define chromosomes sticking to each other) as well as irregularities in cell division (Supplementary Fig. 2). Categorizing meiotic irregularities into a discrete hierarchical system is problematic, because many deviations described in previous studies are tightly interconnected and transitional (Eriksson Reference Eriksson1968). For example, many forms of chromosomal stickiness are abnormalities in chromosomal arrangement and are thereby generated by processes leading to irregular cell division.
Despite the difficulties in categorizing developmental deviations, it is clear from historic literature that phenotypic malformations are associated with disruptions to normal spindle fiber formation and function during metaphase and anaphase of meiosis I and II (Supplementary Fig. 2). Such processes can result in and/or coincide with various forms of chromosome stickiness (agglutination) as well as abnormal chromosomal arrangements and segregations that result in daughter cells receiving unequal chromosomal complements (Supplementary Fig. 2). Agglutination of chromosomes (Supplementary Fig. 2:6) may be induced by mutations that lead to blockage of prophase I (Golubovskaya and Sitnikova Reference Golubovskaya and Sitnikova1980; Golubovskaya Reference Golubovskaya1985; Bazhina et al. Reference Bazhina, Cedaeva and Muratova2019). Loss of genetic material in daughter cells from chromosome fragments, chromosome emissions, and/or lagging chromosomes (Supplementary Fig. 2:4,9,26) results in the formation of gametes with aneuploid (abnormal) numbers of chromosomes and a high fraction of defective pollen grains in conifers such as P. obovata (Bazhina et al. Reference Bazhina, Cedaeva and Muratova2019). Such chromosomal abnormalities during anaphase I might result from disruptions affecting genes controlling spindle division and divergence of chromosomes, such as the dv gene identified in Zea mays L. and mei-4 in Potentilla anserina (L.) Rydberg, whose functional role is to damage the achromatic spindle (Golubovskaya Reference Golubovskaya, Khvostova and Bogdanov1975a,Reference Golubovskayab, Reference Golubovskaya1985; Golubovskaya and Sitnikova Reference Golubovskaya and Sitnikova1980; Shamina et al. Reference Shamina, Golubovskaya and Gruzdev1981). When these genes are partially damaged, individual and/or groups of chromosomes lag behind as they diverge (Supplementary Fig. 2:9), causing uneven distribution between the two daughter cells or, if the spindle is split, resulting in the formation of three poles (rather than two) during anaphase I and anaphase II (Supplementary Fig. 2:13) (Bazhina et al. Reference Bazhina, Cedaeva and Muratova2019). In some cases, Bazhina et al. (Reference Bazhina, Kvitko and Muratova2011) documented instances of five-pole separation in anaphase II of A. sibirica. When these genes are completely damaged, chromosomes become either concentrated at the center of the cell or randomly distributed throughout (Bazhina et al. Reference Bazhina, Cedaeva and Muratova2019). Additionally, chromosomal anaphase bridges (Supplementary Fig. 2:23) usually result from dicentric chromosomes, where one centromere remains within each nucleus, preventing proper segregation. Dicentric chromosomes can arise from recombination within regions that are heterozygous for certain types of chromosome arrangements, among them long inversions and some types of translocations.
Another phenomenon suggested by Chira (Reference Chira1967) and observed subsequently by Noskova et al. (Reference Noskova, Tretyakova and Muratova2009) in saccate grains is parallel spindle arrangements in meiosis I and II (Supplementary Fig. 2:19,25). When the formation of meiosis II spindles occurs in a plane parallel to spindle orientation of meiosis I, each half of the mother cell receives one copy of the sister chromatids, but because cytokinesis only occurs at the end of meiosis, the planes of division established in meiosis I and II overlap, resulting in a dyad of diploid microspores, rather than four haploid microspores cleaved along two perpendicular planes of division (Andreuzza and Siddiqi Reference Andreuzza and Siddiqi2008).
Appendix 2. Deviations in the Tetrad Stage (Meiotic–Microspore Transition)
Cytological experimental studies of numerous angiosperm lineages have identified a common critical developmental window in the male reproductive cycle of seed plants that appears most sensitive to abiotic environmental stresses (De Storme and Geelen Reference De Storme and Geelen2014). Kim et al. (Reference S. Y., Hong and Lee2001) found that short intervals of heat stress on Arabidopsis thaliana affect pollen development as pollen mother cells complete meiosis and begin microgametogenesis, failing to separate following the tetrad stage. Rice (Oryza sativa L.) pollen has also been confirmed to be developmentally most sensitive to cold stress during the meiotic tetrad stage and subsequent transition to the free microspore stage (Satake and Hayase Reference Satake and Hayase1970)—more specifically—the tetrad to uninucleate/unicellular (young microspore) stage (Oliver et al. Reference Oliver, Van Dongen, Alfred, Mamun, Zhao, Saini, Fernandes, Blanchard, Sutton, Geigenberger and Dennis2005). Cowpea (Vigna unguiculata [L.] Walpers) and tomato (Lycopersicon esculentum L.) pollen is similarly most sensitive to anomalous temperatures around the meiotic–microspore transition stage (Ahmed et al. Reference Ahmed, Hall and Demason1992). Although stages such as pollen release, adhesion, and pollen tube formation are sometimes impacted in angiosperms (Shivanna et al. Reference Shivanna, Linskens and Cresti1991), it is the early microspore stage that is possibly most sensitive to abiotic environmental stresses (De Storme and Geelen Reference De Storme and Geelen2014).


 Open access