


Introduction
Reconstructing past climate and ecological dynamics is crucial for understanding how Earth’s systems respond to environmental changes and for predicting future trends. Soils, especially those in loess deposits, act as sensitive terrestrial archives that record vegetation, hydrology, and atmospheric conditions throughout the Quaternary (Ghafarpour et al., Reference Ghafarpour, Khormali, Tazikeh, Kehl, Frechen and Zolitschka2024). Among the most effective tools for analyzing these records are the stable carbon (δ13C) and oxygen (δ1⁸O) isotopic compositions of soil organic carbon (SOC) and pedogenic carbonate (Cerling, Reference Cerling1984; Quade et al., Reference Quade, Cerling and Bowman1989a; Retallack, Reference Retallack2005; Wynn et al., Reference Wynn, Harden and Fries2006; Zamanian et al., Reference Zamanian, Lechler, Schauer, Kuzyakov and Huntington2021). Recent research by Batool et al. (Reference Batool, Cihacek and Alghamdi2024) has highlighted the often-overlooked role of soil inorganic carbon in both the carbon cycle and paleoclimate reconstruction.
The carbon isotopic composition of SOC (δ13Coc) reflects the photosynthetic pathways of vegetation (e.g., C₃ vs. C₄ plants) and acts as a reliable proxy for reconstructing past vegetation changes (Cerling and Quade, Reference Cerling and Quade1993). Meanwhile, δ13C in pedogenic carbonate (δ13Cpc) is indirectly influenced by the δ13C of soil-respired CO₂, which is affected by factors such as plant types, microbial activity, atmospheric CO₂ levels, and gas diffusion within the soil (Cerling and Quade, Reference Cerling and Quade1993; Breecker et al., Reference Breecker, Sharp and McFadden2009). Although δ13Cpc has traditionally been used to infer vegetation shifts, recent research warns that in arid and semiarid regions, a significant contribution of atmospheric CO₂ to soil pore space can cause isotopic decoupling between δ13Cpc and δ13Coc (Da et al., Reference Da, Zhang, Li and Ji2020, Reference Da, Li and Ji2023; Kelson et al., Reference Kelson, Huth, Andrews, Bartleson, Cerling, Jin, Salinas and Levin2025).
Oxygen isotope ratios in pedogenic carbonates (δ1⁸Opc) complement soil carbon isotope records by revealing the isotopic composition of soil water during carbonate formation. This signature is affected by the moisture source, seasonal rainfall patterns, and evaporative processes (Quade et al., Reference Quade, Cerling and Bowman1989b; Passey and Levin, Reference Passey and Levin2021). However, interpreting δ1⁸Opc values can be difficult, especially in regions influenced by monsoon systems or during glacial–interglacial transitions, where seasonal bias and formation conditions add uncertainty (Da et al., Reference Da, Li and Ji2023). These factors highlight the need for high-resolution, site-specific studies on the formation and preservation of pedogenic carbonates.
The Iranian Loess Plateau (ILP), situated between the Alborz Mountains, the Caspian lowlands, and the Central Asian deserts, offers a uniquely suitable natural laboratory for research on soil-derived carbonate and organic matter stable isotopes. The loess thickness varies from about 25 m in the northern foothills of Alborz to 70 m in the ILP, with well-dated paleosols that record multiple glacial, interglacial, and interstadial cycles (Kehl et al., Reference Kehl, Frechen and Sarvati2005, Reference Kehl, Vlaminck, Kohler, Laag, Rolf, Tsukamoto, Frechen, Sumita, Schmincke and Khormali2021). One of its most notable features is the sharp precipitation gradient, ranging from approximately 150 to 850 mm/year, across a distance of roughly 70 km. Notably, this hydrological gradient is associated with only minor changes in average annual temperature (1–2°C) and a modest elevation difference (100–400 m), allowing for effective isolation of the influence of precipitation on soil development and isotopic composition.
Along this distinct moisture gradient, the morphological, micromorphological, physicochemical, and clay mineralogical properties of modern soils exhibit strong correlations with precipitation, forming a clear soil climosequence. Interestingly, these modern patterns are also observed in paleosols formed during the last interglacial period, indicating a lasting semiarid to subhumid climate gradient over time. The ILP contains a near-complete range of modern soil orders, such as Entisols, Aridisols, Inceptisols, Mollisols, and Alfisols, as well as well-preserved paleosols, making it an ideal site for integrated pedogenic and isotopic research (Khormali and Kehl, Reference Khormali and Kehl2011; Pourmasoumi et al., Reference Pourmasoumi, Khormali, Ayoubi, Kehl and Kiani2019). Supporting climate-driven pedogenesis, both magnetic susceptibility and clay coatings systematically increase with precipitation within and across this loess succession (Shahriari et al., Reference Shahriari, Khormali, Bläsing, Vlaminck, Kehl, Frechen, Karimi and Lehndorff2017; Sharifigarmdareh et al., Reference Sharifigarmdareh, Khormali, Scheidt, Rolf, Kehl and Frechen2020).
A preliminary isotopic study in ILP by Khormali et al. (Reference Khormali, Shahriari, Ghafarpour, Kehl, Lehndorff and Frechen2020) reported δ13Coc values ranging from −19.5‰ in arid soils to −24‰ in humid forest soils, while δ13Cpc values shift from −0.8‰ to −12.1‰ along the same precipitation gradient. This roughly 11‰ change in δ13Cpc values across a 550 mm difference in mean annual precipitation (MAP) highlights one of the clearest examples of δ13C sensitivity to climate in loess-derived systems, mirroring trends found in North American steppe soils (Stevenson et al., Reference Stevenson, Kelly, McDonald and Busacca2005). In paleosols, δ13Cpc values also decrease from −7.2‰ in semiarid environments to −10‰ in more humid conditions, further supporting the idea that climate signals are preserved across glacial–interglacial boundaries (Khormali et al., Reference Khormali, Shahriari, Ghafarpour, Kehl, Lehndorff and Frechen2020).
Nevertheless, interpreting these proxies is complicated by new evidence of decoupling between δ13Cpc and δ13Coc (Da et al., Reference Da, Zhang, Li and Ji2020). The complexity of soil carbonate sources is noted by Kelson et al. (Reference Kelson, Huth, Andrews, Bartleson, Cerling, Jin, Salinas and Levin2025), who found that both detrital and pedogenic carbonates can coexist in humid Michigan soils. Tabor et al. (Reference Tabor, Myers, Gulbranson, Rasmussen, Sheldon, Driese and Nordt2013) showed how soil hydrology and the depth of carbonate formation influence the δ13C differences between pedogenic carbonate and organic carbon, with larger Δ13C values in well-drained profiles due to high soil pCO₂ and minor differences under saturated conditions. Tabor et al. (Reference Tabor and Myers2015) suggested combining isotopic, morphological, and mineralogical indicators to enhance the accuracy of paleoclimate reconstructions.
Furthermore, Wang et al. (Reference Wang, Wang, Wei, Khormali, Xie, Zhang and Chen2019) developed a δ13Coc–MAP transfer function specifically calibrated for ILP and successfully used it to reconstruct Early Pleistocene rainfall (∼649 mm MAP, compared with modern rainfall of about 331 mm). Their findings are supported by Shahriari et al. (Reference Shahriari, Khormali, Bläsing, Vlaminck, Kehl, Frechen, Karimi and Lehndorff2017) and Sharifigarmdareh et al. (Reference Sharifigarmdareh, Khormali, Scheidt, Rolf, Kehl and Frechen2020), who utilized additional climate proxies, including n-alkane biomarkers and magnetic properties, confirming that modern soil processes can aid in interpreting buried paleosols. Despite these advances, a detailed and quantitative climate transfer model based on δ13Cpc in the ILP or other regions has yet to be developed. Additionally, questions remain about the decoupling of δ13Cpc and δ13Coc, the role of δ1⁸Opc, and how seasonal and postdepositional processes influence carbonate isotopic signatures.
The main goals of this high-resolution isotope study are to: (1) identify environmental factors that influence δ13C variability in pedogenic carbonate and evaluate its potential as a quantitative soil moisture indicator; (2) determine the primary factors affecting δ13Coc values in modern loess-derived soils; and (3) assess the significance of δ1⁸Opc as a marker of moisture sources and evaporative conditions. The findings are expected to advance our understanding of soil carbonate formation, improve isotope-based paleoclimate proxies, and support regional and global efforts in Quaternary climate reconstruction.
Geographic and climate setting of Northern Iran
This study was conducted in northern Iran, specifically in Golestan Province in the ILP (Fig. 1). We examined eight soil profiles derived from loess (P1–P8), located at elevations from 100 to 400 m above sea level (Fig. 1, Table 1). All profiles were sampled with a high vertical resolution of 5 cm intervals, in addition to standard sampling from each genetic horizon. We confirmed that each soil profile was developed on similar loess parent material and stable landscape surfaces, which reduced variability in parent material and erosion disturbances. None of the soils had been cultivated. The profiles span a wide range of MAP, from about 188 mm in the dry northern regions (P8) to more than 830 mm in the humid southern regions (P1). In contrast, the mean annual temperature (MAT) varies little, between 17.0°C and 18.6°C. This consistency allows us to focus on meteoric precipitation and soil moisture as the main environmental factors.
Geographic location of the study area in the southeastern Caspian lowlands of northern Iran, showing the positions of eight soil profiles on loess (P1–P8) along a clear north–south precipitation gradient (mean annual precipitation [MAP]: 150–850 mm). The region features aridic to xeric moisture regimes and a diverse range of vegetation cover, from steppe to temperate forest (coordinate axes are shown in UTM, meters).

Location, general information and climatological data about the soil profiles studied.a

a Abbreviations: CCE, average soil calcium carbonate equivalent; OC, average soil organic carbon; LDC, leaching depth of carbonate; MAT, mean annual air temperature; JJA, June, July, and August mean air temperature; DJF, December, January, and February mean air temperature; TU, mean air temperature during months of soil moisture utilization; P/PET, precipitation to potential evapotranspiration ratio; MAP, mean annual precipitation; JJAp, June, July, and August precipitation percentage; DJFp, December, January, and February precipitation percentage. Soils classified using both the USDA Soil Taxonomy and the World Reference Base (WRB) system (https://www.nrcs.usda.gov/resources/guides-and-instructions/soil-taxonomy; https://www.fao.org/soils-portal/data-hub/soil-classification/world-reference-base/en/).
The region exhibits a Mediterranean rainfall pattern. Approximately 60–70% of the annual precipitation occurs during the cooler months (October–March; Table 1, Supplementary Table S1), primarily influenced by westerly winds originating from the Caspian Sea. Annual potential evapotranspiration (PET) ranges from 950 to 1040 mm, resulting in notable moisture shortages in drier zones. The ratio of precipitation to potential evapotranspiration (P/PET) drops sharply from around 0.87 in the forested southern area (P1) to less than 0.2 in the dry northern area (P8) (Table 1). This decrease leads to significant differences in water availability. Monthly patterns of precipitation, temperature, and PET within different plant densities are illustrated in Supplementary Figure S1.
This climate gradient results in varying soil moisture conditions. Soils in the drier northern areas (P7, P8) exhibit aridic moisture regimes. Transitional sites (P4–P6) show dry xeric moisture regimes, while the wettest southern profiles (P1–P3) are classified as typic xeric moisture regimes (Soil Survey Staff, 2022). All soils are within the thermic temperature regime (for more information, see Supplementary Fig. S1 and Supplementary Table S1). Vegetation also varies significantly across the gradient (Wang et al., Reference Wang, Wang, Wei, Khormali, Xie, Zhang and Chen2019; Khormali et al., Reference Khormali, Shahriari, Ghafarpour, Kehl, Lehndorff and Frechen2020). According to Akhani (Reference Akhani and Ziegler2002), 13 plant taxa in the area use the C₄ photosynthetic pathway, while 90 taxa use the C₃ pathway. In the driest northern sites (P6–P8), the vegetation consists of drought-resistant C₃ and C₄ grasses (e.g., Salsola rigida). In transitional zones (P4 and P5), C₃ shrubs, such as Punica granatum, and C₄ grasses, such as Heteropogon contortus, are dominant. In the wetter southern sites (P1–P3), dense forest cover prevails, indicating greater moisture availability.
Differences in plant abundance, biomass, and cover along the environmental gradient primarily reflect variations in climate, soil moisture, and salinity. Humid forested environments are characterized by high total biomass and canopy cover with relatively even species abundance, due to multilayered vegetation structure and strong competition for light (Naqinezhad et al., Reference Naqinezhad, Zare-Maivan and Gholizadeh2015; Moradi et al., Reference Moradi, Naqinezhad, Siadati, Yousefi, Attar, Etemad and Reif2016). Toward drier and more open settings, total biomass decreases, while vegetation cover and abundance become increasingly dominated by drought- and salt-tolerant taxa. In semiarid to arid zones, halophytic shrubs such as Salsola spp. often exhibit high local density and cover but comparatively low biomass, reflecting water stress (Arrekhi et al., Reference Arrekhi, Niknahad-Gharmakher, Bellingrath-Kimura, Bachinger, Bloch and Hufnagel2022). Grass-dominated and transitional communities show intermediate patterns, maintaining moderate cover despite reduced biomass (Akhani et al., Reference Akhani and Ziegler2002).
The entire transect is covered by Late Quaternary loess deposits, which often range in thickness from 30 to 70 m (Kehl, Reference Kehl2010). These deposits mainly originate from sediments that derive from the Atrek and Gorgan river valleys. Luminescence dating of loess–paleosol sequences (Frechen et al., Reference Frechen, Kehl, Rolf, Sarvati and Skowronek2009; Lauer et al., Reference Lauer, Frechen, Vlaminck, Kehl, Lehndorff and Shahriari2017a) shows continuous deposition and soil development since the Late Pleistocene, with modern soils primarily forming under Holocene climatic conditions (Marine Isotope Stage [MIS] 1).
Recent high-resolution luminescence dating has clarified the timeline of surface loess and soils in northern Iran. The Yelli Badragh profile (P5), dated by Wei et al. (Reference Wei, Wang, Azarmdel, Khormali, Frechen, Li and Chen2021), provides the most detailed Holocene record, with quartz optically stimulated luminescence (OSL) ages ranging from 0.1 ka at the surface to 12 ka in depth. This broad age range reflects both Early Holocene soil development and later periods of loess accumulation and carbonate formation. Maleki et al. (Reference Maleki, Khormali, Kehl, Azizi, Shahpouri, Shahbazi and Frechen2023) report similar Holocene loess deposition in the Gorgan region using OSL and radiocarbon dating. In contrast, most traditional loess–paleosol sections in the ILP lack such detailed surface chronologies. Among the few records, Frechen et al. (Reference Frechen, Kehl, Rolf, Sarvati and Skowronek2009) dated the uppermost loess (C horizon) at Aghband (1.8 m deep, comparable to P6) to the Early Holocene (10.1 ka), while subsequent studies at Aghband and Toshan yielded older ages of 16.7 ka and 22.4 ka, respectively, for the parent loess (Lauer et al., Reference Lauer, Frechen, Vlaminck, Kehl, Lehndorff and Shahriari2017a, Reference Lauer, Vlaminck, Frechen, Rolf, Kehl, Sharifi, Lehndorff and Khormali2017b). Similarly, the Neka-Abelou and Chenarli sections span MIS 7 to MIS 1 (Kehl et al., Reference Kehl, Vlaminck, Kohler, Laag, Rolf, Tsukamoto, Frechen, Sumita, Schmincke and Khormali2021; Ghafarpour et al., Reference Ghafarpour, Khormali, Tazikeh, Kehl, Rolf, Frechen and Zeeden2023), but they lack precise Holocene age constraints for the current surface soils.
Overall, although loess deposition continued into the Early Holocene across northern Iran, strong surface chronologies remain limited. This north–south transect, with consistent parent material and minimal topographic variation, provides a valuable framework for isolating the effects of precipitation on soil development and isotopic signatures in Holocene-age profiles. It provides a solid foundation for modeling δ13Cpc–moisture relationships and enhances both modern soil process research and Holocene paleoclimate reconstructions in loess-covered regions of the ILP.
Materials and methods
Soil sampling
The studied pedons were selected from areas with natural, undisturbed vegetation, ranging from broadleaf forests in the south to shrub–pasture mixtures in the middle to desert shrubs in the arid north. None of the soils had been cultivated, ensuring that each profile reflects natural soil formation processes under the current vegetation and climate (Fig. 1).
Each profile is situated on stable landforms, such as summits or gently sloping plains, and shows little or no signs of erosion, deposition, or human disturbance. We described the soils in the field and classified them using both the USDA Soil Taxonomy and the World Reference Base (WRB) system (https://www.nrcs.usda.gov/resources/guides-and-instructions/soil-taxonomy; https://www.fao.org/soils-portal/data-hub/soil-classification/world-reference-base/en/). For each profile, samples were collected by genetic horizon, with additional detailed sampling at 5 cm vertical intervals throughout the soil profile. This careful sampling was essential for detecting small changes in carbonate content and isotopic composition. We paid close attention to areas where secondary calcium carbonate was present, whether in the form of nodules, filaments, coatings, or fine deposits. These samples were carefully excavated, cleaned in the field, and stored separately for laboratory analysis.
All eight profiles showed some form of pedogenic carbonate, with the amount varying with moisture levels. A few minor traces of pedogenic carbonate were observed in the soils of dry regions (P6–P8), and these traces increased in abundance, size, and depth of accumulation (Bk) as moisture levels rose (Fig. 2). We collected a total of 250 carbonate samples from all sites for isotopic analysis. Additionally, undisturbed samples were collected for thin-section studies from each genetic horizon.
Morphological features of the studied soil profiles from P8 (north, dry) to P1 (south, humid). The top row shows photographs of the profiles, highlighting differences in color, carbonate buildup, and horizon development along the climatic transect. Dashed lines mark soil horizon boundaries, and each horizon is labeled within a gray box. The soil order (Soil Survey Staff, 2022) for each profile is listed at the top. On the right side, a depth scale corresponds to the soil profile photographs. All soils developed in loess parent material. At the bottom, a to-scale lateral schematic of the ILP provides orientation, mean annual precipitation, ecozone information, and the locations of the Atrek River, Gorgon River, and Alborz Mountains. See text for further discussion.

Laboratory procedures
Calcium carbonate equivalent (CCE) indicates the weight-percent carbonate of soil material in the <2 mm size fraction. We determined the CCE for each soil horizon sample through acid neutralization, which involved digesting the samples with 0.5 N HCl and back-titrating with 0.25 N NaOH, using phenolphthalein (1% in 60% ethanol) as an indicator (Nelson, Reference Nelson, Page, Miller and Keeney1982). Organic carbon (OC) is the weight-percent carbon from organic matter in soil material from the <2 mm size fraction; this value was measured using wet oxidation with chromic acid, followed by back titration with ferrous ammonium sulfate (Nelson, Reference Nelson, Page, Miller and Keeney1982). For micromorphological analyses, we prepared petrographic thin sections of approximately 20 cm2 from air-dried, undisturbed clods using standard techniques (Murphy, Reference Murphy1986). Micromorphological descriptions were based on guidelines from Bullock et al. (Reference Bullock, Federoff, Jongerius, Stoops, Tursina and Babel1985) and Stoops (Reference Stoops2003), while the interpretation of features followed the criteria outlined by Stoops et al. (Reference Stoops, Marcelino and Mees2010).
We manually selected carbonate nodules and threads mainly from Bk horizons of modern soils, then placed them in a container. To minimize isotopic differences between nodules (Budd et al., Reference Budd, Pack and Fogel2002), we ground 2–4 nodules from each Bk horizon together in a porcelain mortar and pestle, producing a fine, uniform powder. In the lab, we further disaggregated the nodules using a mortar and pestle and sieved them through a 53 µm sieve.
For isotope studies of pedogenic carbonate, we processed a total of 250 carbonate samples, including nodules, bioliths, and soft masses, by grinding them into a powder using a corundum mortar and pestle. We then weighed the powders and loaded them into carbonate reaction vessels fit with a sidearm for introducing 100% H3PO4. The sample amounts ranged from 100 to 830 mg, depending on the calcite concentration in the soil material. After loading the sample and H3PO4, we evacuated atmospheric gases and sorbed water from the reaction vessels using high-vacuum extraction lines. We dissolved the calcite by combining the soil material with 100% H3PO4 at 25°C for approximately 16 hours. The resulting CO2 samples were cryogenically purified, and CO2 yields were measured with a mercury manometer to an accuracy of ±0.2 µmol. We analyzed the CO2 samples for carbon and oxygen isotope ratios using a Finigan MAT 252 isotope ratio mass spectrometer at the Huffington Department of Earth Sciences, Southern Methodist University Dallas, TX, USA.
We treated the individual rootlets collected from bulk soil samples overnight with 1 N HCl to remove any carbonates present. After treatment, we rinsed the rootlets with deionized H2O until the rinse water reached the same pH as the original rinse water (approximately 5.6) after at least 10 minutes of contact with the acid-leached samples. Ground samples were fully dried before being weighed into tin foil pouches. Organic carbon isotopic compositions were analyzed using Dumas combustion in a Costech ECS4010 coupled to an Elementar Isoprime100 isotope ratio mass spectrometer in the Stable Isotope Laboratory at Southern Methodist University. We report isotope values in standard delta notation as follows:
 \begin{equation}{\delta ^{13}}C{\text{ }} = {\text{ }}\left( {{R_{sample}}/{R_{standard}} - {\text{ }}1} \right){\text{ }}1000\end{equation}
where R represents the ratio of the heavy to light stable isotope (13C/12C) in the sample or standard. Precision for these analyses was 0.1‰ based on 65 replicate measurements of USGS40 (−26.39‰) and USGS41a (+36.55‰) run alongside the samples, which were used to calibrate δ13C compositions to the Vienna Pee Dee Belemnite standard (VPDB; Craig, Reference Craig1957).
Results
Soil classification and physicochemical analyses
Field descriptions of profiles across the environmental gradient reveal a systematic shift in soil morphology along the precipitation gradient. In the wetter southern profiles (P1–P3), soils developed under natural forest cover are classified as Alfisols and Mollisols (Fig. 2). These profiles are characterized by deep solum development (average depth of biological activity, approximately 200 cm), ochric and mollic epipedons, and well-developed argillic and calcic horizons. Carbonate leaching depths reach as far as 103 cm, and CCE values remain low (10–17% on average throughout the soil profile), consistent with seasonal leaching in a typical xeric regime (Table 1). Soils in this zone also exhibit very weak acidity in the decalcified horizons (∼6.7 on average in P1–P3, with no effervescence to 1 N HCl), and an elevated SOC content of 1.3% (average in soil profiles P1–P3).
In the central part of the transect (Fig. 2, P4–P6), under shrub and pasture vegetation, soils are classified as Mollisols and Inceptisols, with subsurface calcic horizons in wetter areas (P4 and P5) and Inceptisols with subsurface gypsic horizons in the drier area (P6). These profiles show limited horizon development (average solum depth of 100 cm) and shallower carbonate accumulation depth (Table 1). CCE values increase from 10% to 30% in P1 through P4, remain near 30% in P4 through P6, and drop to ∼16–20% in the more arid P7 and P8 sites; this implies some degree of dissolution, transport, and reprecipitation within some profiles (Table 1, LDC 15–28 cm in P4 and P5). These transitional soils reflect the effects of shorter wet seasons and longer dry periods, which restrict leaching but allow pedogenic carbonate formation under alternating seasonal wet–dry vadose conditions (Table 1, Supplementary Table S1).
Toward the dry northern end of the transect (P7 and P8), soils are classified as Aridisols and Entisols, forming under sparse desert shrub vegetation. These profiles show weak horizon development (average solum depth of 50 cm; Table 1), shallow gypsum buildup both disseminated in the soil matrix and as visible secondary features, no calcic horizon, and no leached layer (Table 1, LDC = 0 cm). Previous studies in Golestan Province show that gypsum can form pedogenically through evaporative concentration of sulfate-rich soil solutions derived from groundwater, atmospheric inputs (dust and Caspian Sea aerosols), and weathering of upstream gypsiferous materials (Ghergherechi et al. Reference Ghergherechi, Khormali and Ayoubi2010; Mohammadnezhad et al., Reference Mohammadnezhad, Khormali and Raghimi2012). Under semiarid to arid conditions, limited leaching and high evaporation promote the recycling and reprecipitation of sulfate within the vadose zone, leading to gypsum accumulation in the soil profile.
CCE values average 18% across the two pedons, typical of parent loess deposits (Khormali and Kehl, Reference Khormali and Kehl2011). Soil pH is alkaline (>8), organic carbon is very low, and soluble salts dominate the By and Cy horizons (EC ∼ 15 dSm−1). These features indicate persistent water stress and an environment characterized by high evaporation rates.
Pedogenic carbonate formation in these arid pedons (P6–P8) is minimal and barely visible. Carbonates only appear as faint filaments or powdery coatings, with no clearly defined nodules or secondary accumulations. Unlike the southern profiles, these arid soils consist mainly of gypsum and other soluble salts, indicating severe water shortages that limit microbial respiration and CO₂ production, both key to pedogenic carbonate formation. These results support previous studies on similar loess-derived soils of Golestan Province (Khormali and Kehl, Reference Khormali and Kehl2011), where aridity was shown to hinder carbonate leaching and promote salt crystallization near the surface.
Mineralogical data from Khormali and Kehl (Reference Khormali and Kehl2011) offer valuable context for understanding the parent material and secondary accumulations in this study. The regional loess mainly includes quartz, feldspars, muscovite/biotite mica, and clay minerals—particularly illite, chlorite, and smectite. As soil moisture increases, there is a clear trend of rising smectite and vermiculite levels. Physicochemical analyses from this study support the following mineralogical patterns: southern soils have more acidic to neutral pH, higher organic carbon content, and finer textures, whereas northern soils are more alkaline, salt-affected, and dominated by coarse carbonate or evaporite phases. These patterns closely match the observed PET ratios across the transect (from approximately 0.87 at P1 to less than 0.2 at P8; Table 1), indicating a strong climatic influence on soil development and secondary mineral formation.
The seasonal moisture balance diagrams (Supplementary Fig. S1, Supplementary Table S1) emphasize the climatic factors that affect the observed differences in soil properties and carbonate types. In typical xeric regimes (P1–P3), soils undergo prolonged winter moisture surpluses that facilitate leaching and deep movement of carbonate. Transitional profiles (P4 and P5) exhibit more limited recharge and shallower leaching, with carbonate deposits forming nearer to the surface. In contrast, aridic profiles (P6–P8) are characterized by prolonged summer dry periods and brief, ineffective wet seasons. Under these conditions, leaching is nearly absent, and carbonate forms are uncommon, replaced by the precipitation of gypsum and the accumulation of soluble salts.
Micromorphological studies
Thin-section photomicrographs (Fig. 3) demonstrate the progressive formation and morphological diversity of pedogenic carbonate features along the north-to-south rainfall gradient of the ILP studied here. The drier section of the transect (P6–P8) is characterized by scarce carbonate features, mainly appearing as thin, linear filaments and calcified root structures (Fig. 3a and b), rhizoliths, cytomorphic calcite of Jaillard et al. (Reference Jaillard, Guyon and Maurin1991), or querra of Herrero et al. (Reference Herrero, Porta and Fedoroff1992). These biologically driven carbonate features do not directly correspond to the morphological stages of carbonate accumulation described by Gile et al. (Reference Gile, Peterson and Grossman1966), but their infrequent occurrence in these soil profiles shows microscale carbonate precipitation resulting from root decay and microbial CO₂ production under conditions of extreme aridity and minimal leaching, typical of early-stage carbonate formation where the development of profile-scale calcic horizons is absent or just beginning (Klappa, Reference Klappa1980; Alonso-Zarza, Reference Alonso-Zarza1999; Stoops et al., Reference Stoops, Marcelino and Mees2010).
Micromorphological features of pedogenic carbonates across selected soil profiles, illustrating variability in the size, shape, and concentration of carbonate nodules and filaments from more humid to arid environments. XPL and PPL images of (a and b) calcified root structures (cytomorphic calcite) in pedon 8; (c and d) needle-shaped calcite in pedon 4; (e and f) calcite infillings and coatings (soft mass) in pedon 3; and (g and h) a calcite nodule in pedon 1.

In the intermediate semiarid environment (P4 and P5, with a MAP of approximately 450 mm), soil carbonate features gradually become more prevalent. These features mainly include infillings of pseudomycelium-like structures lining voids and channels, needle-like calcite, and calcite nodules in the Bk horizons. The delicate calcite fibers, interwoven and often partially filling pores, are understood to have both biological (fungal or bacterial) and physicochemical origins (Verrecchia and Verrecchia, Reference Verrecchia and Verrecchia1994; Stoops et al., Reference Stoops, Marcelino and Mees2010; Fig. 3c and d). Their presence suggests high evaporation rates and moderate biological activity, with carbonate formation occurring in place under unsaturated conditions (vadose zone). These features are typically among the earliest signs of soil carbonate formation in arid to semiarid soil profiles and are associated with quick precipitation during localized saturation (Callot et al., Reference Callot, Guyon and Mousain1985; Loisy et al., Reference Loisy, Verrecchia and Dufour1999). Needle-fiber calcite occurs in soils of various ages. However, it is most common in Holocene soils as the initial stage (Stage I filaments) of the carbonate-forming morphological sequence described by Gile et al. (Reference Gile, Peterson and Grossman1966).
Profile 3 exhibits a shift to wetter conditions (MAP = 688 mm), where calcic horizons (Bk) are overlain by argillic horizons (Bt), and carbonate pedofeatures appear in various forms, such as coatings and infillings of voids (soft mass; Fig. 3e and f). Irregular micritic nodules with diffuse boundaries become common; they form in place by the coalescence of microcrystalline calcite, often displaying clotted or mottled textures, which indicate multiple precipitation and recrystallization events (Tandon and Friend, Reference Tandon and Friend1989; Stoops et al, Reference Stoops, Marcelino and Mees2010). The increased abundance of these nodules, mature morphology, and distribution within the soil suggest stage II pedogenic carbonate development, facilitated by improved moisture availability and soil stability, but still influenced by episodic leaching and evaporative processes (Machette, Reference Machette and Weide1985).
The wettest profiles (P1 and P2; MAP: 740–834 mm) display the most-developed carbonate features along the transect (Fig. 3g and h). The lower Bk horizons contain large, semirounded orthic carbonate nodules, often with fuzzy edges and dense micritic to microsparitic textures. These nodules likely formed during alternating wet–dry cycles, when carbonates leached from upper horizons precipitate and accumulated at depth. The presence of recrystallized calcite fabrics and Mn oxide inclusions further supports multiple episodes of dissolution and reprecipitation (Wieder and Yaalon, Reference Wieder and Yaalon1974; Durand et al., Reference Durand, Gunnell, Curmi and Ahmad2007). The size, complexity, and depth of these features are typical of Stage II to III carbonate development, indicating ongoing seasonal moisture inputs and long-term pedogenic stability.
Isotopic variations in pedogenic carbonate and organic carbon
The isotopic composition of carbonates and soil organic matter varies significantly along the climate gradient from the humid Alborz foothills to the dry margins of the Atrek Basin. Average profile values for δ13Cpc are given in Table 2. The δ13Cpc values show a strong spatial trend that reflects the precipitation gradient. In the southern, more humid forest pedons (P1 and P2), δ13Cpc values range from about −9.0‰ to −5.0‰ VPDB, with average values of −6.2 and −5.4 for P1 and P2, respectively, representing the most negative values in the dataset (Table 2). δ13Cpc values slightly increase in the transitional forest–grassland pedon 3, with an average profile value of −4.4‰. Moving northward (P4–P6), δ13Cpc values become increasingly more positive, generally between −4.5‰ and −2.0‰. The most arid profiles, P7 and P8, have the highest δ13Cpc values, reaching up to +0.1‰. These values correlate with decreasing moisture availability across the transect. No significant variation in δ13Cpc with profile depth is observed (Fig. 4). The standard deviation of δ13Cpc is highest in the wetter profiles and lowest toward the arid end of the transect, whereas the coefficient of variation increases strongly under arid conditions; this reflects the very small absolute mean values rather than greater dispersion, explaining why low standard deviation can coincide with high coefficient of variation (Table 2). Unlike δ13Cpc values, the δ1⁸Opc values do not show significant changes along the climate transect. Average profile values for δ1⁸Opc are given in Table 2. In the humid pedons (P1–P3), δ1⁸Opc values range from −8.8‰ to −6.0‰ VPDB. Pedons P4–P6 show similar δ1⁸Opc variation, usually between −8.8‰ and −6.3‰, while the arid pedons P7 and P8 have values between −8.0‰ and −6.0‰. The vertical distribution of δ1⁸Opc values within each profile appears scattered, with no clear trend (Fig. 4).
Statistical parameters of the isotope ratios in the studied soil profiles.a

a Abbreviations: pc, pedogenic carbonate; oc, organic carbon; Ave, average in soil profile; SD, standard deviation; CV, coefficient of variation (%).
Average profile values for δ13Coc are given in Table 2. The δ13Coc values fall within the expected range for C₃ vegetation, −28‰ to −21‰. The lowest δ13Coc values are found in the most arid profiles P7 and P8 (Table 2). These more negative values contrast with P3–P5, where δ13Coc range from −24.5‰ to −22.0‰. The humid, forested pedons (P1 and P2) show moderately depleted values (−25.5‰ to −23.0‰), with limited variation throughout the profile depths. Across all profiles, δ13Coc shows moderate vertical scatter but no consistent depth-dependent variability (Fig. 4).
Depth profile of δ13Cpc (pedogenic carbonate), δ13Coc (organic carbon), and δ1⁸Opc values for each soil profile. Vertical distribution of δ13C and δ1⁸O in pedogenic carbonates and δ13C in soil organic carbon (SOC) for eight loess-derived soil profiles (P1–P8) along a north–south climatic gradient in northern Iran. Each panel displays δ13Cpc, δ1⁸Opc, and δ13Coc, expressed relative to VPDB. Profiles P1–P3 represent humid northern sites, while P4–P8 correspond to increasingly arid southern localities. Across the transect, δ13Cpc and δ1⁸Opc values become less negative southward, indicating stronger evaporation, reduced soil-respired CO₂ contribution, and greater atmospheric influence on carbonate formation under drier conditions. δ13Cpc shows a slight increase with depth, especially in more arid regions. δ13Coc and δ1⁸Opc do not show significant trends with depth. Together, these patterns reveal climate-driven isotopic gradients and depth-dependent soil processes that shape carbon and oxygen isotope signatures across the Iranian Loess Plateau (ILP).

Discussion
δ13Coc distribution throughout the ILP
The δ13Coc values observed in this study consistently vary across the climate gradient of the ILP, indicating shifts in vegetation composition, plant water-use efficiency, and soil carbon cycling under different moisture conditions. The average soil profile range spans from −25.6‰ in arid, scattered shrublands (P8) to −23.3‰ in regions with intermediate moisture, near rangeland–forest transitions (P3–P5; Table 2). All δ13Coc values fall within the C₃ vegetation range (−21‰ to −28‰), confirming a consistent dominance of temperate herbaceous and woody C₃ species across the transect, supported by floristic surveys reporting 90 C₃ taxa and only 13 C₄ species in the Golestan region (Akhani, Reference Akhani and Ziegler2002).
The lack of typical C₄ vegetation δ13Coc values, near −13‰, indicates that C₄ plants play a minor role even in the driest soils and are not detectable using stable carbon isotopes of soil organic matter. Wang et al. (Reference Wang, Wang, Wei, Khormali, Xie, Zhang and Chen2019) demonstrate a linear decrease in δ13Coc with MAP (R 2 = 0.44) across 44 surface soils in northern Iran, similar to the observations of Shahriari et al. (Reference Shahriari, Khormali, Bläsing, Vlaminck, Kehl, Frechen, Karimi and Lehndorff2017), who reported comparable values in Pleistocene paleosols. These results suggest that C₃ vegetation has persisted throughout the Quaternary. Interestingly, although δ13Coc enrichment with increasing aridity is expected due to reduced stomatal conductance and lower internal CO₂ levels in C₃ plants (Farquhar et al., Reference Farquhar, Ehleringer and Hubick1989; Körner et al., Reference Korner, Farquhar and Wong1991), the most negative values are found in the driest soils (P7 and P8). This pattern likely reflects low vegetation productivity and limited organic carbon inputs under arid conditions, rather than a direct physiological response to aridity.
Figure 5 shows the relationships between SOC δ13Coc (‰, VPDB) and climatic parameters across vegetation zones in northern Iran. The combined datasets, displaying δ13Cco versus MAP and P/PET, show weak overall correlations (R 2 ≈ 0.3), likely because they include multiple ecosystem types (Fig. 5a and b). When data are separated by vegetation zones, that is, dry steppe–rangeland (Fig. 5c and d) and rangeland–forest, strong and clear linear relationships emerge (R 2 = 0.80–0.95), indicating that δ13Coc changes systematically with climate within each ecological zone. The δ13Coc–MAP relationship thus exhibits a bimodal pattern.
Relationships between soil organic carbon (SOC) δ13Cco (‰, VPDB) and climatic parameters across vegetation zones in northern Iran. (a and b) Combined datasets showing δ13Cco versus (a) mean annual precipitation (MAP) and (b) precipitation-to-potential evapotranspiration ratio (P/PET) display weak overall correlations (R 2 ≈ 0.3), likely due to the inclusion of multiple ecosystem types. (c and d) When data are separated by vegetation zones—dry steppe–rangeland (open circles) and rangeland–forest (closed circles)—strong and distinct linear relationships appear (R 2 = 0.78–0.96), indicating that δ13Cco changes systematically with climate within each ecological zone. The weaker combined trends in a and b reflect the contrasting vegetation–climate interactions along the regional gradient.

The δ13Coc values become more enriched as they move from the most depleted northern regions of the arid deserts (P8–P6, −25.6‰ in P8) to the central intermediate semiarid zones with mixed shrubs and grasses (−23.3‰, P5 and P4 < 500 mm, MAP), then show moderate depletion in the wettest forest areas (P3–P1, −24.3‰ in P2). This likely indicates higher biomass productivity and greater isotopic discrimination in less water-stressed forest conditions (Cerling et al., Reference Cerling, Quade, Wang and Bowman1989; Bowling et al., Reference Bowling, Pataki and Randerson2008). The bimodal δ13Cco–MAP and δ13Cco–P/PET relationships reflect high-resolution patterns observed in this study (R 2 = 0.96 in steppe–rangeland and 0.78 in rangeland–forest), which were not evident in earlier studies in the region with fewer samples (Shahriari et al., Reference Shahriari, Khormali, Bläsing, Vlaminck, Kehl, Frechen, Karimi and Lehndorff2017; Wang et al., Reference Wang, Wang, Wei, Khormali, Xie, Zhang and Chen2019; Khormali et al., Reference Khormali, Shahriari, Ghafarpour, Kehl, Lehndorff and Frechen2020). It further emphasizes the importance of considering land cover, plant types, and ecological shifts when using δ13Coc as a paleoclimate indicator. Additionally, δ13Coc depth profiles (Fig. 4) show consistency with depth in arid sites and more variation at depth in wetter soils, probably because of differences in root biomass input and organic matter turnover, as seen in other loess–soil sequences (Breecker et al., Reference Breecker, Sharp and McFadden2009).
Controls on δ13Coc variability along the hydroclimatic gradient
Stevenson et al. (Reference Stevenson, Kelly, McDonald and Busacca2005) reported that δ13Coc values along semiarid climate gradients typically decrease with increasing precipitation, showing a clear linear relationship between SOC δ13C values and MAP (R 2 = 0.71) within the dry part of their transect (200–500 mm MAP), with little systematic variation at higher precipitation levels. Kohn (Reference Kohn2010), described a monotonic depletion of δ13C with increasing precipitation in C₃-dominated terrestrial systems. Our results similarly show a strong sensitivity of δ13Coc to hydroclimatic conditions in water-limited environments; however, δ13Coc in our study increases with increasing precipitation within the 200–500 mm MAP range and exhibits a pronounced bimodal pattern across the entire precipitation gradient, with consistently high coefficients of determination (R 2) for both MAP and P/PET. These strong correlations indicate a robust hydroclimatic control on δ13Coc and reflect a shift in dominant controlling processes along the gradient.
Importantly, this bimodal δ13Coc–precipitation relationship differs from the monotonic trends commonly reported for C₃-dominated vegetation systems, where δ13C values typically become progressively more depleted with increasing precipitation (e.g., Kohn, Reference Kohn2010). This contrast suggests that δ13Coc in the northern Iran loess system reflects changes in carbon cycling processes, rather than a single vegetation-driven response.
In the dry steppe–rangeland domain (<∼500 mm MAP; P/PET < ∼0.5), δ13Coc values increase systematically with increasing precipitation and SOC content. Strong positive relationships between δ13Coc versus MAP and P/PET (R 2 = 0.95; Fig. 5c and d) and between δ13Coc and SOC content (R 2 = 0.92; Fig. 6) indicate that small increases in moisture and carbon storage result in pronounced isotopic shifts. Under these conditions, SOC contents are low (<∼0.7–0.8%), and microbial activity is strongly constrained by water availability. As moisture availability increases, enhanced microbial (primarily bacterial) activity promotes greater organic matter turnover. During decomposition, preferential use of 12C during microbial respiration commonly results in relative enrichment of residual SOC in 13C (Ågren et al., Reference Ågren, Bosatta and Balesdent1996; Wynn et al., Reference Wynn, Harden and Fries2006). In this regime, δ13Coc therefore primarily reflects decomposition intensity and carbon turnover efficiency, rather than vegetation isotopic composition alone.
Relationship between soil organic carbon (SOC) isotopic composition (δ13Coc, ‰ VPDB) and organic carbon content (OC %) across dry steppe–rangeland and rangeland–forest ecosystems. In dry steppe–rangeland soils, δ13Coc increases with OC content (R 2 = 0.92, P = 0.0003), whereas beyond ∼0.7–0.8% OC, a shift occurs toward stable or slightly decreasing δ13Coc values in rangeland–forest soils (R 2 = 0.86, P = 0.001), indicating a change in dominant controlling processes. Error bars denote analytical uncertainty.

Notably, δ13Coc becomes more negative toward the driest end of the gradient, contrasting with some global compilations where increasing aridity is associated with δ13C enrichment due to higher plant water-use efficiency. In the northern Iran loess system, this pattern likely reflects extremely low biomass production and limited organic carbon inputs under severe aridity. Sparse vegetation cover and weak microbial processing allow depleted plant-derived carbon to be preserved in soils, such that δ13Coc records carbon input limitation rather than physiological drought stress alone.
Once precipitation exceeds ∼500 mm MAP (P/PET ≈ 0.45–0.50), δ13Coc values converge to a narrow range (∼−23 to −24‰) and exhibit reduced sensitivity to further increases in precipitation, P/PET, or SOC content. This isotopic stabilization coincides with a SOC threshold of ∼0.7–0.8% (Fig. 6), suggesting that microbial degradation approaches a quasi-equilibrium state under wetter conditions. At this stage, soil moisture no longer limits microbial activity, and additional increases in precipitation do not produce systematic δ13Coc enrichment. This behavior is consistent with observations by Stevenson et al. (Reference Stevenson, Kelly, McDonald and Busacca2005), who attributed reduced δ13Coc variability in wetter environments to diminished drought stress and reduced isotopic sensitivity once actual evapotranspiration no longer exceeds precipitation during the growing season.
In the rangeland–forest transition, δ13Coc becomes increasingly governed by carbon input processes rather than decomposition alone. Higher biomass production, increased root inputs, and enhanced photosynthetic discrimination under reduced water stress introduce larger amounts of isotopically depleted organic carbon into soils. The combination of increased carbon inputs and buffered microbial processing dampens isotopic sensitivity, resulting in relatively stable δ13Coc values despite increasing precipitation and SOC content. The δ13Coc–SOC relationship therefore demonstrates that SOC content itself regulates isotopic responsiveness. At low SOC levels, δ13Coc is highly sensitive to climatic and microbial controls, whereas at higher SOC contents, isotopic signals become increasingly averaged and stabilized.
Overall, these results show that δ13Coc is a sensitive indicator of climate–vegetation–microbial interactions in loess-derived soils, but that its controlling mechanisms vary systematically along hydroclimatic gradients. The observed bimodal behavior underscores the importance of recognizing process thresholds and SOC-dependent buffering when applying δ13Coc as a paleoenvironmental proxy. Failure to account for these nonlinear responses may lead to oversimplified interpretations of past climate–ecosystem dynamics in semiarid to subhumid loess regions.
δ13Cpc as a moisture proxy
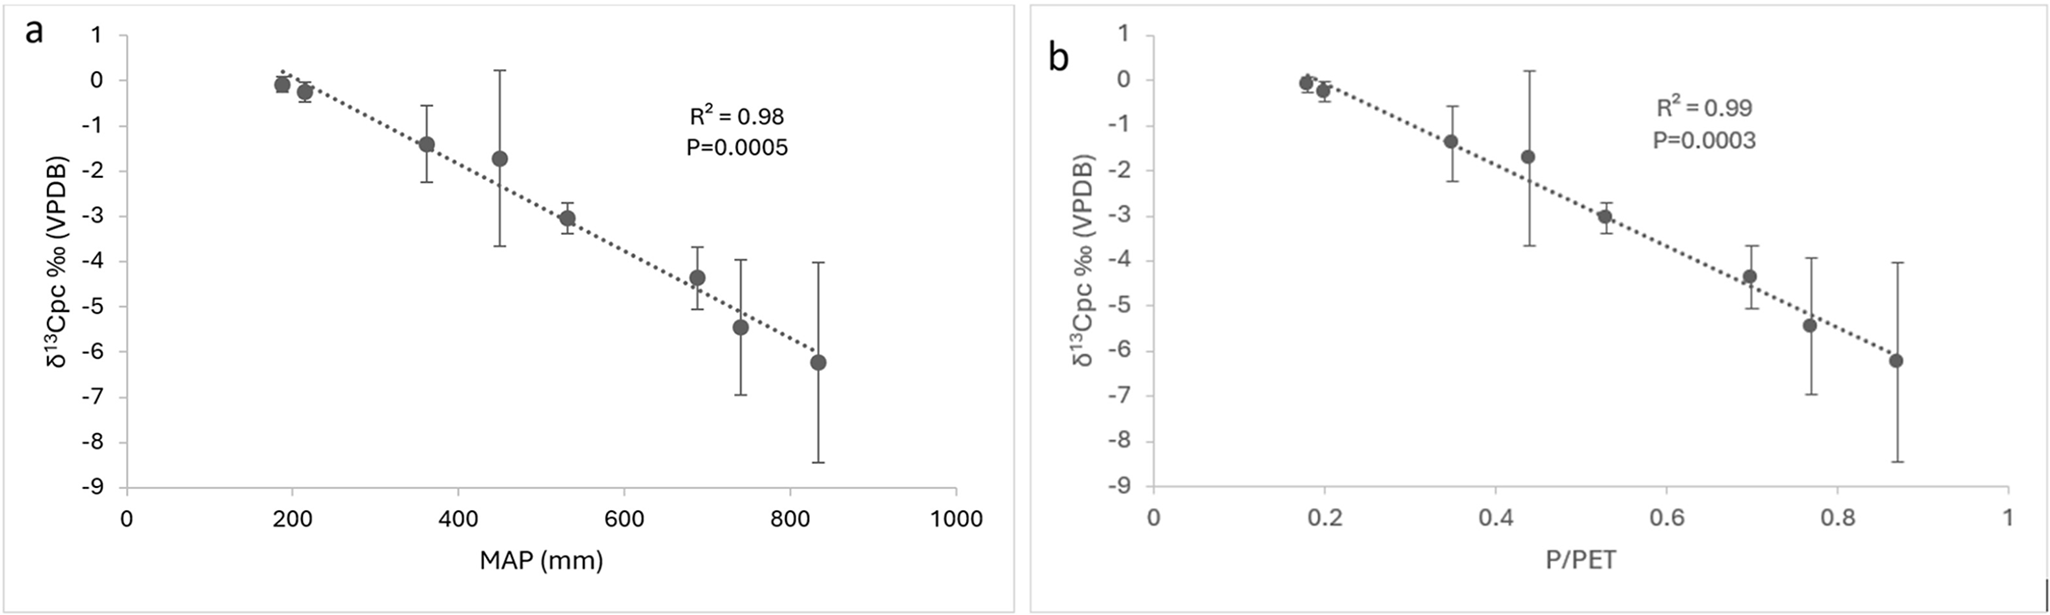
The δ13C values of pedogenic carbonate (δ13Cpc) across the ILP transect exhibit a consistent pattern that reflects modern climate gradients, particularly in terms of moisture availability. The average soil profile δ13Cpc values range from −6.2‰ at the wettest site (P1) to −0.1‰ at the driest (P8), showing a nearly linear increase toward the north (Fig. 7, Table 2). Unlike δ13Coc, which is closely related to vegetation type and plant physiology, δ13Cpc mainly reflects the isotopic signature of soil-respired CO₂ and the degree of open- versus closed-system conditions during carbonate formation (Cerling, Reference Cerling1984; Breecker et al., Reference Breecker, Sharp and McFadden2009). Therefore, it serves as a strong indicator of paleo-soil moisture conditions.
Relationship between pedogenic carbonate δ13C (δ13Cpc, ‰ VPDB) and climatic parameters in loess-derived soils of northern Iran. δ13Cpc exhibits a strong negative correlation with both (a) mean annual precipitation (MAP) and (b) the precipitation-to-potential evapotranspiration ratio (P/PET), with R 2 = 0.98–0.99 and P < 0.001. The highly linear trends suggest that δ13Cpc values increase systematically as precipitation and aridity index decrease, indicating drier soil conditions and reduced canopy density in areas dominated by C₃ vegetation. These findings emphasize the strong climatic influence on δ13Cpc and support its effectiveness as a quantitative proxy for reconstructing past precipitation and environmental conditions in loess-derived soil sequences of northern Iran.

The strong correlation between δ13Cpc and both MAP (δ13Cpc = −0.0093 × MAP + 1.8878; R 2 = 0.98) and P/PET ratio (δ13Cpc = −8.6842 × P/PET + 1.608; R 2 = 0.99) (Fig. 7) supports the idea that moisture balance mainly influences δ13Cpc across the region. This result aligns with global and regional studies showing higher δ13Cpc values in drier soils, which is linked to reduced CO₂ flux from microbial activity, less plant growth, and increased soil aeration—leading to more atmospheric CO₂ contribution and less isotopic discrimination (Cerling, Reference Cerling1984; Quade et al., Reference Quade, Cerling and Bowman1989a; Stevenson et al., Reference Stevenson, Kelly, McDonald and Busacca2005; Wynn at al., Reference Wynn, Harden and Fries2006).
Hudson et al. (Reference Hudson, Kelson, Paces, Ruleman, Huntington and Schauer2024) used Δ₄₇ clumped isotope paleothermometry and soil–water modeling in the San Luis Valley (USA) to demonstrate that soil carbonate formation tends to peak during post-monsoon drying, but it also occurs nearly year-round. This highlights how seasonal moisture patterns can affect isotopic signals in pedogenic carbonates and underscores the importance of considering intra-annual hydrological changes when interpreting δ13Cpc as a moisture proxy.
In wetter profiles (P1–P3), average profile δ13Cpc values range from −4.4‰ to −6.2‰, typical of well-developed forest or rangeland soils with active organic matter turnover and high CO₂ levels in the soil atmosphere. Under these conditions, carbonate formation occurs during the dry season in a semi-closed system enriched in biologically produced CO₂. The relatively low δ13Cpc values indicate high respiration rates at the time of carbonate formation. Toward the center of the transect (P4–P6), δ13Cpc values become progressively more positive (−3.0‰ to −1.4‰), consistent with drier conditions and shorter wet periods. The carbonate forms closer to the surface (within the Bk horizons), and pedogenic CO₂ production is less intense, resulting in a more substantial influence of atmospheric CO₂ during carbonate formation.
In the driest sites (P7 and P8), δ13Cpc values are near 0‰, which reflects the theoretical value for carbonates formed in equilibrium with atmospheric CO₂ (−7‰ to −8‰ for CO₂ and +1‰ to 0‰ for resulting carbonates under open-system conditions) (Cerling, Reference Cerling1984; Breecker et al., Reference Breecker, Sharp and McFadden2009). This suggests that carbonate formation in these soils occurs under arid, well-drained, and biologically inactive conditions, likely driven by abiotic CO₂ diffusion and minimal soil respiration. The small amount of organic carbon in these profiles supports the idea of a weak biological influence on carbonate formation (Table 1).
The consistent depth distribution of δ13Cpc values (Fig. 4) also shows regular patterns across the transect. In wetter soils (P1–P4, >500 mm MAP), carbonate deposits appear at greater depths, and δ13Cpc stays relatively steady with depth, indicating ongoing biological input, bioturbation, and wetting–drying cycles. Micromorphological evidence supports this idea (see Supplementary Fig. S2). Excremental pedofeatures observed in deeper horizons indicate high bioturbation activity, which likely increased CO₂ flux and helped maintain isotopic balance with soil-respired CO₂ during carbonate formation. Conversely, arid pedons (P5–P8) exhibit high δ13Cpc values throughout the shallow, weakly developed Bk and By horizons, with minimal variations with depth, which is consistent with rapid near-surface carbonate accumulation driven by intense evapotranspiration and crystallization within the vadose zone. Importantly, while δ13Coc can be influenced by vegetation type and photosynthetic pathways (e.g., C₃ vs. C₄), δ13Cpc is less affected by vegetation composition in this C₃-dominated system. Instead, it provides a direct record of soil hydrology and the carbon flux environment at the time of carbonate formation, and it is directly connected to the overall stage of soil development (Khormali and Kehl, Reference Khormali and Kehl2011). The strong and clear relationships between δ13Cpc and both MAP and P/PET support its potential use as a paleoprecipitation proxy in loess-derived soils across semiarid and arid landscapes in a system without substantial temporal variability in δ13C values of SOC, such as shifts in C3/C4 dominance or development of salt-affected soils. We note, however, that there is no evidence for such in the history of pedogenesis across the climosequence presented here. Furthermore, temporal shifts of any sort have potential to obfuscate climosequence trends. That we see such strong trends between soil carbonate δ13C values and MAP and P/PET reasserts the significance of rainfall and soil productivity; an expectation in soil ecosystems.
At the same time, although δ13Cpc has traditionally been used to infer vegetation changes, recent work has shown that in arid and semiarid environments a substantial contribution of atmospheric CO₂ to soil pore space can lead to isotopic decoupling between δ13Cpc and δ13Coc (Da et al., Reference Da, Zhang, Li and Ji2020; Kelson et al., Reference Kelson, Huth, Andrews, Bartleson, Cerling, Jin, Salinas and Levin2025). Depth-resolved comparisons of δ13Coc and δ13Cpc across the three sampled intervals (0–50, 50–100, and 100–150 cm), as well as depth-averaged profile values, reveal consistently weak and statistically insignificant relationships (see Supplementary Fig. S3). This lack of covariation indicates that pedogenic carbonate δ13C does not directly track the isotopic composition of contemporaneous SOC at any depth along the transect; instead, it primarily reflects hydroclimate-driven soil CO₂ dynamics, including respiration intensity, gas diffusivity, and mixing with atmospheric CO₂. Notably, the consistently weak δ13Coc–δ13Cpc relationships observed across all depths in the ILP demonstrate that isotopic decoupling is a pervasive feature of this region’s arid to subhumid moisture gradient, rather than an isolated or site-specific phenomenon.
These findings strongly support and extend concepts from previous studies in Central Asia and North America (Cerling and Quade, Reference Cerling and Quade1993; Wynn et al., Reference Wynn, Harden and Fries2006) and emphasize the usefulness of δ13Cpc for reconstructing past hydrological changes. When combined with stratigraphic context and reliable age control, such δ13Cpc records can help identify shifts in moisture patterns related to Holocene and Late Quaternary climate dynamics, especially in regions like the ILP that are located at ecological transition zones between desert and forest. Recent work by Fu et al. (Reference Fu, Guo and Wang2023) demonstrates, however, that in Chinese loess-derived soils, seasonal peaks of C₄ plant respiration during carbonate-forming dry periods can cause positive δ13Cpc anomalies, highlighting the influence of intra-annual moisture fluctuation on isotopic signatures.
Threshold behavior of Δ13C (pc − oc) along the hydroclimatic gradient
The isotopic difference between δ13C of pedogenic carbonate (δ13Cpc) and δ13C of SOC (δ13Coc), expressed as Δ13C (pc − oc), provides an important diagnostic of soil respiration intensity and the hydrological conditions under which pedogenic carbonates form (Amundson et al., Reference Amundson, Chadwick, Sowers and Doner1989; Stevenson et al., Reference Stevenson, Kelly, McDonald and Busacca2005). As shown in Figure 8a, this isotopic offset is strongly correlated with δ13Cpc, while equally strong relationships are observed with mean annual precipitation (MAP; Fig. 8b) and P/PET (Fig. 8c). Although these relationships show high coefficients of determination (R 2 = 0.93–0.97), they are not strictly linear across the full climatic gradient. Instead, Figure 8b and c indicates a threshold or turning point at approximately ∼500 mm MAP and P/PET ≈ 0.5, beyond which the sensitivity of Δ13C (pc − oc) to increasing moisture decreases.
Carbon isotopic offset, i.e., Δδ13C(pc – oc) as a hydrologic indicator. The isotopic difference between carbonate and organic carbon increases with aridity. Strong correlations with MAP (R 2 = 0.97) and P/PET (R 2 = 0.96) highlight its sensitivity to soil water balance and potential for paleoenvironmental reconstructions.

Below this threshold (drier conditions), relatively small changes in effective moisture exert a strong control on soil respiration rates, soil CO₂ concentrations, and gas diffusivity. Limited water availability restricts microbial and root respiration, increasing the relative contribution of atmospheric CO₂ to the carbonate-forming pool. Consequently, δ13Cpc values become more positive (approaching atmospheric values), while δ13Coc remains relatively negative due to the dominance of C₃ vegetation, resulting in a rapidly increasing isotopic offset. This behavior characterizes the more arid profiles (e.g., P7 and P8), where carbonate formation is strongly influenced by diffusion-dominated gas exchange and low soil CO₂ concentrations, consistent with classical pedogenic carbonate models (Cerling, Reference Cerling1984; Quade et al., Reference Quade, Cerling and Bowman1989a).
Above ∼500 mm MAP (or P/PET ≳ 0.5), increased soil moisture promotes higher vegetation density, greater organic inputs, and sustained microbial respiration. As shown in Figure 8b and c, Δ13C (pc − oc) decreases and becomes less sensitive to further increases in moisture, indicating that carbonate formation is increasingly buffered by soil-respired CO₂. In this wetter regime (e.g., P1–P3), elevated soil CO₂ concentrations more closely reflect plant-derived carbon, leading to more depleted δ13Cpc values and a stabilized isotopic offset.
Importantly, this hydroclimatic threshold corresponds closely with the bimodal distribution of δ13Coc observed along the transect (see “Controls on δ13Coc Variability along the Hydroclimatic Gradient”; Fig. 5). The bimodality in δ13Coc likely reflects a transition between two ecohydrological regimes: a water-limited system in which C₃ plants experience greater moisture stress and reduced stomatal conductance, yielding relatively enriched δ13Coc values, and a less water-limited system characterized by denser vegetation, higher productivity, and increased soil respiration. Below the threshold, both δ13Cpc and δ13Coc respond strongly to moisture limitation, amplifying changes in Δ13C (pc − oc). Above the threshold, the shift toward a respiration-dominated soil CO₂ pool and a different δ13Coc mode dampens further changes in the isotopic offset, producing the apparent flattening of the relationships.
Overall, the strong but nonlinear relationships shown in Figure 8 demonstrate that Δ13C (pc − oc) functions best as a semi-quantitative indicator of hydroclimatic conditions, with greatest sensitivity under water-limited regimes. The presence of a climatic threshold emphasizes the need to consider soil moisture regime, vegetation structure, and carbonate formation timing when interpreting δ13C-based proxies in loess–paleosol sequences, particularly where organic carbon preservation is limited and carbonate formation processes vary across climatic gradients. This interpretation is consistent with regional evidence for precipitation control on δ13Coc (Stein et al., Reference Stein, Sheldon and Smith2021) and with documented isotopic disequilibrium between pedogenic carbonate and organic matter arising from seasonal carbonate formation and asynchronous soil processes (Layzell et al., Reference Layzell, Ludvigson, Smith and Mandel2023).
Implications of stable δ18O for moisture source characterization
The δ1⁸O values of pedogenic carbonate (δ1⁸Opc) across the studied transect in the ILP display a remarkably consistent pattern despite significant variations in climate and ecology. In the eight soil profiles (P1–P8), which range from humid, forested slopes in the Alborz Mountains to dry steppe and desert regions near the Atrek River, the average δ1⁸Opc values vary only slightly, typically between −6.6‰ and −7.9‰ VPDB (Table 2, Supplementary Fig. S4). This limited isotopic range sharply contrasts with the much broader variation seen in δ13Cpc and δ13Coc, which are heavily affected by moisture levels and vegetation cover. Linear regression analysis shows that δ1⁸Opc is largely unaffected by climate factors. Moreover, its relationships with MAP, P/PET ratio, and δ13Cpc are not statistically significant (R 2 =0.03). This indicates that δ1⁸Opc does not reliably reflect substantial climatic differences across the transect and is only minimally influenced by large-scale climate variations.
The observed stability in δ1⁸Opc likely results from the dominance of a single, isotopically consistent moisture source, specifically the Caspian Sea, which supplies maritime vapor throughout the year. This oceanic influence maintains relatively steady δ1⁸O values in precipitation along the transect, with minimal isotopic enrichment from evaporation. Furthermore, the formation of pedogenic carbonate in these soils seems to occur mainly during wetter and cooler seasons (late fall to spring; Table 1, Supplementary Table S1), when evaporation is lower and soil water more closely reflects the isotopic composition of precipitation (Bayat et al., Reference Bayat, Karimi, May, Fattahi, Wiesenberg and Egli2023; Fu et al., Reference Fu, Guo and Wang2023). These seasonal variations further limit evaporative enrichment effects in soil moisture, which is the primary factor influencing calcite δ1⁸Opc values. Supporting this, Table 1 shows slight differences in mean annual temperatures (17.0–18.6°C), nearly identical potential evapotranspiration (PET) values, and stable temperature ranges during both summer and winter across all sites. This indicates that climatic conditions during carbonate formation remained largely steady, contributing to the nearly constant δ1⁸Opc signal.
The lack of correlation between δ1⁸Opc and δ13Cpc also clarifies how carbonate forms. While δ13Cpc is affected by soil respiration, plant cover, and water availability, δ1⁸Opc mainly depends on the δ1⁸O of soil water and soil temperature during precipitation. This supports earlier research (e.g., Cerling and Quade, Reference Cerling and Quade1993) and recent studies in the Iranian and Chinese loess plateaus (Bayat et al., Reference Bayat, Karimi, May, Fattahi, Wiesenberg and Egli2023; Da et al., Reference Da, Li and Ji2023; Fu et al., Reference Fu, Guo and Wang2023), which demonstrate that δ1⁸Opc better indicates regional meteoric water and moisture sources than local soil processes. Therefore, the consistent spatial pattern of δ1⁸Opc across the ILP makes it less suitable for reconstructing local aridity changes, but it remains useful for examining broader paleohydrological shifts. Although the variation observed in this study is limited, δ1⁸Opc still holds significant potential for paleoenvironmental applications.
Application of δ13Cpc as a paleoclimate proxy in regional and supraregional contexts
The strong correlation between δ13Cpc and modern precipitation (R 2 = 0.98) in loess-derived soils of the southeastern Caspian lowlands offers a potentially dependable, well-calibrated proxy for reconstructing past hydrological conditions in loess–paleosol sequences. Using δ13Cpc as a semi-quantitative indicator of average annual precipitation (MAP) in arid to semiarid regions is well established (Quade et al., Reference Quade, Cerling and Bowman1989b), and our results further support its utility for the ILP and the broader western arid Central Asia (ACA).
Regionally, our results expand on the loess–paleosol transect studied by Khormali et al. (Reference Khormali, Shahriari, Ghafarpour, Kehl, Lehndorff and Frechen2020), where δ13Cpc values from both modern soils and paleosols showed an approximately 11‰ decrease from the driest to wettest sites along a roughly 550 mm precipitation gradient. Using this modern δ13Cpc–MAP transfer function on paleosols at Aghband, Mobarakabad, Neka, and Nowdeh allows for the quantitative estimation of Holocene and Late Pleistocene rainfall patterns. Shahriari et al. (Reference Shahriari, Khormali, Bläsing, Vlaminck, Kehl, Frechen, Karimi and Lehndorff2017) also observed significant δ13Cpc variation (from −7.2‰ to −10‰) across paleosols formed under different climate conditions in the Gorgan–Kalaleh region, which aligns well with the values predicted by our model. These findings, together with stratigraphic and micromorphological evidence, suggest that climatic and ecological contrasts comparable to the modern steppe–Caspian forest gradient likely developed during earlier interglacial periods (e.g., MIS 5e and 5c). This interpretation is consistent with biomarker evidence from loess–paleosol sequences (Shahriari et al., Reference Shahriari, Khormali, Bläsing, Vlaminck, Kehl, Frechen, Karimi and Lehndorff2017) and pollen-based reconstructions from the more humid parts of northern Iran (Maleki et al., Reference Maleki, Khormali, Kehl, Azizi, Shahpouri, Shahbazi and Frechen2023), although direct pollen constraints remain limited in the semiarid sector. Our δ13Cpc-MAP calibration also enhances the work of Wang et al. (Reference Wang, Wang, Wei, Khormali, Xie, Zhang and Chen2019), who used δ13Coc records from loess–paleosol sequences in western ACA (e.g., Yellibadragh) to reconstruct Holocene hydroclimatic changes. Their reconstructions depended on δ13Coc data with inferred C₃/C₄ vegetation shifts; however, our δ13Cpc-based estimates provide a more stable and diagenetically resistant proxy, especially when organic matter preservation is poor but present in sufficient quantities to determine SOC isotope compositions to assess photosynthetic pathways. Applying our calibration to Wang et al. (Reference Wang, Wang, Wei, Khormali, Xie, Zhang and Chen2019) with stratified sequences would improve MAP estimates during key periods such as the Mid-Holocene climatic optimum (∼6–4 ka BP), marked by widespread pedogenic carbonate development.
Supraregionally, the δ13Cpc calibration from our study has important implications for loess–paleosol systems across the Eurasian loess belt, including Central Asia (e.g., Tajikistan, Kazakhstan), the Chinese Loess Plateau, southeastern Europe, and parts of North America (Gallagher and Sheldon, 2016; Dietrich et al., Reference Dietrich, Zens and Lehmkuhl2017). While these regions differ in dominant climate drivers and seasonal precipitation patterns—most notably the East Asian monsoon influence on the Chinese Loess Plateau—pedogenic carbonates in all systems form under broadly comparable vadose-zone conditions governed by soil moisture balance, evapotranspiration, and soil respiration (Breecker et al., Reference Breecker, Sharp and McFadden2009; Peters et al., Reference Peters, Huntington and Hoke2013; Quade et al., Reference Quade, Breecker, Daëron and Eiler2013;). Our dataset, therefore, provides a useful modern reference for interpreting δ13Cpc variations in loess–paleosol archives, while recognizing that regional climate regimes must be considered when applying such calibrations.
Additionally, the covariation of δ13Cpc with carbonate stage development (e.g., Stage II nodules with micritic fabrics in wetter zones) underscores its dual usefulness as both a geochemical and morphological indicator of soil moisture regimes (Machette, Reference Machette and Weide1985; Retallack, Reference Retallack2005; Stoops et al., Reference Stoops, Marcelino and Mees2010). Combining δ13Cpc with other pedogenic indicators, such as clay illuviation, iron-manganese nodules, and magnetic susceptibility, can provide multiproxy reconstructions of ecological and climatic conditions throughout the Quaternary.
In summary, the δ13Cpc–MAP model developed here offers a transferable, process-based approach for paleoclimate reconstructions using carbonate-bearing paleosols across Iran and the broader ACA. What is presented herein is a stable isotope approach with the potential to enable more accurate interpretation of dated loess–paleosol sequences, improve regional stratigraphic correlations, and provide essential data for understanding vegetation–climate feedbacks, land-use potential, and carbon cycle dynamics under changing moisture conditions.
Conclusions
This study highlights the effectiveness of a pedologic profile-based, high-resolution method in linking soil isotopic signatures to environmental gradients. By conducting dense vertical sampling across eight well-characterized loess-derived soil profiles, we demonstrate that stable carbon isotopes in pedogenic carbonate (δ13Cpc) can reliably and quantifiably serve as a proxy for reconstructing soil water balance in semiarid to subhumid systems. The strong correlations between δ13Cpc and both precipitation and P/PET ratios indicate its high sensitivity to soil moisture conditions.
Notably, averaging isotopic signals across whole soil profiles reduces local variability and provides a more precise climate signal in situations like the ILP, where profile–isotope heterogeneity is not significant. This approach improves the interpretive value of δ13Cpc in paleoclimate studies. Moreover, the isotopic difference between δ13Cpc and δ13Coc acts as a dependable indicator of soil respiration and the degree of hydrological connectivity during carbonate formation.
The consistent C₃ vegetation signature in δ13Coc, with its subtle bimodal variation along the moisture gradient, emphasizes the importance of organic carbon as a proxy for vegetation structure and productivity, especially in paleosols with well-preserved horizons. Although δ1⁸Opc values show limited variation in the ILP, they still suggest a stable Caspian-sourced moisture regime and can complement δ13C data by helping to identify meteoric water sources.
The strong relationship between mean annual precipitation and δ13C of pedogenic carbonate (R 2 = 0.98) indicates that soil respiration and vegetation productivity exert a dominant control on soil CO₂ composition across the climosequence, highlighting the importance of accurately constraining soil-respired CO₂ when applying pedogenic carbonate proxies to reconstruct past atmospheric CO₂ concentrations.
Supplementary material
The supplementary material for this article can be found at https://doi.org/10.1017/qua.2026.10087
Acknowledgments
We sincerely thank Mahdiyeh Ghasemi, Hossein Tazikeh, Amin Ghafarpour, and Faezeh Talebi from the Soil Science Department at Gorgan University of Agricultural Sciences and Natural Resources for their invaluable assistance with field sampling and data collection. We also thank the reviewers for their constructive comments, which significantly improved the clarity and interpretation of this article.
Funding
This research was supported by the Jane and Jack Hamilton Visiting Scholar Program in Geophysical Sciences at Southern Methodist University.


 Open access