

For much of the twentieth century, milk was hailed as “nature’s perfect food”—celebrated as nutritionally complete and a rich source of protein, calcium, and vitamins.Footnote 1 This notion dominated public perception in the United States until the mid-1960s, when groundbreaking studies at Johns Hopkins Hospital revealed that many people, particularly Black Americans, could not digest lactose, the sugar in milk. These findings garnered widespread local and national media attention, as news headlines homed in on the racial implications of the research: “Negro Allergic: Doctors Puzzled on Milk” in the New Pittsburgh Courier on 1 Oct. 1966 and “Studies Indicate Milk A Drink for Whites Only” in the Arborg Lake Center News on 14 June 1968.Footnote 2 Such coverage marked a turning point in nutritional discourse, introducing the (now commonly accepted) fact that only a small portion of the world population—consisting mostly of people of Northern European descent—can digest lactose. This revelation challenged the long-standing assumption that milk was universally beneficial.
Lactose, a sugar found exclusively in the milk of lactating mammals—including human breast milk—requires the enzyme lactase for digestion. While lactase is naturally present in the digestive systems of nursing infants, most individuals lose the ability to produce the enzyme after weaning, making milk digestion difficult.
Initially, in the 1960s, this clinical finding was primarily framed as a digestive issue and presented in stark biracial terms, emphasizing physiological differences between “Negro” and “White” individuals.Footnote 3 By the early 1970s, however, the racial framing began to recede. While U.S. newspapers continued to cover the evolving scientific research on milk digestion, headlines shifted to a more neutral and less sensational tone, with titles like “Milk Intolerance is Discovered” in the Hanover Evening Sun on 13 Oct. 1971 and “Caution in Drinking of Milk Urged” in the Oakland Tribune on 11 June 1975.Footnote 4 This shift reflected a notable move away from overt racialization in favor of a broader public health framing. Yet, even as race came to be muted, the racial underpinnings of the discourse persisted in subtler ways. For instance, the 13 Oct. 1971 Hanover Evening Sun article stated that the current research “calls into question the value of giving black children a half-pint of milk in school feeding program. It has been known for about 10 years that many dark-skinned people lose an enzyme needed to break down lactose, the sugar contained in milk.”Footnote 5
Over the course of the 1970s, these references to “dark-skinned” people expanded to include not only “Negros” but also “Orientals” and “ethnic groups which have American Indian or Mexican Indian heritage” as demonstrated by subsequent international studies.Footnote 6 This shift in messaging reflected an attempt to move away from biracial categories, reframing milk digestion as a feature of ethnic rather than racial difference and emphasizing a condition that was potentially widely shared.
On the one hand, this transition from race to ethnicity could be interpreted as a progressive development. By shifting the study of milk digestion from an explicit focus on race to one on ethnicity (e.g., “Orientals,” “Mexican Indian heritage”), researchers reframed the study of biological differences to emphasize inheritance as a cultural and individualized phenomenon rather than a racially determined one. Positioning milk digestion as a global issue helped to interrogate entrenched racial categories in the American mainstream—a timely intervention that aligned with the calls of the Civil Rights Movement. This shift also brought the discourse into closer alignment with broader scientific efforts, beginning with UNESCO’s 1950 and 1951 statements on race, to dismantle race as a biological construct—an effort to counter the scientific racism that had historically underpinned Nazi genocide, apartheid, and segregation (Barkan Reference Barkan1992; Marks Reference Marks1995). Among its principal claims, the 1950 UNESCO Statement, which was authored by a multidisciplinary group of scientists, asserted that physical differences do not correspond to racial divisions, and that human variation is attributable to cultural rather than racial inheritance. The term “race,” they argued, should be dropped altogether in favor of “ethnic group” (UNESCO 1950: 6).Footnote 7
However, this de-racialization also appeared somewhat incomplete. Race was not fully excised from scientific discourse, as references to “dark-skinned people” indicate (Reardon Reference Reardon2005). The simultaneous use of skin color alongside ethnicity and heritage-based classifications illustrates how racial constructs were not so much rejected as they were subverted through ambiguity; they continued to exist—if not thrive—in a state of what M’charek, Schramm, and Skinner (Reference M’charek, Schramm and Skinner2014: 462) describe as an “absent presence.” As M’charek (Reference M’charek2023: 828) aptly summarizes the problem, the challenge in analyzing the persistence of racialization in science is to understand “how can we know race in practice, in contexts where race is not spoken of” explicitly nor as a central focus.
More to the point, even as the adoption of an ethnic framing sought to move away from race by downplaying the significance of physical differences (e.g., skin color, physiognomy) as deterministic, the “normative” conception of race remains latent in the discourse of science (Reardon Reference Reardon2005). Drawing on methodological insights from Science, Technology, and Society (STS) scholarship, M’charek, Schramm, and Skinner (Reference M’charek, Schramm and Skinner2014) have argued that the presence of race in science is best examined not as a bounded, unitary object—as one might expect from a normative perspective—but as something that is multiple, dispersed, and enacted across different contexts. Race is reactivated as it circulates across medical diagnoses, studies, and institutional settings, often surfacing in the interpretative choices scientists make when confronted with uncertainty about which human differences are verifiable and meaningful across different domains of knowledge.
The history of research into lactose metabolism offers a revealing illustration of how race sustains its presence in science through circulation across different contexts of study. I ask how a problem once conceived as an irregularity in gut function by gastroenterologists became a site for the re-inscription and encoding of racial biology. Even amid concerted efforts by scientists to bracket race through improved sampling practices and reclassification, I show how attempts to segregate “lactose tolerance” from “lactose intolerance” as meaningful human variation marked some bodies as normal and others as deficient (Smith Reference Smith, Leung, Caldwell, Ku and Yano2019; Wiley Reference Wiley2016), engaging what Jonathan Marks (Reference Marks2017) described as a search for “patterns of difference,” more broadly construed as human diversity. The focus on patterns linked to differences in inheritance entailed a return to deterministic thinking and a slide back toward race. These slippages are especially evident in the lexical incongruities and shifts accompanying the move of lactose research from medical clinics to population genetics, as scientists attempted to align units of biological variation with units of cultural classification across contexts spanning the Global South and Global North.
While today it is widely recognized that most human adults are lactose intolerant, this knowledge obscures a lengthy history of medical inquiry that gained traction after World War II, as scientists sought to redeploy the study of human variation and heredity without falling back on racial ideologies associated with eugenics. I situate research on lactose digestion within the framework of a progressive-leaning mid-century science, offering a close reading of studies from 1955 to 1980, tracing the rearticulation of race in scientific discourse. Over the course of this period, lactose digestion has undergone numerous identity transformations, shaped not only by doctors and geneticists but also by the exchanges and contributions of a wide range of actors—including aid agencies and anthropologists—across field sites in North America, Europe, and Africa. Initially framed as a Black disorder, milk digestion was correlated with race, later replaced with ethnicity, and reinterpreted as an adaptive trait in humans, only to ultimately be reclassified as a biomarker of Northern Europeans in the 1970s.
The global and cross-disciplinary contexts of lactose research often render race a diffuse and elusive concept, as it circulates and disseminates across not only scientific but also broader discursive arenas. Firstly, I trace clinical encounters with the “lactose problem” to transnational food aid programs and hospitals in the Global South after World War II. I then examine how, in exchanges between geneticists, doctors, and anthropologists, ethnicity and population emerged as objects of study—in part to facilitate interdisciplinary dialogue in metabolic research while simultaneously serving as surrogates for race and containing the unease surrounding heredity among physicians during the Civil Rights Era. Drawing on Peter Galison’s (Reference Galison1997) concept of trading zones in the second and third sections of the paper, I examine how ethnicity and population were deployed as “in-between vocabularies,” functioning as mediating terms that facilitated knowledge production among researchers operating within different epistemic traditions yet striving for a shared explanation of hereditary patterns deemed significant. Through these alternative framings, race persisted as a biological object, not fully articulated as such, yet always present. In the final section, I examine the troubling consequences of this equivocation about race, particularly as researchers shifted their attention from lactose intolerance to tolerance, ultimately centering their focus on the biology of European populations. In doing so, they unintentionally constructed a normative discourse around “whiteness” without explicitly invoking the language of race. This raises a critical question: How did what began as a well-intentioned effort to foster an anti-racist science inadvertently revive older racial biologisms?
Historical Background
To understand how research on lactose digestion became imbricated in the shifting scientific discourse on race, we must first examine the historical intersections between the geopolitics of the Cold War, the role of milk in food security, and the scaling up of health as a global project. Clinical reports of milk indigestion coincided with the post-World War II expansion of dairy consumption through food aid programs promoted by the United Nations and the U.S., framed within broader efforts of relief and reconstruction. Following the war, the U.S. leveraged the Marshall Plan (1948–1953) to direct agricultural surplus—including dairy products and milk—toward European countries as part of postwar recovery and economic stabilization efforts. Milk, which had been rationed during the war, was considered essential for combating childhood malnutrition. Winston Churchill famously declared, “There is no finer investment for a community than putting milk into babies” (Dupuis Reference DuPuis2002: 254).
John Boyd Orr, a Scottish pediatrician and the first head of the UN’s Food and Agricultural Program, was a proponent of the benefits of milk for children, having conducted nutritional studies in colonial Africa and the UK. Together with J. L. Gilks, his comparison of the Maasai pastoral diet to the Kikuyu’s agricultural diet established dairy and meat as “protective foods,” superior to cereal-based foods (Bashford Reference Bashford2014: 208). This research shaped postwar food aid policies, establishing milk as indispensable to the development of healthy populations, and tying good health to global development and security.
Under the aim of improving population health, dairy became a central component of U.S. postwar food aid programs, whose reach extended beyond Europe. Beginning in the 1940s with U.S. territories such as Puerto Rico, and expanding across Latin America in the 1950s, national health ministries facilitated the distribution of these products (González Reference González2015). Powdered milk was promoted as an ideal weaning food for young children and came to be widely distributed to U.S. allies (McDonald Reference McDonald2016). This initiative was motivated not only by humanitarian concerns but also by the need to offload surplus agricultural production, bolster interest in American commodities, and contain Soviet influence abroad.
Under President Eisenhower, and later with the passage of the Food for Peace Act in 1961 under President Kennedy, U.S. dairy aid became a key instrument of development policy, operating through collaborations with nongovernmental organizations.Footnote 8 One of the most influential NGOs in global food assistance and dairy promotion was the Rockefeller Foundation, which oversaw the opening of milk stations across Latin America (figure 1) (Hamilton Reference Hamilton2019). Nelson Rockefeller, who directed philanthropic efforts at the Foundation, also made direct investments in industrial milk production, including commercial dairies and pasteurization plants in Venezuela (figure 2). It is during this period, in concert with the mobilization of the UN World for Food Programme, that dairy products and fresh milk were introduced to countries in Asia, Africa, and Latin America, including many places where dairy had not previously been part of local diets.
I drink milk every day, “Yo tomo leche todos los días.” Milk stations in Carabobo state, Venezuela. (Top) Winthrop Rockefeller visits a milk station sponsored by the Council of Rural Development, a joint project of the American International Association for Economic and Social Development and the Venezuelan government, ca. 1950. (Bottom) Children are being served cereal and milk at a local community center, ca. 1954. (Photo: Courtesy of the Rockefeller Archive Center).

Figure 1. Long description
A two-panel vertical layout of historical black and white photos.
* Top photo: Winthrop Rockefeller stands on the right side of the frame, wearing a light-colored dress shirt and dark tie, looking down at a group of young children. The children are seated on long wooden benches at narrow tables, some drinking from bowls and others interacting. A bulletin board hangs on the wall behind them, and a vehicle is partially visible through an open doorway in the background.
* Bottom photo: A woman in an apron stands on the left, holding a bottle and assisting a young girl in a polka-dot dress. In the center and right, numerous children are seated at small square tables eating. On the back wall, a poster features an illustration of a cow and the Spanish text YO TOMO LECHE TODOS LOS DIAS, which translates to I drink milk every day. In the foreground, a tray holds several white bowls prepared for serving.
Milk processing at the Via Lactea factory “For a Sound, Strong People,” ca. 1954. The pasteurization plant in Maracaibo was set up under the Venezuelan Basic Economy Corporation, which was in actuality a subsidiary of Rockefeller’s New York based International Basic Economy Corporation (Photo: Courtesy of the Rockefeller Archive Center).

Early Lactose Digestion Research (1959–1964)
It is somewhat surprising that dairy products were promoted so widely as an essential part of food aid since reports of patients suffering from milk related indigestion began to be appear in medical clinics in the 1950s. Cases of milk intolerance were increasingly being documented in tropical medicine clinics across the Global South. Doctors at a U.S. military hospital in Puerto Rico described “malabsorption syndrome” among servicemen, who, according to military provision guidelines, obtained two-thirds of their daily fat intake from dairy (Gardner Reference Gardner1956). Clinicians in India reported adults unable to digest milk (Antia and Cooper Reference Antia and Cooper1955; Jeejeebhoy, Desai, and Verghese Reference Jeejeebhoy, Desai and Verghese1964).
The earliest clinical investigations into the cause of these symptoms were conducted by pediatricians in Italy and France, where children with chronic diarrhea were found to have trouble metabolizing lactose (Durand Reference Durand1958; Holzel, Schwarz, and Sutcliffe Reference Holzel, Schwarz and Sutcliffe1959; Holzel, Mereu, and Thomson Reference Holzel, Mereu and Thomson1962; Darling, Mortensen, and Sondergaard Reference Darling, Mortensen and Sondergaard1960). Because the symptoms—the onset of diarrhea, bloating, and vomiting—led in some cases to a “failure to thrive,” pediatricians initially viewed the condition as a potentially life-threatening disorder. Holzel, Schwarz, and Sutcliffe (Reference Holzel, Schwarz and Sutcliffe1959) and Holzel, Mereu, and Thomson (Reference Holzel, Mereu and Thomson1962) hypothesized that a lack of intestinal lactase was responsible for the symptoms and used the term “alactasia” (low lactase) and “lactosuria” (lactose in the urine) in their clinical diagnosis. They further speculated that the condition might be hereditary, as two of the patients were siblings. Biochemists who were involved in the patient’s care further postulated that the condition might represent an example of “inborn errors of metabolism.”Footnote 9
To fully grasp the significance of these early medical findings, it is crucial to understand the stakes of identifying “inborn errors” within the broader context of mid-century medical genetics and its configuration within an anti-racist science. Metabolic disorders, including lactase deficiency, were hypothesized to result from specific chemical pathway disruptions, often caused by missing enzymes. Understanding these pathways provided a framework for uncovering hereditary conditions—not as undesirable traits to be eliminated, as in early eugenics, but as biological factors that could be analyzed, treated, and managed. Unlike early eugenicists who sought to eradicate “undesirable” hereditary traits, biochemists in the 1950s and 1960s focused on identifying and addressing “suffering caused by hereditary factors” (Comfort Reference Comfort2012: 96). This marked a fundamental shift in the medical approach to inherited disorders—moving away from problematizing family pedigrees or “bad inheritance” and toward an individualized model based on an enzyme profile that could be monitored, managed, and treated with tailored interventions.Footnote 10
In the broader context of mid-century scientific inquiry, research on lactose metabolism offered new prospects for articulating the empirical grounds for a progressive science and restoring the legitimacy of human genetics as a field (Marks Reference Marks2017). In the years leading up to UNESCO’s “Statements on Race,” serological research had already demonstrated limited correlations between race and ABO blood groups (Gannett and Greismer Reference Gannett, Griesemer, Gaudillière and Rheinberger2004). Race was thus not only invalid at a superficial level (e.g., skin color) but also more fundamentally indistinguishable by blood, reinforcing UNESCO’s view that it lacked a meaningful biological foundation and was “a social myth” (1950). Indeed, very few Mendelian traits could be conclusively tied to hereditary transmission or racial classification (Lipphardt Reference Lipphardt2014: 54). This, however, raised a fundamental question: If race was not the primary determinant of human biological variation, then what was? The search for answers led scientists to focus on metabolic traits as potential biomarkers that could be mapped geographically to identify patterns of variation at the population level. The proliferation of lactose digestion studies in the transnational context helped scaffold what Lisa Gannett (Reference Gannett2001) has called “populational thinking” in the life sciences—a shift away from racial “typological thinking” that aimed to redefine human biological differences through an alternative framework. However, the success of this post-racial project was often incomplete and produced ambiguous results.
Scientific efforts between 1960 and 1963 redoubled on developing standardized methods for isolating and measuring enzyme pathways in humans, exemplified by experimental work on lactase synthesis in humans. Collaborations between biochemists, molecular biologists, and clinicians in gastroenterology wards across the U.S. and Europe led to the development of the oral tolerance test, a method for assessing lactase activity in the intestines and blood glucose levels (Weijers et al. Reference Weijers, Van De Kamer, Dicke and Ijsseling1961; Auricchio et al. Reference Auricchio, Rubino, Landolt, Semenza and Prader1963; Dahlqvist et al. Reference Dahlqvist, Hammond, Crane, Dunphy and Littman1963). An increase in glucose levels and lactase activity after ingesting lactose signaled the successful breakdown and absorption of lactose.
The independent validation of these results across multiple laboratories not only established reliable benchmarks for distinguishing “normal” from “low” lactase activity but also introduced the term “lactase deficiency” into the medical lexicon (Aurrichio et al. Reference Auricchio, Rubino, Landolt, Semenza and Prader1963; Dahlquist et al. Reference Dahlqvist, Hammond, Crane, Dunphy and Littman1963). Previously, the symptoms had been described using the Latinate terms “alactasia” and “hypolactasia” (e.g., low lactase) or characterized in chemical terms as a form of “disaccharide intolerance.” With this lexical shift in the 1960s, lactase deficiency was defined as a syndrome of “lactose intolerance,” casting the inability to “tolerate” the sugar in milk as an abnormality and also as a sign of an impaired body (McMichael, Webb, and Dawson Reference McMichael, Webb and Dawson1965; Wiley Reference Wiley2016).
Lactose Intolerance Research in the United States (1965–1969): Questions of Race
The hypothesis that lactase deficiency was potentially hereditary was first investigated by two independent studies conducted at Johns Hopkins Medical Center in 1965 and 1966. Departing from earlier research, which was primarily based on case-by-case observations in hospital wards, these studies emphasized the need for experimentation and controlled investigations to establish what constituted “normal patterns of lactose absorption,” particularly among healthy individuals (Cuatrecasas, Lockwood, and Caldwell Reference Cuatrecasas, Lockwood and Caldwell1965: 14). The first Hopkins study, led by a young biochemist and physician, Pedro Cuatrecasas, and the second by gastroenterologist Theodore Bayless, discovered a significant difference in the incidence of lactase deficiency between “Negro” and “White” study subjects.Footnote 11 Cuatrecasas, Lockwood, and Caldwell (Reference Cuatrecasas, Lockwood and Caldwell1965) were the first to identify differences in lactase levels between racial groups: seventy-two percent of their “Negro” subjects were lactase deficient compared to nineteen percent of “White” counterparts.
Since nearly thirty percent of African Americans in their study did not exhibit evidence of low lactase activity, Cuatrecasas, Lockwood, and Caldwell (Reference Cuatrecasas, Lockwood and Caldwell1965) were cautious about drawing a direct link between “race” and lactose metabolism. They noted that many of the African American participants in the 1965 study shared that they were not habitual milk drinkers and had “abstained from milk for many years because it was distasteful or too expensive” (15). This observation led them to consider that “prolonged milk deprivation” might explain the decline in a person’s lactase production. It was possible then that lactase deficiency was hypothetically a “use it or lose it” problem. This furthermore implied that social or taste preferences, rather than genes (and race), were the cause. Uncertain whether the condition constituted a disorder in the conventional sense—an alteration in the normal function of the body—and seeking to communicate an underdetermined etiology, Cuatrecasas, Lockwood, and Caldwell chose to refer to their subjects as “lactose absorbers” and “lactose non-absorbers” instead of using the more common term lactose intolerant. They further qualified their use of “lactose tolerance” by placing it in quotation marks, signaling the provisional and tentative nature of the term.
A year later, the Hopkins gastroenterologists Bayless and Rosensweig published a comparative study in the Journal of the American Medical Association. Footnote 12 They recruited twenty healthy “Negro” and twenty “White” inmates from a Maryland prison and administered the same tolerance test, though at a higher dose (see Footnote footnote 11). Their findings (seventy percent of “Negro” versus five percent of “White” subjects were lactase deficient) appeared to be consistent with Cuatrecasas, Lockwood, and Caldwell’s Reference Cuatrecasas, Lockwood and Caldwell1965 study. However, while Cuatrecasas, Lockwood, and Caldwell (Reference Cuatrecasas, Lockwood and Caldwell1965) had previously used quotation marks around terms like “lactose intolerance” to signal uncertainty about the diagnosis, Bayless and Rosensweig (Reference Bayless and Rosensweig1966) made a more definitive connection between lactase deficiency and genetics, associating the condition more explicitly with an “error.” They reasoned that the “racial differences in incidence of lactase deficiency” across the two studies were so strong that they could not be explained by individual dietary adaptations.
Because the high frequencies among “Negros” were so great, they reasoned that “some selective factors in Africa may have played a role in establishing and maintaining low lactase levels as a trait,” allowing for it to be inherited over many generations (971). “Lactase deficiency” was maintained in the gene pool, they speculated, because it could have evolved as an adaptation to the lack of milk supply in central Africa where Tsetse disease (transmitted by the cow fly) made rearing dairy cattle impossible. By proposing that lactose intolerance was an environmental adaptation among humans living in regions with bovine diseases, their hypothesis appeared to downplay racial determinism without fully disavowing the normative concept of race.
From Race to Population
This cautious navigation around race was also reflected by their adoption of the term “population studied” to describe their study subjects in a Maryland prison. This phrasing departs from earlier conventions found in studies by Cuatrecasas, Lockwood, and Caldwell (Reference Cuatrecasas, Lockwood and Caldwell1965) and European clinicians, which typically used headings like “patients and methods,” “subjects and methods,” or “the study sample.” The choice to use “populations” instead of “subjects” reflects an effort to adopt an epistemic framework that extends beyond the domain of medicine, facilitating communication across the disciplinary boundaries of human genetics, anthropology, ecology, and biology—all of which define their units of study using population (Reardon Reference Reardon2005). This framing allowed a metabolic condition like lactose intolerance to function both as an object of interdisciplinary interest and as an empirically stable entity that could circulate between labs and geographic “field sites.” By invoking what Veronique Lipphardt (Reference Lipphardt2014: 54) referred to as the “buzzword” of the postwar era, Bayless and Rosensweig also positioned their study within a progressive scientific and political discourse, even as their findings appear to also affirm existing racial categories.
As Alison Bashford (Reference Bashford2014) has observed in her historicization of the population-as-construct after World War II, the term has a scalar effect, placing objects within a broader planetary phenomenon. Within the mandate of the postwar food aid programs discussed above, “population” prefixed “health” to frame a shared project that bound the Global North and Global South within a single reproductive future. This scaling logic is especially evident in the closing paragraph of Bayless and Rosensweig’s article, an amendment posted after submission that states: “Since the completion of this manuscript, an article has appeared from Uganda reporting a 72% incidence of lactase deficiency in African Negroes. The similarity to the 70% incidence in the Negroes studied in Baltimore is striking” (Reference Bayless and Rosensweig1966: 142).
This connection between populations in the U.S. and in Uganda reframed what was initially a localized case study of “American Negro” as part of a broader geographic narrative encompassing Africa. By linking their findings in Baltimore more specifically to “tribal differences” in Uganda, Bayless and Rosensweig are also alluding to the possibility that “race” is not the definitive cause (Reference Bayless and Rosensweig1966: 142), in favor of yet-to-be-determined geographic and historical factors. In so doing, this framing effectively reinforces the absence of race in the normative sense without denying its relevance.
From Race to Ethnicity: Critiques from Africa (1966–1970)
In the five years following the Hopkins studies, international collaborations in postcolonial contexts began to fill in a global map of the lactase deficiency rates. The Uganda study that Bayless and Rosensweig referred to at the end of their paper was published in The Lancet by a team of British and Ugandan researchers. Drs. Cook and Kajubi had set up their study in Kampala partly in response to the Cuatrecasas, Lockwood, and Caldwell (Reference Cuatrecasas, Lockwood and Caldwell1965) study at Hopkins. They saw value in the study of the “Ugandan negro,” as it could provide corroboration for the American findings, particularly given “the high incidence of lactase deficiency reported among American negros” (Cook and Kajubi Reference Cook and Kajubi1966: 275–79). They reasoned that identifying similar trends in Africa, the “homeland” of the “American Negro population,” would further help clarify the hereditary basis of lactase deficiency.
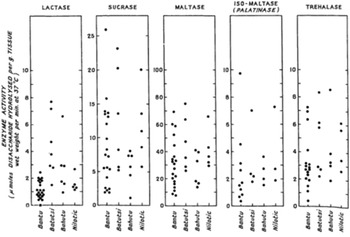
Cook and Kajubi began by critically examining the Hopkins study (Cuatrecasas, Lockwood, and Caldwell Reference Cuatrecasas, Lockwood and Caldwell1965), which they believed contained a methodological flaw: the American clinicians had treated the “American Negro” as a racially homogeneous group, overlooking the fact that the study population, being a diasporic one, was racially mixed (Cook and Kajubi Reference Cook and Kajubi1966: 275–79). To address this oversight in the Hopkins research design, Cook and Kajubi recruited 135 study volunteers for the oral tolerance test. They identified their subjects to be representative of different tribal groups—the Bantu, Bahutu, Batutsi, and Nilotic—in the region (figure 3), treating group differences as ethnological rather than racial in origin. Study subjects were largely defined using a combination of colonial-era ethnic classifications and UNESCO’s designation of ethnicity as groups characterized by a common language, culture, and shared traditions (Marks Reference Marks2017: 48). Cook further emphasized the validity of these ethnic affiliations by incorporating archaeological and linguistic research to support the historical depth of these group distinctions (Cook and Dahlquist Reference Cook and Dahlqvist1968; Cook Reference Cook1969). This integration of colonial ethnological frameworks helped extend the significance of their findings for refining African ethnic and genetic diversity.
Cook and Kajubi’s tolerance test results comparing five different digestive enzyme levels across four different ethnic groups in Uganda (Reference Bayless and Rosensweig1966, figure 5, 728). The Bahima are not shown. They also do not explain why Nilotic individuals, who are presumably pastoralists, exhibit low levels of lactase.

Figure 3. Long description
A multi-panel dot plot with five vertical panels. The common y-axis is labeled Enzyme Activity in mu moles disaccharide hydrolysed per g. tissue wet weight per min. at 37 degrees C. The x-axis for each panel lists four groups: Bantu, Batutsi, Bahutu, and Nilotic.
* Panel 1, Lactase: Bantu data points are clustered low, mostly below 2. Batutsi and Bahutu show wider variance with points reaching up to 8. Nilotic points are clustered low, between 1 and 3.
* Panel 2, Sucrase: Y-axis scale reaches 25. Bantu points range from 2 to 16. Batutsi points range from 5 to 26. Bahutu points are lower, between 1 and 8. Nilotic points range from 6 to 20.
* Panel 3, Maltase: Y-axis scale reaches 100. Bantu points range from 10 to 70. Batutsi points range from 25 to 75. Bahutu points range from 15 to 40. Nilotic points range from 30 to 65.
* Panel 4, Iso-maltase (Palatinase): Y-axis scale reaches 10. Bantu points range from 0 to 10. Batutsi points range from 2 to 7. Bahutu points range from 1 to 4. Nilotic points range from 2 to 7.
* Panel 5, Trehalase: Y-axis scale reaches 10. Bantu points range from 0 to 7. Batutsi points range from 2 to 8. Bahutu points range from 2 to 8. Nilotic points range from 2 to 6.
Additionally, they hypothesized that differences in subsistence traditions, particularly between farming and pastoral groups, may have directly influenced the evolution of lactase persistence. Members of the Bahima and Batutsi tribes, groups associated with “Hamitic” ancestry, exhibited higher lactase activity, which Cook and Kajubi attributed to “Hamites” being “cattle owners and [living] mainly on milk” (figure 3).Footnote 13 By contrast, Bantu-speaking groups such as “the Baganda are an agricultural people who live on a vegetable diet and very little milk” and were therefore expected to be lactase-deficient (Reference Bayless and Rosensweig1966: 729).
Rather than attributing the origins of lactase deficiency to racial biology, as Bayless and Rosensweig had postulated, their explanation muted the connection between race and biological variation in favor of culture and ethnicity. Their ambiguous use of “Hamitic” ancestry—whether as a linguistic group or as Caucasian descendants of Noah—allowed for a semantic flexibility that reticulated the absent presence of race. By invoking “Hamitic” as both an ethnonym and marker of racial heritage, they sustained an interpretative ambiguity that made race hard to trace.
By adopting ethnological labels to identify their study subjects, Cook and Kajubi opened up what Peter Galison (Reference Galison1997) refers to as a “trading zone” in the life sciences, where in-between constructs like ethnicity and population drawn from elsewhere enabled researchers from different disciplines to collaborate and develop shared goals. As studies from other regions in Africa lent additional evidence supporting Cook and Kajubi’s initial theory (e.g., Jersky and Kinsley Reference Jersky and Kinsley1967; Cook and Dahlquist Reference Cook and Howells1968), Cook eventually made a direct appeal to anthropologists and readers in the social sciences. In 1969, he published “Lactase Deficiency: A Probable Ethnological Marker in East Africa” in the Journal of the Royal Anthropological Institute, summarizing why lactase studies may help ethnologists better identify ethnic differences in regions “where inhabitants display an extreme degree of intergroup diversity” and especially when “there are no clear-cut physical, anthropological, or biochemical data to separate” people (Reference Cook1969: 265).
Their scholarly outreach sought to engage an anthropological audience by highlighting the potential of this biological marker to illuminate African tribal histories that seemed to evade the ethnographic present. The observation that ethnic groups in Uganda exhibited different frequencies of lactose tolerance supported views being promoted by biological anthropologist Frank Livingstone, who argued that “there are no races, only clines” (Marks Reference Marks1995; Van Arsdale Reference Van Arsdale2019). Livingstone’s work from the early 1960s showed that the distribution of certain protein markers in Africa followed geographic gradients with clinal variation, challenging the logic of racial fixity while calling for a redirection of focus from “race (being named groups)” to “patterns of difference” as the foundation of human diversity (Marks Reference Marks2017: 92). Cook and Kajubi’s findings from Uganda thus aligned with a pivotal shift in anthropology, one that emphasized Africa’s internal diversity and reframed the study of human variation around intra- rather than inter- continental difference.Footnote 14
A few years later, a National Institutes of Health-funded collaboration between a young Stanford biochemist, Norman Kretchmer, and the Nigerian physician Olikoye Ransome-Kuti expanded the study of lactase deficiency in Uganda and South Africa to include Nigeria. Nigeria, they argued, served as an essential baseline for understanding heredity in U.S. populations, as “the Yoruba and Ibo,” the two largest ethnic groups in Nigeria, “contributed the greatest bulk of people to the slave trade, and they comprise the original group of people from which our American black population is derived” (Kretchmer and Ransome-Kuti Reference Kretchmer and Ransome-Kuti1970: 214). By employing the term “American Black population,” instead of “Negro” as was common practice among their American counterparts, Kretchmer and Ransome-Kuti bridged the conceptual gap between U.S. racial categories and African ethnic groups. In doing so, they reframed the American Black population as an ethnic rather than a racial group, reworking the two within a shared analytical framework.
Their study, which included Yoruba, Fulani, Hausa, and “Anglo-Saxon” as control subjects, found that the rate of lactose intolerance was ninety-nine percent among the Yoruba, seventy-five percent among the Hausa, seventy percent among “town” Fulani, and thirty percent among “nomadic” Fulani, who are traditionally pastoralists (Kretchmer and Ransome-Kuti Reference Kretchmer and Ransome-Kuti1970; Kretchmer Reference Kretchmer, Hurwitz, Ransome-Kuti, Dungy and Alakija1971).Footnote 15 What the Ugandan and Nigerian studies revealed were differences in lactose intolerance across ethnic groups, again with the most striking distinction between agricultural and pastoral groups.
This trans-Atlantic exchange directly challenged the foregoing interpretations from the Hopkins studies, exposing the need for an ethnological approach to refine biological units of study. Both papers iterated that it was not race which mattered to the etiology of lactose intolerance. That not all Africans (e.g., “Fulani,” “Batutsi,” and “Hamitic” groups) are lactase deficient revealed that the racial categories underlying the Hopkins studies were misguided.
In 1970, Kretchmer and Ransome-Kuti delivered a keynote lecture to the Institute of Medicine in Chicago titled “Lactose Intolerance: An International Problem.” Their presentation foregrounded a racial critique, challenging how scientists had historically framed lactose intolerance as an abnormality or an “inborn error.” By questioning this perception, they sought to reframe the narrative around intolerance, suggesting that what had been pathologized as a defect might, in fact, reflect a global norm as evidence increasingly indicated that lactase intolerance was widespread worldwide. Reports of the condition surfaced in diverse regions, including Thailand, Greenland, Pakistan, and Latin America (Cook and Howells Reference Cook and Howells1968; Kretchmer and Ransome-Kuti Reference Kretchmer and Ransome-Kuti1970; Flatz, Saengudom, and Sanguanbhokhai Reference Flatz, Saengudom and Sanguanbhokhai1969). A Nigerian health official was quoted critiquing Dr. Bayless directly, “It’s not we who have a deficiency of lactase; it’s you who have an excess. Adults are not supposed to drink milk.”Footnote 16 In this moment, Dr. Bayless, a white physician, was positioned as the deviation from the norm, effectively reversing the conventional framing of lactose intolerance as a pathology.
For Kretchmer and Ransome-Kuti, it is important to note that their concern was not solely about establishing the facts of lactose intolerance or resolving the “biological question” of its relationship to natural selection. They were increasingly concerned with the potential harm resulting from this medical oversight. They cautioned against the arbitrary promotion of milk as a universal food, highlighting that “milk in any form is probably not a wise food to send to all regions of the world.” They also criticized the “Western fashionable pressures” to adopt powdered milk and encourage early weaning, suggesting that such practices could be detrimental in regions where milk consumption was neither traditional nor nutritionally appropriate (Kretchmer and Ransome-Kuti Reference Kretchmer and Ransome-Kuti1970: 216).
The Cultural Historical Hypothesis and Lactose Digestion Research (1969–1978)
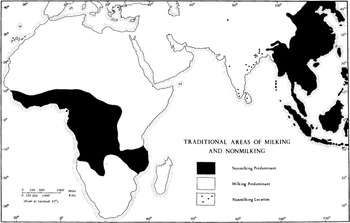
Cook’s call for ethnologists to contribute to this pressing scientific and now global health matter in the flagship anthropology journal did not go unanswered. A cultural geographer at UC Davis, Frederick Simoons, had been following Cook, Kretchmer, and Ransome-Kuti, and Bayless’s work. He initiated an exchange with them while further developing Cook and Kajubi’s hypothesis on pastoralists. Drawing from his extensive fieldwork on the food economies of Sub-Saharan African tribes, Simoons brought a wealth of ethnographic insight to the ongoing debate on lactose digestion. His 1969 and 1970 analyses involved mapping the contemporary geographic distribution of lactose intolerance and tolerance, based on studies published in scientific journals against evidence for pastoralism, which he had accumulated from his fieldwork experience and ethnohistorical research sources (Simoons Reference Simoons1969, Reference Simoons1970) (figure 4).
Map of regions with milking versus non-milking traditions in the Old World (adapted from Simoons Reference Simoons1970, figure 1). Europe is not shown because the map is primarily intended to highlight known areas with established traditions of non-milk use at the time of European contact.

Figure 4. Long description
A black and white geographical map titled TRADITIONAL AREAS OF MILKING AND NONMILKING. The map uses three legend categories: solid black for Nonmilking Predominant, white for Milking Predominant, and dots for Nonmilking Location.
* Africa: A large solid black zone covers West Africa from the coast near 10 degrees North, extending East across Central Africa and South into the Congo Basin and parts of Southeast Africa. The rest of the continent, including North Africa, the Horn of Africa, and Southern Africa, is white, indicating milking traditions.
* Indian Subcontinent: The region is primarily white. However, several black dots representing Nonmilking Locations are scattered along the West coast of India, the Northeast near the Himalayas, and the Southern tip of India and Sri Lanka.
* East and Southeast Asia: A massive solid black region covers almost all of East Asia, including China, and extends South through the Southeast Asian peninsula and the Indonesian archipelago.
* Scale and Coordinates: A scale bar at the bottom left shows 0 to 1000 Miles and 0 to 1000 Kms at Latitude 35 degrees. The map includes a coordinate grid with latitude from 40 degrees North to 30 degrees South and longitude from 20 degrees West to 120 degrees East.
Simoons’s ambitious synthesis of global evidence also represents a significant reorientation of evolutionary theory, emphasizing the role of culture as a driving force in shaping human adaptation, and blurring the lines between cultural and natural selection. He argued that in pastoral societies, individuals who, due to genetic mutation, retained the ability to digest lactose into adulthood gained a critical survival advantage during times of food scarcity. This trait allowed them to rely on milk as a vital source of nutrition, increasing their chances of survival and enabling them to pass the mutation to future generations. Over time, this selective pressure favored the persistence of lactose tolerance within these populations. He presented his theory, dubbed the Cultural Historical Hypothesis, in the American Journal of Digestive Diseases in an effort to engage with the medical community.
Through this comparative approach, Simoons concluded that “traditional areas of milking” (figure 4 areas in white) closely aligned with the geographic distribution of lactose tolerance, highlighting the interplay between cultural practices and biological adaptation. Most importantly, these areas, he concludes, turn out to be fairly delimited in space, being evident in only select parts of the Middle East, Europe, India, and North Africa where dairying had taken off thousands of years ago (Reference Simoons1970: 700–1). Given this and echoing Dr. Ransome-Kuti’s sentiments on “lactase excess,” he states: “To this writer, it seems more promising to view the Western pattern of high levels of intestinal lactase and lactose tolerance throughout life as the aberrant one, which must be accounted for” (Reference Simoons1970: 699). By calling the Western pattern “aberrant,” Simoons challenged the long-held assumption that lactose tolerance—and, by extension, the “White” biology—represented the normative state.
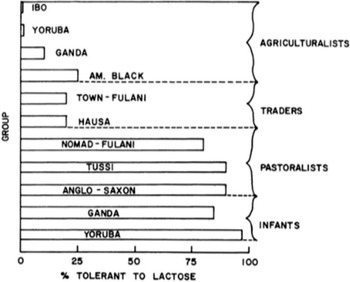
As Bayless would later recount in his retrospective review on the state of the field forty years later, Simoons’s work changed the standard medical attitude that attributed biological adaptation to the forces of natural selection (Bayless, Brown, and Paige Reference Bayless, Brown and Paige2017). His insights also influenced Kretchmer and Ransome-Kuti, who would adopt elements of the Cultural Historical Hypothesis in their follow up research (Kretchmer Reference Kretchmer1971). Kretchmer would go on to argue that the “Fulani, Tutsi, and Anglo-Saxons”—all groups with a herding tradition—were the anomaly (figure 5). In his re-review of the global incidence of lactose tolerance, he re-organized the data into a simple chart ranking groups by the frequency of the trait, from lowest at the top to highest at the bottom. In this visual hierarchy, African “agriculturalists” appeared at the top, while the “pastoralists”—the Fulani, Tussi, and Anglo-Saxon—were near the bottom of the graph and positioned just above “infants” (Kretchmer Reference Kretchmer1971). Rather than viewing lactose intolerance as a deficiency, he proposed that there is “a deficiency in repression of the genetic complex,” a complex which should have been turned off post infancy (Kretchmer Reference Kretchmer1971: 812).
A bar chart showing revised estimates for global lactose tolerance rates. Groups are arranged by subsistence orientation to show that lactose tolerance rates as a “gradient” depending on the importance of dairy in group diets (reproduced from figure 7 in Kretchmer Reference Kretchmer1971, 810).

Figure 5. Long description
The horizontal bar chart features a vertical Y-axis labeled GROUP and a horizontal X-axis labeled percent TOLERANT TO LACTOSE with increments at 0, 25, 50, 75, and 100.
On the right side, groups are bracketed into four categories from top to bottom:
1. AGRICULTURALISTS: Includes I B O (near 0 percent), YORUBA (near 2 percent), GANDA (approximately 15 percent), and A M dot BLACK (approximately 25 percent).
2. TRADERS: Includes TOWN-FULANI (approximately 20 percent) and HAUSA (approximately 20 percent).
3. PASTORALISTS: Shows a significant increase in tolerance with NOMAD-FULANI (approximately 80 percent), TUSSI (approximately 90 percent), and ANGLO-SAXON (approximately 90 percent).
4. INFANTS: Shows the highest rates with GANDA (approximately 85 percent) and YORUBA (nearly 100 percent).
Horizontal dashed lines separate the major subsistence categories. The bars for Pastoralists and Infants are significantly longer than those for Agriculturalists and Traders.
Ransome-Kuti pressed further and attempted to rework the medical discourse surrounding the condition. In a 1975 publication in Gastroenterology, he and Kretchmer avoided the use of terms such as “lactose intolerance” and “lactose malabsorption,” eschewing the connotations of a disordered body. In its place, they introduced neutral, albeit awkward, alternatives like “lactose digestor” and “lactose nondigestor.” This terminological shift reframed the discussion, moving away from an episteme of pathology and toward a semantics that resonates with today’s adoption of lactase persistence and nonpersistence. Moreover, by equating “human adult digestors” (i.e., the lactose tolerant) (Ransome-Kuti et al. Reference Ransome-Kuti, Kretchmer, Johnson and Gribble1975: 475) with those possessing a “mutation,” they offered a pointed challenge to the prevailing medical narrative that often linked mutations with African populations in a stigmatizing manner (Fullwiley Reference Fullwiley2011).Footnote 17 As he made clear to Bayless, it was “lactase excess” that represented the inborn error in metabolism.
However, Kretchmer and Ransome-Kuti’s use of the “Anglo-Saxon” label reinstated the racialized conceptions of Whiteness that UNESCO planners had aimed to eliminate from scientific discourse. “Anglo-Saxon” appeared interchangeably with “Caucasian,” and Kretchmer occasionally used the former as a shorthand for Canadian, British, and American study subjects in Nigeria, a linguistic choice that registered national origin as an ethno-racial category (Kretchmer Reference Kretchmer1971: 393). Simoons also continued to employ the “Anglo-Saxon” term in writing and struggled to fully disassociate himself from this referential framework. In doing so, he inadvertently re-introduced the relevance of “White” as a racial category.
Lactose Tolerance and the Indo-European Inheritance
Simoons’s pair of publications in the American Journal of Digestive Diseases remain foundational and continues to be widely cited in human genetics. Although the genotype for lactase production would not be identified until 2002, his 1970 study laid out directions for genetic research by identifying and specifying populations for sampling that would help put the Cultural Historical Hypothesis to the test (707).Footnote 18 In particular, he shifted the focus to the inheritors of the “aberrant” gene, specifically those descended from dairying cultures.
Foremost among possible candidates for testing the Cultural Historical Hypothesis in “the Old World” were the descendants of Indo-European pastoralists. Simoons proposed that, along with milk, the Indo-Europeans left their linguistic imprint and genes on the European continent through migration, creating a scenario where lactose digestion became crucial for survival, subjecting the “aberrant” gene to the forces of natural selection. Using linguistic families as a key criterion for population sampling, he suggested that non-Indo-European groups, in particular isolates like the Basques, who speak a non-Indo-European language and represent “remnants” of an Old Europe untouched by the Indo-European conquest, would have higher rates of lactose intolerance compared to the general Indo-European-speaking population (Reference Simoons1970: 708). In addition to the Basques, the Finns—speakers of Uralic languages—were also of interest. Simoons reasoned that since Indo-Europeans were the earliest milk users, knowing whether the milk gene was already present in Europe’s “indigenous” gene pool or the result of Indo-European conquest and intermixing could help test his theory (Reference Simoons1970: 704). Simoons’s suggestion that “isolates,” particularly small linguistic communities such as the Basques and Finns, were the most reliable and relevant units of study was consistent with population geneticists’ criteria of geographic isolation. Yet, it is notable that these same “isolates” from Europe were also the same units adopted by eugenicists in the early twentieth century to formulate different European racial genealogies (Lipphardt Reference Lipphardt2014: 56).
Over the next two years, a series of studies was published comparing the Danes and Swedes—both Indo-European speakers—with Finns and Sami, who speak non-Indo-European languages and presumably represent the last autochthonous hunter-gatherers in Europe. The incidence of lactose intolerance was notably higher among the Finns, particularly increasing from a low of seven percent near the Swedish border to seventeen percent near the Russian border (Sahi et al. Reference Sahi, Isokoski, Jussila and Launiala1972; Sahi et al. Reference Sahi, Isokoski, Jussila, Launiala and Pyörälä1973). In a 1973 “Progress Report” on lactose research entitled “New Light on Ethnic Differences in Adult Lactose Intolerance,” Simoons interpreted this frequency in the Finns as still relatively low but also acknowledged that lactose tolerance “is not limited to Indo-Europeans” (Reference Sahi, Isokoski, Jussila, Launiala and Pyörälä1973, 603). These findings did not necessarily overturn the Cultural Historical Hypothesis, however. Evidence from other studies in Europe indicated that most northern Europeans—such as the British, Irish, Germans, French, and Swiss, all representing Indo-European-language speakers—exhibited low incidences of lactose intolerance (Simoons Reference Simoons1973, 602). Italians and Greeks were the notable exceptions, with lactose intolerance prevalence sometimes exceeding thirty percent and reaching as high as eighty-eight percent among Greek Cypriots (Simoons Reference Simoons1973, 601). To reconcile these anomalies, Simoons proposed a north–south genetic gradient for the Mediterranean: “From a genetic point of view, one would expect north Italians to have a lower incidence of intolerance, because north Italy was subject to conquest and settlement by Germanic invaders. [In Greece] the prevailing scholarly view has the Indo-Europeans migrating into Greece from the north, shortly after 2000 BC. A presumed earlier arrival on the mainland would be expected to make their genetic impact greater than in the islands” (602).
While Simoons’s interpretation reflected a more “progressive” understanding of human biological variation as continuous, conceived as a difference in degrees rather than typological (Gannett Reference Gannett2001: 489), this particular reasoning nevertheless racialized heredity. By attributing biological differences to Indo-European input through historical processes of conquest and sexual mixing, he reconstructed distinctions within European descent, delineating different genealogies and, by extension, different kinds—or vintages—of Europeans. Simoons’s research update thus reflected the slippage between Indo-European as a language family and a unit of biology, subtly linking Indo-Europeans to blood, heredity, and race.
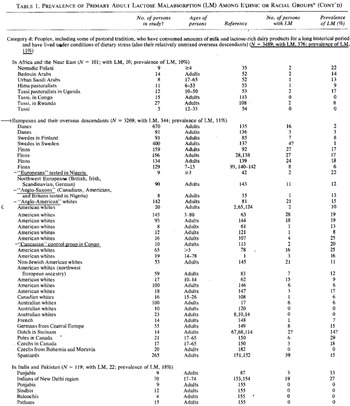
In Reference Simoons1978, Simoons published another review article, entitled “The Geographic Hypothesis and Lactose Malabsorption—A Weighing of the Evidence,” in the American Journal of Digestive Disease. In this piece, he began to shift the classification of populations from a binary (lactose tolerance versus lactose intolerance) to one of a continuous variation (i.e., degrees of lactose intolerance): low (less than thirty percent), intermediate (between thirty and sixty percent), and high levels (greater than sixty percent) of “lactose malabsorption (LM).” This move was not merely an attempt to quantify variation more precisely but an active reconfiguration of global human diversity through re-apportioning of the evidence. The new categories effectively re-partitioned the observed frequencies of lactose intolerance into newly bounded “natural” types. As shown in figure 6, for instance, populations identified in the low category were aggregated into one group labeled “Category d” to lend the “aberrant” trait of lactose tolerance a more clear-cut presence. This was accomplished through numerical consolidation: the heading caption reads “N=3489; with LM, 376; prevalence of LM=11%.” Populations with LM rates under thirty percent were pooled together and assigned a mean group average rate of eleven percent, producing an image of uniformity across the category. In doing so, Simoons transformed a scattered range of population-level measurements into a structured typology that gave empirical weight to the biological distinctiveness.
Category d representing global populations with high levels of lactose tolerance. This means low frequencies of LM (Lactose Malabsorption). Less than thirty percent in the study population (from Simoons Reference Simoons1978, Table 1, 965–66).

Figure 6. Long description
The table is titled Table 1. Prevalence of Primary Adult Lactose Malabsorption L M Among Ethnic or Racial Groups Cont'd. It focuses on Category d: Peoples with long historical dairy consumption and dietary stress. The total sample size N equals 3489, with 376 cases of L M, resulting in an 11 percent prevalence.
The table columns are: Ethnic group, Number of persons in study, Ages of persons, Reference, Number of persons with L M, and Prevalence of L M percent.
Data is organized into three geographical regions:
1. In Africa and the Near East: N equals 101, with 10 L M cases, 10 percent prevalence. Groups include Nomadic Fulani 22 percent, Bedouin Arabs 14 percent, Urban Saudi Arabs 13 percent, Hima pastoralists 9 percent, Tussi pastoralists in Uganda 17 percent, and Tussi groups in Congo and Rwanda ranging from 0 to 8 percent.
2. Europeans and their overseas descendants: N equals 3269, with 344 L M cases, 11 percent prevalence. This section contains the largest dataset. Key findings include Danes 2 to 3 percent, Swedes 1 to 8 percent, Finns 6 to 18 percent, and various American white groups ranging from 8 to 25 percent. Australian whites range from 0 to 6 percent. Other groups include French 7 percent, Germans 15 percent, and Spaniards 15 percent. Some entries like Dutch in Surinam have questioned data marked with a question mark.
3. In India and Pakistan: N equals 119, with 22 L M cases, 18 percent prevalence. Groups include Punjabis 0 to 33 percent, Indians of New Delhi region 27 percent, and Sindhis, Baloochis, and Pathans all at 0 percent.
Simoons reasoned that if the insights of the Cultural Historical Hypothesis were valid, there would be a correspondence between these three LM ranges and different types of subsistence practices. To explore this, he organized societies into seven subsistence categories, labeled “Category a-g.” Populations most likely to have undergone selective pressure from milk consumption were traditional pastoralists, which he placed into Category d, while hunter-gatherer (Category a) and farming (Category b and c) groups were the least likely and expected to exhibit low levels of lactose intolerance (Simoons Reference Simoons1978: 963–68).
A cursory view of Category d in this 1978 synthesis recalls the same distribution included in Kretchmer’s Reference Kretchmer1971 article (figure 5). As in the earlier dataset, both African, such as the Nomadic Fulani and the Tussi, and European groups are included in Category d. Simoons’s Reference Simoons1978 framework expands global coverage by including the addition of ethnic groups in India and Pakistan (figure 6). Among the “Europeans and their overseas descendants” represented in Category d, the increasingly elaborate and diversified nomenclature—ranging from “American whites” to “Australian whites” (zero percent), “Europeans tested in Nigeria” (twenty-two percent) and “Poles in Canada” (twenty-nine percent)—reflects a classificatory framework oriented toward capturing the “diversity-within” contemporary European populations (figure 6). The increased granularity of European populations also led to the articulation of internally differentiated categories of Europeans—an adjustment made to reconcile the contingencies posed by ambiguous cases of Europeans in the intermediate range. Where populations falling in the low (less than thirty percent) and high (greater than sixty percent) LM ranges could be relatively easily assigned to the abovementioned Category d or Categories a-c, those in the intermediate range (thirty to sixty percent) were more inconclusive, as their LM rates did not align neatly with any particular subsistence tradition.
A comparison of Simoons’s nomenclature for groups in Category d also reveals internal inconsistencies in labeling practice, which suggest a general uncertainty about the typology of Europeans in particular. This ostensibly more precise nomenclature was accompanied by the presence of scare quotes placed around certain population groups, signaling their provisional status (figure 6). This uncertainty is especially striking given that the “Europeans and their overseas descendants” (N=3269) vastly outnumbered the non-European sample size of Africans and South Asians (N=220), a disparity that would ostensibly strengthen confidence in the representativeness of the European data. The contrast is even more pronounced when one considers the absence of scare quotes when referring to African and South Asian groups, suggesting a greater degree of certainty in defining cultural others than with European groups. In other words, despite the far smaller sample size of non-Europeans in the study, Simoons appeared more certain in the homogeneity of non-Europeans than the Europeans. What emerges, then, is a reversal: the heterogeneity within Europeans—not just cultural but also biological—becomes the subject of scientific inquiry.
The nomenclature Simoons adopts also appears strikingly anachronistic. Terms like Anglo and Caucasian recall the color-based designations prevalent in nineteenth- and early twentieth-century racial discourse in the U.S. By the mid-twentieth century, Caucasian had largely supplanted White as the socially acceptable descriptor, at a moment when the latter was being publicly challenged and disavowed by Civil Rights activists (Holt Reference Holt2000). Anglo-Saxon evoked older racial hierarchies, when a privileged white race was distinguished from “provisional and probationary” whites, such as the Irish, Italians, Jews, and Slavs in the U.S. (Jacobson Reference Jacobson1998: 95). This mingled nomenclature appears, on the one hand, to resist the notion of a monolithic white identity, yet, on the other, slips back into racial discourse by implying the existence of “different colors of white” (Jacobson Reference Jacobson1998).
The use of scare quotes, I argue, further complicates and conflates the category of White by sometimes rendering the conceptual boundary between race and ethnicity indistinct. Within the composite of “Europeans and their overseas descendants,” American Whites, like the Danes, Swedes, and Finns, serve as self-evident subcategories (figure 6). In contrast, terms such as “Anglo-Saxons,” “Anglo-Americans,” “Caucasian,” and “Europeans” are marked typographically, suggesting they are distinct from, and not fully commensurable with, each other or the broader category of Europeans. While scare quotes sometimes indicate a direct quotation—such as Simoons’s reference to “Anglo-Saxon” from Kretchmer et al.’s (Reference Kretchmer1971) study—they also serve other discursive functions. In this instance, they appear to mark overseas Europeans studied in post-colonial settings—such as the “Caucasian control group in Congo” and “Europeans tested in Nigeria”—as ethnicized variants. This usage signals these groups as decontextualized “European” and “Caucasian” subjects (figure 6), whose ancestry is perceived as perhaps less fixed in space and more ambiguous, therefore, necessitating further qualification or ethnic glossing. For example, rather than simply referencing people using the parenthetical “(Canadians, Americans, and Britons tested in Nigeria),” Simoons attaches the label “Anglo-Saxons,” ascribing ethnic unity to national groups. Here, scare quotes do more than simply cite; they mediate relationships between categories of European persons across diverse geographic settings, performing the work of aligning disparate units of analysis across the spaces of the trading zone (Galison Reference Galison and Gorman2010). What the “Caucasian” and “Anglo-Saxon” labels provide in the context of Africa is to register white as an ethnicity. In the process, however, this very mediation also perpetuates the “absent presence” of race: White slips imperceptibly between ethnicity and race, unmoored from fixed definitions but never fully disavowed. It is this ambiguity that enables talk about a white biology without ever invoking race per se.
Here, the construct of White begins to develop, to borrow from Jonathan Marks, as both “race (being named groups) and human diversity (being patterns of difference)” (Reference Marks2017: 92). While Marks argues that these are “two different things,” I suggest that in the science of lactose digestion, they begin to merge. In the search for patterns of difference within European heterogeneity, a distinctive kind of European comes into view: Category d appears to represent a coherent biological type, defined by low levels of LM. Yet this coherence is only possible through the exclusion of metabolically inconclusive subjects, or, as M’charek (Reference M’charek2023) aptly notes, “bringing the presence of certain ‘objects’ into view entails making other things absent” (829). For those European groups with intermediate levels of LM, who do not neatly fit the selective logic of the Cultural Historical Hypothesis and appear immune to the presumed adaptive benefits of milk consumption, Simoons categorized them separately to maintain the stability of Category d. Some intermediate peoples, for example, were explained to be the mixed descendants of Category d populations and grouped under “Category e: Mixed groups of milk/non-milking ancestry.”Footnote 19 Other Europeans, particularly of non-Indo-European background with ambiguous dairying traditions—namely, Jews of various ancestries—were placed into “Category f” along with Semitic speakers including Arabs. Finally, Indo-European-speaking populations like Greeks and Italians, whose LM values varied widely between intermediate and high ranges and thus did not conform to the expected pattern, were assigned to “Category g: Problems” (Simoons Reference Simoons1978: 968).
The reordering of Europeans across these categories presents more than just an effort to refine lactose malabsorption typologies; it signals a taxonomic shift in how White is being re-configured. Rather than approaching White or “European” as a singular bounded object—as M’charek noted with caution in her appraisal—Simoons’s classificatory framework foregrounds the multiple and dispersed, emphasizing degrees of variation. It operates through a logic of “diversity-within” that reconfigures whiteness into internally differentiated biological kinds. The organization of Category d as a discrete, low-LM population, implicitly aligned with Anglo-Saxon and Northern European groups, establishes a normative baseline. The exceptions (e.g., Greeks, Italians, and Jews) require further contextualization. By presenting intra-European variation in lactose metabolism as both meaningful and measurable, Simoons effectively recasts whiteness as a spectrum of biological kinds.
What emerges is a new kind of racial discourse: one that no longer relies on overt color categories but instead operates through metabolic distinctions, dietary histories, ancestry, and evolutionary reasoning. Whiteness, in this framework, is not erased but rendered unstable.
Public Reception of the Lactose Research
Part of the impetus for Simoons’s successive updates to scientific reviews of the Cultural Historical Hypothesis during the 1970s was an increasingly milk-wary public.Footnote 20 As milk indigestion emerged as a more widespread condition within the U.S. population and milk’s reputation as “nature’s perfect food” came under scrutiny, public unease grew. Newspaper headlines following the Hopkins studies reflected this shift, ranging from “A Hereditary Tummy Ache?” in the Washington Post on 20 Nov. 1966 to “Bulk of Non-White Adults Said Intolerant to Milk” in the San Bernardino County Sun on 13 Apr. 1968.Footnote 21
In the context of the Civil Rights Movement, growing awareness of the racial implications of this research, amplified by media coverage, led consumers to question U.S. dietary policies—particularly federal mandates requiring milk in food and school lunch programs.Footnote 22 These tensions culminated in 1969 with milk protests on the Navajo reservation in Arizona, where a Navajo community dumped powdered milk into a riverbed. Despite being described as “among the most poorly nourished citizens of the U.S.,” the Navajo rejected milk, “a food they now considered poisonous” and with “good reason to believe” it was harmful.Footnote 23
Research on lactose digestion thus transformed dairy politics into a contested space where racial and health disparities were thrust into public debate. By the early 1970s, lactose intolerance had expanded beyond a scientific issue, becoming what was described as “a scientific controversy raging in professional circles and the lay press.”Footnote 24 Recognizing the growing public concern, physicians began writing syndicated advice columns addressing readers’ struggles with milk consumption, often attempting to clarify the distinction between lactose intolerance and milk allergy.Footnote 25 As confusion over who was most at risk of lactose intolerance intensified, public health officials organized nutrition seminars to educate consumers on suitable diets for lactose-intolerant individuals.
By the time Simoons shared his Progress Report in Reference Simoons1973, lactose digestion had become more than a “matter of facts”—it had, in Bruno Latour’s terms, become a “matter of concern” for both the scientific community and the public (Reference Latour2004). Press coverage of lactose intolerance also redeployed the biology of race into mainstream debates. Questions such as “Is milk a drink for Whites only” or “only some non-whites” reflected heightened anxieties around racial self-identification, even as the scientific community and the press attempted to de-emphasize race.Footnote 26
In a 1976 syndicated health column, Dr. Lamb responded to a letter from a Black woman who expressed her distress: “I am a Black woman and I’m writing to you in despair. Both my husband and I have trouble with milk. What are Black people supposed to do? I understand 90 percent of us have this problem and so do other minority groups. We are denied the right to a balanced diet because we can’t use milk products. Is it discrimination because we are Black?”Footnote 27
Her frustration highlighted not only the lived experience of those with lactose intolerance but also the new grounds for recognizing forms of exclusionary citizenship. While Dr. Lamb acknowledged her concerns, he ultimately dismissed the possibility of discrimination, pointing to scientific studies showing that “35 million Whites” in the U.S. also experienced lactose intolerance. This subgroup of lactose-intolerant Whites likely drew from Simoons’s findings on incidences of lactose intolerance among Jews, Italians, and Greeks—populations with lower Indo-European genetic input (Reference Simoons1973; Reference Simoons1978). This condition, Dr. Lamb insisted, was not exclusive to Black people but rather a shared trait, and therefore not an inherently racial characteristic.
The controversy surrounding milk digestion remains as contentious today as it was in the 1970s. The Cultural Historical Hypothesis, with its emphasis on Indo-European inheritance, still carries a resonance both publicly and scientifically, continuing to shape research on the evolution of the lactase gene and human variation in the post-genomics era (Itan et al. Reference Itan, Powell, Beaumont, Burger and Thomas2009; Haak et al. Reference Haak, Lazaridis and Patterson2015). In 2002, the “aberrant” variant was finally identified in the genetic sequences of northern Europeans as Simoons had initially proposed. Since then, the theory has taken on a more troubling dimension as it has been co-opted by the alt-right. In particular, the recognition that only a select group of people with European ancestry carry this variant has been appropriated by white nationalist groups to reconstruct white racial biology. These groups leverage the inheritance of an “old” gene to assert claims of racial superiority and purity, framing lactose tolerance as a marker of distinctive Indo-European ancestry (Panofsky and Donovan Reference Panofsky and Donovan2019; Hakenbeck Reference Hakenbeck2019).Footnote 28 This ideology finds expression in public performances such as the chugging of entire jugs of milk to signal racial pedigree and in the viral spread of the “milk meme,” popularized by alt-right figure Richard Spencer. More than just a symbol of white superiority, the meme functions as a hailing—a call to recognize a rarefied, biologically distinct “Aryan” category of whiteness.
Conclusion
Through his reappraisal of the Cultural Historical Hypothesis, Simoons not only mapped whiteness as a biological construct but also demonstrated how racial discourse could re-emerge and be mobilized within scientific inquiry, despite well-intentioned efforts to move away from such frameworks. In his attempts to identify the “aberrant” gene, he inadvertently framed Indo-European heredity along racial lines, setting up differences within white biology.
As STS scholars have noted, contrary to the intentions of the UNESCO statements, the adoption of the term “population” represented primarily “a reformulation of race and not a break away from race” (Lipphardt Reference Lipphardt2014: 50). In this sense, the study of lactose science contributes to this body of scholarship by showing how population and ethnicity subtly kept race in the background (Reardon Reference Reardon2005). It also reveals how these terms maintain a salience by functioning as a shared epistemological object within what Peter Galison describes as a trading zone, a space of partial communication where disciplines coordinate around problems without requiring “full-fledged agreement” on meaning (Reference Galison and Gorman2010: 35). Within this interdisciplinary zone, population served as a flexible conceptual bridge, identifying functional overlaps that enable collaborations across medicine, human genetics, and anthropology.
These collaborations also reveal transatlantic connections between ostensibly discrete projects and interventions by non-scientists and clinicians in the postcolony, contributions that have remained largely buried in the medical archive. Although the Hopkins researchers are frequently credited for advancing knowledge about lactose digestion, the exchange between figures like Cook, Ransome-Kuti, and Simoons and their critique of research suppositions is rarely acknowledged in the narration of history of discovery (Stoler Reference Stoler2008). In shifting lactase deficiency from abnormality to the norm, their work played a decisive role in challenging the biracial structure embedded in U.S. medical practice and its tendency to pathologize the Other. At the same time, their findings showed that the “inborn errors of metabolism” studied by geneticists were not really errors at all.
What may come as a surprise is that racial constructs like “Anglo-Saxon” and “Hamitic” found their way back into scientific discourse through those critiques originating in Africa, raising important questions about how seemingly good intentions became misdirected. Figures like Kretchmer, Ransome-Kuti, and Simoons sought to supplant racial categories, emphasizing global human diversity and the role of culture and history—an approach made possible, in part, by drawing on data from Africa. In the framing of lactose metabolism as an interplay between culture and biology, they aimed to demonstrate that meaningful variation, construed as “patterns of difference,” is found within, rather than definitively between, racial groups.
Yet, in doing so, they inadvertently replaced one system of meaning with another. Although “race” and “human diversity”—types versus patterns—are treated as distinct, the “patterns of difference” constitutive of diversity are not independent of systems of meaning. For mid-century scientists, the scientific value of global studies like those on lactose metabolism lay in the potential to detect internal structure within groups. Diversity mattered insofar as it revealed the patterning within, especially the variation that exists within-group. But the idea of “within-group” variation already presumes the existence of a coherent “within” category—such as “Europeans and their descendants,” or “Indo-Europeans” versus others—thereby reifying identity categories even in the act of disaggregating them.
The transformation of global percentages of lactose intolerance into specific kinds—Simoons’s “low,” “intermediate,” and “high” groups—thus involved a classificatory logic that softened binary typologies without eliminating their codifying force. While such data purported to show “patterns of difference,” the question of how much difference is needed to render a pattern meaningful remained central (Marks Reference Marks2017, 53). “Low,” “intermediate,” and “high” came to represent both patterns of difference and patterns with difference. A seemingly minor difference in lactose metabolism—say, between a twenty-nine percent and a thirty-two percent LM rate—may appear marginal, but it makes quite the difference. It is this threshold between low and intermediate that renders a particular metabolic inheritance more definitive, less ambiguous. This boundary work may not have reinforced racial divisions per se, but it helped consolidate distinctions “within”—demarcating the limits of the “within.”
What this history ultimately reveals is that even a science committed to studying human diversity can rely on and reproduce systems of difference, systems in which certain forms of variation are deemed to matter more than others. In seeking to transcend race, such approaches inadvertently sustained the practice of categorization, creating a logic of difference in which “individuals can be both White and yet biologically distinct from other whites” (Jacobson Reference Jacobson1998, 6). The more granular the data, the more refined the science. Or so it seemed. Yet this very granularity furnished the means by which whiteness could be fractured, measured, and biologized anew.



 Open access

