

Many religions recommend fasting and adherents find it spiritually and physically helpful. Ramadan, the ninth lunar month of the Islamic Hijri calendar, is a period during which healthy adult Muslims are expected to refrain from eating, drinking, smoking, sexual activity and indulging in anything that is excessive or ill natured from dawn to dusk( Reference Roky, Houti and Moussamih 1 ). Islamic fasting during Ramadan does not require energy restriction; however, as intake of food and fluid becomes less frequent and is exclusively nocturnal – between sunset and sunrise – changes in body mass and weight might be expected( Reference Roky, Houti and Moussamih 1 , Reference Azizi 2 ). Since the Islamic calendar is based on a lunar cycle, every year Ramadan moves 11 d back and makes the fasting period vary from 11 to 18 h depending on geographical location of the country and the fasting season( Reference Roky, Houti and Moussamih 1 ).
Several nutritional changes occur and the quality of ingested nutrients differs during Ramadan compared with the rest of the year( Reference Lamri-Senhadji, El Kebir and Belleville 3 ); moreover, changes in meal frequency, food composition, energy intake and sleep duration have been reported( Reference Roky, Houti and Moussamih 1 , Reference Reilly and Waterhouse 4 ). Therefore, different effects of Ramadan fasting on lifestyle and metabolic indices have been reported in both the normal population and specific groups( Reference Roky, Houti and Moussamih 1 , Reference Leiper and Molla 5 , Reference Trepanowski, Canale and Marshall 6 ).
Within the last 30 years, results describing the effects of Ramadan fasting on body weight have been inconclusive. There are studies that reported a definite loss of body weight or body fat during Ramadan( Reference Muazzam and Khaleque 7 – Reference Mansi 13 ); while there are as many studies that showed either no significant loss of body weight( Reference El Ati, Beji and Danguir 14 – Reference Haouari, Haouari-Oukerro and Sfaxi 17 ) or a slight increase in body weight during or after Ramadan( Reference Lamri-Senhadji, El Kebir and Belleville 3 , Reference Maislos, Abou-Rabiah and Zuili 18 – Reference Haghdoost and Poorranjbar 20 ).
We performed a meta-analysis based on a systematic review to clarify the results of published literature designed to investigate the effects of Ramadan fasting on body weight. In addition, we extracted data on energy intake, diet composition, fasting time and participant age to examine the effects of these variables on weight changes due to Ramadan fasting.
Methods
Search strategy
All literature published in peer-reviewed journals addressing the effects of Ramadan fasting on body weight and composition were potential contributors to the database. We searched MEDLINE through PubMed and CINAHL (Cumulative Index to Nursing and Allied Health Literature) through EBSCO (Elton B Stephens Company) host.
Due to the religious nature of Ramadan fasting, the data available in the literature rely on weight changes before and after Ramadan, and no randomized controlled trial has been done. Therefore, a search strategy that combined a highly sensitive filter for observational studies along with subject-specific terms was used. The MeSH (Medical Subject Headings) terms and text words (and their combinations and truncated synonyms) were adapted as appropriate to search each database. The combination of keywords in searches of both databases was as follows: (‘Ramadan’ OR ‘fast*’ OR ‘Muslim fast*’ OR ‘Islam fast*’ OR ‘Islamic fast*’) AND (‘body weight’ OR ‘weight reduction’ OR ‘weight loss’ OR ‘weight gain’ OR ‘body fat distribution’ OR ‘waist circumference’ OR ‘BMI’ OR ‘BMI’ OR ‘body composition’). Attempts to contact authors to access missing data were also extensively performed. All searching procedures were completed between October and November 2011.
Additional studies were identified by searching the reference lists of identified papers and by searching the Science Citation Index for eligible papers that were commonly cited to identify subsequent studies that had cited them. The search was confined to full papers published in the English language with no limit on the date of publication.
Selection criteria
We read the abstracts of all identified studies to exclude those that were clearly not relevant. The full texts of the remaining articles were read to determine if they met the inclusion criteria. The extracted data were checked independently by two reviewers (S.M. and B.S.) and any discrepancies were resolved by consensus. Primary and quantitative studies were included if a baseline estimation of body weight either before Ramadan fasting or within the final week of the month of Ramadan and body weight after Ramadan were provided. Since any lifestyle change needs a minimum period of time to induce physiological change and weight change in particular, we excluded studies that reported body weight changes in a short time period (e.g. <2 weeks). We also excluded studies that were not representative of the general population. Studies conducted on specific subgroups, such as medically ill patients (e.g. diabetic, hyperlipidaemic or transplant patients), pregnant or breast-feeding women, athletes, refugees and prisoners, were excluded as well. There was 100 % agreement on inclusion and exclusion of studies.
Quality assessment and data extraction
To assess the quality of included studies, a simple checklist based on the Newcastle–Ottawa Scale and the Agency for Health Care Research and Quality was generated( Reference Wells, Shea and O'Connell 21 ). Studies were evaluated for methodological considerations of observational studies such as the representativeness of the sample, comparison, exposure ascertainment, outcome assessment, adequacy of follow-up, consideration of confounders and type of analysis.
Two investigators independently extracted data, reconciling differences by consensus. Information related to body weight, BMI, average daily nutrient consumption (i.e. intakes of carbohydrate, protein and fat) and total daily energy intake of participants before, during and after Ramadan, average fasting time during Ramadan, publication and study date, study population, sample size, age and gender of participants was extracted. There was 94 % agreement between data collectors across all items.
Statistical analysis
To compare the effects of Ramadan fasting on body weight, the difference between baseline body weight (weight in the first day of Ramadan or before that) and follow-up weight (either in the final week of Ramadan (Δweight1) or >2 weeks after Ramadan (Δweight2)) was computed for each study and used as the study end point. Additionally, the difference in body weight between the final week of Ramadan and >2 weeks after Ramadan (Δweight3) was computed.
For meta-analysis of the weight change between pre- and post-Ramadan, other than final and baseline measurements, the standard deviations of the weight change are also necessary; however, the availability of the latter in publications of interest is a challenging issue( Reference Thiessen Philbrook, Barrowman and Garg 22 , 23 ). In the current review, only four studies reported data on variances of Δweight1 and only two studies reported data on variances of Δweight2 and Δweight3. Since a large proportion of the primary articles did not provide information on variances of the Δweights, the imputation method based on reported P values for Δweights was used to calculate standard deviations of the weight changes. A detailed description of this method and its validity is reported elsewhere( Reference Thiessen Philbrook, Barrowman and Garg 22 , Reference Follmann, Elliott and Suh 24 ).
The analysis and reporting of the current review conformed as much as practicable to the MOOSE (Meta-analyses Of Observational Studies in Epidemiology) guideline( Reference Stroup, Berlin and Morton 25 ). We chose a fixed- or random-effects model to estimate the combined effects according to the results of the heterogeneity test (Cochrane Q). In addition, in order to minimize the random variation among point estimations, we adjusted findings of the studies using Bayesian analysis in forest plots. This technique uses the combined estimation as the prior probability and re-estimates the effect of each study accordingly( Reference Sutton and Abrams 26 ).
We estimated τ 2 as the indicator of heterogeneity using the restricted likelihood method. A significance level of P < 0·10 and I 2 > 50 % were considered as heterogeneity. In the case of significant heterogeneity, the random-effects model was used and the relevant factors were explored in subgroup analysis where data were available. We also used the meta-regression model to examine the effects of energy intake, diet composition, age and average fasting time on the weight changes during and after Ramadan fasting. Publication bias was examined visually with a funnel plot of study precision v. effect size and by using Begg and Mazumdar's adjusted rank correlation test. A sensitivity analyses was conducted to assess the contribution of each study to the overall effect. The analyses were performed using the Stata statistical software package version 11.
Results
Description of studies
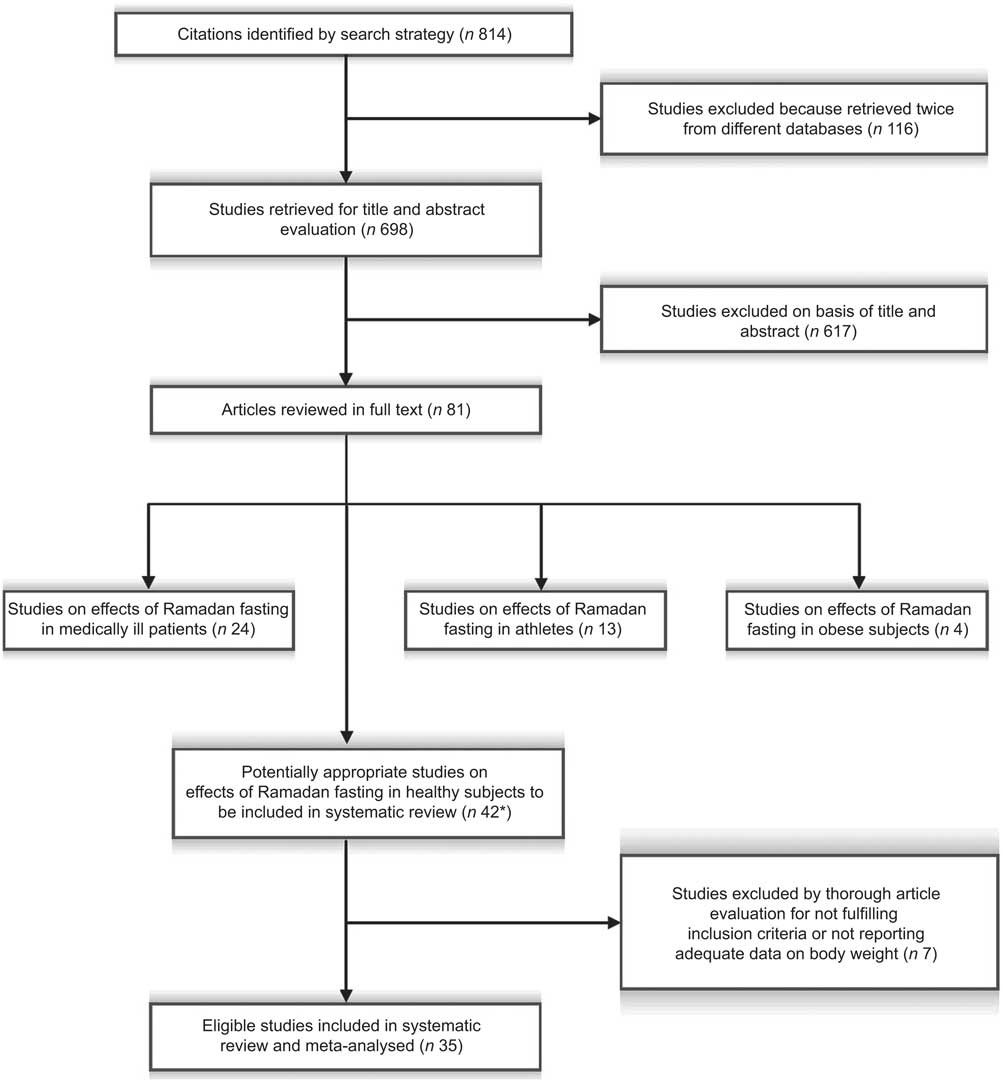
Out of 698 retrieved studies, thirty-five studies on the effects of fasting during Ramadan on body weight met the inclusion criteria and were subjected to meta-analysis; the stages of evaluation and exclusion of the identified studies are presented in Fig. 1.
Flowchart showing the selection of studies included in the present systematic review of Ramadan fasting effects on body weight (*two studies reported the effects of Ramadan fasting in healthy and obese subjects, and in healthy and diabetic subjects)
The methodological quality of the included studies was moderate, with a median score (stars) of 7 out of a possible 9 (interquartile range: 6–8). No study was omitted due to poor quality.
Table 1 provides detailed information on the studies used in the meta-analysis( Reference Lamri-Senhadji, El Kebir and Belleville 3 , Reference Fedail, Murphy and Salih 8 – Reference Haghdoost and Poorranjbar 20 , Reference Shoukry 27 – Reference Unalacak, Kara and Baltaci 47 ) and descriptive statistics of their characteristics. The average number of subjects per study was 35·8 (sd 27·9) and the subjects’ average age was 29·4 (sd 6·4) years old. The average time for fasting during the month of Ramadan in the included studies was 13·3 (sd 1·6) h/d (Table 2). Most of the included studies (54 %) provided findings for men and women combined; however, of studies reporting data only for one gender, twelve findings were recorded for men and four for women. Included studies were undertaken in different geographical locations. The studied populations included West Asian (n 19; more than 60 % of eligible studies), African (n 7), East Asian (n 3) and North American/European (n 4).
Description of studies included in the present systematic review of Ramadan fasting effects on body weight, and body weight, energy intake and diet composition before, during and after Ramadan fasting
M, males; F, females,
*SS, study sample size.
†Fasting duration, average fasting hours per day during Ramadan.
‡Wt, body weight (kg).
§Energy, energy intake (kJ/d).
∥CARB, carbohydrate intake (g/d).
¶Fat, fat intake (g/d).
Description of variables based on studies included in the present systematic review of Ramadan fasting effects on body weight
*Frequency-weighted mean for all variables except sample size and fasting duration.
†Number of studies included in each analysis.
‡BMI before or at the beginning of Ramadan.
Weight variation and Ramadan fasting
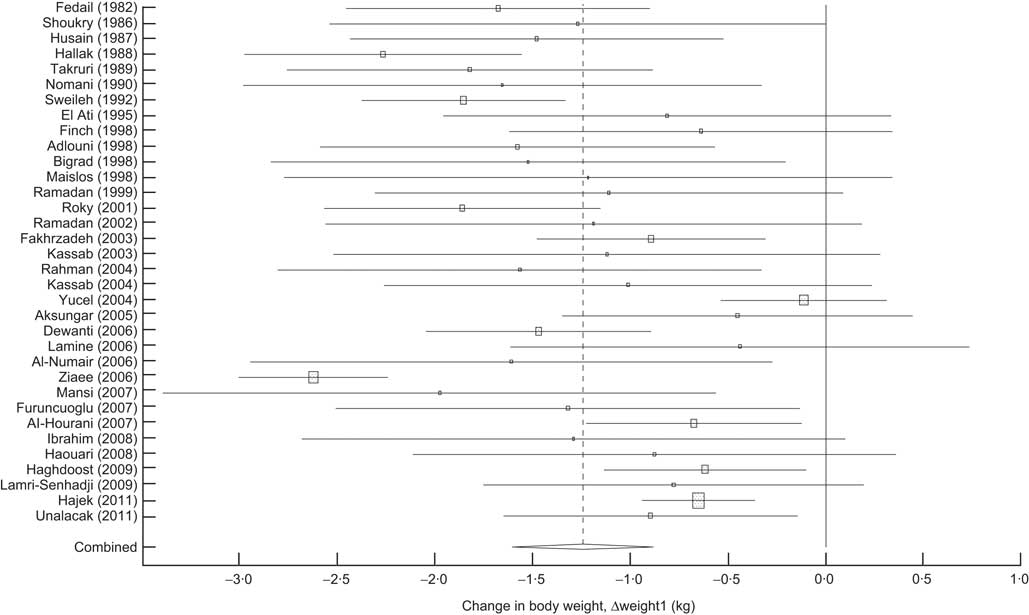
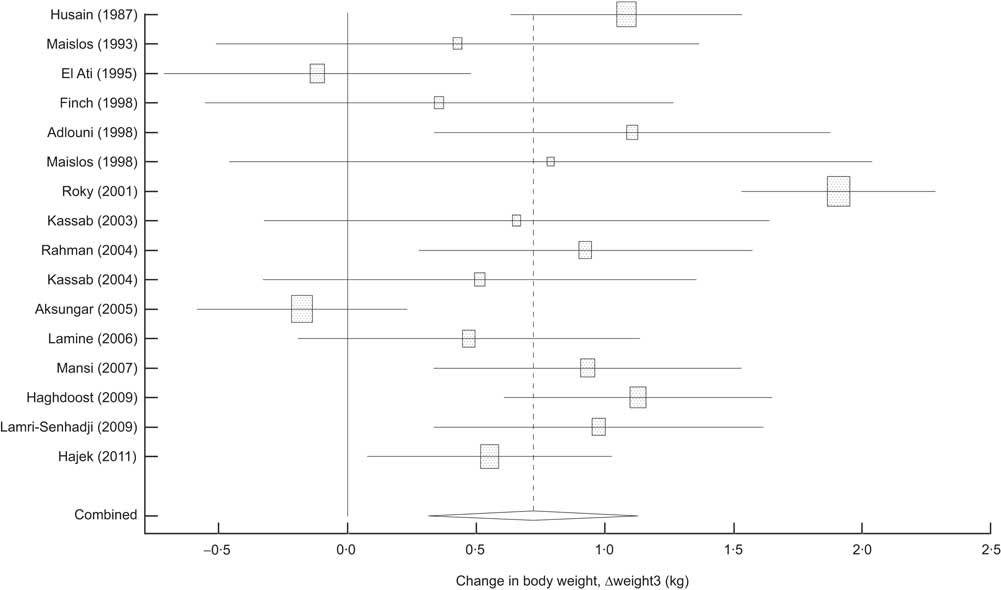
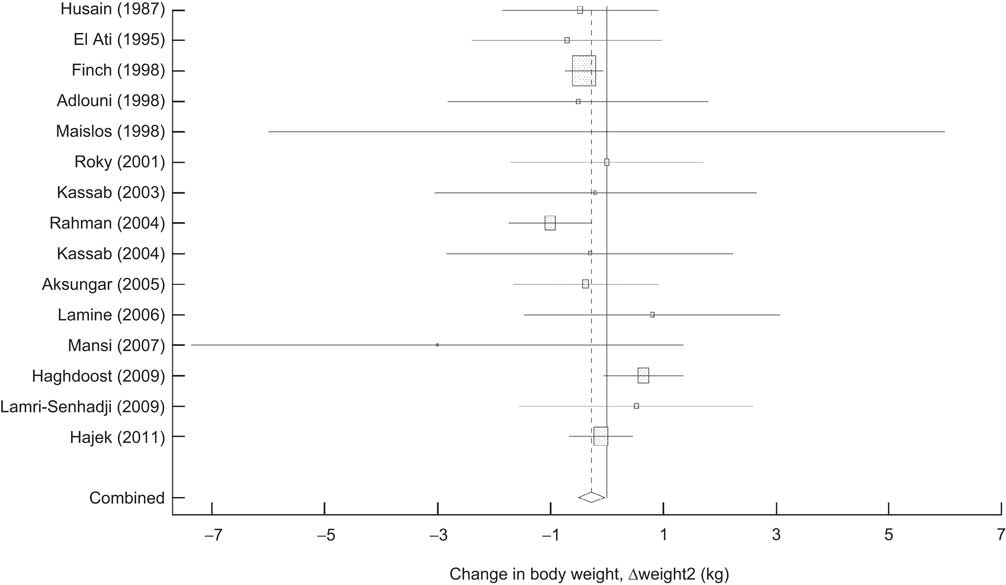
One study did not report the body weight of participants before Ramadan, whereas all of the included studies reported body weight at the end of Ramadan. A total of sixteen studies reported participants’ body weight after Ramadan. The mean initial weight for all 1234 subjects was 68·5 (sd 6·5) kg and the average baseline BMI was 23·5 (sd 1·9) kg/m2 (Table 2). When findings were pooled together, the results of the meta-analysis showed a 1·24 kg weight reduction during Ramadan (95 % CI −1·60, −0·88 kg; P < 0·001). Figure 2 shows the forest plot of thirty-four studies which pertain to the effects of fasting on body weight during Ramadan. The findings showed substantial heterogeneity in this category (I 2 = 79·1 %). The weight reduction during Ramadan was followed by a significant increase in weight after Ramadan (0·72 kg, 95 % CI 0·32, 1·13 kg; P < 0·001; Fig. 3). These findings also had substantial heterogeneity (I 2 = 81·7 %). When the reported body weight after Ramadan was compared with baseline values, the results of the meta-analysis showed a weight loss of 0·27 kg (95 % CI −0·51, −0·04 kg; P = 0·023; I 2 = 4·1 %). Figure 4 shows the forest plot with mean differences and 95 % confidence intervals, and the pooled estimate for the weight change after Ramadan compared with baseline values using a fixed-effects model. We did not find any sign of publication bias for studies in any of these categories (Table 3).
Forest plot showing the change in body weight during Ramadan (Δweight1; difference between baseline body weight (weight in the first day of Ramadan or before that) and follow-up weight (weight in the final week of Ramadan)); values are means with 95 % confidence intervals shown by horizontal bars. Studies are ordered alphabetically by name of first author and publication date. The pooled or ‘combined’ mean difference was calculated by a random-effects model. Studies are represented as squares centred on the point estimate of the result of each study. The area of the square represents the weight given to the study in the meta-analysis. The meta-analysed effect measure (centre line of diamond, dashed line) and its confidence interval are represented as a diamond. The solid vertical line is the line of no effect
Forest plot showing the change in body weight from the final week of Ramadan to >2 weeks after Ramadan (Δweight3); values are means with 95 % confidence intervals shown by horizontal bars. Studies are ordered alphabetically by name of first author and publication date. The pooled or ‘combined’ mean difference was calculated by a random-effects model. Studies are represented as squares centred on the point estimate of the result of each study. The area of the square represents the weight given to the study in the meta-analysis. The meta-analysed effect measure (centre line of diamond, dashed line) and its confidence interval are represented as a diamond. The solid vertical line is the line of no effect
Forest plot showing the change in body weight due to Ramadan (Δweight2; difference between baseline body weight (weight in the first day of Ramadan or before that) and follow-up weight >2 weeks after Ramadan); values are means with 95 % confidence intervals shown by horizontal bars. Studies are ordered alphabetically by name of first author and publication date. The pooled or ‘combined’ mean difference was calculated by a fixed-effects model. Studies are represented as squares centred on the point estimate of the result of each study. The area of the square represents the weight given to the study in the meta-analysis. The meta-analysed effect measure (centre line of diamond, dashed line) and its confidence interval are represented as a diamond. The solid vertical line is the line of no effect
Results of the meta-analysis of the studies investigating the effect of fasting on weight changes before and after Ramadan
Δweight1, difference between body weight at the end of Ramadan and baseline body weight before Ramadan; Δweight2, difference between body weight after Ramadan (>2 weeks) and baseline body weight; Δweight3, difference between body weight after Ramadan and body weight at the end of Ramadan (when the number of findings was <3, only pooled analysis was performed).
*Number of studies included in each analysis.
†Based on Begg's test to estimate the chance of publication bias.
When findings for weight variation were meta-analysed separately for men and women, weight loss in both genders at the end of Ramadan was statistically significant (−1·51 kg for men and −0·92 kg for women); however, this weight loss did not last for >2 weeks after Ramadan. In both men and women, body weight after Ramadan compared with the baseline value showed a small non-significant decrease (−0·10 kg, P = 0·83 and −0·55 kg, P = 0·37, respectively). During post-Ramadan weeks, compared with the end of Ramadan, men gained 1·02 kg in weight (95 % CI 0·42, 1·63 kg; P < 0·001), whereas women's weight remained unchanged (Table 3).
In East Asian populations, there was a significant weight loss (−1·56 kg, 95 % CI −2·10, −1·04; P < 0·001) between baseline and the end of Ramadan. Weight reduction during Ramadan was also statistically significant in West Asian and African populations (−1·24 kg, P < 0·001 and −1·13 kg, P = 0·001, respectively). Although weight loss in Europeans was less than that in other populations, it was statistically significant (−0·64 kg, P < 0·001). Meta-analysis of studies undertaken in Africa and West Asia showed that the weight lost during Ramadan was regained after Ramadan; however, studies of East Asian populations showed a reduction in participants’ body weight after Ramadan compared with baseline values (Table 3).
Diet composition and energy consumption during fasting periods were recorded in fourteen studies and thirteen studies recorded baseline values before Ramadan. In three studies, the total daily energy intake did not change. During Ramadan, the number of studies with increased total daily energy intake was equal to the number of studies with decreased total daily energy intake during Ramadan. Before Ramadan, the total average daily energy intake was 8027 (sd 2110) kJ, which increased to 8219 (sd 2527) kJ during Ramadan month. The total energy intake continued to increase even after Ramadan (9923 (sd 1818) kJ/d). Overall, carbohydrate was the food group with the largest consumption (>55 % of total energy intake) before, during and after Ramadan.
Meal frequency during Ramadan, compared with the periods before and after Ramadan, was reduced to essentially two per day in almost all studies. The increase in total daily energy intake during Ramadan was not due to an increase in carbohydrate consumption (56·9 (sd 10·1) v. 57·4 (sd 5·5) % of total energy intake). The percentage of energy intake from protein and fat during Ramadan did not change considerably compared with before or after the month of Ramadan (Table 2).
The total energy intake was not similar in all geographical locations. The baseline daily energy intake was considerably lower in West Asian populations. During the month of Ramadan, West and East Asian populations reduced their daily energy intake by 600–900 kJ/d, whereas the daily energy intake of African populations increased by about 1100 kJ/d (Table 4). The increase in energy intake in African populations during Ramadan was mainly due to an 84 g/d increase in carbohydrate consumption (from 775·3 (sd 626·0) to 859·3 (sd 713·8) g/d) and a 45 g/d increase in fat consumption (286·1 (sd 268·4) to 331·3 (sd 296·5) g/d), while protein consumption increased only by 27 g/d (174·3 (sd 124·0) to 201·0 (sd 141·0) g/d). In both West and East Asian populations a decline in carbohydrate consumption during Ramadan was the main reason for the reduction in daily energy intake.
Frequency-weighted mean diet composition in different geographical locations
*n, total number of participants in each category used as frequency weight.
In meta-regression model, the effects of baseline BMI, age, fasting time and energy intake on Δweights were investigated; however, none of the these variables had a considerable effect on the weight reduction during and after Ramadan.
Discussion
Religious fasting, including Islamic fasting, provides a unique and interesting vantage point for evaluating the effects of food restriction/modification( Reference Trepanowski, Canale and Marshall 6 ). Ramadan fasting is a natural experiment that occurs annually for 1 month and requires specific practices, such as nocturnal consumption of food and changes in meal frequency, food quality, energy intake and sleep cycle. Different studies have reported both positive and negative effects of Ramadan fasting on overall health. The present review summarizes the best available evidence on the effects of Ramadan fasting on weight loss in a healthy population.
Weight loss may reduce cardiovascular morbidity and mortality and may lead to prevention of type 2 diabetes and improved control of hypertension( Reference Poirier, Giles and Bray 48 – Reference Nordmann, Nordmann and Briel 50 ). At any given time, about 40–60 % of the adult population in Western countries is attempting to lose or maintain weight( Reference Teixeira, Silva and Coutinho 51 ).
Our results demonstrated that studies have heterogeneous findings regarding the effects of fasting on body weight during and after Ramadan. Overall, body weight decreased during Ramadan, which suggests that Muslims do not gain weight as a result of skipping daytime meals during Ramadan but rather lose more than a kilogram of weight; however, the weight lost was regained 6 weeks from the beginning of Ramadan. Muslim men lost more weight than women during Ramadan. A possible explanation may be women's prohibition from fasting during their menstrual periods, which results in fewer days of fasting during Ramadan. Women managed to maintain their body weight after Ramadan but men gained about 1 kg during post-Ramadan weeks. It is suggested that fat oxidation during Ramadan fasting may result in an adaptive mechanism for weight maintenance in women( Reference Mansi 13 ). In both genders, post-Ramadan weight showed insignificant change from baseline body weight.
During Ramadan, changes in the timing of food and fluid intake along with the reduction of meal frequency may result in various physiological changes( Reference Roky, Houti and Moussamih 1 ). It is believed that Ramadan fasting often leads to reduced energy intake and weight loss occurs as a result( Reference Hallak and Nomani 9 ) but our findings do not support this hypothesis. Despite the decreased meal frequency during Ramadan in almost all studies, only one-third of included studies showed decreased energy intake during Ramadan. The studies on West and East Asian populations mostly reported that total daily energy intake reduced during Ramadan, but in African populations total daily energy intake was mostly increased. However, the weight loss at the end of Ramadan was not considerably different among African, West Asian and East Asian populations. It is reported that an increase in body weight after Ramadan might be due to less physical activity and/or more energy intake( Reference Frost and Pirani 52 ). Since the number of studies with information on energy intake and physical activity after Ramadan was inadequate, we were not able to examine this hypothesis.
It is obvious that dietary habits and food choices vary among different cultures; hence, percentages of energy intake from carbohydrate, protein and fat are not similar in different Islamic countries. In relation to macronutrient composition, it is reported that meals are often composed of more fat and less carbohydrate during Ramadan compared with the rest of the year( Reference El Ati, Beji and Danguir 14 , Reference Maislos, Khamaysi and Assali 30 ). On the other hand, carbohydrate comprised the largest proportion of foods consumed during Ramadan. The increased energy intake in African populations and the reduced energy intake in West and East Asian populations were both the result of increased or decreased intake of all macronutrients. However, the number of studies in different geographical locations which reported macronutrient consumption during Ramadan as well as information on weight variation was inadequate for a clear conclusion about their effects on weight loss.
In different studies various explanations were given for the discrepancies of the reported results; the length and the temperature of the fasting days( Reference Roky, Houti and Moussamih 1 , Reference Bakhotmah 53 ), meal schedules and frequencies( Reference Roky, Houti and Moussamih 1 ), eating behaviours and the quality and quantity of food intakes( Reference Trepanowski, Canale and Marshall 6 , Reference El Ati, Beji and Danguir 14 ), fluid intakes( Reference Leiper and Molla 5 , Reference Gumaa, Mustafa and Mahmoud 54 ), sleeping patterns and duration( Reference Reilly and Waterhouse 4 ), physical activity( Reference El Ati, Beji and Danguir 14 , Reference Haghdoost and Poorranjbar 20 ) and age( Reference Trepanowski, Canale and Marshall 6 ) are all reported to have effect on weight loss during Ramadan. The results of our meta-regression model showed that duration of fasting, age, baseline BMI, total energy intake and geographical location have no effect on weight loss in healthy populations during Ramadan. Since the number of studies on the effects of macronutrient consumption, sleep cycle, fluid intake or physical activity on weight variation during Ramadan was not enough for meta-regression, we did not include these studies in our review.
Changes in sleeping hours might change the serum level of leptin, insulin and cortisol; these factors could affect daily energy consumption( Reference Kassab, Abdul-Ghaffar and Nagalla 38 ) and indirectly may explain some of the body weight variation during and after Ramadan.
Some authors suggest that the body weight changes could be attributed to variations of fluid intake( Reference Sweileh, Schnitzler and Hunter 11 , Reference Gumaa, Mustafa and Mahmoud 54 ). Dehydration certainly occurs during the fasting hours. Acute changes in total body water are best characterized by repeated measurements of body mass; however, with small losses in body mass over a long period of time, any other changes in body composition may bias the measurement of dehydration. Thus, the separation or the quantification of the effects of fasting on body weight from dehydration as a result of fasting seems to be difficult or impossible( Reference Leiper and Molla 5 ).
Metabolic responses, for instance to a glucose load, are slower in the evening than in the morning; moreover, gastric emptying and blood flow are greater during the daytime than at night, which leads to a faster absorption of foodstuffs from the gastrointestinal tract( Reference Sanders and Moore 55 ). Thus, another likely explanation for the weight loss may be related to the lower absorption of foods eaten nocturnally during Ramadan.
Smoking is prohibited during fasting hours, therefore limiting the number of cigarettes per day might be related to weight gain among smokers in Ramadan( Reference Hughes 56 ). All of the above explanations might be good reasons for the observed heterogeneity among studies.
Conclusion
The present systematic review shows that the weight lost during Ramadan is relatively small and that body weight variations during Ramadan fasting are mostly reversed after Ramadan, gradually returning to pre-Ramadan status. Ramadan provides an opportunity to lose weight, but structured and consistent lifestyle modifications are necessary to achieve life-lasting weight loss. Although our findings regarding body weight variations as a result of Ramadan fasting were heterogeneous, we believe that restrictions in meal frequencies or energy intake alone cannot explain these variations, and the combination of different factors such dehydration, changes in diet, physical activity and even sleeping hours may be influential. Hence, further studies are needed to investigate the role of dehydration and changes in diet, sleeping hours and physical activity on body weight during Ramadan.
Acknowledgements
Sources of funding: This work was supported by a grant from the Kerman University of Medical Sciences, Iran through grant number 90/348 (awarded to B.S.). Conflicts of interest: The authors declare that there are no conflicts of interest. Author's contribution: A.A.H. and B.S. directed the study and were involved in the study design. S.M., M.J.Z. and B.S. were involved in designing the search strategy, data collection and entry. B.S. and A.A.H. carried out the analysis. F.K. and B.S. had primary responsibility for drafting the manuscript and all authors contributed to writing and revising the manuscript. Acknowledgements: The authors are grateful to Dr N. Pourdamghan for her excellent assistance in searching and gathering the literature for this review and Dr M. Karamuzian for her comments on the manuscript.


