


1. Introduction
The interaction of particles with vortical structures occurs in many environmental and industrial applications, such as the suspension of particulate matter in the atmosphere, sediment transport in rivers, suspended particles in turbulent ocean currents and fluidised bed reactors with solid particles suspended in gas. In such flows, the presence of particles influences the mass, momentum and energy exchange between the two phases by means of a number of mechanisms, such as enhanced dissipation, transfer of kinetic energy across both phases and shedding behind the particles, as discussed by many studies (e.g. Voth et al. Reference Voth, la, Arthur, Alice, Alexander and Bodenschatz2002; L’vov et al. Reference L’vov, Ooms and Pomyalov2003; Shaw Reference Shaw2003; Calzavarini et al. Reference Calzavarini, Cencini, Lohse and Toschi2008; Hölzer & Sommerfeld Reference Hölzer and Sommerfeld2008; Toschi & Bodenschatz Reference Toschi and Bodenschatz2009; Balachandar & Eaton Reference Balachandar and Eaton2010; Dritselis & Vlachos Reference Dritselis and Vlachos2011; Richter & Sullivan Reference Richter and Sullivan2014). The intricate nature of these interactions, involving the complex motion of particles and simultaneous alterations in vortices, despite being studied by a wide number of researchers, remains inadequately understood. A large number of studies (Squires & Eaton Reference Squires and Eaton1989; Bini & Jones Reference Bini and Jones2008; Voth & Soldati Reference Voth and Soldati2017; Yu et al. Reference Yu, Lin, Shao and Wang2017; Mathai, Lohse & Sun Reference Mathai, Lohse and Sun2020) discussed the importance of the particle-to-fluid density ratio on aspects such as particle motion and preferential distribution, which in turn would influence the modifications of the carrier phase. In this context, it may be noted that most studies on particle-laden flows are focused on heavy particles (e.g. Squires & Eaton Reference Squires and Eaton1990; Fessler, Kulick & Eaton Reference Fessler, Kulick and Eaton1994; Bec et al. Reference Bec, Biferale, Boffetta, Celani, Cencini, Lanotte, Musacchio and Toschi2006; Cencini et al. Reference Cencini, Bec, Biferale, Boffetta, Celani, Lanotte, Musacchio and Toschi2006; Hwang & Eaton Reference Hwang and Eaton2006), where the particles are thrown outside the high-vorticity regions (Balachandar & Eaton Reference Balachandar and Eaton2010; Brandt & Coletti Reference Brandt and Coletti2022). There are also a few studies on neutrally buoyant particles (e.g. Homann & Bec Reference Homann and Bec2010; Loisel et al. Reference Loisel, Abbas, Masbernat and Climent2013; Cisse et al. Reference Cisse, Saw, Gibert, Bodenschatz and Bec2015; Mathai et al. Reference Mathai, Prakash, Brons, Sun and Lohse2015; Picano, Breugem & Brandt Reference Picano, Breugem and Brandt2015). In comparison, studies on lighter (buoyant) particles are fairly limited (Balachandar & Eaton Reference Balachandar and Eaton2010), where the lighter (buoyant) particles are likely to stay longer inside the high-vorticity regions (Calzavarini et al. Reference Calzavarini, Cencini, Lohse and Toschi2008; Volk et al. Reference Volk, Calzavarini, Verhille, Lohse, Mordant, Pinton and Toschi2008; Mercado et al. Reference Mercado2012; Tagawa et al. Reference Tagawa, Mercado, Prakash, Calzavarini, Sun and Lohse2012), similar to bubbles (Magnaudet & Eames Reference Magnaudet and Eames2000; Risso Reference Risso2018; Mathai et al. Reference Mathai, Lohse and Sun2020). It may also be noted that despite numerous studies on bubbly-turbulent flows (Risso Reference Risso2018; Elghobashi Reference Elghobashi2019), lighter particle–turbulence interactions still need further investigations since the flow modifications by bubbles could be substantially different compared with light particles due to bubbles’ deformation and breakup (Lu, Fernández & Tryggvason Reference Lu, Fernández and Tryggvason2005; Lu & Tryggvason Reference Lu and Tryggvason2008; Van Gils et al. Reference van Gils, Narezo Guzman, Sun and Lohse2013; Mathai et al. Reference Mathai, Lohse and Sun2020). Motivated by the above considerations, in the present work, we experimentally investigate an idealisation of lighter particle–turbulence interactions, namely the interaction of a buoyant spherical particle (density ratio ${\rho }_{particle}/{\rho }_{water}\approx$
0.008) with a single (water) vortex ring (see figure 1
a).
${\rho }_{particle}/{\rho }_{water}\approx$
0.008) with a single (water) vortex ring (see figure 1
a).
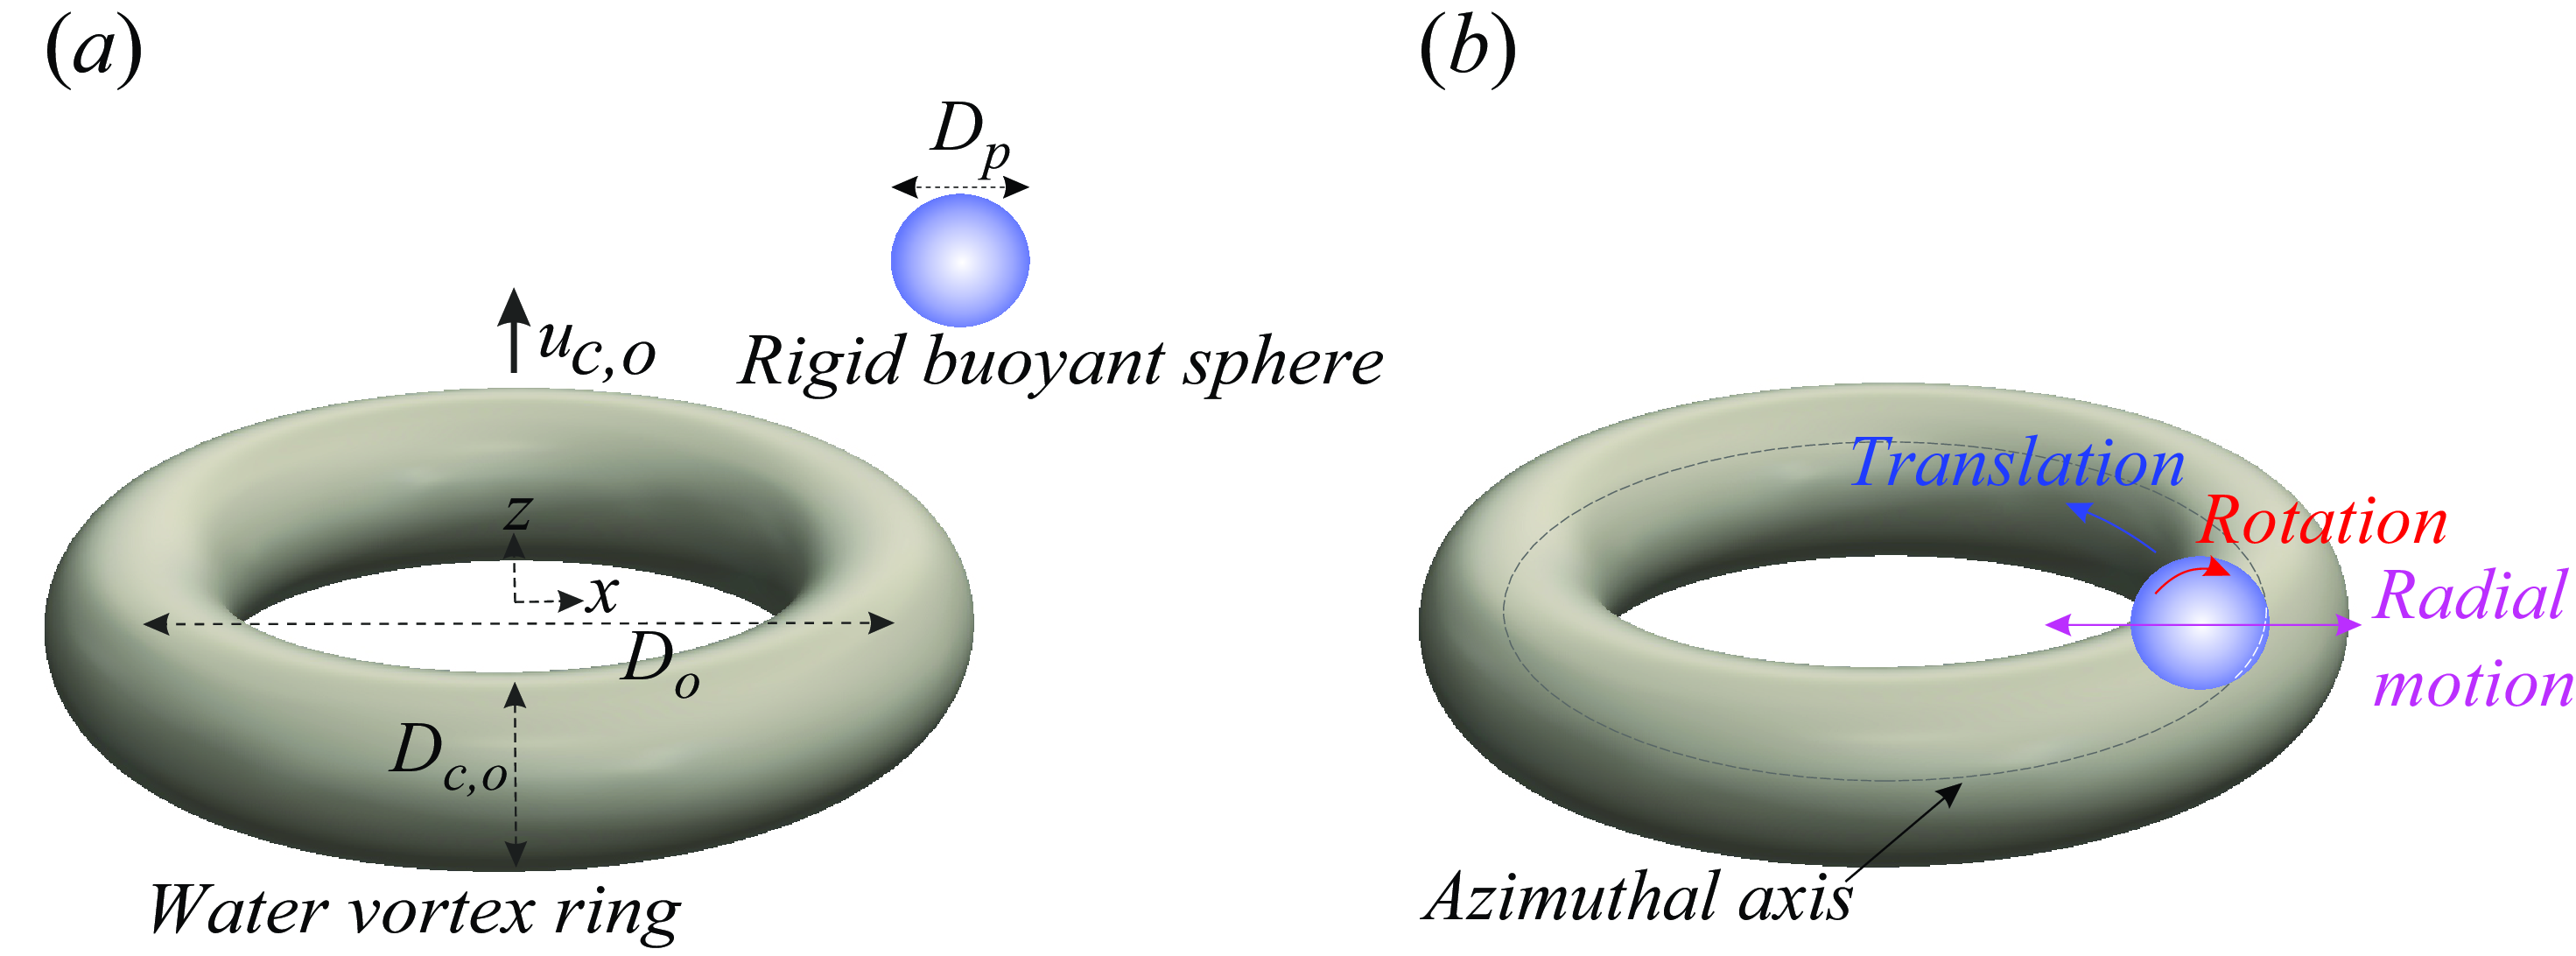
(a) Schematic of a freely rising buoyant particle of diameter $D_p$
and a vortex ring of ring diameter
$D_p$
and a vortex ring of ring diameter $D_o$
and core diameter
$D_o$
and core diameter $D_{c,o}$
travelling vertically upward with velocity
$D_{c,o}$
travelling vertically upward with velocity $u_{c,o}$
. In this case, the buoyant particle is outside the ring before capture. (b) Following the capture of the (buoyant) particle within the ring core, the particle undergoes azimuthal translation, spins and oscillates radially inside the core. In the present experiments, these motions are captured from the side-view and top-view imaging of the ring–particle interactions, as in figure 2, where the ring’s azimuthal axis is marked with micrometre-sized tracer bubbles.
$u_{c,o}$
. In this case, the buoyant particle is outside the ring before capture. (b) Following the capture of the (buoyant) particle within the ring core, the particle undergoes azimuthal translation, spins and oscillates radially inside the core. In the present experiments, these motions are captured from the side-view and top-view imaging of the ring–particle interactions, as in figure 2, where the ring’s azimuthal axis is marked with micrometre-sized tracer bubbles.
In particle-laden turbulent flows, particle size is known to be a critical parameter governing both the particle dynamics and the modifications in the carrier phase (McLaughlin Reference McLaughlin1988; Gore & Crowe Reference Gore and Crowe1989; Sheen, Jou & Lee Reference Sheen, Jou and Lee1994; Pan & Banerjee Reference Pan and Banerjee1997; Kaftori, Hetsroni & Banerjee Reference Kaftori, Hetsroni and Banerjee1998; Balachandar & Eaton Reference Balachandar and Eaton2010; Costa et al. Reference Costa, Picano, Brandt and Breugem2018). Given the presence of varying scales of eddies and vortices in turbulent flows (Zhou, Adrian & Balachandar Reference Zhou, Adrian and Balachandar1996), the presence of particles in these flows could be seen as an interaction of particles with vortical structures of different length scales, involving complex motion of particles and simultaneous alterations in these vortices. Since the statistical/global properties of turbulence are formulated from vortical structures (Perry & Chong Reference Perry and Chong1982), to better understand these flows, one has to focus on the role of particle size in the modifications of these structures. It may be noted that even though there have been a large number of studies on the effects of large-scale coherent structures on particle behaviour (e.g. Rashidi, Hetsroni & Banerjee Reference Rashidi, Hetsroni and Banerjee1990; Brooke et al. Reference Brooke, Kontomaris, Hanratty and McLaughlin1992; Kaftori, Hetsroni & Banerjee Reference Kaftori, Hetsroni and Banerjee1995; Rouson & Eaton Reference Rouson and Eaton2001; Marchioli & Soldati Reference Marchioli and Soldati2002), studies on the effects of particles on these structures are fairly limited (Dritselis & Vlachos Reference Dritselis and Vlachos2008; Feng et al. Reference Feng, Liu and Zheng2024). Driven by these motivations, the present work focuses on the effect of the (buoyant) particle-to-vortex size ratio on both the particle dynamics and the vortex ring dynamics. Furthermore, we seek to answer if there is any critical particle size above which the particle would have a substantial influence on the ring dynamics.
On the interaction of particles with a single vortex, studies have mostly focused on the interaction of a vortex ring with heavier particles. For example, a number of studies (Uchiyama & Yagami Reference Uchiyama and Yagami2008; Uchiyama & Shimada Reference Uchiyama and Shimada2014; Uchiyama, Yano & Degawa Reference Uchiyama, Yano and Degawa2017) have reported the transport of heavy solid particles by a convecting vortex ring where the particles led to a reduction in the ring’s velocity and circulation. Marcu, Meiburg & Newton (Reference Marcu, Meiburg and Newton1995) performed linear stability analysis for the motion of heavy particles in the flow field of a Burgers vortex, where the heavier particles are likely to get thrown out of the vortex core centre. Mouallem et al. (Reference Mouallem, Daryan, Wawryk, Pan and Hickey2021) reported on the transport of heavy particles using controlled vortex ring reconnection. In these studies, while the Stokes number was kept low, the size of the heavy particles was also much smaller in comparison with the vortex core. These small particles had relatively minor effects on the ring’s dynamics. As regards larger particles, recently Biswas & Govardhan (Reference Biswas and Govardhan2022) reported the interaction of a buoyant particle (of the order of the vortex core diameter) with a vortex ring. They kept the particle density very low ( ${\rho }_{particle}/{\rho }_{fluid}\approx$
0.008, and low Stokes number) which ensured that the particle stayed within the ring, unlike heavy particles being thrown outside the ring’s core (e.g. Marcu et al. Reference Marcu, Meiburg and Newton1995). Biswas & Govardhan (Reference Biswas and Govardhan2022) observed dramatic disruption of the vortex ring by the large (buoyant) particle, resulting in a substantial reduction in the ring’s convection speed and enstrophy.
${\rho }_{particle}/{\rho }_{fluid}\approx$
0.008, and low Stokes number) which ensured that the particle stayed within the ring, unlike heavy particles being thrown outside the ring’s core (e.g. Marcu et al. Reference Marcu, Meiburg and Newton1995). Biswas & Govardhan (Reference Biswas and Govardhan2022) observed dramatic disruption of the vortex ring by the large (buoyant) particle, resulting in a substantial reduction in the ring’s convection speed and enstrophy.
In comparison with particle–vortex interactions, there have been more studies on the interaction of a vortex ring with bubbles (e.g. Higuera Reference Higuera2004; Revuelta Reference Revuelta2010; Jha & Govardhan Reference Jha and Govardhan2015; Zednikova et al. Reference Zednikova, Stanovsky, Travnickova, Orvalho, Holub and Vejrazka2019; Foronda-Trillo et al. Reference Foronda-Trillo, Rodríguez-Rodríguez, Gutiérrez-Montes and Martínez-Bazán2021; Biswas & Govardhan Reference Biswas and Govardhan2021, Reference Biswas and Govardhan2022, Reference Biswas and Govardhan2023; Zhang et al. Reference Zhang, Deng and Shao2023). For example, Sridhar & Katz (Reference Sridhar and Katz1999) reported distortion of the vortex ring core by a few microbubbles, and after the bubbles’ escape from the measurement plane, the core returned to its initial state. Ferrante & Elghobashi (Reference Ferrante and Elghobashi2007), in their numerical study on microbubbles’ interaction with a Taylor–Green vortex, observed that bubbles caused a reduction in vorticity and enstrophy due to positive local divergence. Foronda-Trillo et al. (Reference Foronda-Trillo, Rodríguez-Rodríguez, Gutiérrez-Montes and Martínez-Bazán2021) recently reported three-dimensional simulations of the breakup of an air bubble colliding with a transitional vortex ring and, on the ring side, a drop in azimuthal enstrophy. The very recent experimental investigations on the interaction of a vortex ring with a single bubble (Jha & Govardhan Reference Jha and Govardhan2015; Biswas & Govardhan Reference Biswas and Govardhan2022) and a large number of bubbles (Biswas & Govardhan Reference Biswas and Govardhan2020) reported a fragmentation of the vortex core at low Weber numbers, in turn leading to a significant reduction in the ring’s propagation speed and azimuthal enstrophy. The importance of studying the role of bubble-to-vortex size ratio in these interactions was highlighted by Martínez-Bazán (Reference Martínez-Bazán2015). It may be noted that the interaction of a bubble with a vortex ring would have substantial differences compared with a (buoyant) particle due to the deformability and breakup of bubbles, which has been recently highlighted by Biswas & Govardhan (Reference Biswas and Govardhan2022), for a fixed bubble (and particle) size. Building upon the findings from our previous studies (Jha & Govardhan Reference Jha and Govardhan2015; Biswas & Govardhan Reference Biswas and Govardhan2022, Reference Biswas and Govardhan2023), the present work aims to understand the effect of the (buoyant) spherical particle-to-vortex ring core size ratio on the particle motion inside the vortex ring and the simultaneous modifications in the ring dynamics.
In the present study, the vortex ring is characterised by ring diameter ( $D_o$
), core diameter (
$D_o$
), core diameter ( $D_{c,o}$
) and circulation (
$D_{c,o}$
) and circulation ( $\varGamma$
)-based Reynolds number (
$\varGamma$
)-based Reynolds number ( $Re=\varGamma /\nu$
;
$Re=\varGamma /\nu$
; $\nu$
is the kinematic viscosity). The vortex core-to-ring diameter ratio (
$\nu$
is the kinematic viscosity). The vortex core-to-ring diameter ratio ( $D_{c,o}/D_o$
) is about 0.2, implying a thin-core vortex ring (Norbury Reference Norbury1973). In the present work, the vortex core size remains nearly constant across different
$D_{c,o}/D_o$
) is about 0.2, implying a thin-core vortex ring (Norbury Reference Norbury1973). In the present work, the vortex core size remains nearly constant across different $\varGamma$
cases, while the particle size is varied, yielding a range of
$\varGamma$
cases, while the particle size is varied, yielding a range of $D_p/D_{c,o}$
that varies from about 0.62 to 1.67 with the corresponding particle-to-ring core volume ratio (
$D_p/D_{c,o}$
that varies from about 0.62 to 1.67 with the corresponding particle-to-ring core volume ratio ( $V_R$
=
$V_R$
= ${\pi }(D^3_P/6)/({\pi }^2D_oD^2_{c,o}/4)$
) varying between about 0.01 and 0.20 (see table 1). The influence of
${\pi }(D^3_P/6)/({\pi }^2D_oD^2_{c,o}/4)$
) varying between about 0.01 and 0.20 (see table 1). The influence of $D_p/D_{c,o}$
is investigated across a broad range of ring
$D_p/D_{c,o}$
is investigated across a broad range of ring $Re$
(
$Re$
( $\approx$
6000–67 300), which essentially represents particle interactions with vortices of varying strengths in turbulent flows. In the current experiments, a (buoyant) particle is introduced close to an upward-travelling vortex ring resulting in the particle’s capture by the low-pressure vortex core that results in the start of their interactions.
$\approx$
6000–67 300), which essentially represents particle interactions with vortices of varying strengths in turbulent flows. In the current experiments, a (buoyant) particle is introduced close to an upward-travelling vortex ring resulting in the particle’s capture by the low-pressure vortex core that results in the start of their interactions.
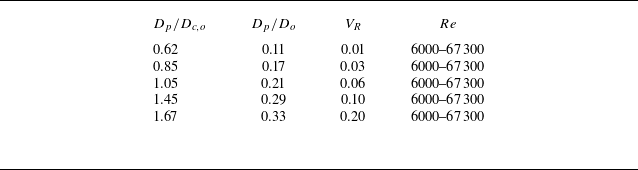
Table showing the range of particle-to-ring core diameter ratio ( $D_p/D_{c,o}$
), particle-to-ring diameter ratio (
$D_p/D_{c,o}$
), particle-to-ring diameter ratio ( $D_p/D_{o}$
), particle-to-ring core volume ratio (
$D_p/D_{o}$
), particle-to-ring core volume ratio ( $V_R$
) and ring-circulation-based Reynolds number (
$V_R$
) and ring-circulation-based Reynolds number ( $Re$
), all measured before the interaction begins. The ring core-to-ring diameter ratio (
$Re$
), all measured before the interaction begins. The ring core-to-ring diameter ratio ( $D_{c,o}/D_o$
) is kept fixed at
$D_{c,o}/D_o$
) is kept fixed at $\approx\,$
0.2
$\approx\,$
0.2 $\pm$
0.01.
$\pm$
0.01.
1.1. An example of vortex ring–particle interaction
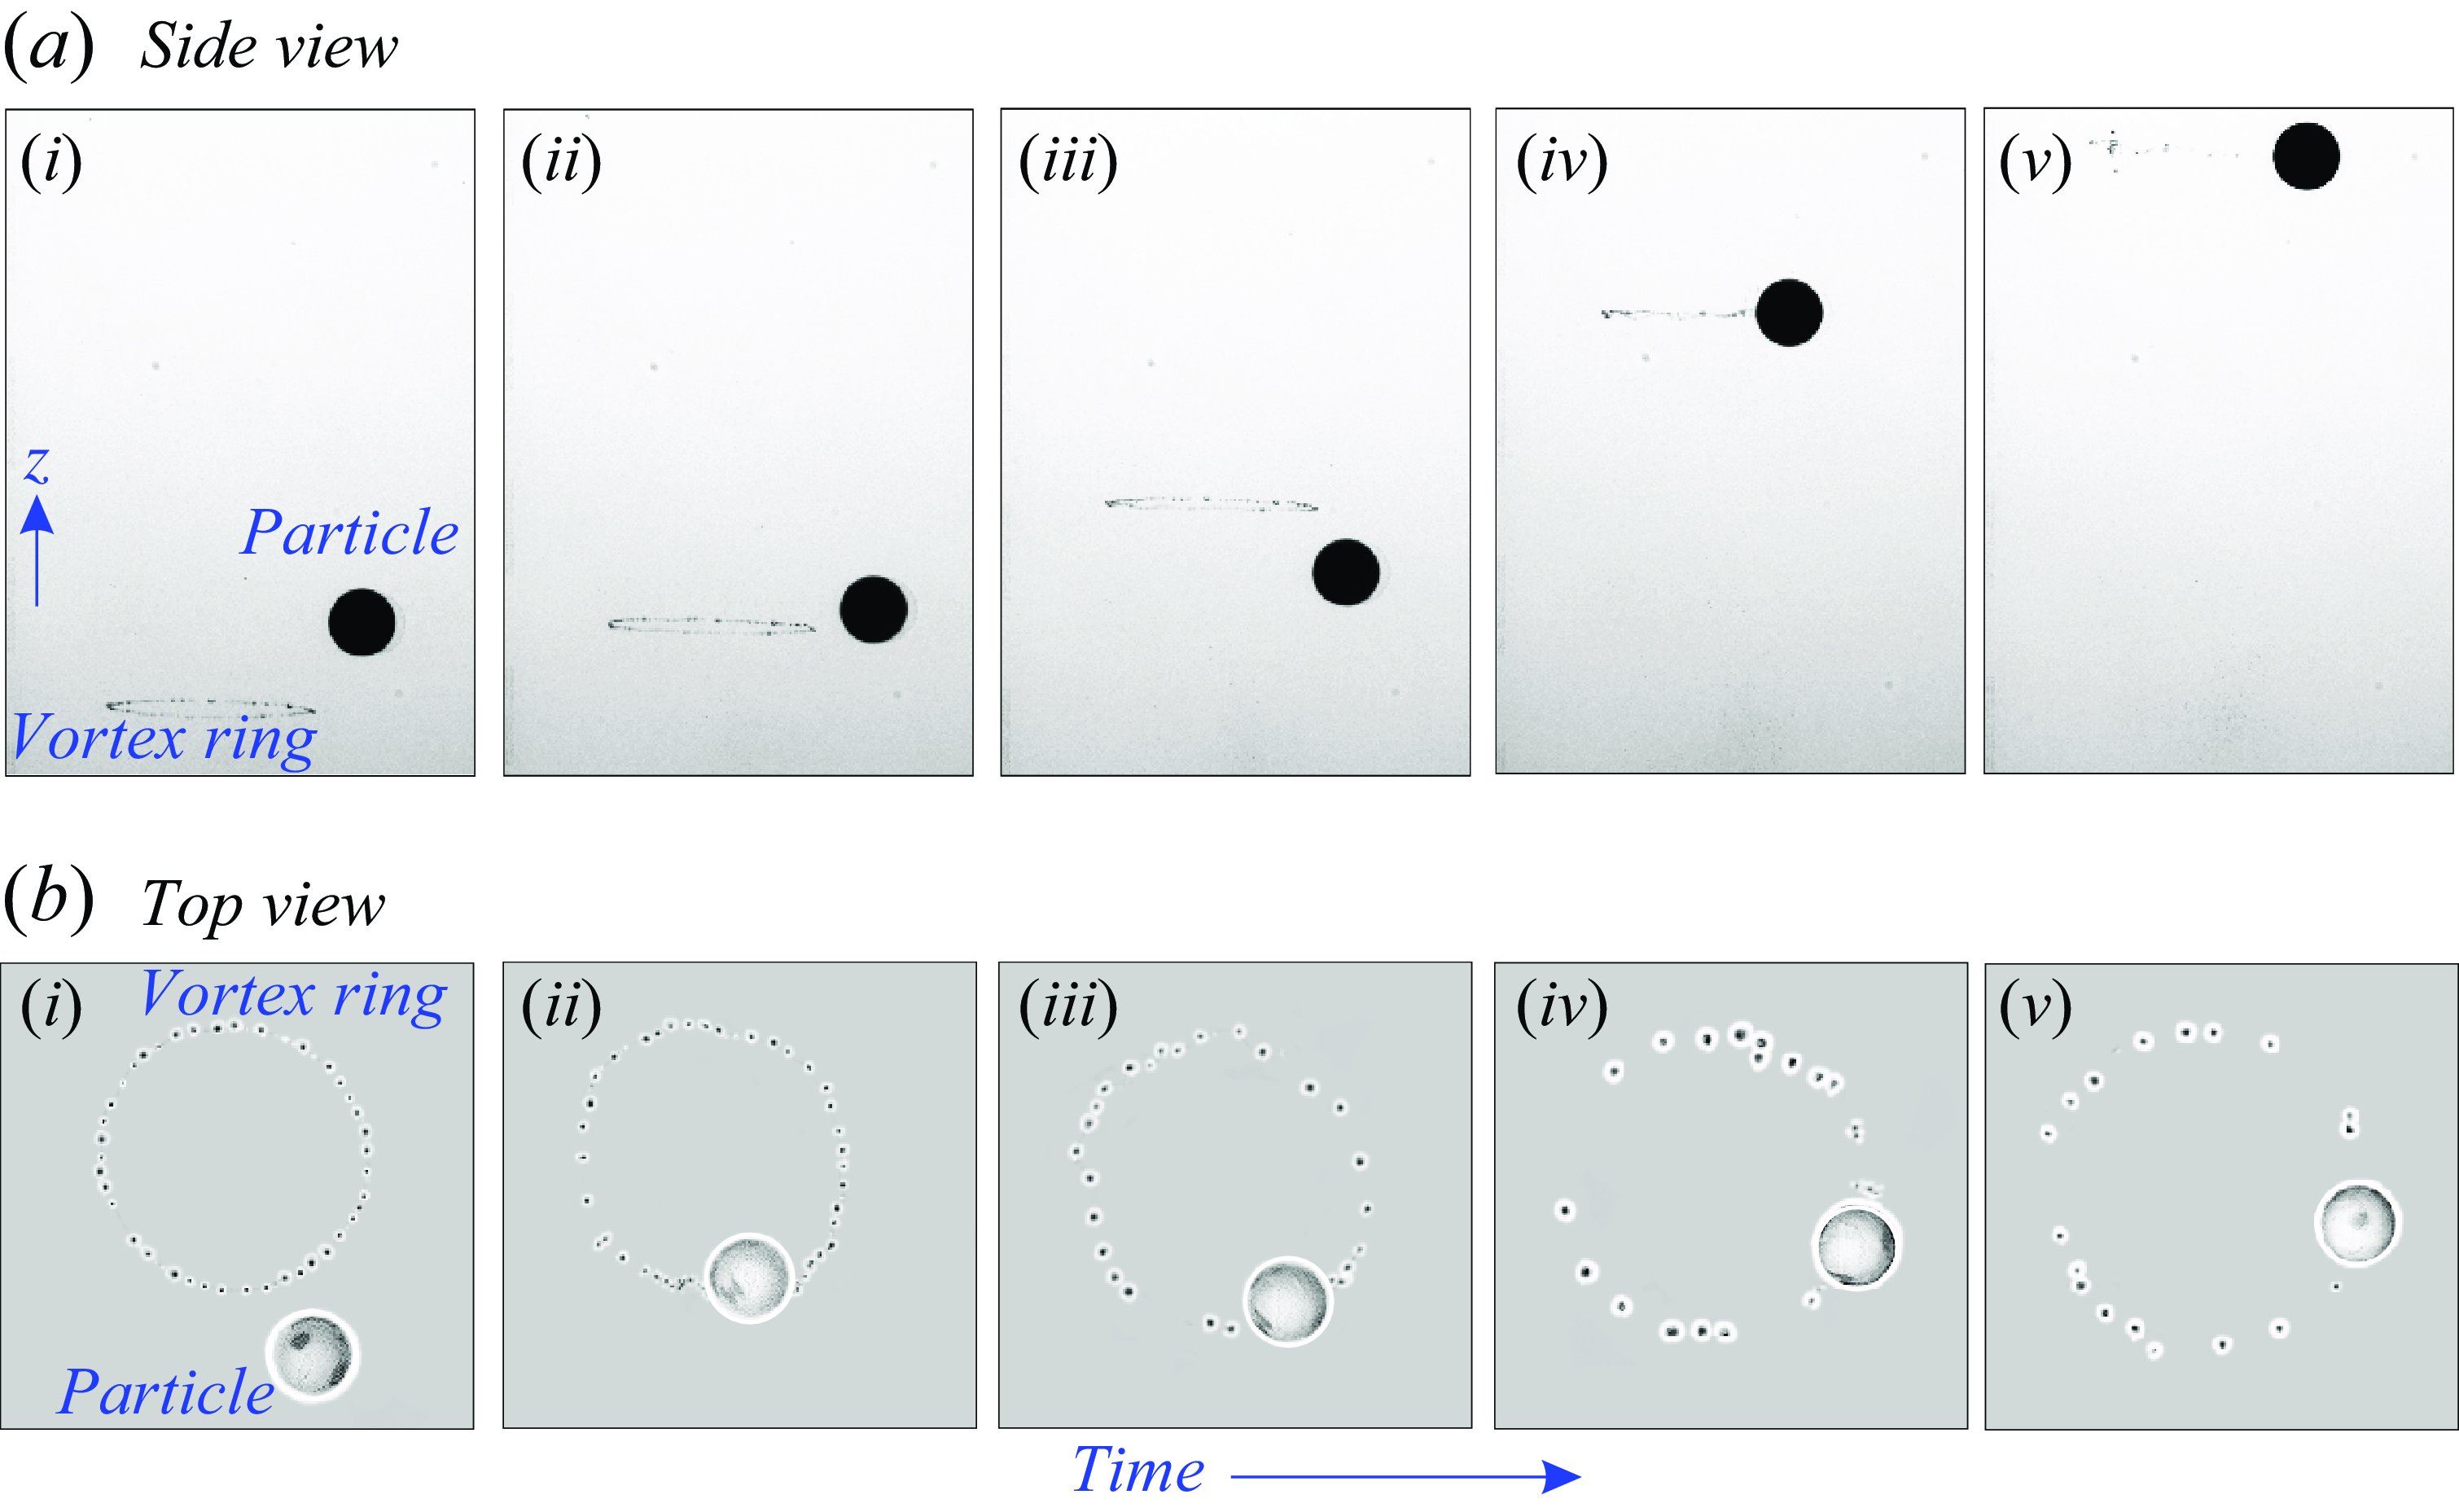
In order to give a broad overview of these interactions, we show in figure 2 an example time sequence of a buoyant particle interacting with a vortex ring, obtained from high-speed imaging, corresponding to $D_p/D_{c,o}$
of 1.67 and ring
$D_p/D_{c,o}$
of 1.67 and ring $Re$
of 13 200. In the figure, two perpendicular views (top and side) are shown to better illustrate the interactions, noting that these two views were captured separately due to different illumination requirements after ensuring that the broad features shown are repeatable. As can be seen in the figure, the vortex ring is marked by micrometre-sized air bubbles generated at the metallic tip of the vortex generator by electrolysis, as is discussed in § 2. The side-view and top-view images in figures 2(a(i)) and 2(b(i)) show that the particle is outside the ring just before the particle capture begins. As the ring comes closer to the particle (figure 2
a(ii) and 2
b(ii)), the particle is captured by the vortex ring’s low-pressure core (figure 2
a(iv)) and b(iv). Post-capture, the particle within the vortex ring undergoes a wide range of motions, including the azimuthal drift of the particle due to azimuthal pressure gradient (Jha & Govardhan Reference Jha and Govardhan2015), rotation about its own axis of symmetry and radial oscillations, as illustrated in the schematic in figure 1(b) and discussed in more detail in § 3. We find that changing particle size brings dramatic changes in these motions, which will have implications for the modifications of vortex ring dynamics.
$Re$
of 13 200. In the figure, two perpendicular views (top and side) are shown to better illustrate the interactions, noting that these two views were captured separately due to different illumination requirements after ensuring that the broad features shown are repeatable. As can be seen in the figure, the vortex ring is marked by micrometre-sized air bubbles generated at the metallic tip of the vortex generator by electrolysis, as is discussed in § 2. The side-view and top-view images in figures 2(a(i)) and 2(b(i)) show that the particle is outside the ring just before the particle capture begins. As the ring comes closer to the particle (figure 2
a(ii) and 2
b(ii)), the particle is captured by the vortex ring’s low-pressure core (figure 2
a(iv)) and b(iv). Post-capture, the particle within the vortex ring undergoes a wide range of motions, including the azimuthal drift of the particle due to azimuthal pressure gradient (Jha & Govardhan Reference Jha and Govardhan2015), rotation about its own axis of symmetry and radial oscillations, as illustrated in the schematic in figure 1(b) and discussed in more detail in § 3. We find that changing particle size brings dramatic changes in these motions, which will have implications for the modifications of vortex ring dynamics.
Time sequence of images of the (a) side-view and (b) top-view visualisation of a single vortex ring ( $Re$
= 13 200) interacting with a buoyant particle whose size relative to the core is
$Re$
= 13 200) interacting with a buoyant particle whose size relative to the core is $D_p/D_{c,o}$
= 1.67. The non-dimensional times (
$D_p/D_{c,o}$
= 1.67. The non-dimensional times ( $tu_{co}/D_o$
) corresponding to the images shown are: (i) 1.17, (ii) 1.51, (iii) 1.93, (iv) 2.71 and (v) 3.11, where
$tu_{co}/D_o$
) corresponding to the images shown are: (i) 1.17, (ii) 1.51, (iii) 1.93, (iv) 2.71 and (v) 3.11, where $u_{c,o}$
and
$u_{c,o}$
and $D_o$
are the convection speed and diameter of the ring, respectively. The azimuthal axis (equivalently, the core’s centre) of the ring is marked by microbubbles generated by electrolysis.
$D_o$
are the convection speed and diameter of the ring, respectively. The azimuthal axis (equivalently, the core’s centre) of the ring is marked by microbubbles generated by electrolysis.
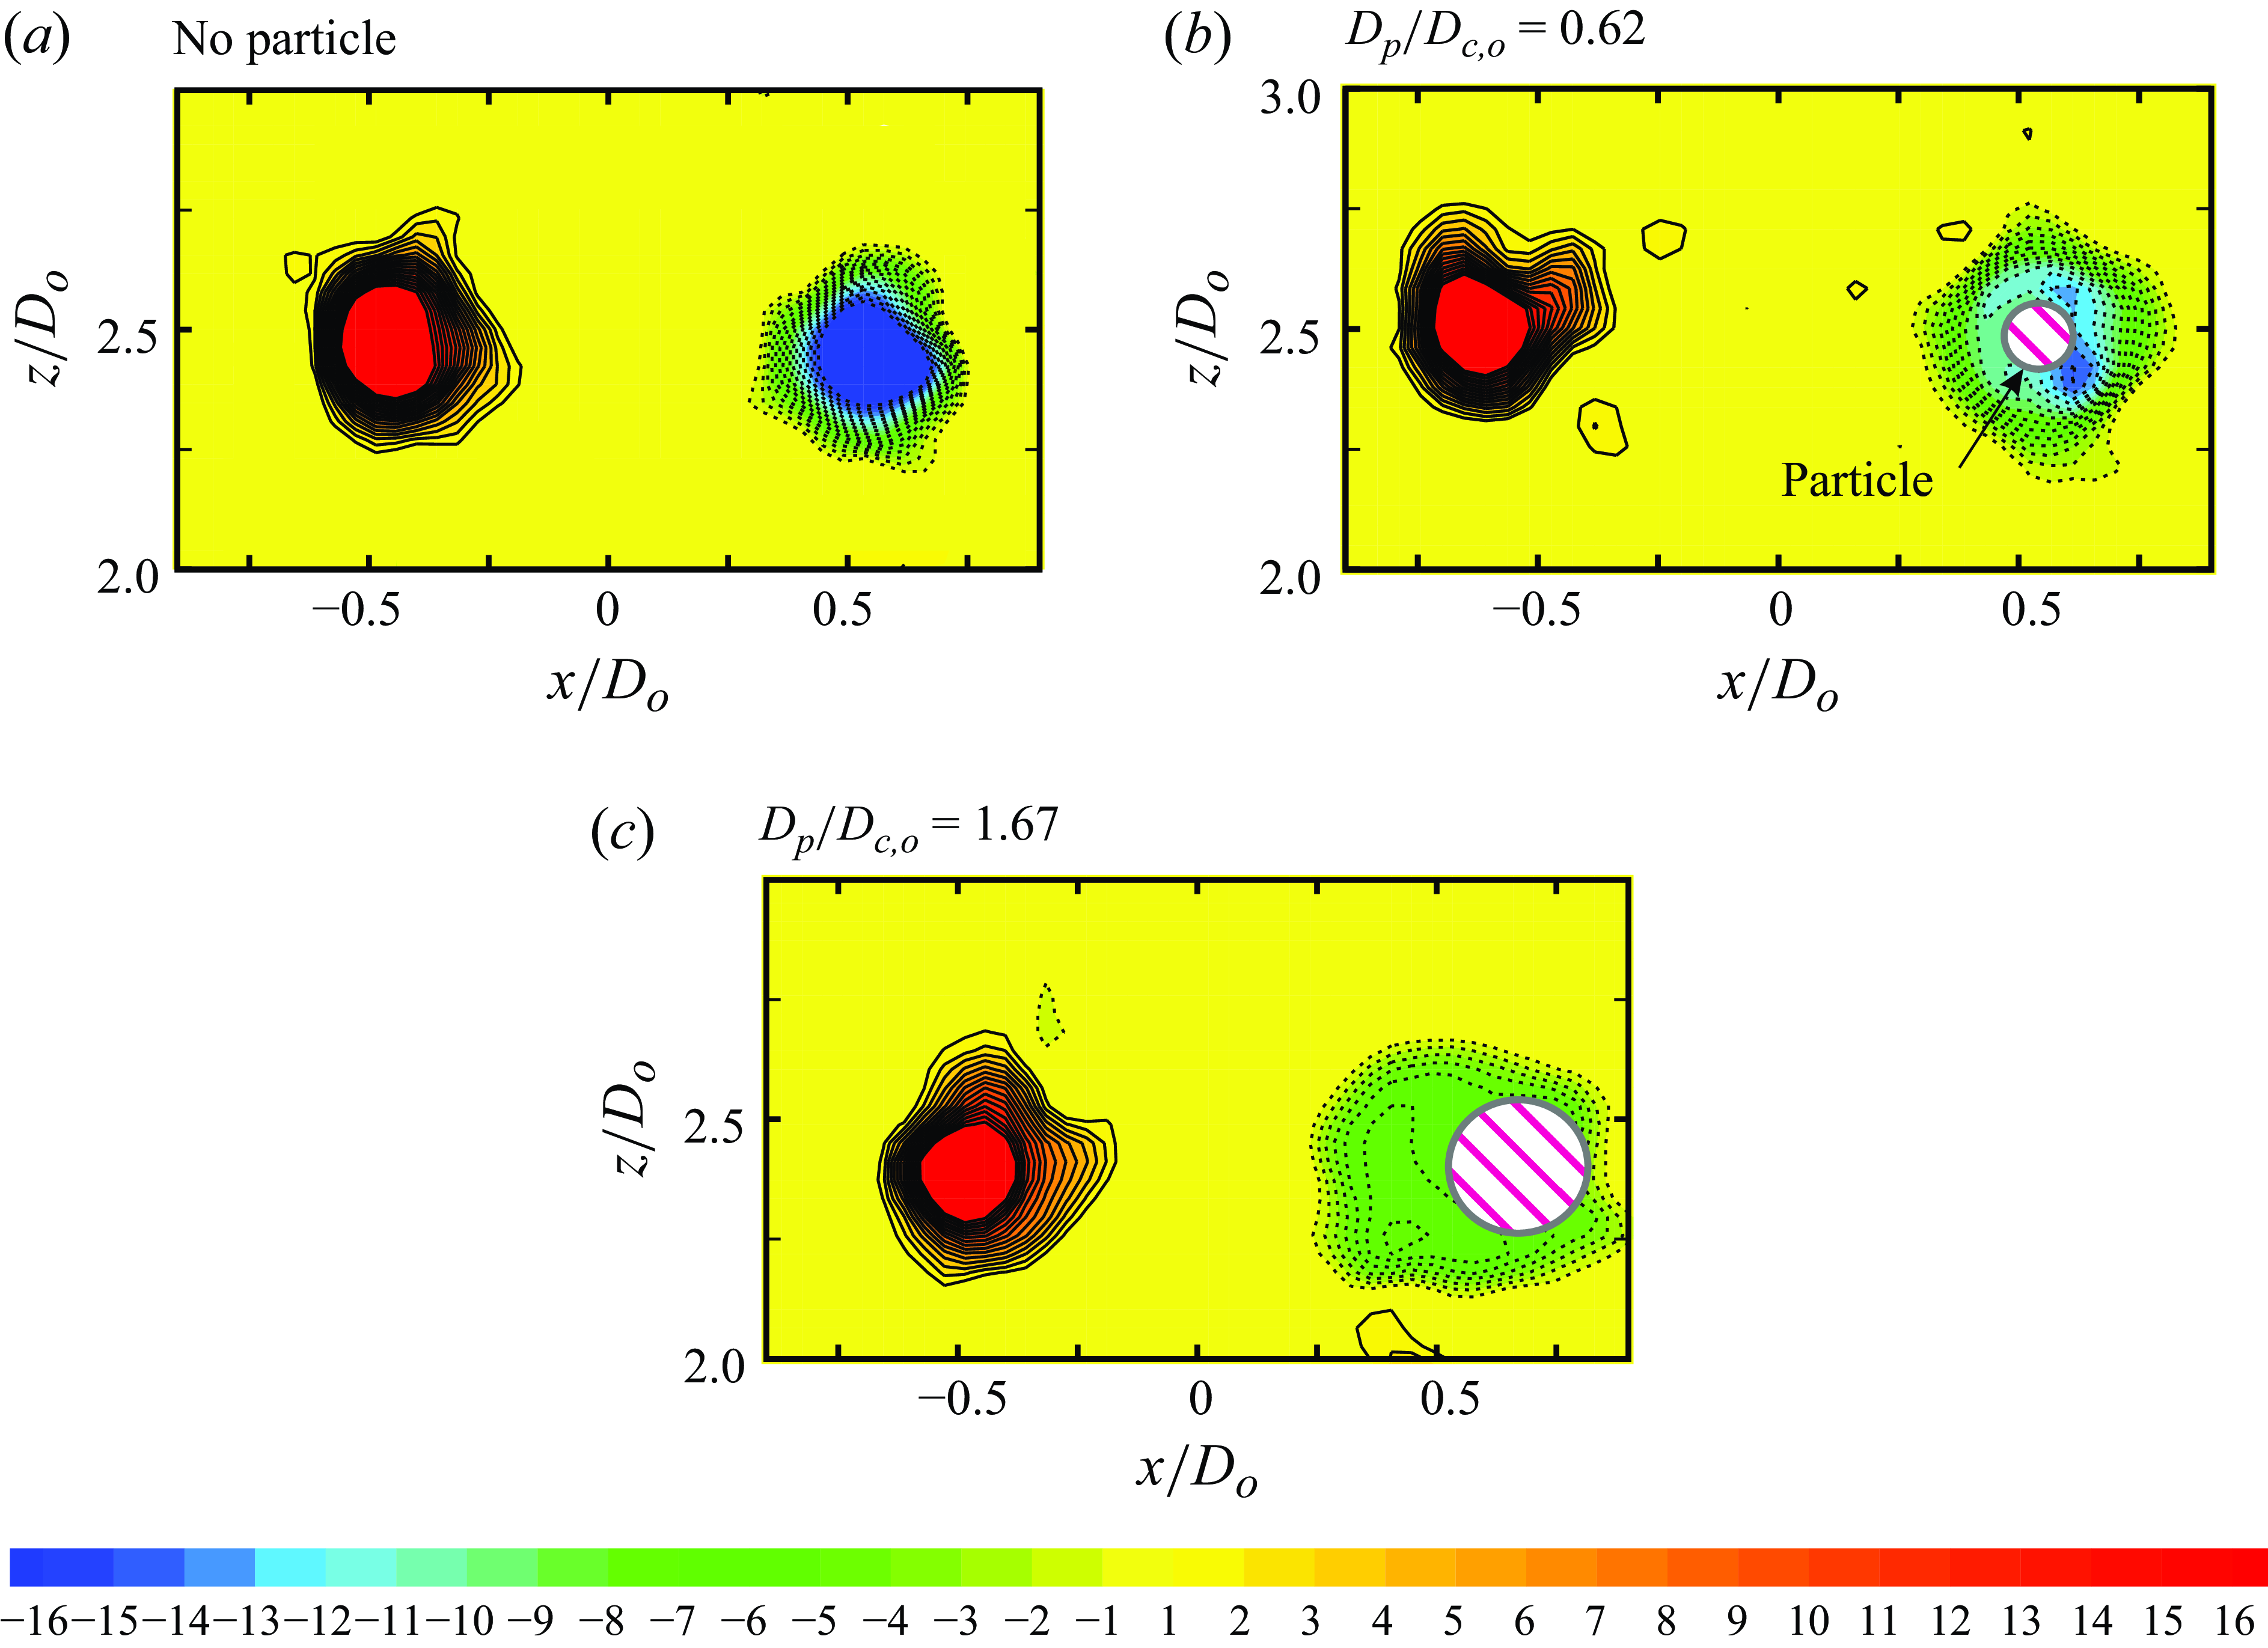
The captured buoyant particle leads to changes in the vorticity distribution and hence in the overall vortex ring dynamics. Example snapshots of the azimuthal vorticity within the ring cores are shown in figure 3 for the base (reference) vortex ring (in figure 3
a) and two different cases of a buoyant particle interacting with the ring corresponding to smaller particle, in figure 3(b) ( $D_p/D_{c,o}$
= 0.62), and larger particle, in figure 3(c) (
$D_p/D_{c,o}$
= 0.62), and larger particle, in figure 3(c) ( $D_p/D_{c,o}$
= 1.67). In these plots, the azimuthal vorticity (
$D_p/D_{c,o}$
= 1.67). In these plots, the azimuthal vorticity ( $\omega$
) is normalised by the initial convection speed (
$\omega$
) is normalised by the initial convection speed ( $u_{co}$
) and the ring diameter (
$u_{co}$
) and the ring diameter ( $D_o$
), with these two being measured before the particle’s capture. In the interaction cases, the particle location is marked within the right vortex core. We can see intact vortex cores for the base ring (in figure 3
a) and a mildly deformed core at a low
$D_o$
), with these two being measured before the particle’s capture. In the interaction cases, the particle location is marked within the right vortex core. We can see intact vortex cores for the base ring (in figure 3
a) and a mildly deformed core at a low $D_p/D_{c,o}$
of 0.62 (in figure 3
b). For the larger buoyant particle case in figure 3(c), we can see that the core is significantly deformed with a much reduced peak core vorticity. It may also be noticed that the large particle’s centre is significantly offset from the core centre, whereas the smaller particle stays closer to core centre. Such differences with increasing particle sizes lead to increasing disruptions in the vortex ring, in terms of a larger reduction in the ring’s convection speed and enstrophy at a later time of the interaction, as will be discussed in the paper, for different ring Reynolds numbers,
$D_p/D_{c,o}$
of 0.62 (in figure 3
b). For the larger buoyant particle case in figure 3(c), we can see that the core is significantly deformed with a much reduced peak core vorticity. It may also be noticed that the large particle’s centre is significantly offset from the core centre, whereas the smaller particle stays closer to core centre. Such differences with increasing particle sizes lead to increasing disruptions in the vortex ring, in terms of a larger reduction in the ring’s convection speed and enstrophy at a later time of the interaction, as will be discussed in the paper, for different ring Reynolds numbers, $Re$
= 6000–67 300.
$Re$
= 6000–67 300.
The azimuthal vorticity contours ( ${\omega }D_o/u_{c,o}$
) of both vortex cores in a two-dimensional symmetry plane (
${\omega }D_o/u_{c,o}$
) of both vortex cores in a two-dimensional symmetry plane ( $x$
–
$x$
– $z$
) passing through the centre of the vortex ring (
$z$
) passing through the centre of the vortex ring ( $Re$
= 13 200) measured at time
$Re$
= 13 200) measured at time $tu_{c,o}/D_o=2.5$
for (a) base ring and interaction cases corresponding to (b)
$tu_{c,o}/D_o=2.5$
for (a) base ring and interaction cases corresponding to (b) $D_p/D_{c,o}$
= 0.62 and (c)
$D_p/D_{c,o}$
= 0.62 and (c) $D_p/D_{c,o}$
= 1.67. In (b,c), the particle within the vortex core is marked as a hatched area with a magenta colour. The vorticity contour levels are
$D_p/D_{c,o}$
= 1.67. In (b,c), the particle within the vortex core is marked as a hatched area with a magenta colour. The vorticity contour levels are $\pm$
16,
$\pm$
16, $\pm$
15, …,
$\pm$
15, …, $\pm$
1.
$\pm$
1.
The rest of the article is structured as follows. In § 2, we begin by describing the experimental methodologies employed to capture various aspects of the particle and the ring dynamics. Subsequently, in § 3, we present the results concerning the effects of particle size on different aspects of particle dynamics, including the azimuthal drift, rotation and radial motion of the particle, all within the vortex ring. Moving forward, in § 4, we discuss the particle size effects on aspects related to the ring dynamics, including the propagation of the ring, the deformation of the ring’s azimuthal axis, and alterations in the azimuthal vorticity of the vortex cores and integral measures like circulation and azimuthal enstrophy. Subsequently, the broader connections between the particle size effects and the possible physical mechanisms contributing to the modifications in vortex ring dynamics are discussed. Finally, the summary and conclusions are presented in § 5.
2. Experimental methods
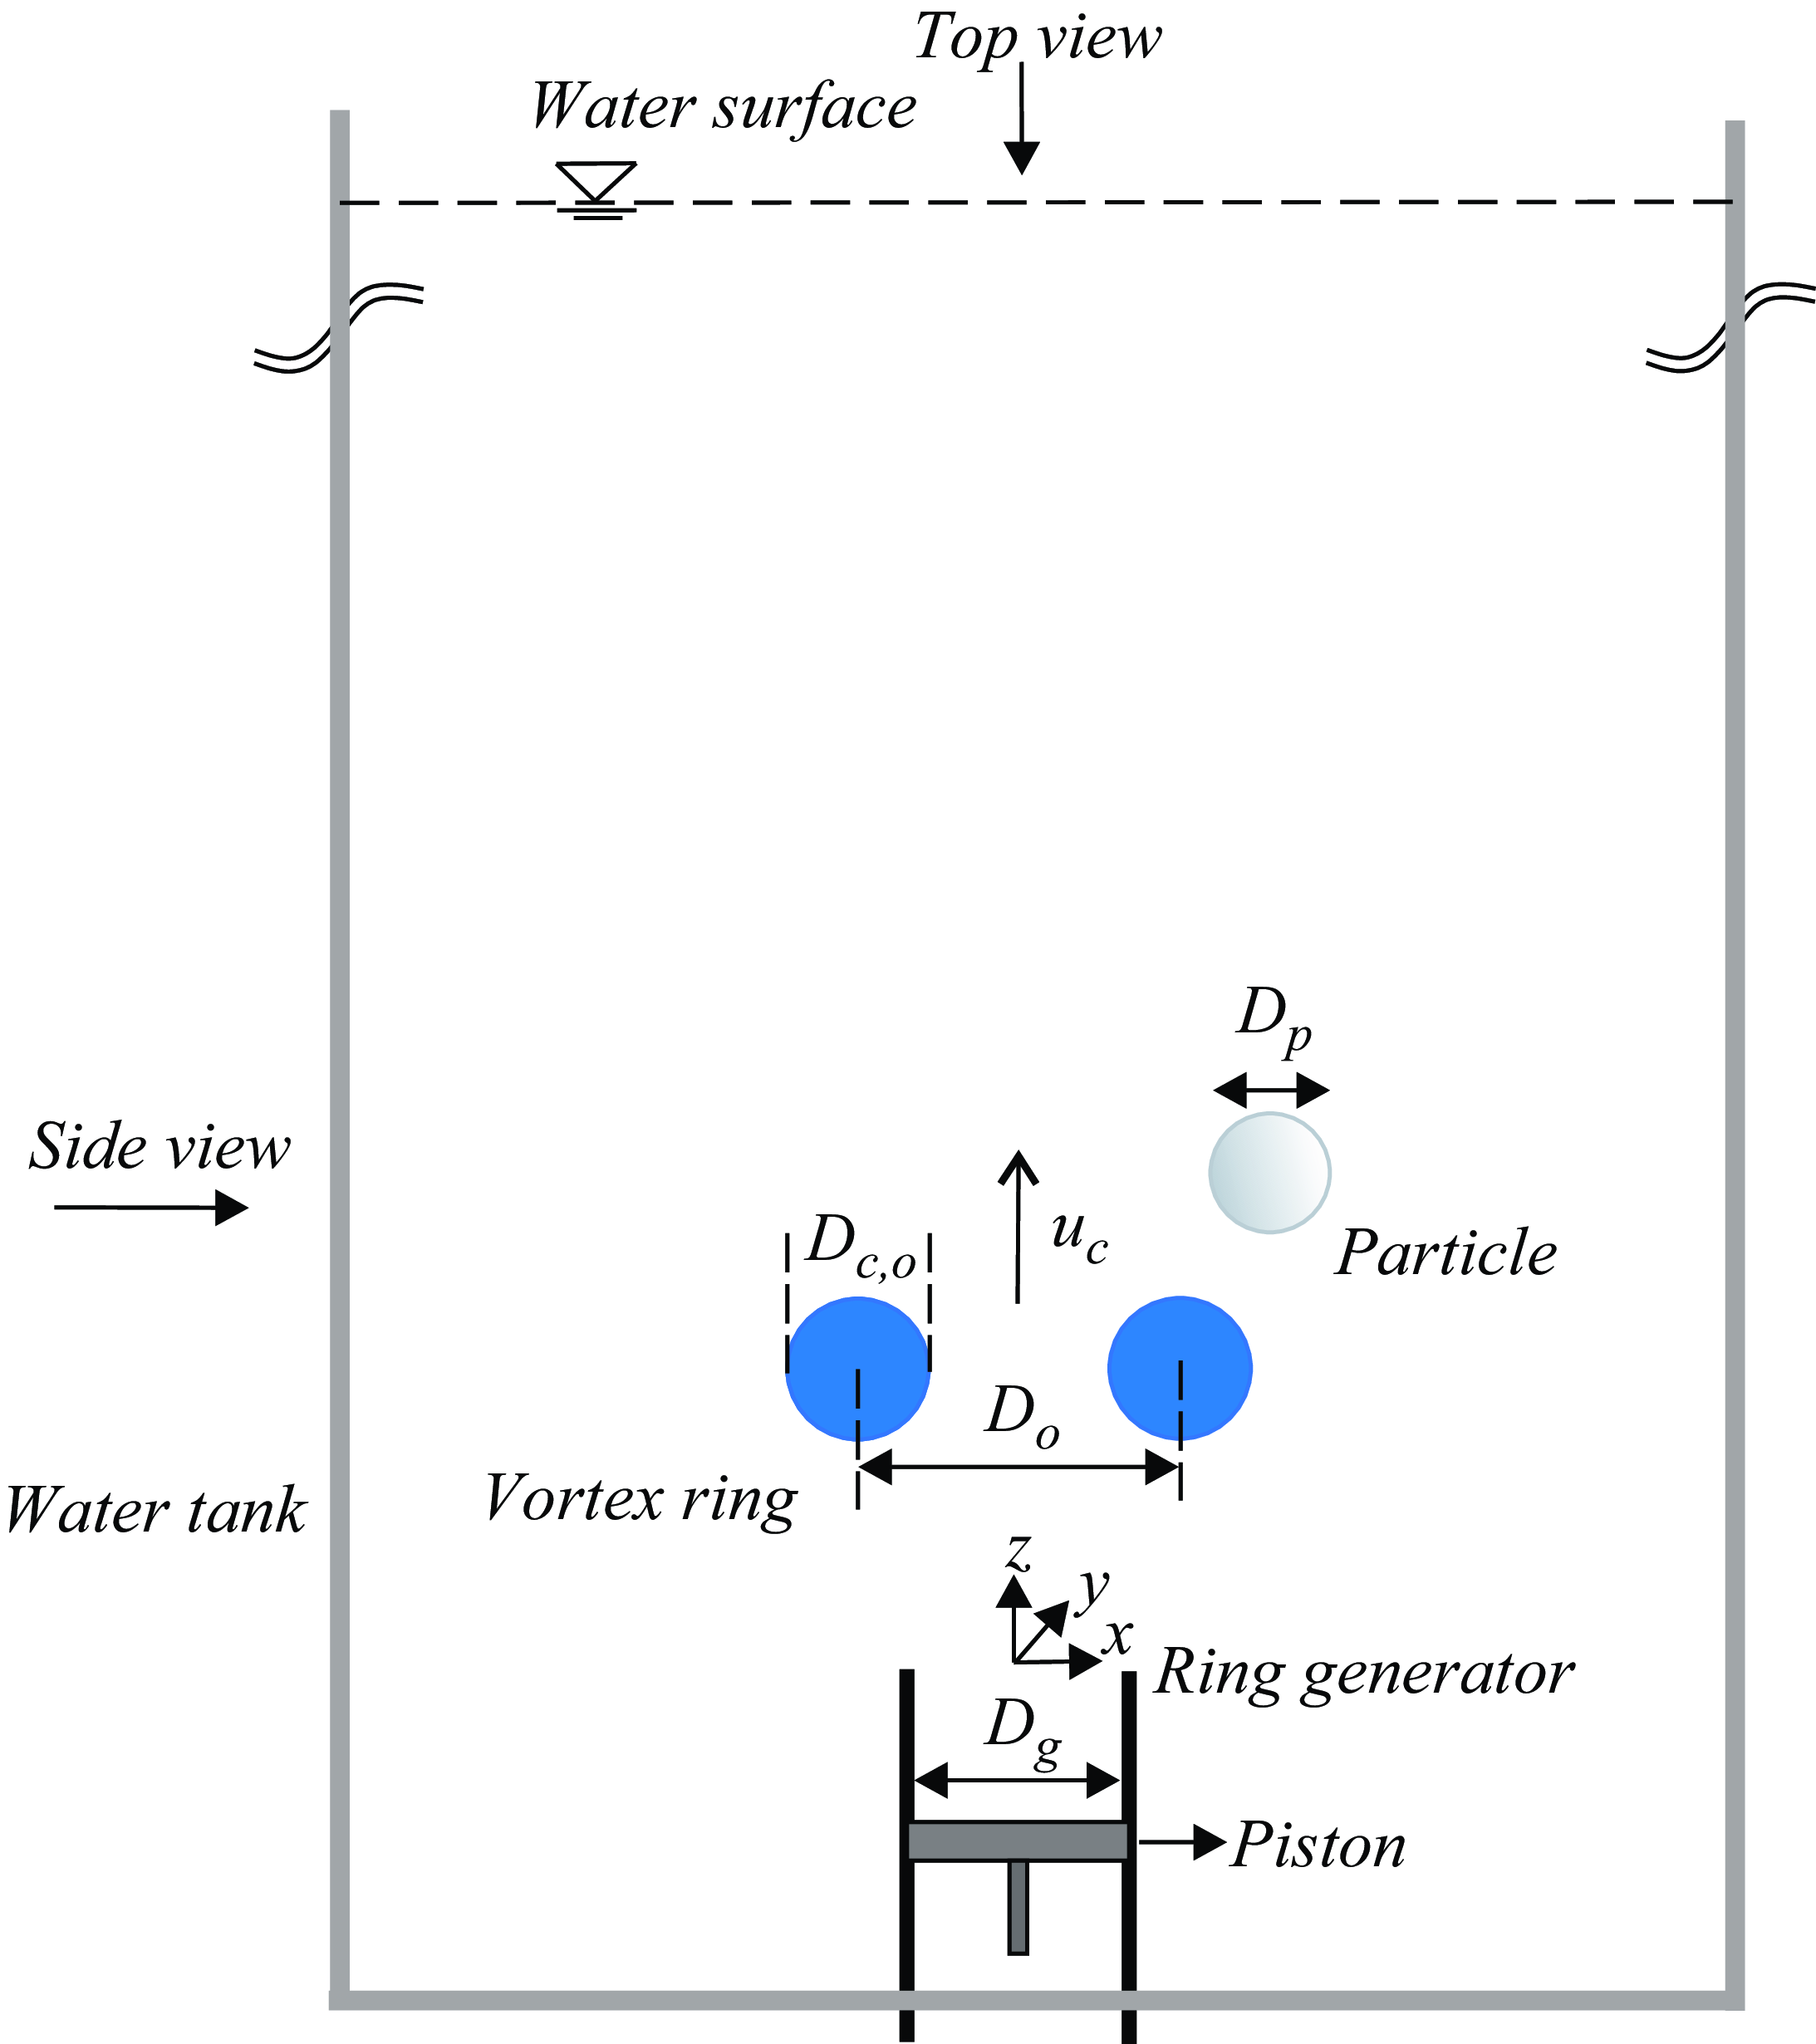
The vortex ring was generated inside a water tank (see figure 4) by impulsively pushing a slug of water through a circular nozzle (diameter $D_g$
= 15 mm) using a piston–cylinder mechanism (Jha & Govardhan Reference Jha and Govardhan2015). The resulting vortex ring travelled vertically upwards (along
$D_g$
= 15 mm) using a piston–cylinder mechanism (Jha & Govardhan Reference Jha and Govardhan2015). The resulting vortex ring travelled vertically upwards (along $z$
) against gravity. The key parameters characterising the vortex ring, including the ring’s circulation (
$z$
) against gravity. The key parameters characterising the vortex ring, including the ring’s circulation ( $\varGamma$
), diameter (
$\varGamma$
), diameter ( $D_o$
) and core diameter (
$D_o$
) and core diameter ( $D_{c,o}$
), were quantified from the velocity field obtained through particle image velocimetry (PIV) measurements conducted in the absence of the large buoyant particle. To prevent the formation of a trailing jet behind the ring, the non-dimensional piston stroke length was maintained below four (Gharib, Rambod & Shariff Reference Gharib, Rambod and Shariff1998). The resulting vortex ring had a relatively thin core, with a vortex core-to-ring diameter ratio (
$D_{c,o}$
), were quantified from the velocity field obtained through particle image velocimetry (PIV) measurements conducted in the absence of the large buoyant particle. To prevent the formation of a trailing jet behind the ring, the non-dimensional piston stroke length was maintained below four (Gharib, Rambod & Shariff Reference Gharib, Rambod and Shariff1998). The resulting vortex ring had a relatively thin core, with a vortex core-to-ring diameter ratio ( $D_{c,o}/D_o$
) of about 0.2, implying a relatively thin-core vortex ring (Norbury Reference Norbury1973). The vortex ring diameter (
$D_{c,o}/D_o$
) of about 0.2, implying a relatively thin-core vortex ring (Norbury Reference Norbury1973). The vortex ring diameter ( $D_o$
) and core diameter (
$D_o$
) and core diameter ( $D_{c,o}$
) are known to be influenced by several factors, including the non-dimensional stroke length, nozzle geometry and piston impulse (Sullivan et al. Reference Sullivan, Niemela, Hershberger, Bolster and Donnelly2008; Adhikari Reference Adhikari2009; Das, Bansal & Manghnani Reference Das, Bansal and Manghnani2017). Presently, to maintain a consistent vortex core-to-ring size ratio (
$D_{c,o}$
) are known to be influenced by several factors, including the non-dimensional stroke length, nozzle geometry and piston impulse (Sullivan et al. Reference Sullivan, Niemela, Hershberger, Bolster and Donnelly2008; Adhikari Reference Adhikari2009; Das, Bansal & Manghnani Reference Das, Bansal and Manghnani2017). Presently, to maintain a consistent vortex core-to-ring size ratio ( $D_{c,o}/D_o \approx 0.2$
) across different vortex ring circulations (which correspond to different piston impulses), the non-dimensional piston stroke length (
$D_{c,o}/D_o \approx 0.2$
) across different vortex ring circulations (which correspond to different piston impulses), the non-dimensional piston stroke length ( $L_p/D_g$
;
$L_p/D_g$
; $L_p$
= piston stroke length) was varied between 2 and 3.5. This approach ensured that the fixed ratio (
$L_p$
= piston stroke length) was varied between 2 and 3.5. This approach ensured that the fixed ratio ( $\approx 0.2$
) was achieved for all the ring circulation cases (equivalently, ring Reynolds number,
$\approx 0.2$
) was achieved for all the ring circulation cases (equivalently, ring Reynolds number, $Re=\varGamma /\nu$
) studied. To evaluate
$Re=\varGamma /\nu$
) studied. To evaluate $\varGamma$
, a surface integral of the azimuthal vorticity (
$\varGamma$
, a surface integral of the azimuthal vorticity ( $\int \omega \,{\rm d}A$
) was performed over an enclosed area encompassing the vorticity within and outside the vortex core. The remaining parameters (
$\int \omega \,{\rm d}A$
) was performed over an enclosed area encompassing the vorticity within and outside the vortex core. The remaining parameters ( $D_{o}$
and
$D_{o}$
and $D_{c,o}$
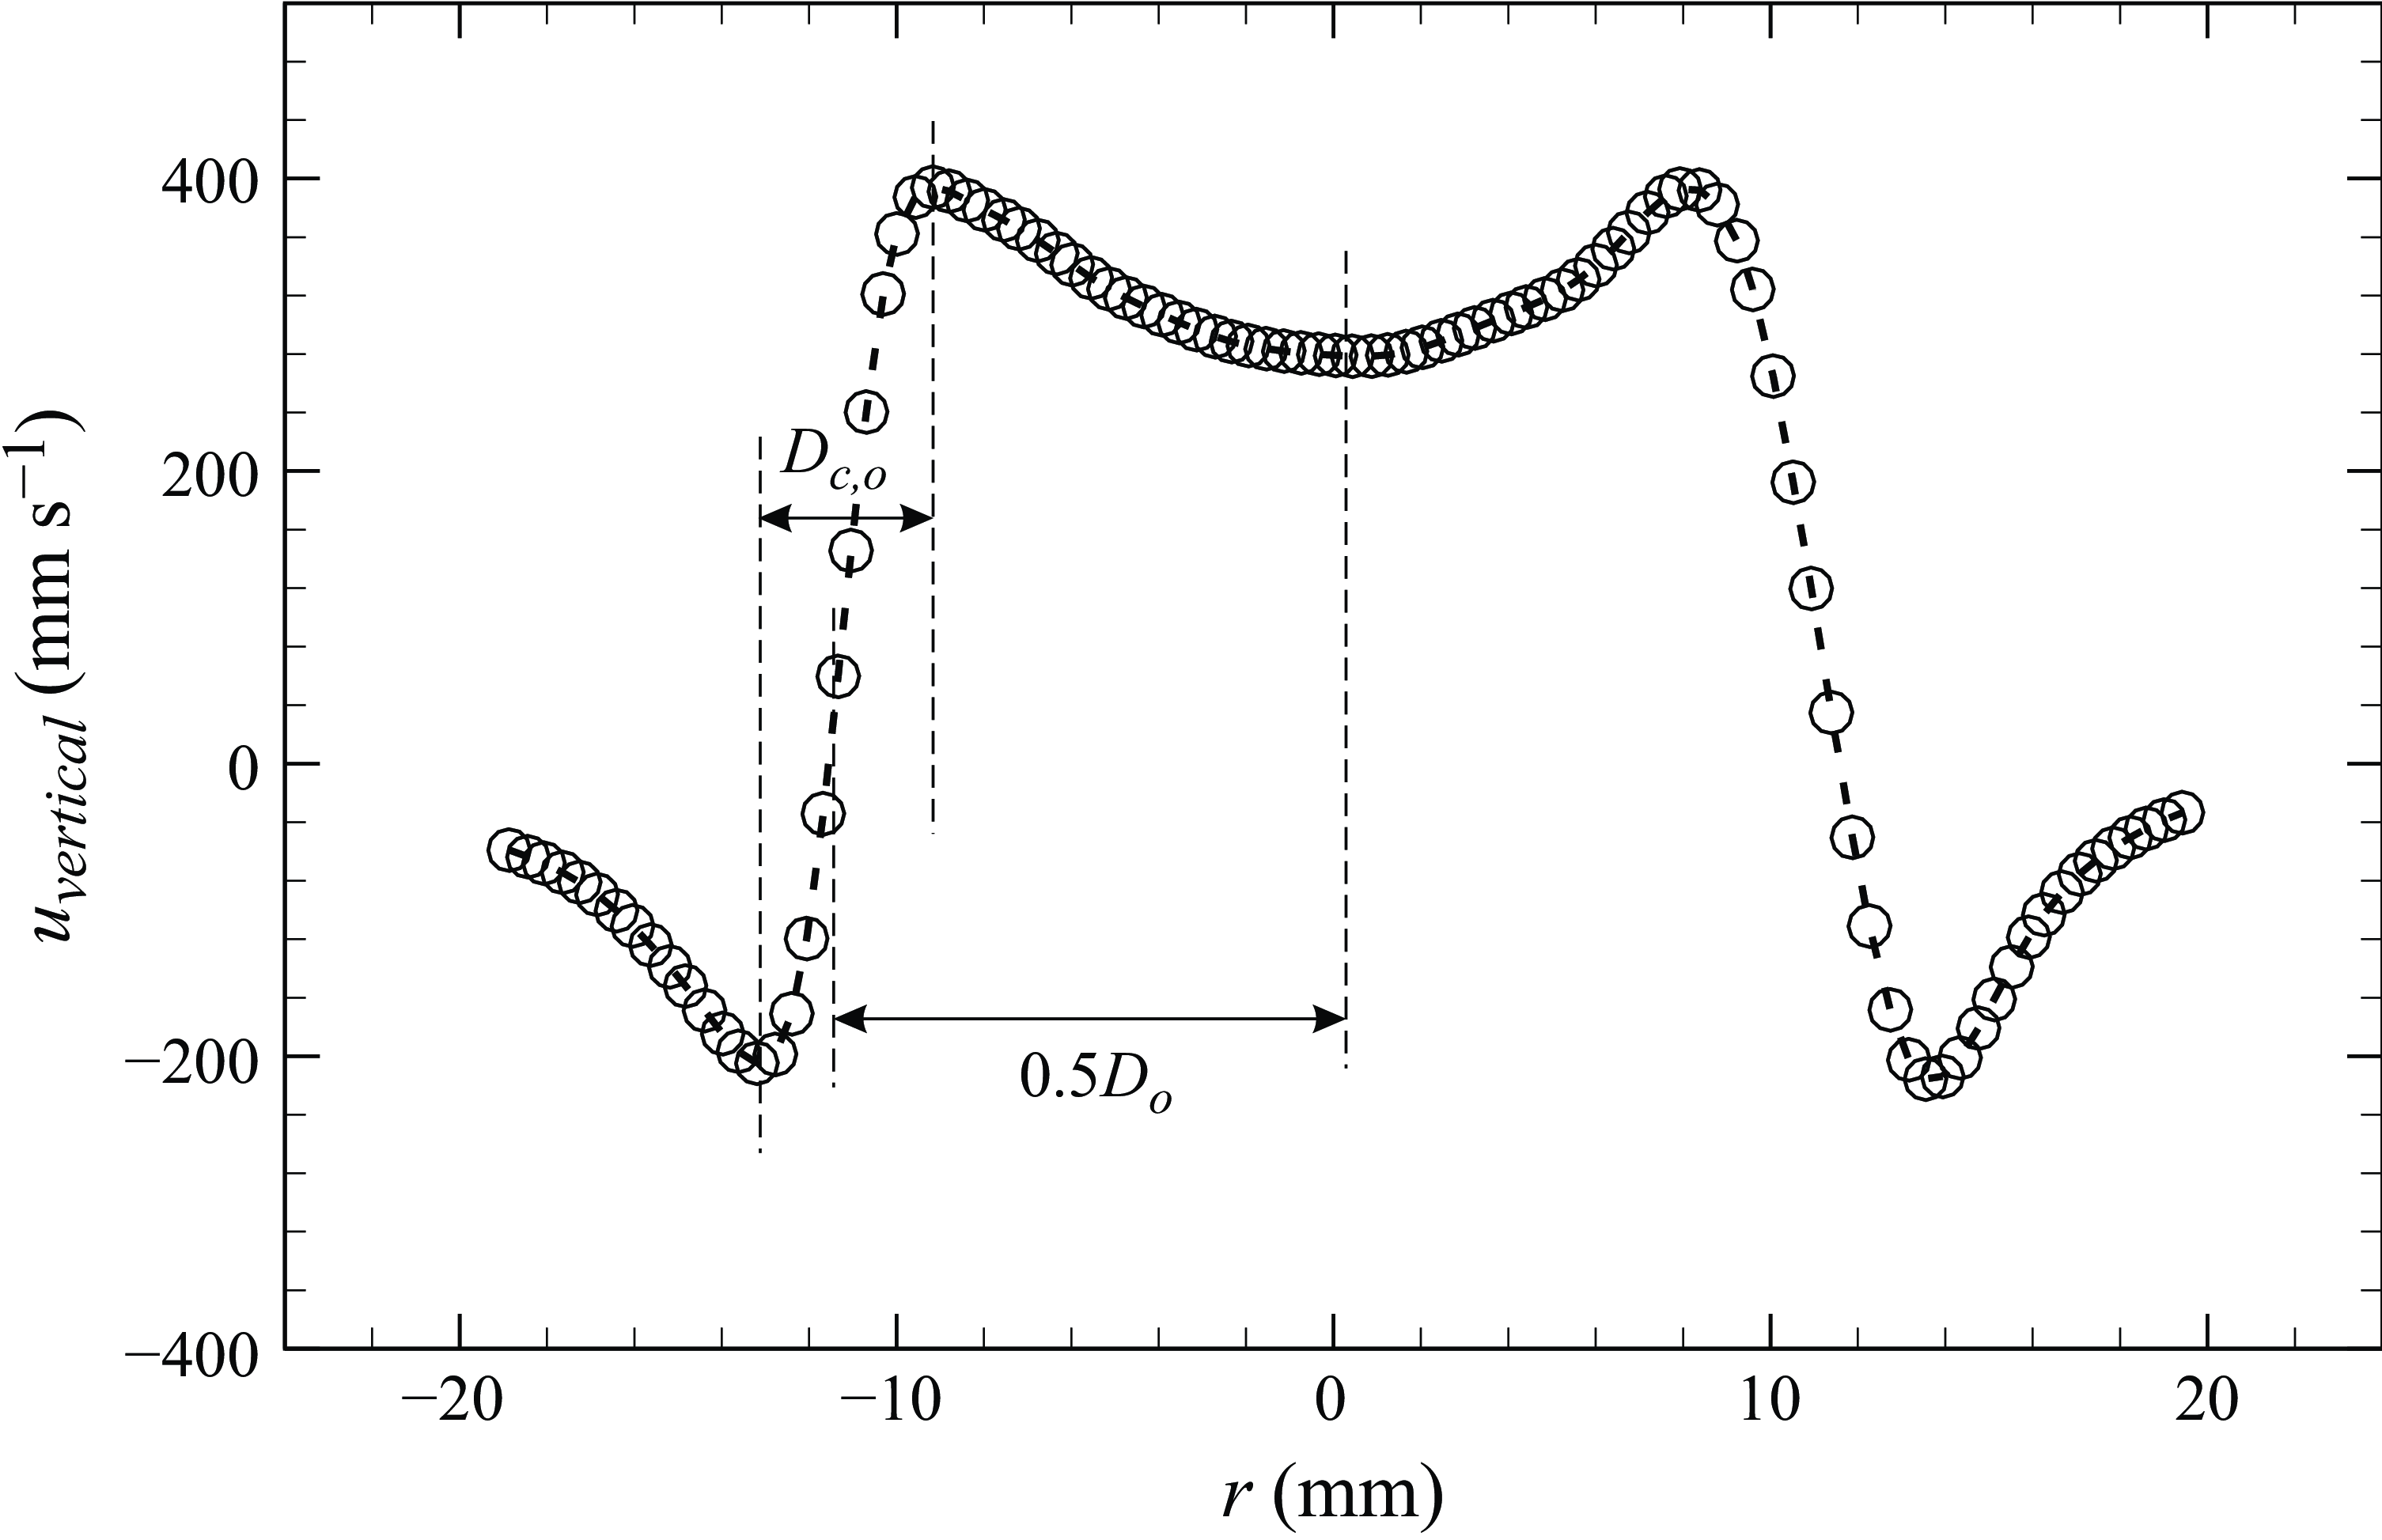
) were calculated from the profile of the vertical velocity along a horizontal line connecting the centres of both cores (e.g. shown in figure 5) following the methodology outlined by Sullivan, Widnall & Ezekiel (Reference Sullivan, Widnall and Ezekiel1973). Altering the piston velocity generated rings of different
$D_{c,o}$
) were calculated from the profile of the vertical velocity along a horizontal line connecting the centres of both cores (e.g. shown in figure 5) following the methodology outlined by Sullivan, Widnall & Ezekiel (Reference Sullivan, Widnall and Ezekiel1973). Altering the piston velocity generated rings of different $\varGamma$
, resulting in a wide range of ring Reynolds numbers (
$\varGamma$
, resulting in a wide range of ring Reynolds numbers ( $Re=\varGamma /\nu$
) of
$Re=\varGamma /\nu$
) of $\approx$
6000–67 300. In the present work, the vortex core size remains nearly constant across different
$\approx$
6000–67 300. In the present work, the vortex core size remains nearly constant across different $\varGamma$
cases, while the particle size is varied, yielding a range of
$\varGamma$
cases, while the particle size is varied, yielding a range of $D_p/D_{c,o}$
that varies from about 0.62 to 1.67 with the corresponding particle-to-ring core volume ratio (
$D_p/D_{c,o}$
that varies from about 0.62 to 1.67 with the corresponding particle-to-ring core volume ratio ( $V_R$
=
$V_R$
= ${\pi }(D^3_p/6)/({\pi }^2D_oD^2_{c,o}/4)$
) varying between about 0.01 and 0.20 (see table 1). The ring diameter (
${\pi }(D^3_p/6)/({\pi }^2D_oD^2_{c,o}/4)$
) varying between about 0.01 and 0.20 (see table 1). The ring diameter ( $D_o$
) and core diameter (
$D_o$
) and core diameter ( $D_{c,o}$
) were approximately 21.5 and 4 mm, respectively, across all different
$D_{c,o}$
) were approximately 21.5 and 4 mm, respectively, across all different $Re$
rings studied. In the present measurements, the uncertainties were within
$Re$
rings studied. In the present measurements, the uncertainties were within $\pm$
0.25 mm,
$\pm$
0.25 mm, $\pm$
0.20 mm,
$\pm$
0.20 mm, $\pm$
3 % and
$\pm$
3 % and $\pm$
0.1 mm for the ring radius, core radius, circulation and particle diameter, respectively. It can be noted that at a particle-to-core size ratio of 0.62, the particle has nearly no effects on the vortex ring, as we find in § 4. As a result, cases with even smaller size ratios (less than 0.62) were not investigated. Conversely, increasing the size ratio beyond 1.67 would make the particle size comparable to the ring size, leading to challenges such as difficulties in particle capture. Therefore, such cases were also not considered.
$\pm$
0.1 mm for the ring radius, core radius, circulation and particle diameter, respectively. It can be noted that at a particle-to-core size ratio of 0.62, the particle has nearly no effects on the vortex ring, as we find in § 4. As a result, cases with even smaller size ratios (less than 0.62) were not investigated. Conversely, increasing the size ratio beyond 1.67 would make the particle size comparable to the ring size, leading to challenges such as difficulties in particle capture. Therefore, such cases were also not considered.
Schematic illustrating the side view of the experimental set-up employed in this study. The vortex ring was generated using a piston–cylinder arrangement, and a buoyant particle was released in close proximity. The vortex is characterised by a diameter $D_o$
and a core diameter
$D_o$
and a core diameter $D_{c,o}$
, and the spherical particle has a diameter
$D_{c,o}$
, and the spherical particle has a diameter $D_p$
. As the vortex ring and the particle comes closer, the particle gets captured into the low-pressure vortex core, and their interaction begins.
$D_p$
. As the vortex ring and the particle comes closer, the particle gets captured into the low-pressure vortex core, and their interaction begins.
The vertical velocity component along a horizontal line connecting the centres of both cores is shown for a ring Reynolds number of 6000, at $t^{\ast }$
of 1.3, after the ring is fully developed. As shown in the figure, the ring radius (0.5
$t^{\ast }$
of 1.3, after the ring is fully developed. As shown in the figure, the ring radius (0.5 $D_o$
) is defined by the point where this curve crosses zero, while the core diameter (
$D_o$
) is defined by the point where this curve crosses zero, while the core diameter ( $D_{c,o}$
) is given by the distance between the positive and negative velocity peaks (refer to Sullivan et al. (Reference Sullivan, Widnall and Ezekiel1973) for details).
$D_{c,o}$
) is given by the distance between the positive and negative velocity peaks (refer to Sullivan et al. (Reference Sullivan, Widnall and Ezekiel1973) for details).
To visualise and track the vortex ring, the ring’s core was marked by micrometre-sized hydrogen bubbles generated through electrolysis at the metallic tip of the vortex generator. The nominal diameter of these microbubbles was $D_{bn,micro}\approx$
50 μm, and was much smaller than the large millimetre-sized particle and the ring’s core. For example, the diameter of the smallest buoyant particle (
$D_{bn,micro}\approx$
50 μm, and was much smaller than the large millimetre-sized particle and the ring’s core. For example, the diameter of the smallest buoyant particle ( $D_p$
= 2.7 mm) was about 50 times larger than
$D_p$
= 2.7 mm) was about 50 times larger than $D_{bn,micro}$
, and about
$D_{bn,micro}$
, and about $1.5\times 10^5$
times larger in volume. Hence, these microbubbles exert minimal influence on the vortex ring dynamics. This was ensured by measuring the trajectory of the vortex ring using both the microbubbles and dye as tracers, and the difference between the two measurements fell within experimental margins. Also, to ensure the position of these microbubbles served as a representative marker for the core centre, the distance between the left and right core centres was measured using PIV (without the microbubbles) and compared with measurements obtained from visualisations with the microbubbles. The comparison revealed no noticeable differences between the two measurements, confirming that the positions of the microbubbles accurately represent the vortex core centre. These aspects were discussed in our previous studies (Jha & Govardhan Reference Jha and Govardhan2015; Biswas & Govardhan Reference Biswas and Govardhan2022). The present experiments involving both the base ring (without particle) and the interaction cases were conducted after the complete formation of the ring. Adjacent to the ring generator, a (buoyant,
$1.5\times 10^5$
times larger in volume. Hence, these microbubbles exert minimal influence on the vortex ring dynamics. This was ensured by measuring the trajectory of the vortex ring using both the microbubbles and dye as tracers, and the difference between the two measurements fell within experimental margins. Also, to ensure the position of these microbubbles served as a representative marker for the core centre, the distance between the left and right core centres was measured using PIV (without the microbubbles) and compared with measurements obtained from visualisations with the microbubbles. The comparison revealed no noticeable differences between the two measurements, confirming that the positions of the microbubbles accurately represent the vortex core centre. These aspects were discussed in our previous studies (Jha & Govardhan Reference Jha and Govardhan2015; Biswas & Govardhan Reference Biswas and Govardhan2022). The present experiments involving both the base ring (without particle) and the interaction cases were conducted after the complete formation of the ring. Adjacent to the ring generator, a (buoyant, ${\rho }_{particle}/{\rho }_{water}\approx$
0.008) polystyrene particle with a diameter
${\rho }_{particle}/{\rho }_{water}\approx$
0.008) polystyrene particle with a diameter $D_p$
was introduced. The particle release was timed with the generation of the vortex ring, ensuring that particle capture occurred at a non-dimensional time of
$D_p$
was introduced. The particle release was timed with the generation of the vortex ring, ensuring that particle capture occurred at a non-dimensional time of $tu_{c,o}/D_o\approx$
1.5; here,
$tu_{c,o}/D_o\approx$
1.5; here, $u_{co}$
and
$u_{co}$
and $D_o$
are the initial convection speed and the ring diameter, before the particle’s capture.
$D_o$
are the initial convection speed and the ring diameter, before the particle’s capture.
Adjacent to the vortex ring generator, the buoyant particle was held securely using a four-arm system constructed from a flexible material. These arms applied minimal lateral force on the particle, ensuring it remained stationary against buoyant forces while causing no deformation of the particle or interference. The arm system was connected to a piston–cylinder assembly, located outside the water tank, via a flexible, water-filled hose. The piston–cylinder assembly, also filled with water, enabled precise piston movement. When pressure was applied to the piston, the resulting fluid displacement within the hose caused the arms to disengage, thereby releasing the particle. This configuration ensured reliable and controlled particle release with minimal disturbance. The upwards velocity of the particle, measured just before its capture begins by the low-pressure vortex core, was broadly in the range of 0.16–0.21 m s–1. This was not precisely controlled since it had no influence on the ring–particle interactions. As the particle gets closer to the ring, the motion of the particle is strongly influenced by the ring (discussed earlier by Biswas & Govardhan (Reference Biswas and Govardhan2022)). Subsequently, after capture of the particle by the ring, the interactions between the particle and the ring appear to be governed by the particle’s size and the ring’s strength (ring $Re$
). In the current set-up, the particle-to-fluid density ratio was minimised (
$Re$
). In the current set-up, the particle-to-fluid density ratio was minimised ( ${\rho }_{particle}/{\rho }_{water}\approx$
0.008) as much as experimentally feasible to ensure the particle’s quick response to the velocity induced by the low-pressure vortex core (lower Stokes number
${\rho }_{particle}/{\rho }_{water}\approx$
0.008) as much as experimentally feasible to ensure the particle’s quick response to the velocity induced by the low-pressure vortex core (lower Stokes number $St$
), where
$St$
), where $St$
=
$St$
= ${\tau }_{particle}/{\tau }_{core}$
, with particle time scale
${\tau }_{particle}/{\tau }_{core}$
, with particle time scale ${\tau }_{particle}$
=
${\tau }_{particle}$
= ${\rho }_{particle}D^2_p/18{\mu }$
(Subramaniam & Balachandar Reference Subramaniam and Balachandar2022) and vortex core’s time scale
${\rho }_{particle}D^2_p/18{\mu }$
(Subramaniam & Balachandar Reference Subramaniam and Balachandar2022) and vortex core’s time scale ${\tau }_{core}={\pi }(D_{c,o}/2)^2/{\varGamma }$
(Finn, Shams & Apte Reference Finn, Shams and Apte2011). A low
${\tau }_{core}={\pi }(D_{c,o}/2)^2/{\varGamma }$
(Finn, Shams & Apte Reference Finn, Shams and Apte2011). A low $St$
would enhance the likelihood of the particle being captured by the vortex core. In contrast, a higher density ratio (with same particle size) results in a larger
$St$
would enhance the likelihood of the particle being captured by the vortex core. In contrast, a higher density ratio (with same particle size) results in a larger $St$
, causing the particle to respond more slowly to the core’s velocity field. For vortices with higher circulation, where the time available for capture is shorter (Jha & Govardhan Reference Jha and Govardhan2015; Biswas & Govardhan Reference Biswas and Govardhan2022), high-
$St$
, causing the particle to respond more slowly to the core’s velocity field. For vortices with higher circulation, where the time available for capture is shorter (Jha & Govardhan Reference Jha and Govardhan2015; Biswas & Govardhan Reference Biswas and Govardhan2022), high- $St$
particles would be less likely to be entrained into the core. It is worth noting that once captured, however, the impact of the particle on vortex ring dynamics appears to be primarily governed by the particle-to-core size ratio (
$St$
particles would be less likely to be entrained into the core. It is worth noting that once captured, however, the impact of the particle on vortex ring dynamics appears to be primarily governed by the particle-to-core size ratio ( $D_p/D_{c,o}$
) and the ring Reynolds number (
$D_p/D_{c,o}$
) and the ring Reynolds number ( $Re$
), as seen from some preliminary experiments with higher-density particles within the buoyant particle range. All the experiments were conducted in tap water with a kinematic viscosity (
$Re$
), as seen from some preliminary experiments with higher-density particles within the buoyant particle range. All the experiments were conducted in tap water with a kinematic viscosity ( $\nu$
) of about 0.891
$\nu$
) of about 0.891 $\pm$
0.016 mPa s (Biswas & Govardhan Reference Biswas and Govardhan2024), at a water temperature of 25
$\pm$
0.016 mPa s (Biswas & Govardhan Reference Biswas and Govardhan2024), at a water temperature of 25 $\pm$
1
$\pm$
1 $^{\circ }$
C.
$^{\circ }$
C.
In the current set-up, post-capture, the particle was seen to undergo rotation, and this was constrained to occur primarily about the azimuthal axis of the vortex ring due to the flow-field structure. This was due to the dominance of azimuthal vorticity in the vortex core region (nearly no transfer of azimuthal vorticity to the non-azimuthal planes), which aligns the rotation of the particle with the azimuthal axis. To capture the rotation about a single (azimuthal) axis, the particle was marked with distinct alternating markers along its surface, and its rotation was captured from the top view using high-speed imaging at a frame rate sufficient to resolve the motion of the markers. By tracking the position of these markers over time, we observed a consistent movement of these markers along a circular path (perpendicular to the azimuthal axis) in the images, which is indicative of rotation about a single axis. Any significant deviation from this pattern would manifest as irregularities in the trajectories of the markers, which were not observed in our measurements. The method to compute the rotation rate involved identifying the instantaneous positions of the markers in consecutive frames, and the angular velocity was then determined from the time interval between frames. To ensure the accuracy of the measurements, the imaging system was calibrated, and marker positions were tracked using image processing.
The different stages of the ring–particle interaction were captured through high-speed imaging, encompassing side-view (shadowgraphy) and top-view perspectives of the interactions (see figure 2, for example). Top and front views of the bubble–ring interaction were recorded using a high-speed Photron SA5 camera operating at approximately 3000 frames per second with an exposure time of 1/4000 s. To account for the specific illumination conditions, these two views were recorded separately after ensuring that the fundamental characteristics of the interactions remained consistent between the side and top views. In order to capture the instantaneous velocity and vorticity fields, time-resolved PIV measurements were performed at repetition rates between 2000 and 5000 Hz, depending on the experimental conditions (similar to Jha & Govardhan Reference Jha and Govardhan2015). The flow was seeded with silver-coated hollow glass spheres, having an average diameter of 14 μm and was illuminated by a double-pulsed LDY-301 Litron laser, capable of delivering up to 10 mJ of energy per pulse. A thin laser sheet was carefully aligned to pass through the central plane near the nozzle (and the vortex ring). The time interval between laser pulses was adjusted to produce a mean particle displacement of roughly one-quarter of the correlation box size in the images, and the camera exposure time was adjusted to prevent streaking of the (PIV) particles’ motion. The PIV images were captured using a Photron SA5 high-speed camera with a resolution of 1024 $\times$
1024 pixels, at a spatial resolution of 0.145 mm px−1. The raw PIV images included scattered light from both the seed particles and the larger particle. To minimise errors, light scattered by larger particles was masked out before processing. The final images were analysed in Dantec PIV software using adaptive correlation techniques, including two-step refinement of the interrogation box size. Depending on the experimental set-up, the final interrogation box size was set to 16
$\times$
1024 pixels, at a spatial resolution of 0.145 mm px−1. The raw PIV images included scattered light from both the seed particles and the larger particle. To minimise errors, light scattered by larger particles was masked out before processing. The final images were analysed in Dantec PIV software using adaptive correlation techniques, including two-step refinement of the interrogation box size. Depending on the experimental set-up, the final interrogation box size was set to 16 $\times$
16 pixel
$\times$
16 pixel $^2$
, with a 75 % overlap between adjacent boxes. Each box contained an average of 6–8 seed particles, providing robust correlation and accurate velocity measurements. With 75 % overlap, the vector spacing was 0.58 mm, enabling a reasonable number of measured velocity vectors, about 8 across the typical 4 mm vortex core. This resolution we feel was adequate to resolve the vortex core dynamics and capture the relevant hydrodynamic scales. The accuracy of the velocity field was estimated to be within 1 % of the peak measured velocity, with a subpixel displacement accuracy of approximately 0.1 pixel. The vorticity fields were calculated using a second-order central difference scheme, with uncertainties estimated to be less than 10 % of the peak vorticity values (similar to Das, Govardhan & Arakeri Reference Das, Govardhan and Arakeri2018).
$^2$
, with a 75 % overlap between adjacent boxes. Each box contained an average of 6–8 seed particles, providing robust correlation and accurate velocity measurements. With 75 % overlap, the vector spacing was 0.58 mm, enabling a reasonable number of measured velocity vectors, about 8 across the typical 4 mm vortex core. This resolution we feel was adequate to resolve the vortex core dynamics and capture the relevant hydrodynamic scales. The accuracy of the velocity field was estimated to be within 1 % of the peak measured velocity, with a subpixel displacement accuracy of approximately 0.1 pixel. The vorticity fields were calculated using a second-order central difference scheme, with uncertainties estimated to be less than 10 % of the peak vorticity values (similar to Das, Govardhan & Arakeri Reference Das, Govardhan and Arakeri2018).
The initial convection speed of the vortex ring ( $u_{c,o}$
) and its initial radius (
$u_{c,o}$
) and its initial radius ( $D_o$
), both determined before the particle’s capture, were employed for normalising the dimensional time (
$D_o$
), both determined before the particle’s capture, were employed for normalising the dimensional time ( $t$
), the vertical position of the ring (
$t$
), the vertical position of the ring ( $z$
) and azimuthal vorticity (
$z$
) and azimuthal vorticity ( $\omega$
) as
$\omega$
) as $t^{\ast }$
=
$t^{\ast }$
= $tu_{c,o}/D_o$
,
$tu_{c,o}/D_o$
, $z^{\ast }$
=
$z^{\ast }$
= $z/D_o$
and
$z/D_o$
and ${\omega }^{\ast }$
=
${\omega }^{\ast }$
= ${\omega }D_o/u_{c,o}$
, respectively. Since the interaction between the ring and the particle is coupled, we present both the particle dynamics and vortex ring dynamics, with the main focus being on the effects of the particle-to-vortex size ratio (
${\omega }D_o/u_{c,o}$
, respectively. Since the interaction between the ring and the particle is coupled, we present both the particle dynamics and vortex ring dynamics, with the main focus being on the effects of the particle-to-vortex size ratio ( $D_P/D_{c,o}$
) on several aspects related to the interactions. These include the particle motion within the ring and, simultaneously, the particle effects on the ring’s deformation, propagation, azimuthal vorticity and azimuthal enstrophy.
$D_P/D_{c,o}$
) on several aspects related to the interactions. These include the particle motion within the ring and, simultaneously, the particle effects on the ring’s deformation, propagation, azimuthal vorticity and azimuthal enstrophy.
3. Particle dynamics
The interaction of the vortex ring and the particle begins as the buoyant particle gets engulfed inside the low-pressure vortex core as shown in figure 2. We observe that post-capture, the particle undergoes different types of motions within the ring, including radial motion about the vortex core centre (or, equivalently, about the azimuthal axis), translation along the ring’s azimuthal axis and rotation about an axis that is parallel to the azimuthal axis, as schematically shown in figure 1(b).
3.1. Particle’s radial location within the vortex core
We begin by discussing the radial motion of the particle within the vortex core. We start with example snapshots of the top-view imaging showing the particle inside the vortex ring, in figure 6, for two particle sizes. As can be seen, the smaller particle in figure 6(a) stays nearly at the centre of the vortex core (represented by the azimuthal axis) while the larger particle in figure 6(b) stays at a substantially radial offset position, with these observations being reminiscent of previous studies (Sridhar & Katz Reference Sridhar and Katz1999; Bluemink et al. Reference Bluemink, Lohse, Prosperetti and Van Wijngaarden2010) and are discussed more later in this section. The radial offset is illustrated using a schematic representing the top view of a particle within a vortex in figure 7(a), where the particle location is shown with a radial offset from the azimuthal axis of the ring (by $\Delta r$
), as seen from the top-view imaging of the interactions. This radial offset (
$\Delta r$
), as seen from the top-view imaging of the interactions. This radial offset ( $\Delta r$
=
$\Delta r$
= $r_{cent,p}-r_{core}$
) between the particle’s centre (
$r_{cent,p}-r_{core}$
) between the particle’s centre ( $r_{cent,p}$
) and the ring’s core centre (
$r_{cent,p}$
) and the ring’s core centre ( $r_{core}$
), or equivalently the azimuthal axis, is found to be changing with time, as shown in figure 7(b,c), for different particle sizes interacting with small-
$r_{core}$
), or equivalently the azimuthal axis, is found to be changing with time, as shown in figure 7(b,c), for different particle sizes interacting with small- $Re$
and large-
$Re$
and large- $Re$
vortex rings. We notice from figure 7(b,c) that the radial location of the particle oscillates with time for both
$Re$
vortex rings. We notice from figure 7(b,c) that the radial location of the particle oscillates with time for both $Re$
cases shown, while the radial offset (
$Re$
cases shown, while the radial offset ( $\Delta r$
) and the radial oscillation amplitude are both seen to increase with particle size
$\Delta r$
) and the radial oscillation amplitude are both seen to increase with particle size $D_p/D_{c,o}$
. It is also clear that there are substantial differences between the small-
$D_p/D_{c,o}$
. It is also clear that there are substantial differences between the small- $Re$
and large-
$Re$
and large- $Re$
cases, as discussed below. It may be noted that in the figure,
$Re$
cases, as discussed below. It may be noted that in the figure, $\Delta r$
= 0 corresponds to the particle’s centre aligning with the ring’s core or azimuthal axis, while
$\Delta r$
= 0 corresponds to the particle’s centre aligning with the ring’s core or azimuthal axis, while $\Delta r \gt 0$
corresponds to the particle’s centre being located radially outwards from the ring’s azimuthal axis and
$\Delta r \gt 0$
corresponds to the particle’s centre being located radially outwards from the ring’s azimuthal axis and $\Delta r \lt 0$
to the case when the particle’s centre is located inside the azimuthal axis.
$\Delta r \lt 0$
to the case when the particle’s centre is located inside the azimuthal axis.
Top-view images of the particle inside the vortex ring, immediately after capture ( $tu_{c,o}/D_o\approx$
1.5), for (a)
$tu_{c,o}/D_o\approx$
1.5), for (a) $D_p/D_{c,o}$
= 0.62 and (b)
$D_p/D_{c,o}$
= 0.62 and (b) $D_p/D_{c,o}$
= 1.67, both at
$D_p/D_{c,o}$
= 1.67, both at $Re$
of 6000. The black dashed lines drawn along the tracer microbubbles represent the ring’s azimuthal axis. We can clearly observe in the insets that the smaller particle stays nearly at the centre of the vortex core (represented by the azimuthal axis) while the larger particle stays at a substantially radial offset (
$Re$
of 6000. The black dashed lines drawn along the tracer microbubbles represent the ring’s azimuthal axis. We can clearly observe in the insets that the smaller particle stays nearly at the centre of the vortex core (represented by the azimuthal axis) while the larger particle stays at a substantially radial offset ( $\Delta r$
) position. Also to be noted is the largely deformed azimuthal axis in (b), and this aspect is discussed in § 4.2. In both the cases shown in this figure, the vortex ring core size is the same.
$\Delta r$
) position. Also to be noted is the largely deformed azimuthal axis in (b), and this aspect is discussed in § 4.2. In both the cases shown in this figure, the vortex ring core size is the same.
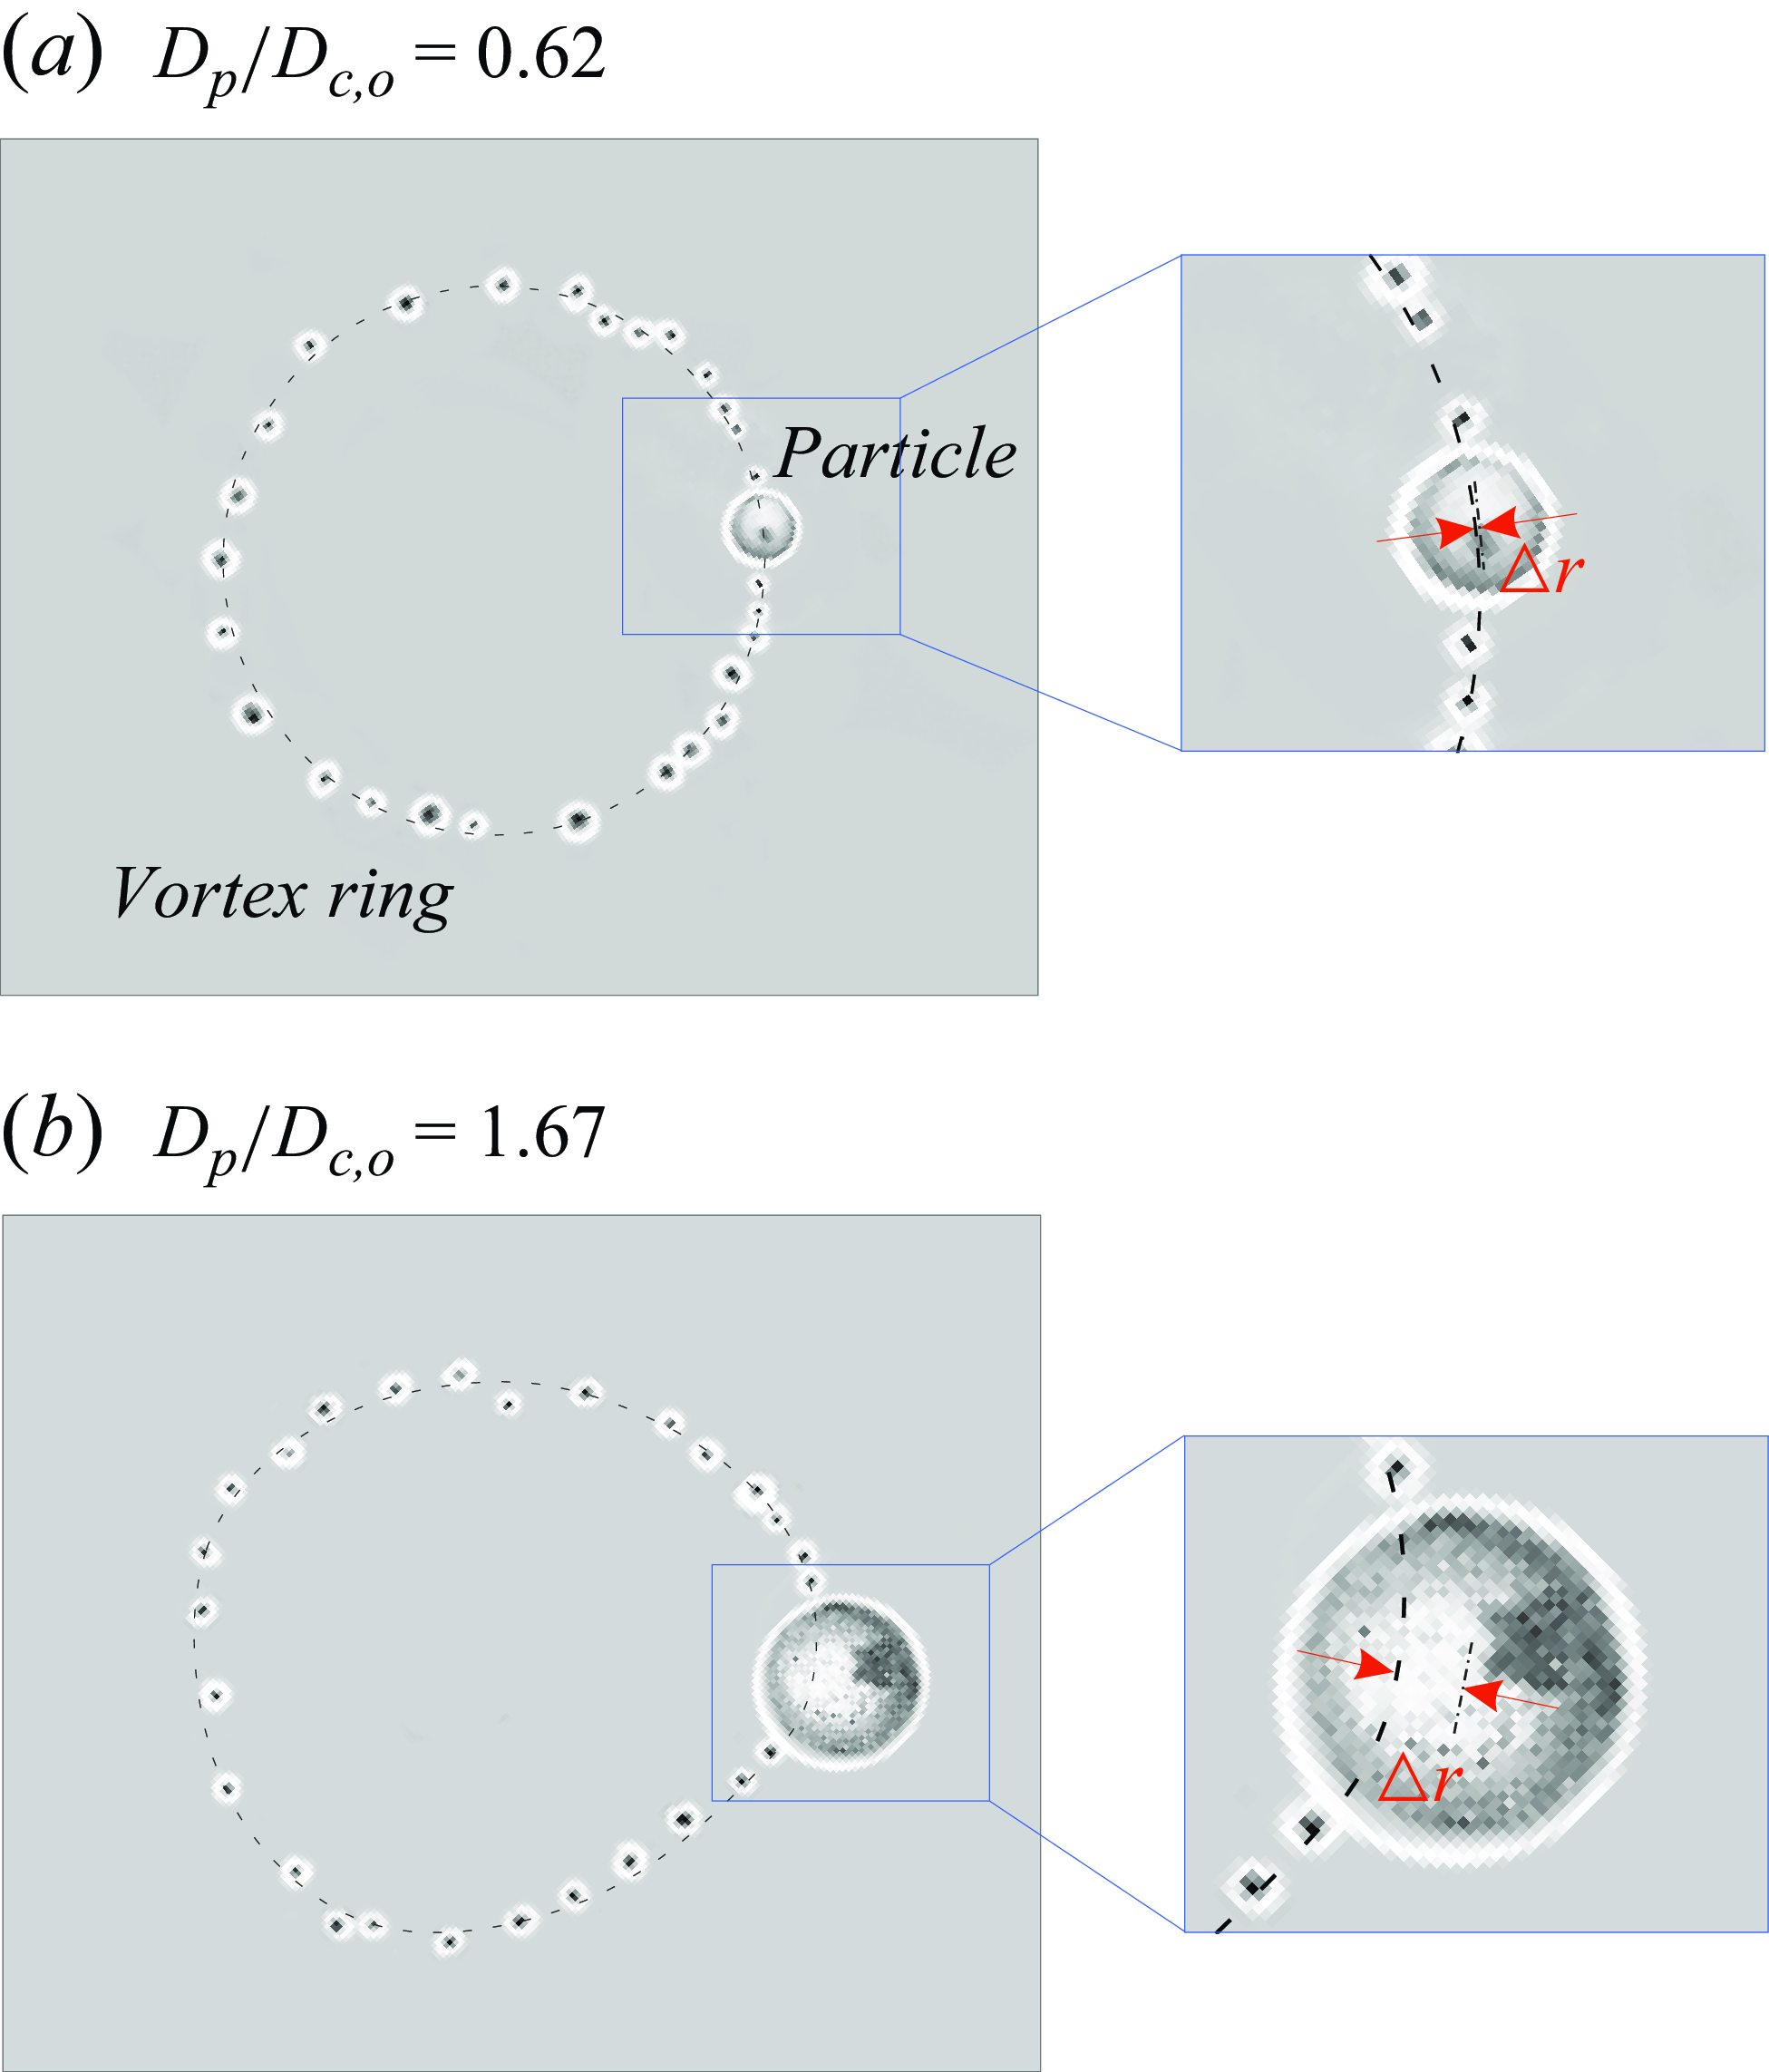
(a) A top-view schematic representing the radial position of a particle inside the vortex core. Here, the offset distance between the particle’s centre ( $r_{cent,p}$
) and the core’s centre (equivalently, azimuthal axis) (
$r_{cent,p}$
) and the core’s centre (equivalently, azimuthal axis) ( $r_{core}$
) is shown as
$r_{core}$
) is shown as $\Delta r$
=
$\Delta r$
= $r_{cent,p}-r_{core}$
. In the configuration, the radial position,
$r_{cent,p}-r_{core}$
. In the configuration, the radial position, $r$
= 0, indicates the centre of the ring, and
$r$
= 0, indicates the centre of the ring, and $r=D_o/2$
represents the azimuthal axis (equivalently, core’s centre). Also to be noted is the inner (
$r=D_o/2$
represents the azimuthal axis (equivalently, core’s centre). Also to be noted is the inner ( $r\lt D_o/2$
) and outer (
$r\lt D_o/2$
) and outer ( $r\gt D_o/2$
) extent of the ring’s azimuthal axis (
$r\gt D_o/2$
) extent of the ring’s azimuthal axis ( $D_o$
= ring diameter). The variation in the radial offset (
$D_o$
= ring diameter). The variation in the radial offset ( $\Delta r/D_{c,o}$
) with time is shown for different particle sizes for (b) low (
$\Delta r/D_{c,o}$
) with time is shown for different particle sizes for (b) low ( $Re$
= 6000) ring Reynolds number and for (c) large (
$Re$
= 6000) ring Reynolds number and for (c) large ( $Re$
= 67 300) ring Reynolds number.
$Re$
= 67 300) ring Reynolds number.
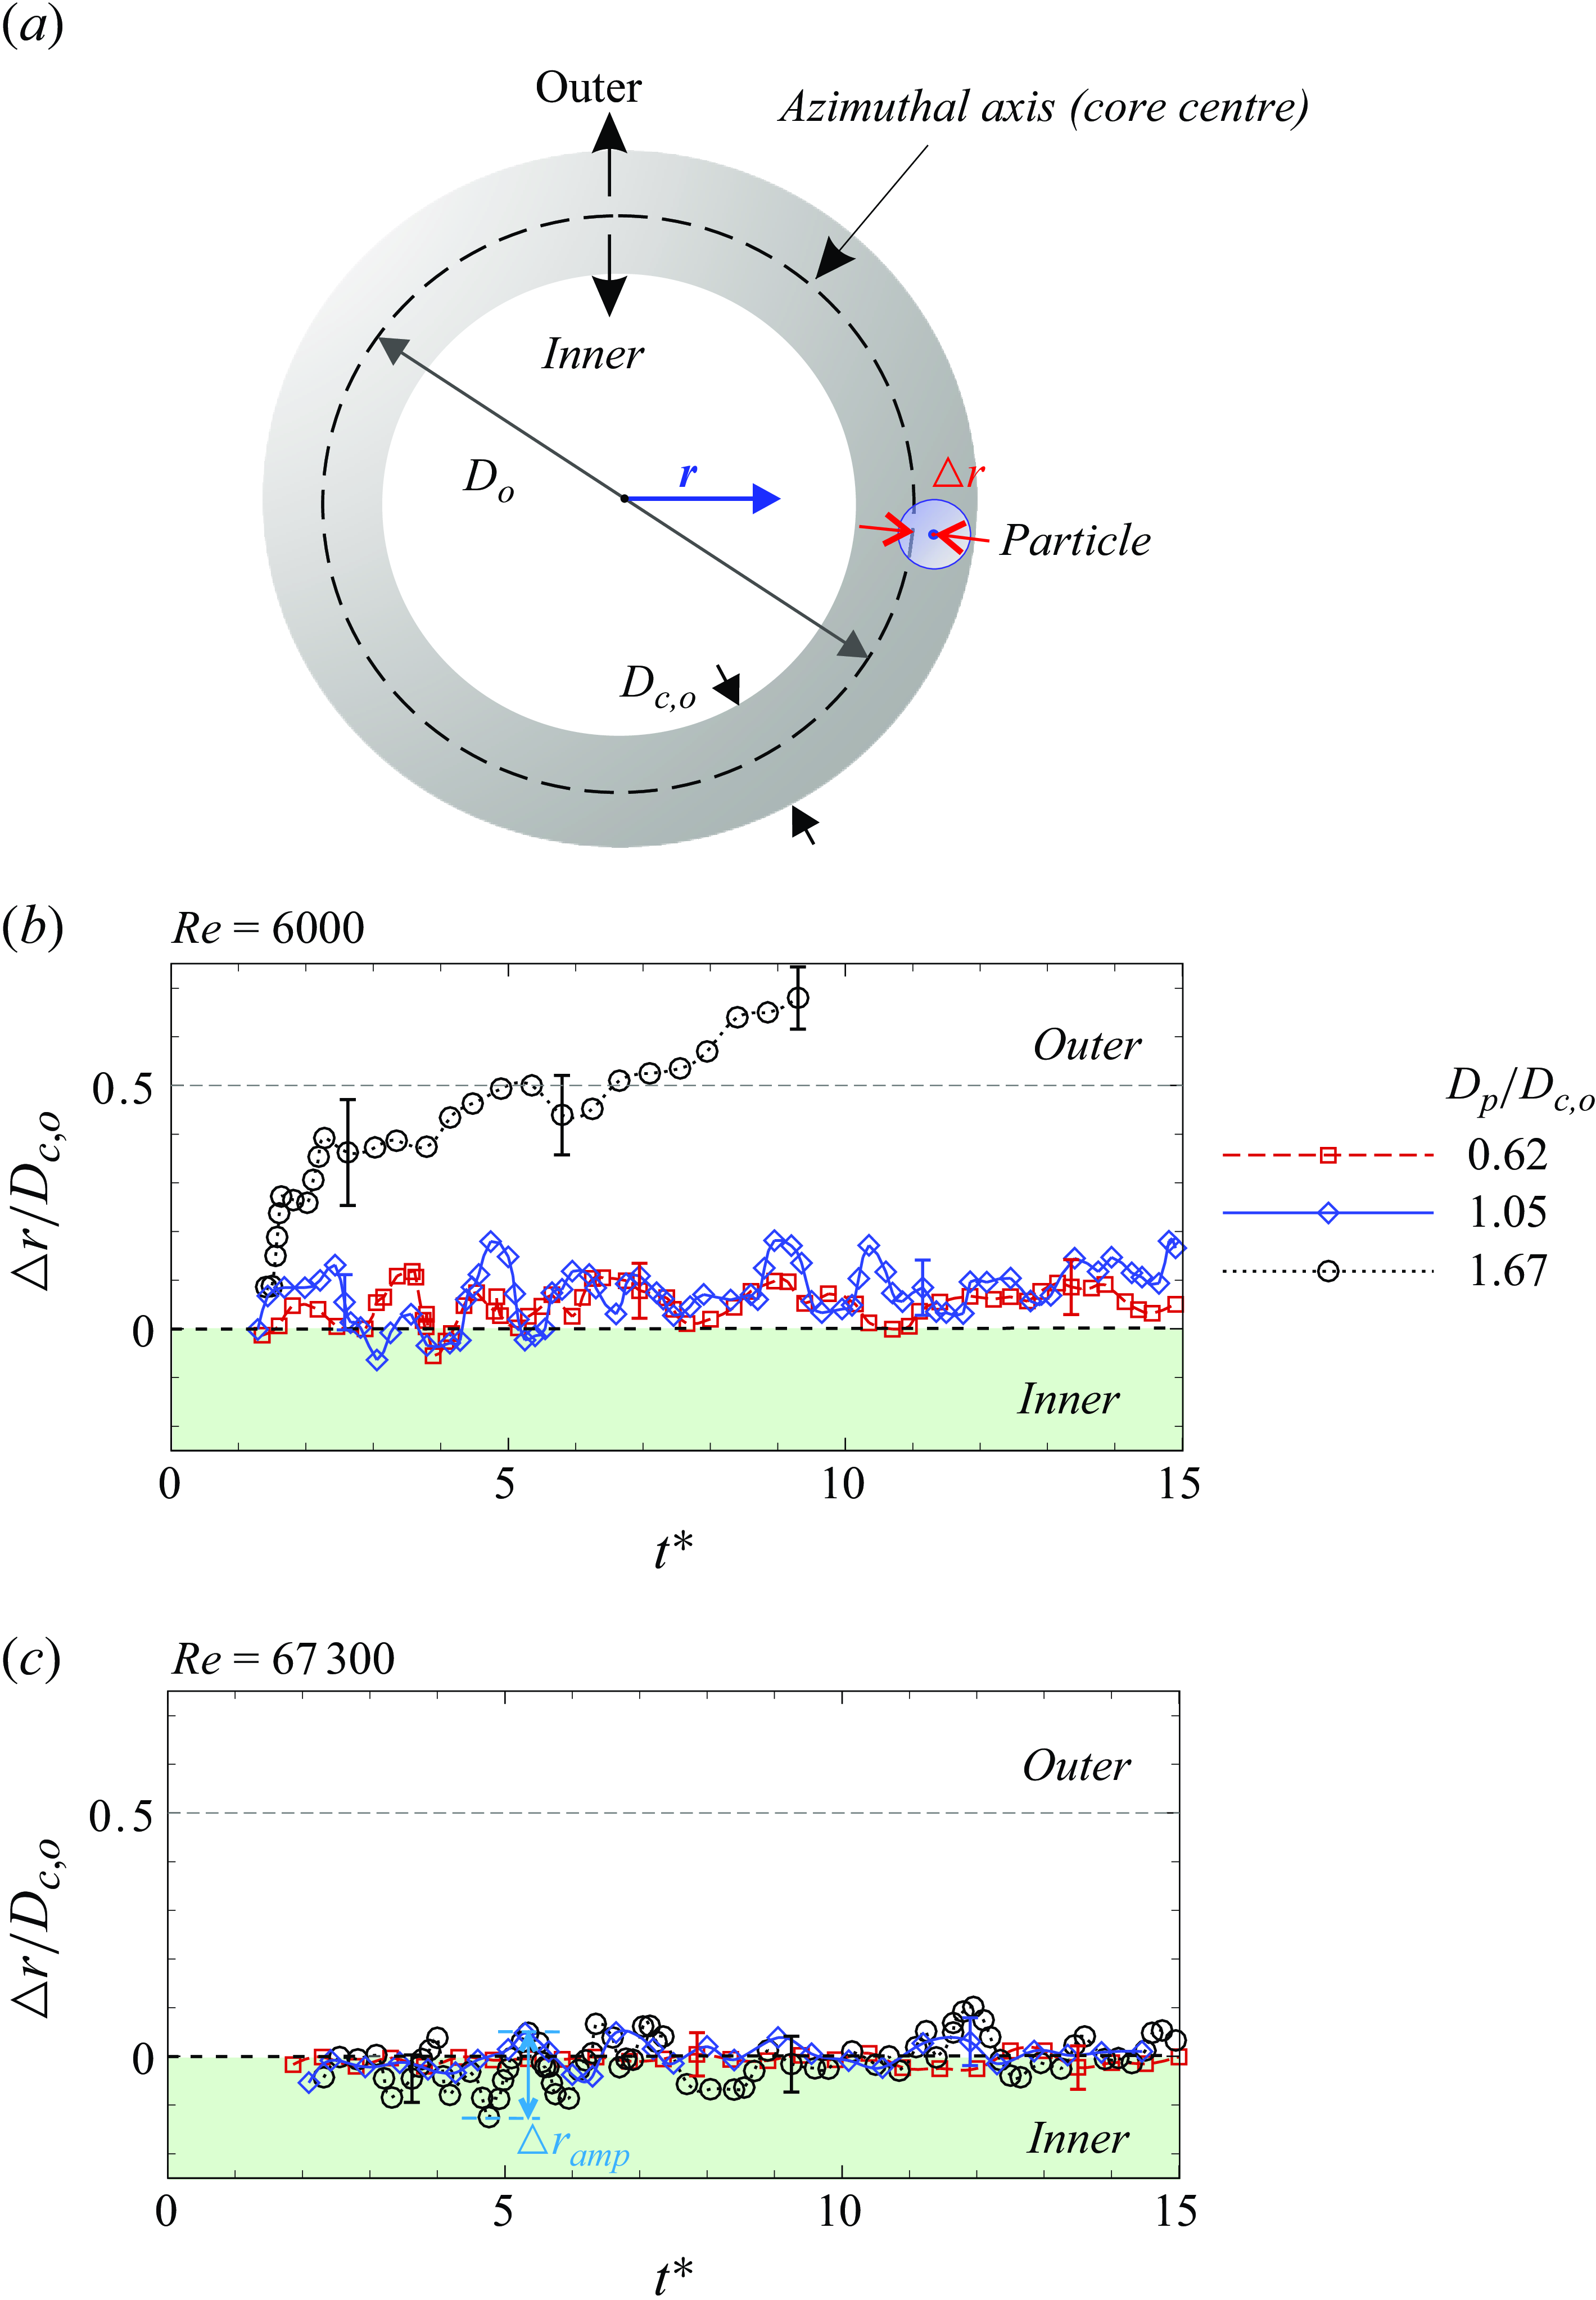
We begin with the lower $Re$
of 6000, in figure 7(b), where we find that the different particle sizes, at all times, show
$Re$
of 6000, in figure 7(b), where we find that the different particle sizes, at all times, show $\Delta r$
to be
$\Delta r$
to be ${\gt } 0$
, indicating that the particle stays at an offset location towards the outer side of the ring. Comparing the low (
${\gt } 0$
, indicating that the particle stays at an offset location towards the outer side of the ring. Comparing the low ( $D_p/D_{c,o}$
= 0.62) and intermediate (
$D_p/D_{c,o}$
= 0.62) and intermediate ( $D_p/D_{c,o}$
= 1.05) particle size cases, we notice that the larger one experiences higher-amplitude oscillations in
$D_p/D_{c,o}$
= 1.05) particle size cases, we notice that the larger one experiences higher-amplitude oscillations in $\Delta r$
, and also the offset (in a mean sense) is higher compared with the smaller particle. For a better illustration, we show in figure 8(a) the variations in the radial oscillation amplitude (
$\Delta r$
, and also the offset (in a mean sense) is higher compared with the smaller particle. For a better illustration, we show in figure 8(a) the variations in the radial oscillation amplitude ( $\Delta r_{amp}$
) of the particle with particle size (
$\Delta r_{amp}$
) of the particle with particle size ( $D_p/D_{c,o}$
), where
$D_p/D_{c,o}$
), where $\Delta r_{amp}$
is defined as the radial distance between the maximum and minimum radial position of the particle’s centre measured within the window of
$\Delta r_{amp}$
is defined as the radial distance between the maximum and minimum radial position of the particle’s centre measured within the window of $t^{\ast }\approx$
5–6 (indicated in figure 7
c). We can clearly notice from the figure that the radial oscillation amplitude increases with particle size at
$t^{\ast }\approx$
5–6 (indicated in figure 7
c). We can clearly notice from the figure that the radial oscillation amplitude increases with particle size at $Re$
of 6000 (and other
$Re$
of 6000 (and other $Re$
cases). We can, however, see that the trend for the largest particle studied (
$Re$
cases). We can, however, see that the trend for the largest particle studied ( $D_p/D_{c,o}$
of 1.67) seems to be very different as seen in figure 7(b). In this case, immediately after particle capture, the radial offset (
$D_p/D_{c,o}$
of 1.67) seems to be very different as seen in figure 7(b). In this case, immediately after particle capture, the radial offset ( $\Delta r$
) increases nearly monotonically with time and
$\Delta r$
) increases nearly monotonically with time and $\Delta r$
exceeds
$\Delta r$
exceeds $0.5 D_{c,o}$
at a later time, indicating the particle position is significantly away from the core centre and this is further followed by particle escape from the core. It may be noted that the Reynolds number of the particle (inside the ring’s core) broadly spans over a range of
$0.5 D_{c,o}$
at a later time, indicating the particle position is significantly away from the core centre and this is further followed by particle escape from the core. It may be noted that the Reynolds number of the particle (inside the ring’s core) broadly spans over a range of $Re_{o,p}$
=
$Re_{o,p}$
= $D_pu_{c,\Delta r_m}/\nu \approx 40{-}800$
, as shown in table 3; here,
$D_pu_{c,\Delta r_m}/\nu \approx 40{-}800$
, as shown in table 3; here, $u_{c,\Delta r_m}$
is the undisturbed (base ring) flow velocity within the core, measured at a radial distance of
$u_{c,\Delta r_m}$
is the undisturbed (base ring) flow velocity within the core, measured at a radial distance of $\Delta r_m$
from the core’s centre, following an approach similar to that of Bluemink et al. (Reference Bluemink, Lohse, Prosperetti and Van Wijngaarden2008). For large-
$\Delta r_m$
from the core’s centre, following an approach similar to that of Bluemink et al. (Reference Bluemink, Lohse, Prosperetti and Van Wijngaarden2008). For large- $Re$
interaction cases, in figure 7(c), we find that the amplitude of oscillation in
$Re$
interaction cases, in figure 7(c), we find that the amplitude of oscillation in $\Delta r$
increases with particle size, as in the lower-
$\Delta r$
increases with particle size, as in the lower- $Re$
case. However, the radial offset behaviour in this higher-
$Re$
case. However, the radial offset behaviour in this higher- $Re$
case is significantly different, with the mean (time-averaged) radial offset (
$Re$
case is significantly different, with the mean (time-averaged) radial offset ( $\Delta r_m$
, figure 8
b) being close to zero for all the particle size cases studied, unlike the low-
$\Delta r_m$
, figure 8
b) being close to zero for all the particle size cases studied, unlike the low- $Re$
cases where the particle has a larger radial offset and stays towards the outward side of the vortex core (
$Re$
cases where the particle has a larger radial offset and stays towards the outward side of the vortex core ( $\Delta r, \Delta r_m \gt$
0). These observations are analogous to those of Bluemink et al. (Reference Bluemink, Lohse, Prosperetti and Van Wijngaarden2010), reporting on the equilibrium position of a freely rotating buoyant sphere inside a solid body-like rotating flow. They observed that the particle’s offset from the axis of rotation of the cylinder increases with the reductions in the rate of rotation (equivalently,
$\Delta r, \Delta r_m \gt$
0). These observations are analogous to those of Bluemink et al. (Reference Bluemink, Lohse, Prosperetti and Van Wijngaarden2010), reporting on the equilibrium position of a freely rotating buoyant sphere inside a solid body-like rotating flow. They observed that the particle’s offset from the axis of rotation of the cylinder increases with the reductions in the rate of rotation (equivalently, $Re$
) of the flow. However, it should be noted that the particle, in their configuration, reaches an equilibrium position, unlike the present study, where the particle is seen to oscillate radially about the vortex core’s centre. In addition, the particle was much smaller than the cylinder, unlike the present case, where the particle size is of the order of that of the vortex ring.
$Re$
) of the flow. However, it should be noted that the particle, in their configuration, reaches an equilibrium position, unlike the present study, where the particle is seen to oscillate radially about the vortex core’s centre. In addition, the particle was much smaller than the cylinder, unlike the present case, where the particle size is of the order of that of the vortex ring.
(a) The variation in the particle’s amplitude of radial oscillation ( $\Delta r_{amp}/D_{c,o}$
) with
$\Delta r_{amp}/D_{c,o}$
) with $D_p/D_{c,o}$
, measured around
$D_p/D_{c,o}$
, measured around $t^{\ast }$
of 5–8, is shown at three
$t^{\ast }$
of 5–8, is shown at three $Re$
. (b) The variation in the time-averaged particle offset (
$Re$
. (b) The variation in the time-averaged particle offset ( $\Delta r_m/D_{c,o}$
) with
$\Delta r_m/D_{c,o}$
) with $D_p/D_{c,o}$
is shown at three
$D_p/D_{c,o}$
is shown at three $Re$
. The radial oscillation amplitude and the mean radial offset for the particle are seen to scale as
$Re$
. The radial oscillation amplitude and the mean radial offset for the particle are seen to scale as $(D_p/D_{c,o})^{1.22}Re^{-0.38}$
and
$(D_p/D_{c,o})^{1.22}Re^{-0.38}$
and $(D_p/D_{c,o})^{3.7}Re^{-1.26}$
, respectively (
$(D_p/D_{c,o})^{3.7}Re^{-1.26}$
, respectively ( $R^2\gt 0.9$
).
$R^2\gt 0.9$
).
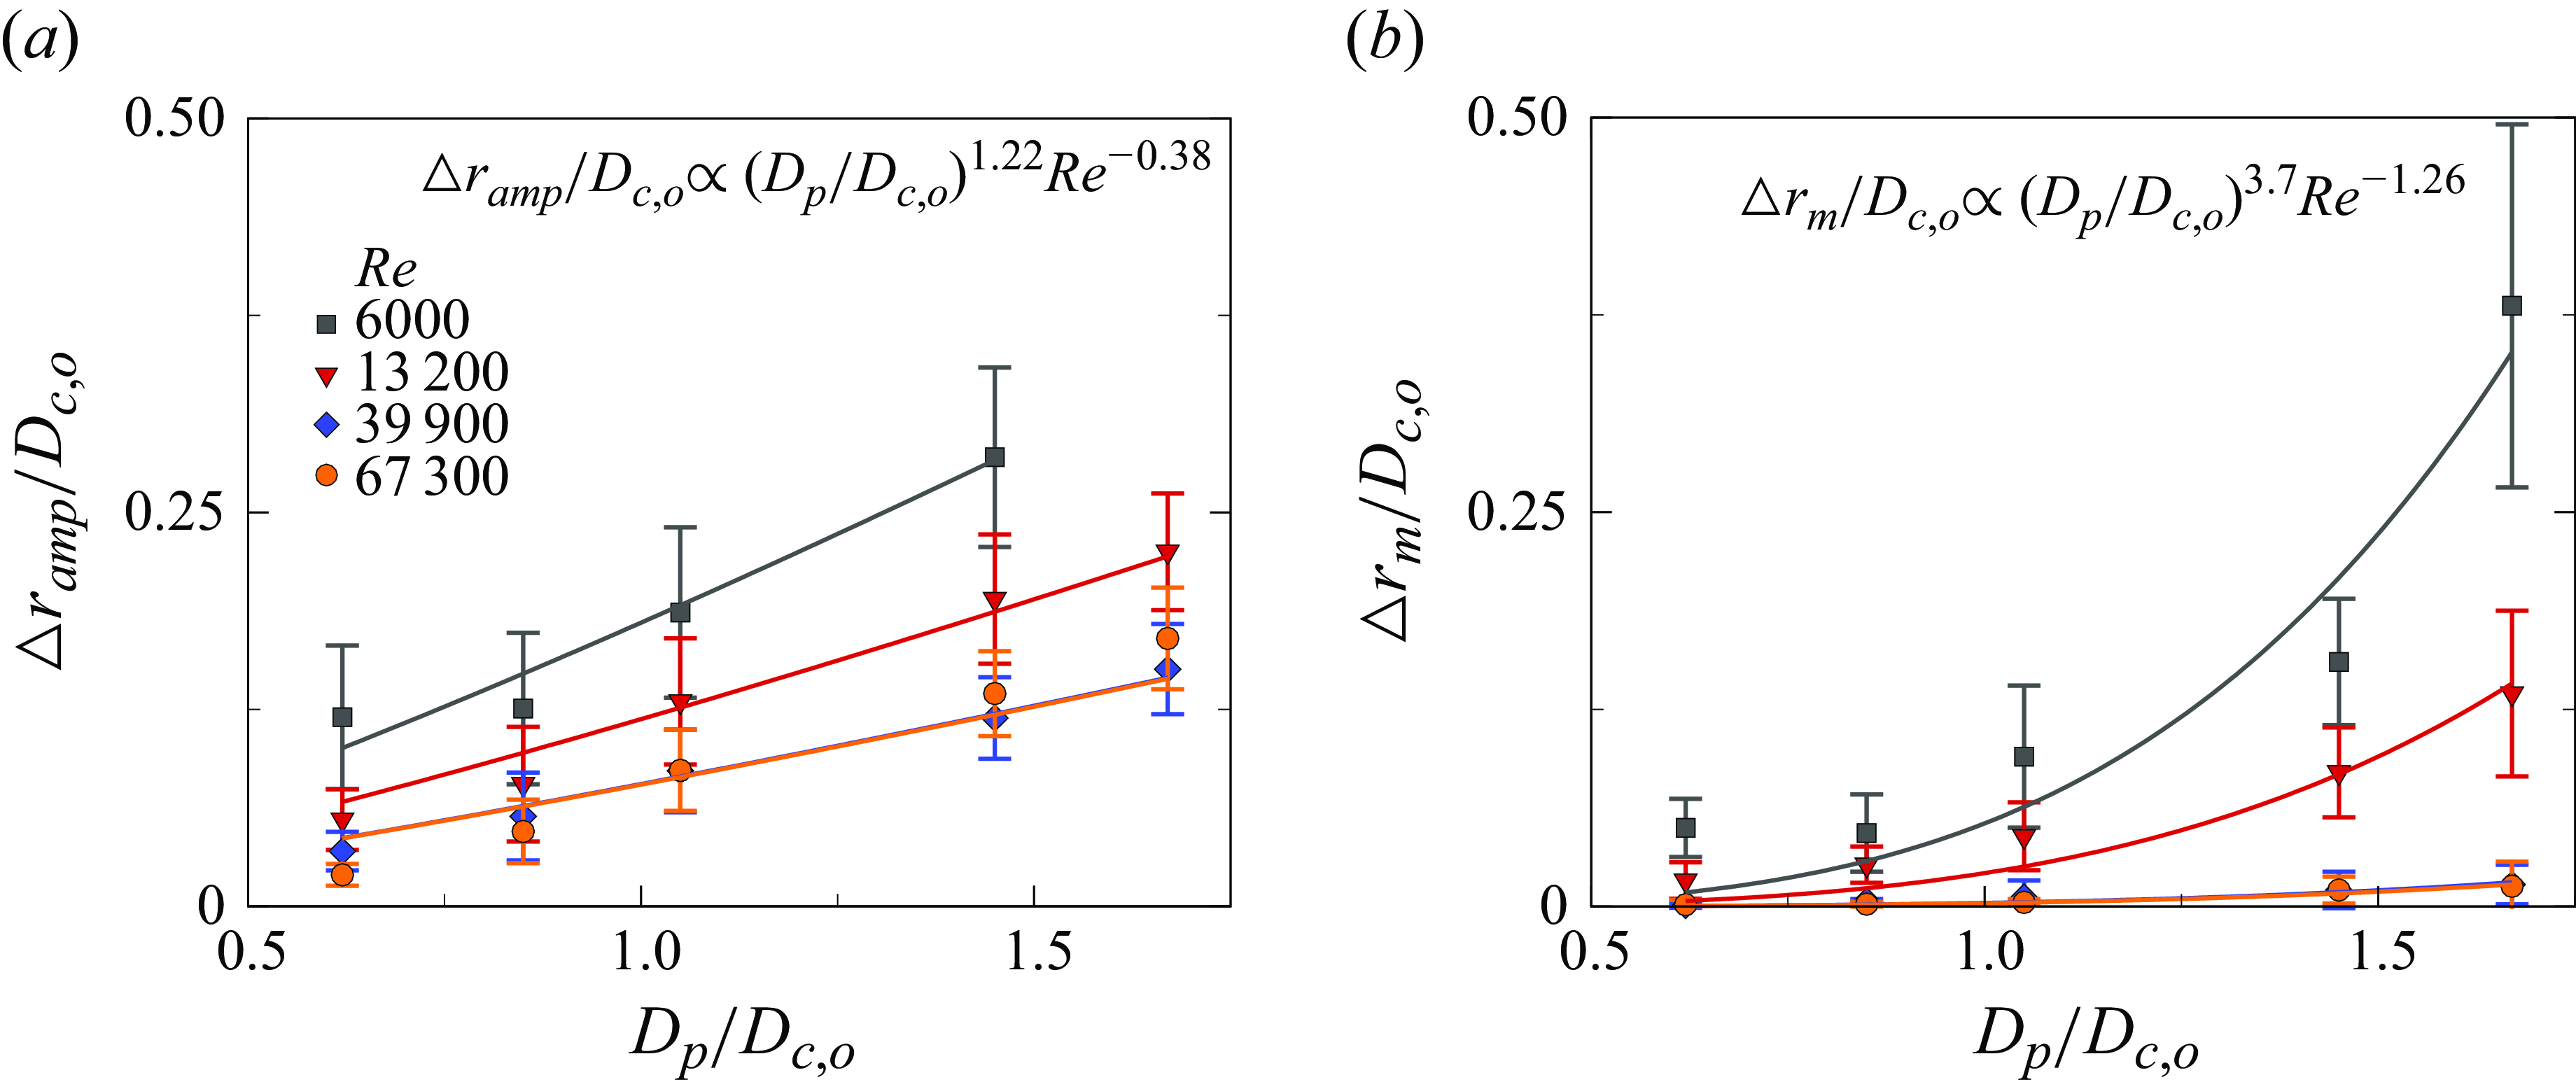
Table showing the Stokes numbers ( $St$
=
$St$
= ${\tau }_{particle}/{\tau }_{core}$
), corresponding to different particle-to-ring core diameter ratios (
${\tau }_{particle}/{\tau }_{core}$
), corresponding to different particle-to-ring core diameter ratios ( $D_p/D_{c,o}$
), over the entire range of ring Reynolds number (
$D_p/D_{c,o}$
), over the entire range of ring Reynolds number ( $Re$
) studied; here, particle time scale
$Re$
) studied; here, particle time scale ${\tau }_{particle}$
=
${\tau }_{particle}$
= ${\rho }_{particle}D^2_p/18{\mu }$
(Subramaniam & Balachandar Reference Subramaniam and Balachandar2022) and vortex core’s time scale
${\rho }_{particle}D^2_p/18{\mu }$
(Subramaniam & Balachandar Reference Subramaniam and Balachandar2022) and vortex core’s time scale ${\tau }_{core}$
=
${\tau }_{core}$
= ${\pi }(D_{c,o}/2)^2/{\varGamma }$
(Finn et al. Reference Finn, Shams and Apte2011). Also shown here are the convection speeds of the vortex ring measured just before the capture of the particle begins (
${\pi }(D_{c,o}/2)^2/{\varGamma }$
(Finn et al. Reference Finn, Shams and Apte2011). Also shown here are the convection speeds of the vortex ring measured just before the capture of the particle begins ( $u_{c,o}$
) for all
$u_{c,o}$
) for all $Re$
cases.
$Re$
cases.
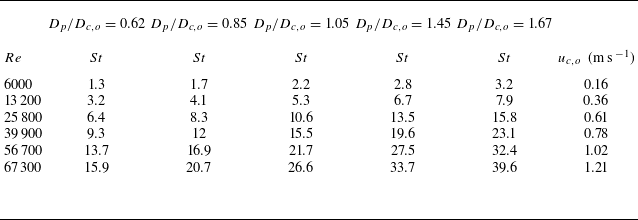
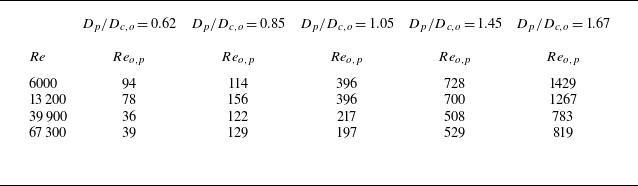
Table showing the Reynolds number for the radially oscillating particle ( $Re_{o,p}$
=
$Re_{o,p}$
= $D_pu_{c, \Delta r_m}/\nu$
) within the vortex core, shown for the cases from figure 8; here,
$D_pu_{c, \Delta r_m}/\nu$
) within the vortex core, shown for the cases from figure 8; here, $u_{c,\Delta r_m}$
is the undisturbed (base ring) flow velocity within the core measured at a radial distance of
$u_{c,\Delta r_m}$
is the undisturbed (base ring) flow velocity within the core measured at a radial distance of $\Delta r_m$
from the core’s centre which is to the mean radial location of the particle (similar to Bluemink et al. Reference Bluemink, Lohse, Prosperetti and Van Wijngaarden2008).
$\Delta r_m$
from the core’s centre which is to the mean radial location of the particle (similar to Bluemink et al. Reference Bluemink, Lohse, Prosperetti and Van Wijngaarden2008).
We have observed an increase in particle (mean) radial equilibrium position with increasing particle size (figure 8
b), which is broadly consistent with previous studies (Sridhar & Katz Reference Sridhar and Katz1995, Reference Sridhar and Katz1999; Finn et al. Reference Finn, Shams and Apte2011). For instance, Sridhar & Katz (Reference Sridhar and Katz1999) reported that the radial equilibrium location of a (micro)bubble within a vortex core increases with bubble size. To interpret this trend, we briefly discuss the relevant forces acting on a bubble/particle in such a flow. As outlined by Sridhar & Katz (Reference Sridhar and Katz1999), the forces acting on a bubble in a vortex core include the pressure gradient force ( $F_P = \rho V_b ({D\mathbf{U}_l}/{Dt})$
), lift force (
$F_P = \rho V_b ({D\mathbf{U}_l}/{Dt})$
), lift force ( $F_L = ({1}/{2}) \rho C_L ({\pi }/{4}) D_b^2 \overline {U}_{\it{rel}}^2$
), drag force (
$F_L = ({1}/{2}) \rho C_L ({\pi }/{4}) D_b^2 \overline {U}_{\it{rel}}^2$
), drag force ( $F_D = ({1}/{2}) \rho C_D ({\pi }/{4} ) D_b^2 \overline {U}_{\it{rel}}^2$
), virtual mass (inertial) force (
$F_D = ({1}/{2}) \rho C_D ({\pi }/{4} ) D_b^2 \overline {U}_{\it{rel}}^2$
), virtual mass (inertial) force ( $F_i = \rho _l V_b C_{A,M} ( ({D\mathbf{U}_l}/{Dt}) - ({{\rm d}\mathbf{U}_b}/{{\rm d}t}) )$
) and buoyancy force (
$F_i = \rho _l V_b C_{A,M} ( ({D\mathbf{U}_l}/{Dt}) - ({{\rm d}\mathbf{U}_b}/{{\rm d}t}) )$
) and buoyancy force ( $F_g = V_b (\rho _l - \rho _b) g$
); where
$F_g = V_b (\rho _l - \rho _b) g$
); where $\overline {U}_{\it{rel}}$
denotes the relative velocity between the bubble and fluid in the vortex core,
$\overline {U}_{\it{rel}}$
denotes the relative velocity between the bubble and fluid in the vortex core, $({D\mathbf{U}_l}/{Dt})$
is the local fluid acceleration,
$({D\mathbf{U}_l}/{Dt})$
is the local fluid acceleration, $({{\rm d}\mathbf{U}_b}/{{\rm d}t})$
is the Lagrangian acceleration of the bubble and
$({{\rm d}\mathbf{U}_b}/{{\rm d}t})$
is the Lagrangian acceleration of the bubble and $V_b = {\pi D_b^3}/{6}$
is the bubble volume, with
$V_b = {\pi D_b^3}/{6}$
is the bubble volume, with $D_b$
being the bubble diameter. Now, once the bubble/particle reaches its radial equilibrium position, the relative velocity can be approximated as
$D_b$
being the bubble diameter. Now, once the bubble/particle reaches its radial equilibrium position, the relative velocity can be approximated as $\overline {U}_{\it{rel}} \approx {\varGamma r}/{2\pi (D_{c,o}/2)^2}$
, and the local fluid acceleration as
$\overline {U}_{\it{rel}} \approx {\varGamma r}/{2\pi (D_{c,o}/2)^2}$
, and the local fluid acceleration as $({D\mathbf{U}_l}/{Dt}) \approx {\varGamma ^2 r}/{4\pi ^2 (D_{c,o}/2)^2}$
, as described by Sridhar & Katz (Reference Sridhar and Katz1999). Substituting these into the force expressions, we find that the radially inward pressure and inertial forces scale as
$({D\mathbf{U}_l}/{Dt}) \approx {\varGamma ^2 r}/{4\pi ^2 (D_{c,o}/2)^2}$
, as described by Sridhar & Katz (Reference Sridhar and Katz1999). Substituting these into the force expressions, we find that the radially inward pressure and inertial forces scale as $F_P, F_i \propto r D_b^3$
, whereas the radially outward lift force scales as
$F_P, F_i \propto r D_b^3$
, whereas the radially outward lift force scales as $F_L \propto r^2 D_b^2$
. These scaling relations imply that as the bubble size
$F_L \propto r^2 D_b^2$
. These scaling relations imply that as the bubble size $D_b$
(or equivalently,
$D_b$
(or equivalently, $D_P$
in our case) increases, maintaining force balance would require an outward shift of the radial equilibrium position (
$D_P$
in our case) increases, maintaining force balance would require an outward shift of the radial equilibrium position ( $r$
), which aligns well with our experimental observations. It may be noted that in Sridhar & Katz (Reference Sridhar and Katz1995, Reference Sridhar and Katz1999), the bubble surfaces were fully contaminated, as evidenced by the fact that the measured drag coefficients were close to those of rigid spheres (Clift, Grace & Weber Reference Clift, Grace and Weber1978). More recent studies (Rastello et al. Reference Rastello, Marié, Grosjean and Lance2009, Reference Rastello, Marié and Lance2017; Rastello & Marié Reference Rastello and Marié2020) have shown that such fully contaminated bubbles exhibit rotational dynamics and a Magnus-type lift force, much like rigid spheres in similar flow conditions (Bluemink et al. Reference Bluemink, Lohse, Prosperetti and Van Wijngaarden2008, Reference Bluemink, Lohse, Prosperetti and Van Wijngaarden2010). This suggests that the force formulations discussed in Sridhar & Katz (Reference Sridhar and Katz1995) for contaminated bubbles can reasonably be applied to rigid spherical particles, as in our case, although it should be noted that there are simplifying assumptions, as discussed below.
$r$
), which aligns well with our experimental observations. It may be noted that in Sridhar & Katz (Reference Sridhar and Katz1995, Reference Sridhar and Katz1999), the bubble surfaces were fully contaminated, as evidenced by the fact that the measured drag coefficients were close to those of rigid spheres (Clift, Grace & Weber Reference Clift, Grace and Weber1978). More recent studies (Rastello et al. Reference Rastello, Marié, Grosjean and Lance2009, Reference Rastello, Marié and Lance2017; Rastello & Marié Reference Rastello and Marié2020) have shown that such fully contaminated bubbles exhibit rotational dynamics and a Magnus-type lift force, much like rigid spheres in similar flow conditions (Bluemink et al. Reference Bluemink, Lohse, Prosperetti and Van Wijngaarden2008, Reference Bluemink, Lohse, Prosperetti and Van Wijngaarden2010). This suggests that the force formulations discussed in Sridhar & Katz (Reference Sridhar and Katz1995) for contaminated bubbles can reasonably be applied to rigid spherical particles, as in our case, although it should be noted that there are simplifying assumptions, as discussed below.
Now, going back to the force formulations, it is important to note that while these simplified force relations help explain the observed trend in the radial equilibrium position, they also raise questions when examined from a stability perspective for a given bubble/particle size. In this case, the radially outward lift force scales as $\propto r^2$
, whereas the inward-acting pressure gradient and added mass (inertial) forces scale as
$\propto r^2$
, whereas the inward-acting pressure gradient and added mass (inertial) forces scale as $\propto r$
. These expressions suggest that a small radial perturbation (say,
$\propto r$
. These expressions suggest that a small radial perturbation (say, $+{\rm d}r$
) would result in the particle being pushed even further away from its equilibrium position, which implies an unstable equilibrium. However, our experimental observations clearly show a stable radial (mean) equilibrium position, an outcome that cannot be explained if the simplified force formulation were entirely valid. This discrepancy suggests the presence of additional effects that would lead to modifications in the force expressions. A likely cause is the distortion of the vortex core induced by the particle and the consequent redistribution of vorticity. Further, since the particle undergoes rotational motion, a rotation-induced lift force, similar to the Magnus-type lift described in Bluemink et al. (Reference Bluemink, Lohse, Prosperetti and Van Wijngaarden2010), may also arise. These effects can introduce additional components to the force balance that would lead to a stable radial equilibrium position as seen in the experiments. However, accounting for these effects in the present scenario is challenging, since the particle’s presence within the vortex ring leads to significant, time-dependent deformations of both the core and the azimuthal axis of the ring, along with a dynamic redistribution of the core’s vorticity as shown later in § 4. This makes it difficult to have a straightforward analytical description of the forces involved.
$+{\rm d}r$
) would result in the particle being pushed even further away from its equilibrium position, which implies an unstable equilibrium. However, our experimental observations clearly show a stable radial (mean) equilibrium position, an outcome that cannot be explained if the simplified force formulation were entirely valid. This discrepancy suggests the presence of additional effects that would lead to modifications in the force expressions. A likely cause is the distortion of the vortex core induced by the particle and the consequent redistribution of vorticity. Further, since the particle undergoes rotational motion, a rotation-induced lift force, similar to the Magnus-type lift described in Bluemink et al. (Reference Bluemink, Lohse, Prosperetti and Van Wijngaarden2010), may also arise. These effects can introduce additional components to the force balance that would lead to a stable radial equilibrium position as seen in the experiments. However, accounting for these effects in the present scenario is challenging, since the particle’s presence within the vortex ring leads to significant, time-dependent deformations of both the core and the azimuthal axis of the ring, along with a dynamic redistribution of the core’s vorticity as shown later in § 4. This makes it difficult to have a straightforward analytical description of the forces involved.
Moving forward, it is useful to note a key difference between the particle motion and a bubble within a vortex. Unlike a particle, a bubble at a radial equilibrium location within the vortex core would undergo further elongation along the ring’s azimuthal axis and then break up (Jha & Govardhan Reference Jha and Govardhan2015), unlike a particle which, as in the present work, is seen to undergo radial oscillation, azimuthal translation and rotation about an axis parallel to the azimuthal axis. It can be noted that these comparisons between the present observations from the ring–particle interactions and the results on bubble–ring interactions from our previous studies (Jha & Govardhan Reference Jha and Govardhan2015; Biswas & Govardhan Reference Biswas and Govardhan2022, Reference Biswas and Govardhan2023) are made at similar particle (and/or bubble)-to-ring size ratios and ring Reynolds numbers. The range of Weber number ( $We=0.87\rho (\varGamma /{\pi }D_{c,o})^2/(\sigma /D_b)$
) in Biswas & Govardhan (Reference Biswas and Govardhan2023) was
$We=0.87\rho (\varGamma /{\pi }D_{c,o})^2/(\sigma /D_b)$
) in Biswas & Govardhan (Reference Biswas and Govardhan2023) was $We\approx$
10–500. Also to be noted is that both our present and previous studies were carried out in tap water, and thus the air (bubble)–liquid interface was effectively considered to correspond to the no-slip boundary condition due to the presence of impurities. This was verified from the drag measurements of a freely rising bubble in tap water, and then finding the drag coefficient to be matching those for contaminated water (rigid sphere) (Clift et al. Reference Clift, Grace and Weber1978; Takagi et al. Reference Takagi, Uda, Watanabe and Matsumoto2003) and very distinct from the drag on bubbles in clean water (Mei, Klausner & Lawrence Reference Mei, Klausner and Lawrence1994; Duineveld Reference Duineveld1995); this was discussed previously (Biswas & Govardhan Reference Biswas and Govardhan2022). Therefore, the boundary condition at the bubble–water interface was a no-slip one, like on a rigid sphere, and hence it is only the deformability and breakup of bubbles that induce differences in the interaction of the particle/bubble with the vortex ring.
$We\approx$
10–500. Also to be noted is that both our present and previous studies were carried out in tap water, and thus the air (bubble)–liquid interface was effectively considered to correspond to the no-slip boundary condition due to the presence of impurities. This was verified from the drag measurements of a freely rising bubble in tap water, and then finding the drag coefficient to be matching those for contaminated water (rigid sphere) (Clift et al. Reference Clift, Grace and Weber1978; Takagi et al. Reference Takagi, Uda, Watanabe and Matsumoto2003) and very distinct from the drag on bubbles in clean water (Mei, Klausner & Lawrence Reference Mei, Klausner and Lawrence1994; Duineveld Reference Duineveld1995); this was discussed previously (Biswas & Govardhan Reference Biswas and Govardhan2022). Therefore, the boundary condition at the bubble–water interface was a no-slip one, like on a rigid sphere, and hence it is only the deformability and breakup of bubbles that induce differences in the interaction of the particle/bubble with the vortex ring.
It is important to note that the offset plays a critical role in destabilising the vortex core, as implied by prior investigations for deforming bubbles within a vortex core (Rastello et al. Reference Rastello, Marié, Grosjean and Lance2009; Cihonski, Finn & Apte Reference Cihonski, Finn and Apte2013; Biswas & Govardhan Reference Biswas and Govardhan2023). An offset position results in a substantial reaction force on the core fluid and could potentially contribute to core destabilisation. A recent study by Biswas & Govardhan (Reference Biswas and Govardhan2023) reported that the bubble-induced reaction force on the vortex core fluid scales as $D_b^{1.58}$
. This scaling implies a significantly increasing reaction force in the present scenario as the particle size increases. These broad observations indicate that a particle size could lead to a substantial displacement of the vortex core fluid, disruption in the core streamlines and essentially distortion of the core structure, and these would lead to substantial deformations and fragmentation of the core, as we discuss in § 4.
$D_b^{1.58}$
. This scaling implies a significantly increasing reaction force in the present scenario as the particle size increases. These broad observations indicate that a particle size could lead to a substantial displacement of the vortex core fluid, disruption in the core streamlines and essentially distortion of the core structure, and these would lead to substantial deformations and fragmentation of the core, as we discuss in § 4.
3.2. Particle’s azimuthal translation within the ring
The particle within the vortex ring undergoes azimuthal translation due to the azimuthal pressure gradient, which is of the order of the pressure difference between the centre of the core and the surrounding medium, $\Delta P$
= 0.87
$\Delta P$
= 0.87 $\rho$
(
$\rho$
( ${\varGamma }/{\pi }D_{c,o})^2$
(Choi et al. Reference Choi, Hsiao, Chahine and Ceccio2009). The azimuthal pressure gradient is created due to the modifications in core vorticity created by the presence of the buoyant particle, similar to that for bubbles inside a vortex (Jha & Govardhan Reference Jha and Govardhan2015). We begin with figure 9(a,b) showing the instantaneous azimuthal location of the particle (
${\varGamma }/{\pi }D_{c,o})^2$
(Choi et al. Reference Choi, Hsiao, Chahine and Ceccio2009). The azimuthal pressure gradient is created due to the modifications in core vorticity created by the presence of the buoyant particle, similar to that for bubbles inside a vortex (Jha & Govardhan Reference Jha and Govardhan2015). We begin with figure 9(a,b) showing the instantaneous azimuthal location of the particle ( ${\theta }_{p}$
), with respect to its capture location (
${\theta }_{p}$
), with respect to its capture location ( ${\theta }_{capture}$
), for small-
${\theta }_{capture}$
), for small- $Re$
and large-
$Re$
and large- $Re$
cases. Also shown in figure 9(c,d) is the particle’s instantaneous modulus of azimuthal velocity (
$Re$
cases. Also shown in figure 9(c,d) is the particle’s instantaneous modulus of azimuthal velocity ( $u_{{\theta },p}$
) normalised by the ring’s initial convection speed (
$u_{{\theta },p}$
) normalised by the ring’s initial convection speed ( $u_{c,o}$
). In the present configuration, the azimuthal position where the particle is initially captured (
$u_{c,o}$
). In the present configuration, the azimuthal position where the particle is initially captured ( ${\theta }_{\it {capture}}$
) is used as a reference point. From this reference, the particle’s subsequent instantaneous azimuthal positions (
${\theta }_{\it {capture}}$
) is used as a reference point. From this reference, the particle’s subsequent instantaneous azimuthal positions ( ${\theta }_{\it {inst}}$
) are considered positive in the counterclockwise (CCW) direction and negative in the clockwise (CW) direction, as also illustrated in figure 10(a). We find that the particle’s range of azimuthal drift and the corresponding velocity could vary dramatically across particle sizes and
${\theta }_{\it {inst}}$
) are considered positive in the counterclockwise (CCW) direction and negative in the clockwise (CW) direction, as also illustrated in figure 10(a). We find that the particle’s range of azimuthal drift and the corresponding velocity could vary dramatically across particle sizes and $Re$
. For low-
$Re$
. For low- $Re$
(6000) interactions in figure 9(a,c), the particle’s translation within the ring is faster for a large particle. For example,
$Re$
(6000) interactions in figure 9(a,c), the particle’s translation within the ring is faster for a large particle. For example, $D_p/D_{c,o}$
of 1.67 shows that immediately after capture, the particle undergoes faster translation (and large-amplitude oscillations) as compared with the smaller
$D_p/D_{c,o}$
of 1.67 shows that immediately after capture, the particle undergoes faster translation (and large-amplitude oscillations) as compared with the smaller $D_p/D_{c,o}$
of 0.62, as noted in the shown particle’s position with time in figure 9(a). This is even clearer in figure 9(c), where we observe the larger particle’s translatory velocity (
$D_p/D_{c,o}$
of 0.62, as noted in the shown particle’s position with time in figure 9(a). This is even clearer in figure 9(c), where we observe the larger particle’s translatory velocity ( $u_{{\theta },p}/u_{c,o}$
) being much higher than that of the smaller particle. This higher
$u_{{\theta },p}/u_{c,o}$
) being much higher than that of the smaller particle. This higher $u_{{\theta },p}$
of the larger particle is likely due to the higher azimuthal pressure gradient caused by the dramatic modifications in the core vorticity. Also to be noted from figure 9(c) is that
$u_{{\theta },p}$
of the larger particle is likely due to the higher azimuthal pressure gradient caused by the dramatic modifications in the core vorticity. Also to be noted from figure 9(c) is that $u_{{\theta },p}$
is comparable with the ring’s convection speed (
$u_{{\theta },p}$
is comparable with the ring’s convection speed ( $u_{{\theta },p}/u_{c,o}\approx$
1), and could be even higher than the ring’s convection speed, as in figure 9(c(iii)) for the larger particle. In this case, the larger velocity and its fluctuations in
$u_{{\theta },p}/u_{c,o}\approx$
1), and could be even higher than the ring’s convection speed, as in figure 9(c(iii)) for the larger particle. In this case, the larger velocity and its fluctuations in $u_{{\theta },p}$
would possibly be due to the more dynamically changing core vorticity by the larger particle, hence causing a larger (fluctuating) pressure gradient azimuthally. In comparison with the larger particle, we find that the smaller particle (
$u_{{\theta },p}$
would possibly be due to the more dynamically changing core vorticity by the larger particle, hence causing a larger (fluctuating) pressure gradient azimuthally. In comparison with the larger particle, we find that the smaller particle ( $D_p/D_{c,o}$
= 0.62), immediately after capture, stays at (and around) the location of capture for a relatively longer time than the larger particle and then undergoes a comparatively slower azimuthal drift. Also to be noted is that during the translation, the smaller particle could change its direction of drift, as seen in figure 9(a). Such behaviour is usually found for relatively smaller to intermediate
$D_p/D_{c,o}$
= 0.62), immediately after capture, stays at (and around) the location of capture for a relatively longer time than the larger particle and then undergoes a comparatively slower azimuthal drift. Also to be noted is that during the translation, the smaller particle could change its direction of drift, as seen in figure 9(a). Such behaviour is usually found for relatively smaller to intermediate $D_p/D_{c,o}$
, whereas for larger ones, the drift is mostly seen to be unidirectional (azimuthally).
$D_p/D_{c,o}$
, whereas for larger ones, the drift is mostly seen to be unidirectional (azimuthally).
The instantaneous azimuthal location of the particle’s centre ( ${\theta }_{p}$
) with respect to the particle’s azimuthal capture location (
${\theta }_{p}$
) with respect to the particle’s azimuthal capture location ( ${\theta }_{capture}$
) is shown for a few particle sizes at (a) low and (b) large
${\theta }_{capture}$
) is shown for a few particle sizes at (a) low and (b) large $Re$
. The corresponding particle’s instantaneous azimuthal translatory velocity magnitude (
$Re$
. The corresponding particle’s instantaneous azimuthal translatory velocity magnitude ( $u_{{\theta },p}$
), normalised by the ring’s initial convection speed (
$u_{{\theta },p}$
), normalised by the ring’s initial convection speed ( $u_{c,o}$
), is shown at (c) low and (d) large
$u_{c,o}$
), is shown at (c) low and (d) large $Re$
. In the present configuration,
$Re$
. In the present configuration, $\theta$
is taken to be positive and negative along CCW and CW directions, respectively, with respect to
$\theta$
is taken to be positive and negative along CCW and CW directions, respectively, with respect to ${\theta }_{capture}$
, as also indicated in figure 10(a).
${\theta }_{capture}$
, as also indicated in figure 10(a).
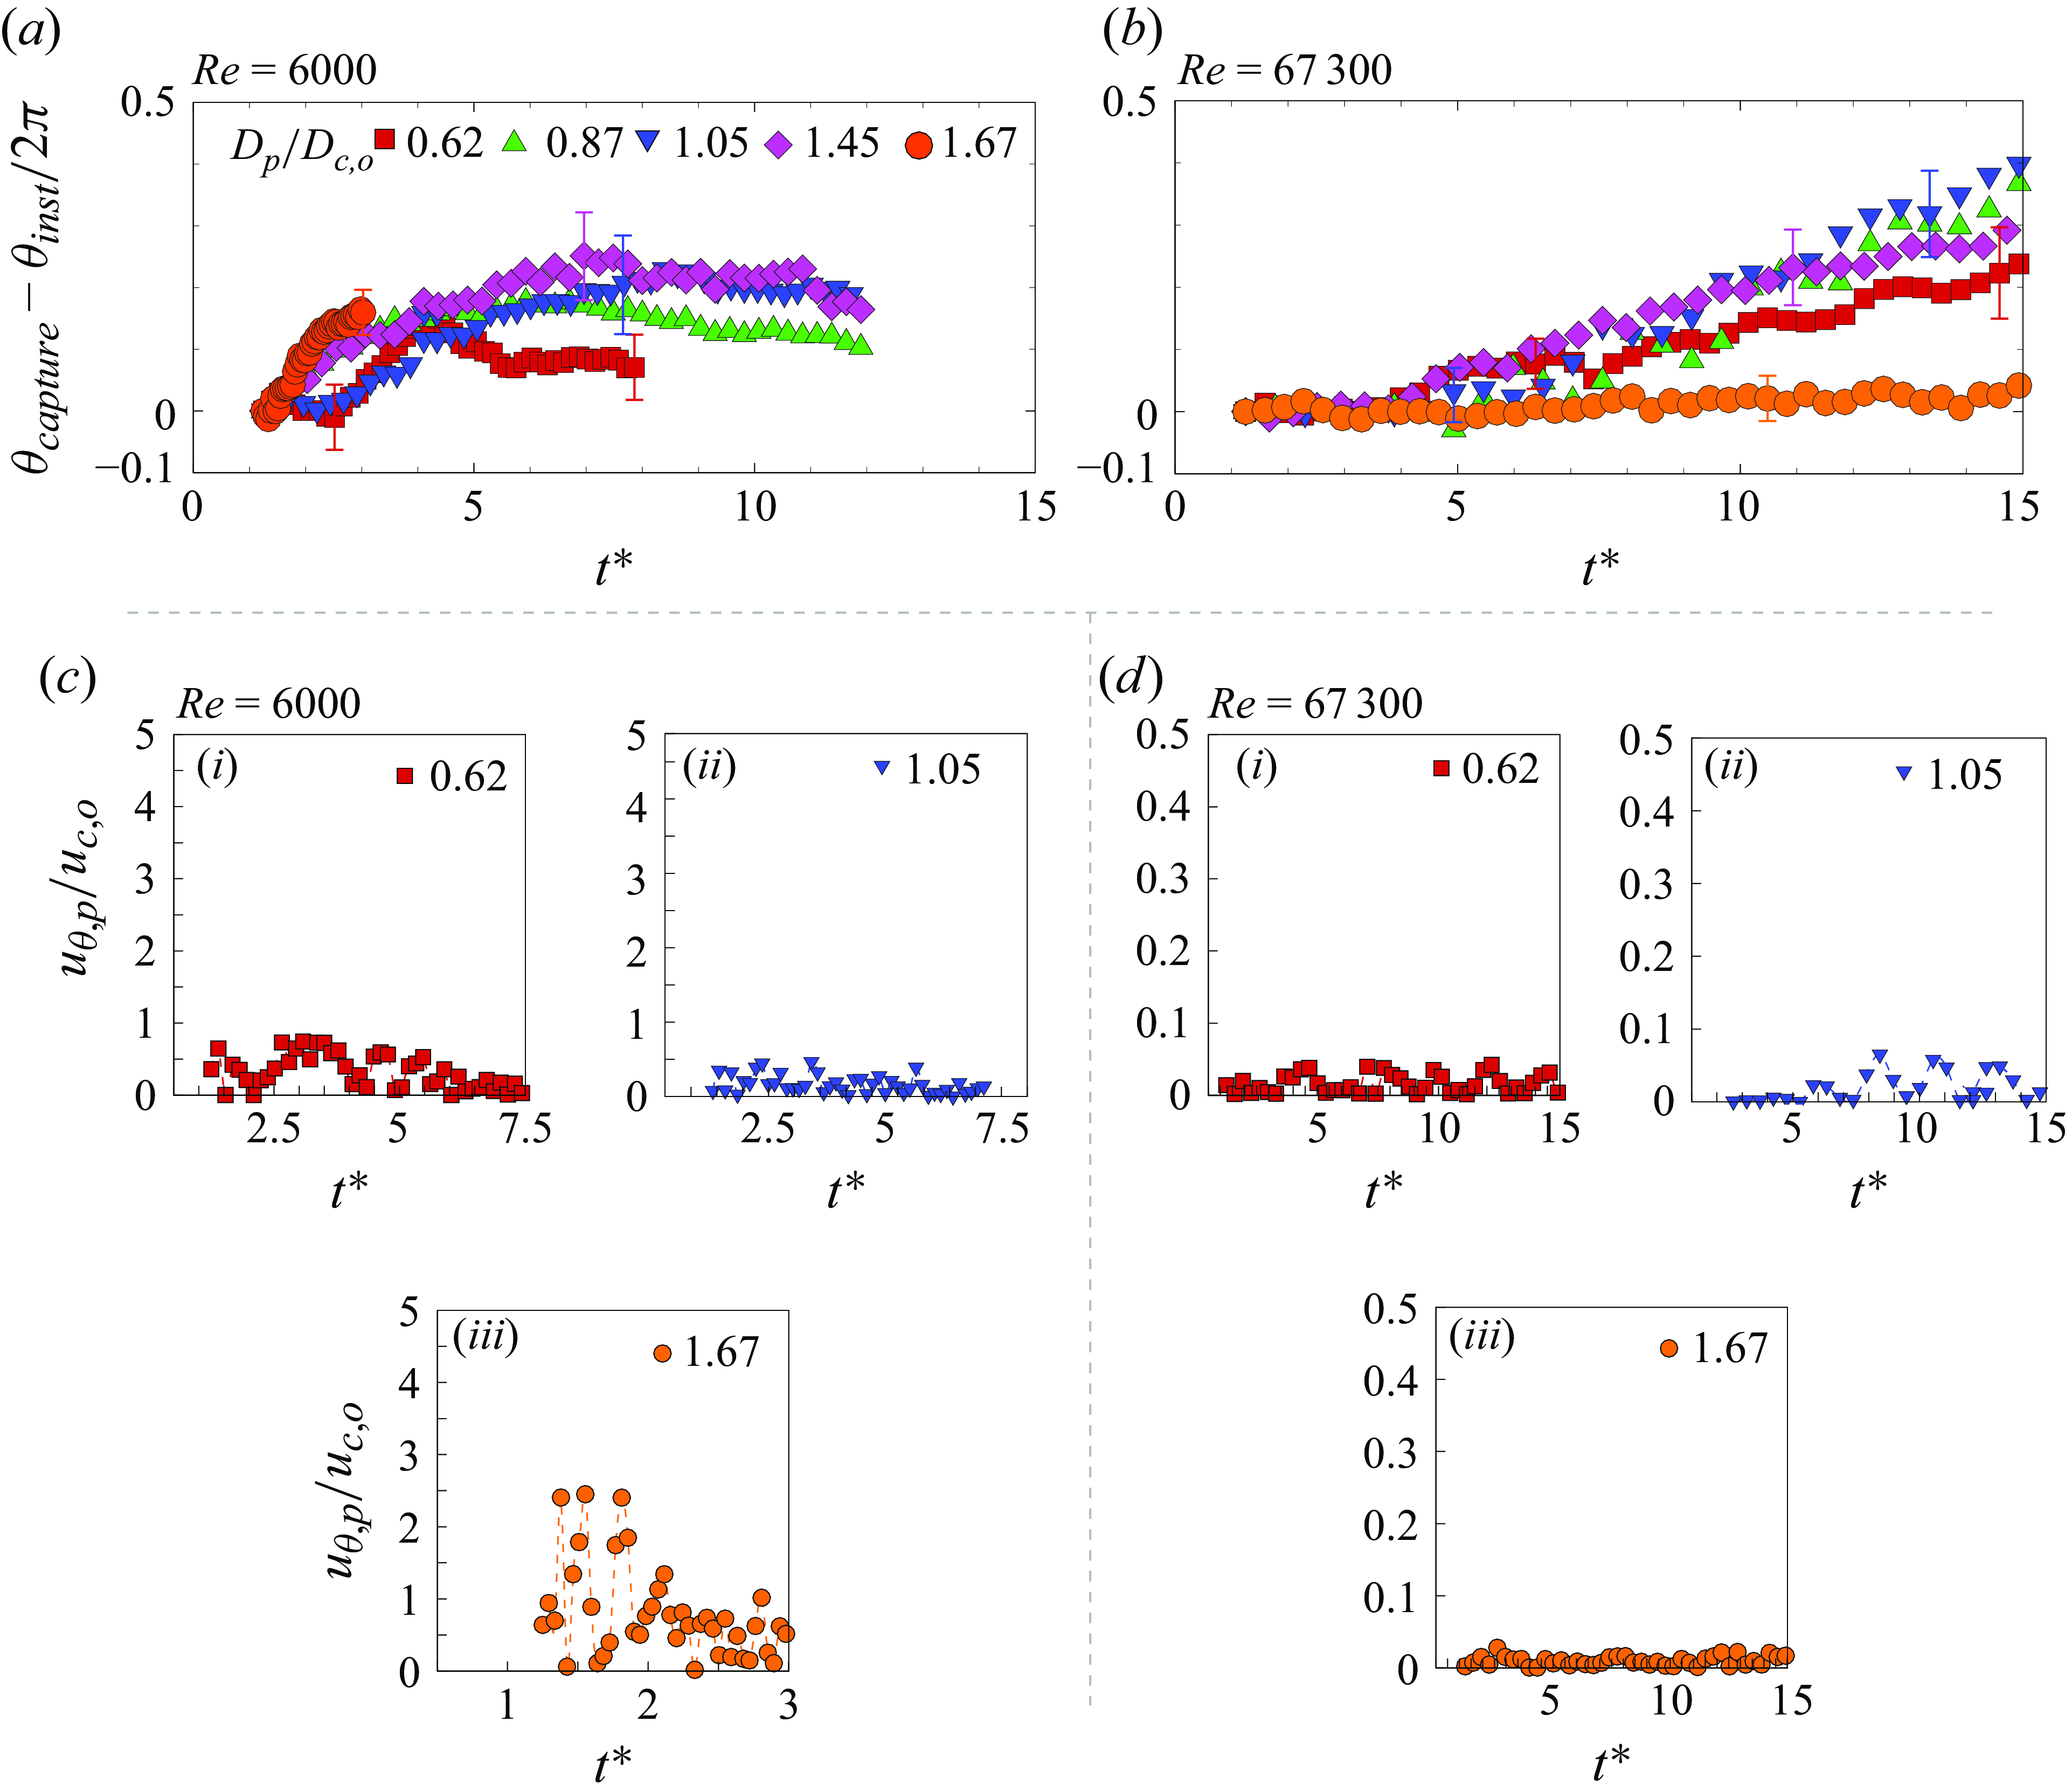
Schematics of the top view of a particle inside a vortex ring at two time instants of (a) $t^{\ast }_{1,c}$
and (b)
$t^{\ast }_{1,c}$
and (b) $t^{\ast }_2$
(here,
$t^{\ast }_2$
(here, $t^{\ast }_2 \gt t^{\ast }_{1,c}$
). The locations of the particle at these two time instants (
$t^{\ast }_2 \gt t^{\ast }_{1,c}$
). The locations of the particle at these two time instants ( $r_1$
,
$r_1$
, ${\theta }_1$
;
${\theta }_1$
; $r_2$
,
$r_2$
, ${\theta }_2$
) and the azimuthal pressure gradients acting on the particle along the positive
${\theta }_2$
) and the azimuthal pressure gradients acting on the particle along the positive $\theta$
and negative
$\theta$
and negative $\theta$
directions (
$\theta$
directions ( $\Delta P_{a,+{\theta }}$
,
$\Delta P_{a,+{\theta }}$
, $\Delta P_{a,-{\theta }}$
) are indicated in the figure. Also marked in (b) is the position of the particle at time
$\Delta P_{a,-{\theta }}$
) are indicated in the figure. Also marked in (b) is the position of the particle at time $t^{\ast }_{1,c}$
using a dashed circle.
$t^{\ast }_{1,c}$
using a dashed circle.
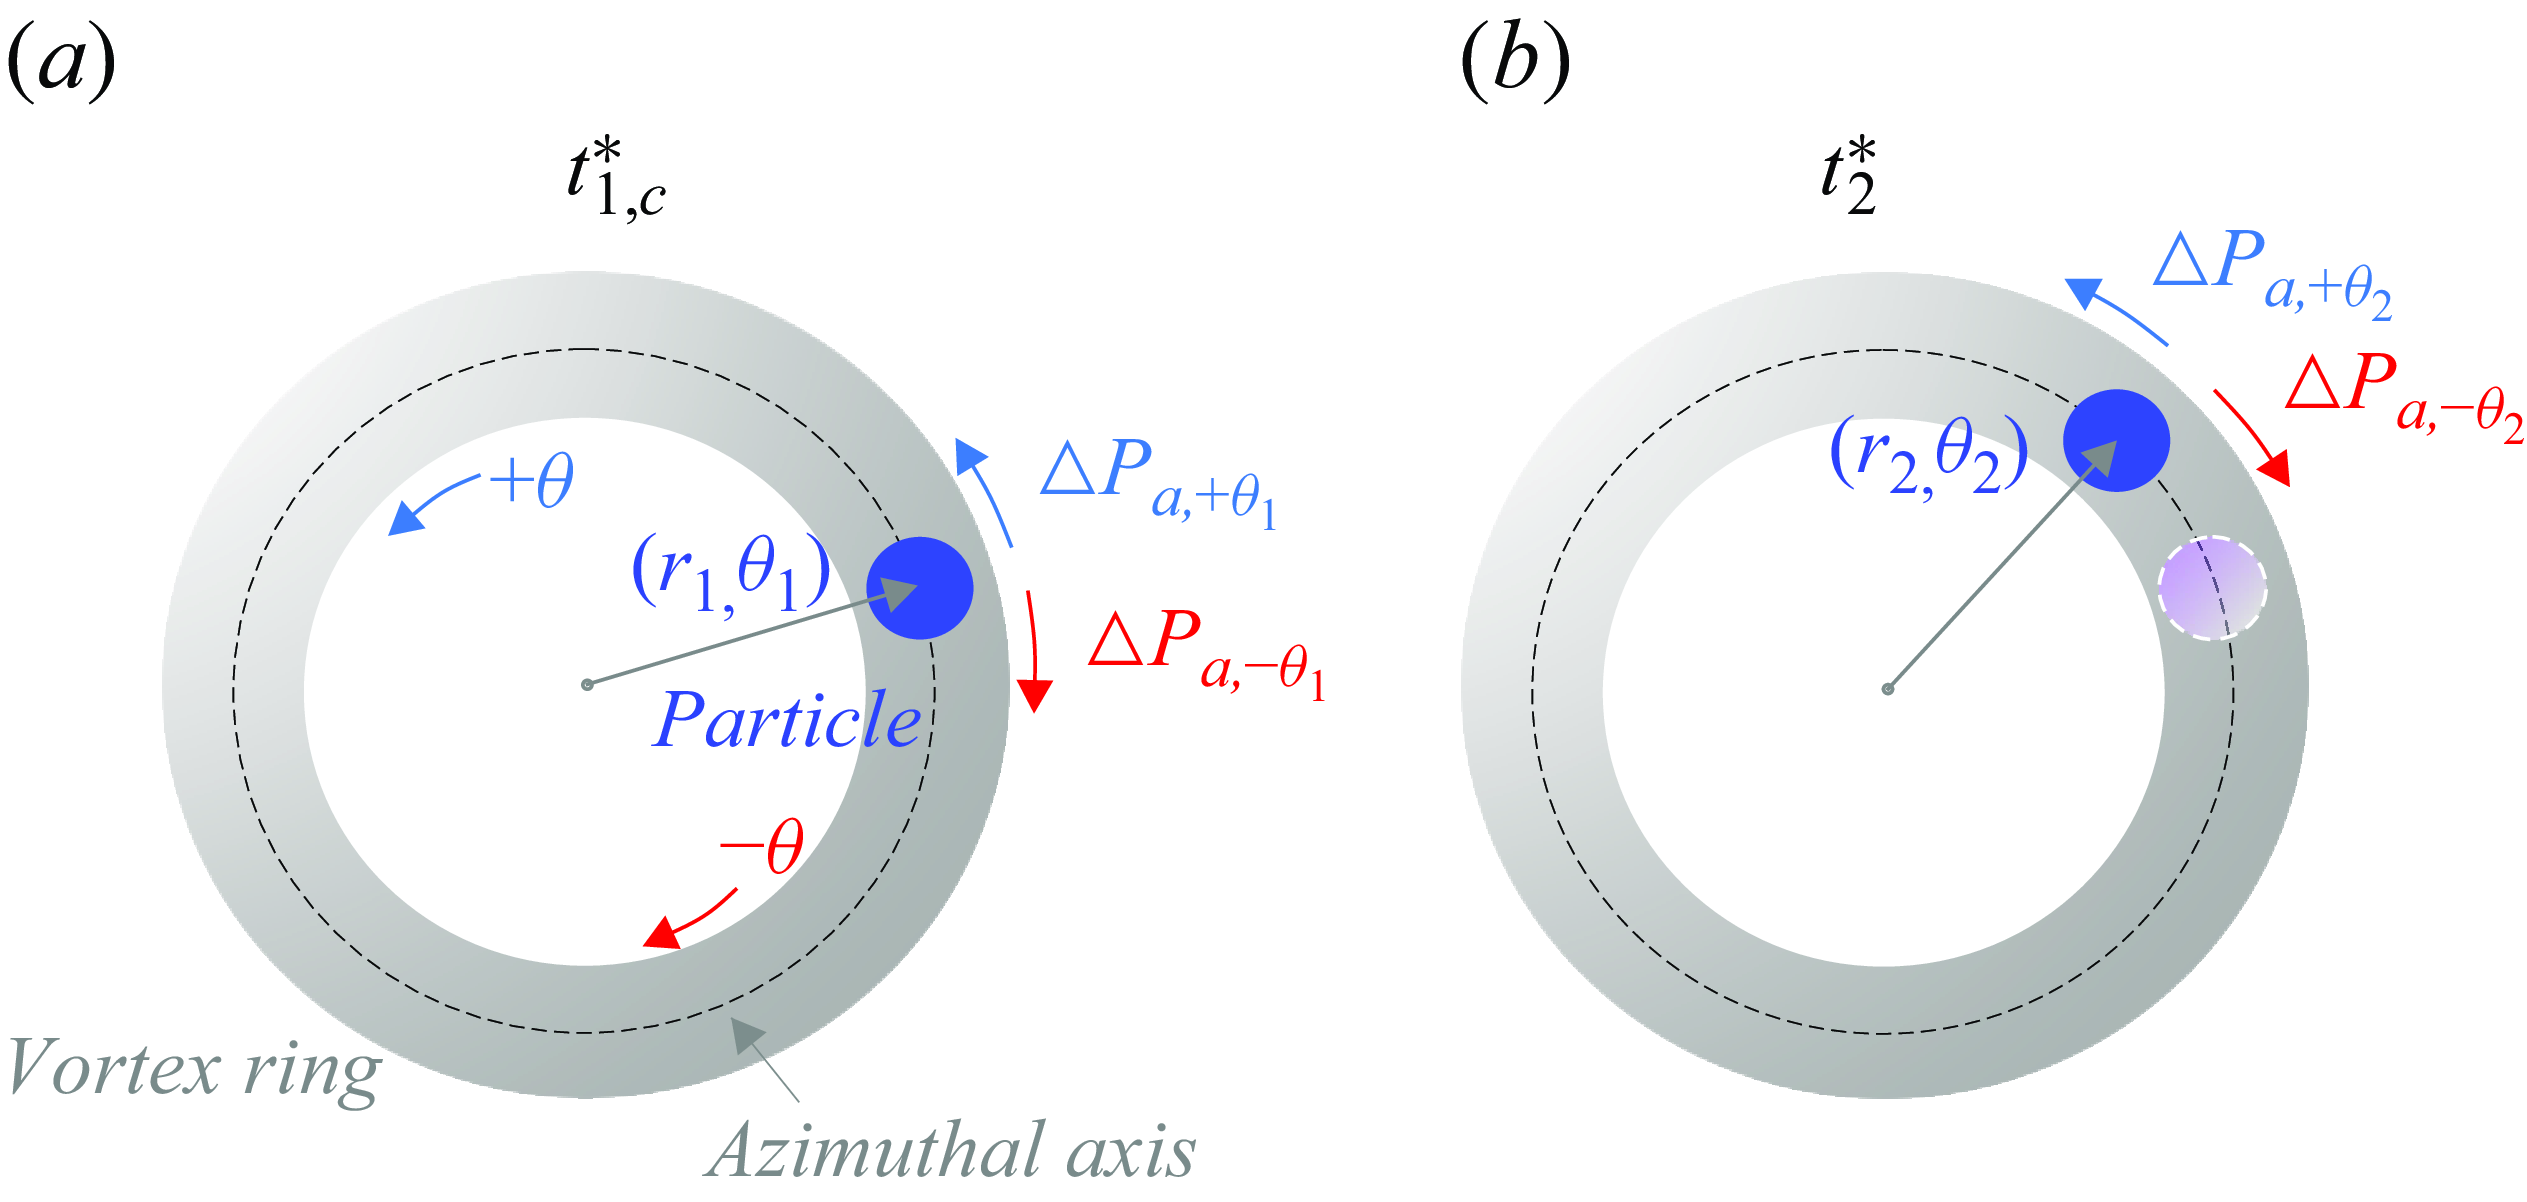
We now try to understand these differences across smaller and larger particles with the help of the schematic in figure 10 that shows a particle inside a vortex ring, seen from the top, at two time instants, $t^{\ast }_{1,c}$
and
$t^{\ast }_{1,c}$
and $t^{\ast }_2$
; here,
$t^{\ast }_2$
; here, $t^{\ast }_{1,c}$
corresponds to the time instant while the particle is at its capture location (immediately after its capture event), and the particle has moved azimuthally to a new capture position at time
$t^{\ast }_{1,c}$
corresponds to the time instant while the particle is at its capture location (immediately after its capture event), and the particle has moved azimuthally to a new capture position at time $t^{\ast }_2$
(
$t^{\ast }_2$
( $t^{\ast }_2 \gt t^{\ast }_{1,c}$
). In the present ring–particle system, the presence of the particle inside the vortex core leads to a drop in the peak vorticity and changes in the vorticity distribution, and these would be more dramatic closer to the particle’s azimuthal location compared with azimuthally further locations. This would create an azimuthal pressure gradient that would lead to a translatory motion of the particle along the ring’s azimuthal direction. Now, coming back to figure 10, while the particle is at the location of (
$t^{\ast }_2 \gt t^{\ast }_{1,c}$
). In the present ring–particle system, the presence of the particle inside the vortex core leads to a drop in the peak vorticity and changes in the vorticity distribution, and these would be more dramatic closer to the particle’s azimuthal location compared with azimuthally further locations. This would create an azimuthal pressure gradient that would lead to a translatory motion of the particle along the ring’s azimuthal direction. Now, coming back to figure 10, while the particle is at the location of ( $r_{1}$
,
$r_{1}$
, ${\theta }_{1}$
) at
${\theta }_{1}$
) at $t^{\ast }_{1,c}$
, the modifications of the core vorticity around the particle would lead to azimuthal pressure gradients in both positive
$t^{\ast }_{1,c}$
, the modifications of the core vorticity around the particle would lead to azimuthal pressure gradients in both positive $\theta$
(CCW) and negative
$\theta$
(CCW) and negative $\theta$
(CW) directions, which are indicated in the figure as
$\theta$
(CW) directions, which are indicated in the figure as $\Delta P_{a,+{\theta }_1}$
and
$\Delta P_{a,+{\theta }_1}$
and $\Delta P_{a,-{\theta }_1}$
, respectively. As time progresses, the particle experiences forces induced by the pressure gradients. Assuming
$\Delta P_{a,-{\theta }_1}$
, respectively. As time progresses, the particle experiences forces induced by the pressure gradients. Assuming $\Delta P_{a,+{\theta }_1}$ $\gt$
$\gt$ $\Delta P_{a,-{\theta }_1}$
, the particle drifts azimuthally in the positive
$\Delta P_{a,-{\theta }_1}$
, the particle drifts azimuthally in the positive $\theta$
direction, reaching a new position (
$\theta$
direction, reaching a new position ( $r_2$
,
$r_2$
, ${\theta }_2$
) at
${\theta }_2$
) at $t^{\ast }_2$
(in figure 10
b). Conversely, if
$t^{\ast }_2$
(in figure 10
b). Conversely, if $\Delta P_{a,-{\theta }_1}$ $\gt$
$\gt$ $\Delta P_{a,+{\theta }_1}$
, the particle would have drifted azimuthally in the negative
$\Delta P_{a,+{\theta }_1}$
, the particle would have drifted azimuthally in the negative $\theta$
direction. The difference between
$\theta$
direction. The difference between $\Delta P_{a,+{\theta }_1}$
and
$\Delta P_{a,+{\theta }_1}$
and $\Delta P_{a,-{\theta }_1}$
can arise from several factors. For instance, the initial perturbation caused by the particle may create asymmetric disturbances on either side of the particle (azimuthally), thereby altering the local pressure gradients. Additionally, the particle may slightly unevenly tilt or bend the vortex during its capture, leading to differential vortex stretching on either side. This asymmetry can produce unequal pressure forces, resulting in distinct values for
$\Delta P_{a,-{\theta }_1}$
can arise from several factors. For instance, the initial perturbation caused by the particle may create asymmetric disturbances on either side of the particle (azimuthally), thereby altering the local pressure gradients. Additionally, the particle may slightly unevenly tilt or bend the vortex during its capture, leading to differential vortex stretching on either side. This asymmetry can produce unequal pressure forces, resulting in distinct values for $\Delta P_{a,+{\theta }_1}$
and
$\Delta P_{a,+{\theta }_1}$
and $\Delta P_{a,-{\theta }_1}$
. These factors ultimately determine whether the particle initially drifts CCW (+
$\Delta P_{a,-{\theta }_1}$
. These factors ultimately determine whether the particle initially drifts CCW (+ $\theta$
) or CW (
$\theta$
) or CW ( $-\theta$
) relative to the capture position. However, as may be expected, for a given particle-to-vortex core diameter ratio (
$-\theta$
) relative to the capture position. However, as may be expected, for a given particle-to-vortex core diameter ratio ( $D_p/D_{c,o}$
) and ring Reynolds number (
$D_p/D_{c,o}$
) and ring Reynolds number ( $Re$
), the overall characteristics of the particle’s drift (such as drift velocity and azimuthal drift distance), as well as its impact on the ring’s dynamics, are unaffected by the initial direction of drift (CCW or CW).
$Re$
), the overall characteristics of the particle’s drift (such as drift velocity and azimuthal drift distance), as well as its impact on the ring’s dynamics, are unaffected by the initial direction of drift (CCW or CW).
Now, while the particle translated to the new position in the time period between $t^{\ast }_{1,c}$
and
$t^{\ast }_{1,c}$
and $t^{\ast }_2$
, in the case of a larger particle, the disruptions in the core vorticity along the path that the particle followed would be substantial, and the modified core vorticity would take a relatively longer time to recover, or even not recover in the case of very large particles, as discussed in § 4.3. As a result, while the particle is at (
$t^{\ast }_2$
, in the case of a larger particle, the disruptions in the core vorticity along the path that the particle followed would be substantial, and the modified core vorticity would take a relatively longer time to recover, or even not recover in the case of very large particles, as discussed in § 4.3. As a result, while the particle is at ( $r_2$
,
$r_2$
, ${\theta }_2$
), the azimuthal pressure gradient created between the particle’s location (
${\theta }_2$
), the azimuthal pressure gradient created between the particle’s location ( $r_2$
,
$r_2$
, ${\theta }_2$
) and the negative
${\theta }_2$
) and the negative $\theta$
direction,
$\theta$
direction, $\Delta P_{a,-{\theta }_2}$
, would be expected to be smaller than
$\Delta P_{a,-{\theta }_2}$
, would be expected to be smaller than $\Delta P_{a,+{\theta }_2}$
. As a result of these two acting in opposite directions, the particle would be expected to continue a unidirectional drift along positive
$\Delta P_{a,+{\theta }_2}$
. As a result of these two acting in opposite directions, the particle would be expected to continue a unidirectional drift along positive $\theta$
, moving forward from time
$\theta$
, moving forward from time $t^{\ast }_2$
. On the other hand, in the case of a smaller particle, while the particle translated to the new position in the time period between
$t^{\ast }_2$
. On the other hand, in the case of a smaller particle, while the particle translated to the new position in the time period between $t^{\ast }_{1,c}$
and
$t^{\ast }_{1,c}$
and $t^{\ast }_2$
, since it leads to a lesser disruption of the core vorticity along the particle path, the effects would be expected to last for a relatively shorter time, and the core vorticity could be regained for the smaller particles. This would possibly result in a similar
$t^{\ast }_2$
, since it leads to a lesser disruption of the core vorticity along the particle path, the effects would be expected to last for a relatively shorter time, and the core vorticity could be regained for the smaller particles. This would possibly result in a similar $\Delta P_{a,+{\theta }_2}$
and
$\Delta P_{a,+{\theta }_2}$
and $\Delta P_{a,-{\theta }_2}$
, or even a larger
$\Delta P_{a,-{\theta }_2}$
, or even a larger $\Delta P_{a,-{\theta }_2}$
in some cases. In such cases, there would be a chance of the particle drifting back along negative
$\Delta P_{a,-{\theta }_2}$
in some cases. In such cases, there would be a chance of the particle drifting back along negative $\theta$
. Such trends are observed in figure 9(a) for a smaller particle at
$\theta$
. Such trends are observed in figure 9(a) for a smaller particle at $D_p/D_{c,o}$
of 0.62. It may be noted that modifications in the core vorticity due to the presence of different particle sizes are discussed in detail in § 4.3.
$D_p/D_{c,o}$
of 0.62. It may be noted that modifications in the core vorticity due to the presence of different particle sizes are discussed in detail in § 4.3.
In comparison with the low- $Re$
cases, the particle’s azimuthal drift could be quite different at larger
$Re$
cases, the particle’s azimuthal drift could be quite different at larger $Re$
. As we can see in figure 9(b), the larger particle stays broadly around its capture locations (
$Re$
. As we can see in figure 9(b), the larger particle stays broadly around its capture locations ( ${\theta }_{p}-{\theta }_{capture}\approx$
0), with some minor fluctuations in its position, while the smaller particle undergoes azimuthal translation. Also noted is that for all particle sizes, the drift velocity is much smaller than the ring’s (initial) convection speed (
${\theta }_{p}-{\theta }_{capture}\approx$
0), with some minor fluctuations in its position, while the smaller particle undergoes azimuthal translation. Also noted is that for all particle sizes, the drift velocity is much smaller than the ring’s (initial) convection speed ( $u_{{\theta },p}\ll u_{c,o}$
), unlike the low-
$u_{{\theta },p}\ll u_{c,o}$
), unlike the low- $Re$
cases. As discussed before, one would expect that a bigger particle would lead to larger modifications in the core vorticity, leading to a higher azimuthal pressure differences and, hence, would be expected it to undergo more extensive azimuthal translation. However, as we see in the next section, at high
$Re$
cases. As discussed before, one would expect that a bigger particle would lead to larger modifications in the core vorticity, leading to a higher azimuthal pressure differences and, hence, would be expected it to undergo more extensive azimuthal translation. However, as we see in the next section, at high $Re$
, a particle causes minimal and slower disruption to the vortex core compared with low
$Re$
, a particle causes minimal and slower disruption to the vortex core compared with low $Re$
. Hence, the changes in vorticity distribution within the core are much smaller for the higher-
$Re$
. Hence, the changes in vorticity distribution within the core are much smaller for the higher- $Re$
rings compared to the lower-
$Re$
rings compared to the lower- $Re$
ring. As a result, the azimuthal pressure gradient on either side of the particle’s location is expected to exhibit minimal differences at large
$Re$
ring. As a result, the azimuthal pressure gradient on either side of the particle’s location is expected to exhibit minimal differences at large $Re$
. Now, for the particle to move azimuthally, the resistance it experiences must be smaller than the pressure difference resulting from the azimuthal pressure gradient on either side of the particle (
$Re$
. Now, for the particle to move azimuthally, the resistance it experiences must be smaller than the pressure difference resulting from the azimuthal pressure gradient on either side of the particle ( $\Delta P_{a,+{\theta }}$
and
$\Delta P_{a,+{\theta }}$
and $\Delta P_{a,-{\theta }}$
). A larger particle would experience higher resistance due to higher added mass and a larger drag force (Oweis et al. Reference Oweis, Van der Hout, Iyer, Tryggvason and Ceccio2005; Bluemink et al. Reference Bluemink, Lohse, Prosperetti and Van Wijngaarden2010), and hence would be less likely to drift azimuthally (as seen in figure 9
b) and remain around its capture location. In contrast, a smaller particle, since it would experience a lesser resistance, would be more likely to drift azimuthally. It may be noted that even though we are unable to estimate these from the present measurements, the broad observations from the particle’s motion and the modifications of the core vorticity seen from the two-dimensional time-resolved PIV measurements indicate that as a result of the combined effect of these factors, a larger particle would undergo a relatively smaller translation in the case of higher-
$\Delta P_{a,-{\theta }}$
). A larger particle would experience higher resistance due to higher added mass and a larger drag force (Oweis et al. Reference Oweis, Van der Hout, Iyer, Tryggvason and Ceccio2005; Bluemink et al. Reference Bluemink, Lohse, Prosperetti and Van Wijngaarden2010), and hence would be less likely to drift azimuthally (as seen in figure 9
b) and remain around its capture location. In contrast, a smaller particle, since it would experience a lesser resistance, would be more likely to drift azimuthally. It may be noted that even though we are unable to estimate these from the present measurements, the broad observations from the particle’s motion and the modifications of the core vorticity seen from the two-dimensional time-resolved PIV measurements indicate that as a result of the combined effect of these factors, a larger particle would undergo a relatively smaller translation in the case of higher- $Re$
rings as compared with smaller particles. It is worth noting that a detailed measurement of the three-dimensional flow field would provide further insights into these mechanisms governing the complex azimuthal motion of the particles. We discuss in § 4 how these differences in particle motion for varying particle sizes and ring
$Re$
rings as compared with smaller particles. It is worth noting that a detailed measurement of the three-dimensional flow field would provide further insights into these mechanisms governing the complex azimuthal motion of the particles. We discuss in § 4 how these differences in particle motion for varying particle sizes and ring $Re$
profoundly impact the time evolution of the vortex ring.
$Re$
profoundly impact the time evolution of the vortex ring.
3.3. Particle rotation within the ring
We now discuss the particle spin inside the vortex core, as illustrated in figure 1(b). In the present investigations, the particle, post-capture, is seen to rotate about an axis that passes through its centre, and is parallel to the ring’s azimuthal axis and perpendicular to the line joining the centre of the particle and ring. The buoyant particle was marked with different patterns, for quantifying its rate of rotation, from the top-view and side-view imaging of the particle motion inside the vortex ring. In figure 11, the instantaneous rate of rotation of the particle ( ${\varOmega }_{p}$
) normalised by the average angular rotation of the unperturbed core, i.e. mean vorticity/2 (without the particle),
${\varOmega }_{p}$
) normalised by the average angular rotation of the unperturbed core, i.e. mean vorticity/2 (without the particle), ${\varOmega }_{core}$
, is shown with time (
${\varOmega }_{core}$
, is shown with time ( $tu_{co}/D_o$
), for varying particle size. We notice a reduction in
$tu_{co}/D_o$
), for varying particle size. We notice a reduction in ${\varOmega }_{p}$
/
${\varOmega }_{p}$
/ ${\varOmega }_{core}$
with time, and this is possibly due to the modified core vorticity and/or weakening of the core from the presence of the particle within the ring. This reduction in
${\varOmega }_{core}$
with time, and this is possibly due to the modified core vorticity and/or weakening of the core from the presence of the particle within the ring. This reduction in ${\varOmega }_{p}$
/
${\varOmega }_{p}$
/ ${\varOmega }_{core}$
would have implications, such as a smaller rotation-induced lift on the particle (Bluemink et al. Reference Bluemink, Lohse, Prosperetti and Van Wijngaarden2010), which would result in a lower particle offset from the core at later times, as seen in figure 7.
${\varOmega }_{core}$
would have implications, such as a smaller rotation-induced lift on the particle (Bluemink et al. Reference Bluemink, Lohse, Prosperetti and Van Wijngaarden2010), which would result in a lower particle offset from the core at later times, as seen in figure 7.
The rate of rotation of the particle ( ${\varOmega }_p$
), normalised by the average angular rotation of the unperturbed vortex core before the particle’s capture (
${\varOmega }_p$
), normalised by the average angular rotation of the unperturbed vortex core before the particle’s capture ( ${\varOmega }_{core}$
), is shown for different particle sizes at (a)
${\varOmega }_{core}$
), is shown for different particle sizes at (a) $Re$
= 6000 and (b)
$Re$
= 6000 and (b) $Re$
= 67 300. Also shown are the least-squares exponential curve fits from the experiments.
$Re$
= 67 300. Also shown are the least-squares exponential curve fits from the experiments.
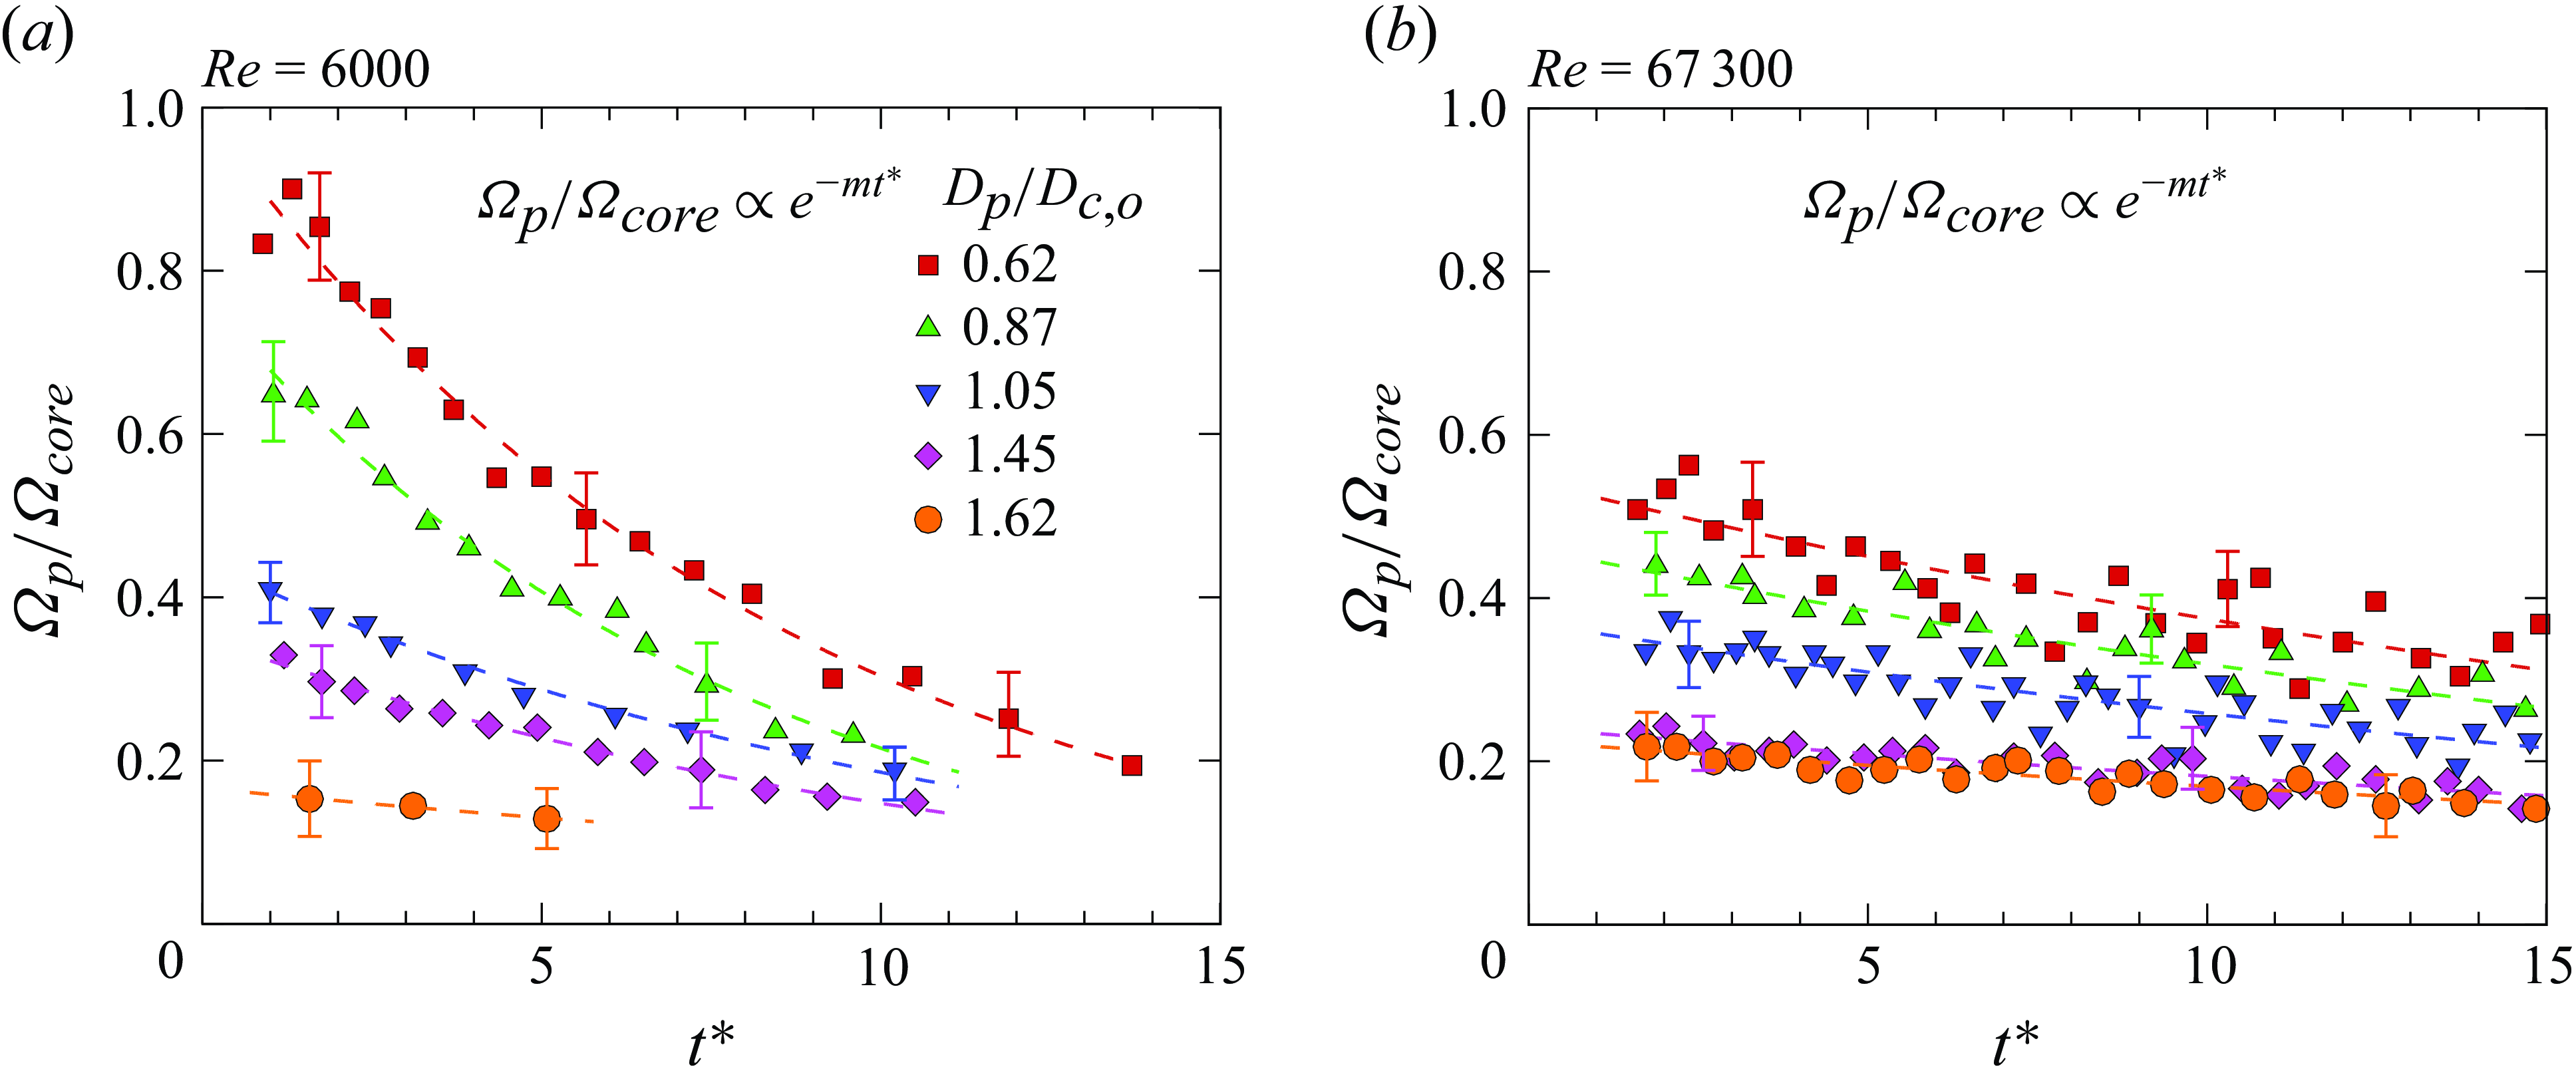
At each of the $Re$
cases shown (6000 and 67 300), we find
$Re$
cases shown (6000 and 67 300), we find ${\varOmega }_{p}$
/
${\varOmega }_{p}$
/ ${\varOmega }_{core}$
being larger for lower
${\varOmega }_{core}$
being larger for lower $D_p/D_{c,o}$
and reduces with increasing particle size. This would likely be due to the larger weakening of the vortex core with increasing particle size, and the related redistribution of the core vorticity over a larger area with the resultant larger drop in the core peak vorticity, as seen in figure 3. One may note that in this low-Reynolds-number (
$D_p/D_{c,o}$
and reduces with increasing particle size. This would likely be due to the larger weakening of the vortex core with increasing particle size, and the related redistribution of the core vorticity over a larger area with the resultant larger drop in the core peak vorticity, as seen in figure 3. One may note that in this low-Reynolds-number ( $Re$
= 6000) case, the scaling for the reduction in the normalised rotation with time varies as
$Re$
= 6000) case, the scaling for the reduction in the normalised rotation with time varies as ${\varOmega }_{p}/{\varOmega }_{core} \propto {\rm e}^{-mt^{\ast }}$
, where
${\varOmega }_{p}/{\varOmega }_{core} \propto {\rm e}^{-mt^{\ast }}$
, where $m$
obtained from the least-squares exponential curve fit (
$m$
obtained from the least-squares exponential curve fit ( $R^2\gt 0.94$
) depends on
$R^2\gt 0.94$
) depends on $D_p/D_{c,o}$
, and is shown in table 4. We find from the table that this exponent
$D_p/D_{c,o}$
, and is shown in table 4. We find from the table that this exponent $m$
varies considerably with particle size with a scaling of
$m$
varies considerably with particle size with a scaling of $\propto (D_p/D_{c,o})^{0.7}$
. The present observation on the reduction in
$\propto (D_p/D_{c,o})^{0.7}$
. The present observation on the reduction in ${\varOmega }_{p}$
/
${\varOmega }_{p}$
/ ${\varOmega }_{core}$
with increasing particle size is reminiscent of slower particle rotation rate in cases of larger particle-to-eddy sizes in particle-laden turbulent flows (Bellani et al. Reference Bellani, Byron, Collignon, Meyer and Variano2012). Also to be noted is that the observations showing the particle’s rotational rate being lower than the core are also in line with the fact that an eddy cannot impart a larger rotational rate to a particle that has size similar or larger than the eddy (Wang, Sierakowski & Prosperetti Reference Wang, Sierakowski and Prosperetti2019).
${\varOmega }_{core}$
with increasing particle size is reminiscent of slower particle rotation rate in cases of larger particle-to-eddy sizes in particle-laden turbulent flows (Bellani et al. Reference Bellani, Byron, Collignon, Meyer and Variano2012). Also to be noted is that the observations showing the particle’s rotational rate being lower than the core are also in line with the fact that an eddy cannot impart a larger rotational rate to a particle that has size similar or larger than the eddy (Wang, Sierakowski & Prosperetti Reference Wang, Sierakowski and Prosperetti2019).
The exponents ( $m$
) corresponding to
$m$
) corresponding to $Re$
of 6000 and 67 300.
$Re$
of 6000 and 67 300.
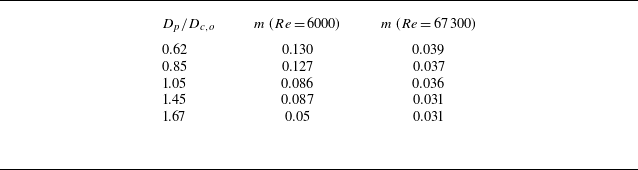
For the larger $Re$
of 67 300 in figure 11(b), the broad trends of the reductions in
$Re$
of 67 300 in figure 11(b), the broad trends of the reductions in ${\varOmega }_{p}$
/
${\varOmega }_{p}$
/ ${\varOmega }_{core}$
with increasing particle size are seen to be similar to that for the lower
${\varOmega }_{core}$
with increasing particle size are seen to be similar to that for the lower $Re$
of 6000 (figure 11
a). However, the reduction in
$Re$
of 6000 (figure 11
a). However, the reduction in ${\varOmega }_{p}$
/
${\varOmega }_{p}$
/ ${\varOmega }_{core}$
with time is relatively slower than for the lower-
${\varOmega }_{core}$
with time is relatively slower than for the lower- $Re$
cases, which is also noted in the scaling
$Re$
cases, which is also noted in the scaling ${\varOmega }_{p}$
/
${\varOmega }_{p}$
/ ${\varOmega }_{core} \propto {\rm e}^{-mt^{\ast }}$
, where much smaller changes in the exponent (
${\varOmega }_{core} \propto {\rm e}^{-mt^{\ast }}$
, where much smaller changes in the exponent ( $m$
) across different particle sizes are seen for this large
$m$
) across different particle sizes are seen for this large $Re$
(here,
$Re$
(here, $m \propto (D_p/D_{c,o})^{0.3}$
), unlike the low-
$m \propto (D_p/D_{c,o})^{0.3}$
), unlike the low- $Re$
case, as seen from table 4. Another point to note is the lower
$Re$
case, as seen from table 4. Another point to note is the lower ${\varOmega }_{p}$
/
${\varOmega }_{p}$
/ ${\varOmega }_{core}$
at large
${\varOmega }_{core}$
at large $Re$
, compared with the small
$Re$
, compared with the small $Re$
. To understand this, one can note that the vortex core strength-based time scale,
$Re$
. To understand this, one can note that the vortex core strength-based time scale, $t_p$
, is proportional to
$t_p$
, is proportional to $1/\varGamma$
(here,
$1/\varGamma$
(here, $t_p=0.87{\rho }{\varGamma }/(\Delta P\pi )={\pi }D_{c,o}^2/\varGamma$
(Jha & Govardhan Reference Jha and Govardhan2015)), and with increasing
$t_p=0.87{\rho }{\varGamma }/(\Delta P\pi )={\pi }D_{c,o}^2/\varGamma$
(Jha & Govardhan Reference Jha and Govardhan2015)), and with increasing $\varGamma$
(equivalently, increased
$\varGamma$
(equivalently, increased $Re$
),
$Re$
), $t_p$
is seen to reduce more than the reduction in the corresponding particle rotation time scale. This, in turn, appears in figure 11(b) as a slower rotation rate at larger
$t_p$
is seen to reduce more than the reduction in the corresponding particle rotation time scale. This, in turn, appears in figure 11(b) as a slower rotation rate at larger $Re$
interactions. To be noted is that the differences in
$Re$
interactions. To be noted is that the differences in ${\varOmega }_{p}$
/
${\varOmega }_{p}$
/ ${\varOmega }_{core}$
across the small and large
${\varOmega }_{core}$
across the small and large $Re$
are not very pronounced at larger
$Re$
are not very pronounced at larger $D_p/D_{c,o}$
, and this would possibly be due to the more dramatic modifications in the core vorticity by a larger particle, in both
$D_p/D_{c,o}$
, and this would possibly be due to the more dramatic modifications in the core vorticity by a larger particle, in both $Re$
cases. It may also be noted that at much later times, the particle would be expected to tend to zero rotational speed. This is due to the fact that the vortex core undergoes viscous diffusion, with the core gradually diffusing out, leading to reduced torques on the particle. In addition, the presence of the particle would further weaken the vortex core faster (than a base ring) as we discuss in detail in § 4, and, hence, would leave no driving torque for sustained particle rotation. However, the time taken to reach this state would depend on
$Re$
cases. It may also be noted that at much later times, the particle would be expected to tend to zero rotational speed. This is due to the fact that the vortex core undergoes viscous diffusion, with the core gradually diffusing out, leading to reduced torques on the particle. In addition, the presence of the particle would further weaken the vortex core faster (than a base ring) as we discuss in detail in § 4, and, hence, would leave no driving torque for sustained particle rotation. However, the time taken to reach this state would depend on $D_p/D_{c,o}$
and the ring
$D_p/D_{c,o}$
and the ring $Re$
. In connection with the present observations, it may be noted that previous studies (e.g. Bagchi & Balachandar Reference Bagchi and Balachandar2002a,Reference Bagchi and Balachandar
b) reported in a shear flow a slower rotation of a freely rotating particle than the ambient fluid, which is broadly in line with the present observations (
$Re$
. In connection with the present observations, it may be noted that previous studies (e.g. Bagchi & Balachandar Reference Bagchi and Balachandar2002a,Reference Bagchi and Balachandar
b) reported in a shear flow a slower rotation of a freely rotating particle than the ambient fluid, which is broadly in line with the present observations ( ${\varOmega }_{p} \lt {\varOmega }_{core}$
). On the other hand, contrary to the present observations, relatively recent studies (Bluemink et al. Reference Bluemink, Lohse, Prosperetti and Van Wijngaarden2008, Reference Bluemink, Lohse, Prosperetti and Van Wijngaarden2010) on a rotating buoyant spherical particle inside a solid body-like rotating flow reported a larger particle rotation than the mean rotation of the flow, unlike the present study. This difference is likely due to a number of differences between the present configuration and theirs. For example, presently, the particle size is of the order of that of the core, unlike theirs, which has a much smaller particle than the flow length scale. In addition, unlike theirs, the present vortex ring decays with time since the particle has dramatic effects, modifying the core peak vorticity and distribution, as we discuss later.
${\varOmega }_{p} \lt {\varOmega }_{core}$
). On the other hand, contrary to the present observations, relatively recent studies (Bluemink et al. Reference Bluemink, Lohse, Prosperetti and Van Wijngaarden2008, Reference Bluemink, Lohse, Prosperetti and Van Wijngaarden2010) on a rotating buoyant spherical particle inside a solid body-like rotating flow reported a larger particle rotation than the mean rotation of the flow, unlike the present study. This difference is likely due to a number of differences between the present configuration and theirs. For example, presently, the particle size is of the order of that of the core, unlike theirs, which has a much smaller particle than the flow length scale. In addition, unlike theirs, the present vortex ring decays with time since the particle has dramatic effects, modifying the core peak vorticity and distribution, as we discuss later.
One can note that the rotation of particles is important since it would have several implications; for example, it would influence the hydrodynamics forces, especially lift forces (Rubinow & Keller Reference Rubinow and Keller1961; Dennis, Singh & Ingham Reference Dennis, Singh and Ingham1980; Auton Reference Auton1987; Oesterlé & Dinh Reference Oesterlé and Dinh1998; Bagchi & Kim & Choi Reference Kim and Choi2002; Balachandar Reference Bagchi and Balachandar2002b), which essentially would have influences on aspects such as the preferential concentration of the particles in particle-laden flows (Balachandar & Eaton Reference Balachandar and Eaton2010; Brandt & Coletti Reference Brandt and Coletti2022). Additionally, the rotation of particles could also lead to turbulence attenuation (Mathai et al. Reference Mathai, Lohse and Sun2020; Yousefi, Ardekani & Brandt Reference Yousefi, Niazi Ardekani and Brandt2020), by means of a number of mechanisms, such as the modifications caused by it to the flow field, and also as the rotational energy of the particles has to be extracted from the energy of the flow (Balachandar & Eaton Reference Balachandar and Eaton2010). In the present context of ring–particle interactions, in addition to the modified core vorticity caused by the particle, another aspect of interest would be the energy spent on the particle rotation ( $E_P$
), which is essentially extracted from the vortex ring’s energy. We estimate
$E_P$
), which is essentially extracted from the vortex ring’s energy. We estimate $E_P$
during its stay (say,
$E_P$
during its stay (say, $t_1$
to
$t_1$
to $t_2$
) within the vortex ring, as
$t_2$
) within the vortex ring, as $({1}/{2})I$ $\int _{t_1}^{t_2} {\varOmega }_P(t)^2 \,{\rm d}t$
, where
$\int _{t_1}^{t_2} {\varOmega }_P(t)^2 \,{\rm d}t$
, where $I$
is the moment of inertia of the spherical particle about its centre of mass,
$I$
is the moment of inertia of the spherical particle about its centre of mass, $({1}/{10)}mD^2_P$
; here,
$({1}/{10)}mD^2_P$
; here, $m$
is the mass of the particle. We then compare this
$m$
is the mass of the particle. We then compare this $E_P$
with the initial energy of the vortex ring,
$E_P$
with the initial energy of the vortex ring, $E_{Ring}$
, calculated for the base vortex ring using the relation from Fraenkel (Reference Fraenkel1972) as
$E_{Ring}$
, calculated for the base vortex ring using the relation from Fraenkel (Reference Fraenkel1972) as $E_{Ring}$
=
$E_{Ring}$
= $({1}/{4}){\rho }D_o{\varGamma }^2[\ln(8/({D_{c,o}/D_o}))-7/4+(3/8)({D_{c,o}/D_o})^2\ln(8/({D_{c,o}/D_o}))]$
. We find
$({1}/{4}){\rho }D_o{\varGamma }^2[\ln(8/({D_{c,o}/D_o}))-7/4+(3/8)({D_{c,o}/D_o})^2\ln(8/({D_{c,o}/D_o}))]$
. We find $E_P$
to be reasonably smaller than
$E_P$
to be reasonably smaller than $E_{Ring}$
(
$E_{Ring}$
( $E_P$
/
$E_P$
/ $E_{Ring}\lt$
0.05), primarily due to the very low density of the particle. These results indicate that the energy extraction from the ring, due to the particle rotation, is negligible compared with the ring’s energy and, hence, would not have any significant impact on the vortex ring’s dynamics. It may be noted that
$E_{Ring}\lt$
0.05), primarily due to the very low density of the particle. These results indicate that the energy extraction from the ring, due to the particle rotation, is negligible compared with the ring’s energy and, hence, would not have any significant impact on the vortex ring’s dynamics. It may be noted that $E_{ring}$
here has been calculated for the entire ring rather than for a specific section of the ring, particularly where the particle is located. This approach is justified by the fact that in the current interactions, the particle’s influence extends across the entire ring at later stages of interactions, as evident from the significant reductions observed in the ring’s convection speed and enstrophy (discussed in § 4). Consequently, considering the entire ring to calculate
$E_{ring}$
here has been calculated for the entire ring rather than for a specific section of the ring, particularly where the particle is located. This approach is justified by the fact that in the current interactions, the particle’s influence extends across the entire ring at later stages of interactions, as evident from the significant reductions observed in the ring’s convection speed and enstrophy (discussed in § 4). Consequently, considering the entire ring to calculate $E_{ring}$
would be a more appropriate approach. Additionally, it is also noteworthy that the buoyant energy contribution to the vortex ring from the particle (
$E_{ring}$
would be a more appropriate approach. Additionally, it is also noteworthy that the buoyant energy contribution to the vortex ring from the particle ( $E_{buoyant}$
) during its residence within the ring, expressed as a percentage of the ring’s energy (
$E_{buoyant}$
) during its residence within the ring, expressed as a percentage of the ring’s energy ( $E_{buoyant}$
/
$E_{buoyant}$
/ $E_{Ring}$
), consistently remained below 9 % across all the cases studied. These broad observations again indicate that the direct addition or extraction of energy to or from the ring is not the primary factor influencing the dynamics of the ring. Instead, it is likely that the development of instabilities of the ring, driven by an increasing particle-to-vortex size ratio, is the primary reason for the observed decrease in particle rotation rate seen here, and the increase in deformation and fragmentation of the vortex core, as we discuss in § 4.
$E_{Ring}$
), consistently remained below 9 % across all the cases studied. These broad observations again indicate that the direct addition or extraction of energy to or from the ring is not the primary factor influencing the dynamics of the ring. Instead, it is likely that the development of instabilities of the ring, driven by an increasing particle-to-vortex size ratio, is the primary reason for the observed decrease in particle rotation rate seen here, and the increase in deformation and fragmentation of the vortex core, as we discuss in § 4.
4. Vortex ring dynamics
In turbulent flows, to gain insights into the spatio-temporal coherence of the vortical structures, one needs to look into their kinematics, including size, shape and vorticity distribution, as well as their dynamic features such as stability and growth (Zhou et al. Reference Zhou, Adrian and Balachandar1996; Adrian Reference Adrian2007). In the context of vortex–particle interactions, in this section, we report on the influence of particle size on various aspects of the ring’s dynamics, including its deformations, propagation, azimuthal vorticity and enstrophy.
4.1. Vortex ring propagation
In turbulent flows, the convective velocity of the vortical structures serves as a sensible indicator of their coherence (Zhou et al. Reference Zhou, Adrian, Balachandar and Kendall1999). In these flows, the presence of bubbles/particles has been known to lead to suppression in the propagation of vortical structures leading to turbulence modulation (Dritselis & Vlachos Reference Dritselis and Vlachos2008; Jacob et al. Reference Jacob, Olivieri, Miozzi, Campana and Piva2010). In this context, for the present simplified configuration, we present in figure 12, the effects of particle size on the propagation speed of the vortex ring in terms of the ring’s vertical position ( $z^{\ast }$
=
$z^{\ast }$
= $z/D_o$
) with time (
$z/D_o$
) with time ( $t^{\ast }$
=
$t^{\ast }$
= $tu_{co}/D_o$
) for interactions at both low (
$tu_{co}/D_o$
) for interactions at both low ( $Re$
= 6000) and high (
$Re$
= 6000) and high ( $Re$
= 67 300) Reynolds numbers. Also shown in the figure are the positions of the base vortex ring (no particle interaction) from both the present experiments and the model by Fukumoto & Moffatt (Reference Fukumoto and Moffatt2000), with the base ring position from experiment nearly collapsing with that from the model. In addition to the ring positions, also shown in the figure are the different stages of the ring–particle interaction (I to III), similar to that for ring–bubble interactions (Jha & Govardhan Reference Jha and Govardhan2015). Notably, stage I denotes the pre-(particle) capture phase, where the particle is initially outside the vortex ring and approaches the low-pressure vortex core. Following this, the time instant of the particle capture is indicated in the figure by the (black) dashed line, marking the transition from stage I to II. Subsequently, in stage II, the particle undergoes different types of motion within the ring while simultaneously modifying the vortex ring dynamics. Finally, in stage III, the particle escapes from the deformed (or fragmented) ring core, as seen in some cases, for example, at low
$Re$
= 67 300) Reynolds numbers. Also shown in the figure are the positions of the base vortex ring (no particle interaction) from both the present experiments and the model by Fukumoto & Moffatt (Reference Fukumoto and Moffatt2000), with the base ring position from experiment nearly collapsing with that from the model. In addition to the ring positions, also shown in the figure are the different stages of the ring–particle interaction (I to III), similar to that for ring–bubble interactions (Jha & Govardhan Reference Jha and Govardhan2015). Notably, stage I denotes the pre-(particle) capture phase, where the particle is initially outside the vortex ring and approaches the low-pressure vortex core. Following this, the time instant of the particle capture is indicated in the figure by the (black) dashed line, marking the transition from stage I to II. Subsequently, in stage II, the particle undergoes different types of motion within the ring while simultaneously modifying the vortex ring dynamics. Finally, in stage III, the particle escapes from the deformed (or fragmented) ring core, as seen in some cases, for example, at low $Re$
= 6000 and large
$Re$
= 6000 and large $D_p/D_{c,o}$
= 1.67.
$D_p/D_{c,o}$
= 1.67.
The vertical positions ( $z^{\ast }$
=
$z^{\ast }$
= $z/D_o$
) of the vortex ring are shown with time (
$z/D_o$
) of the vortex ring are shown with time ( $t^{\ast }$
=
$t^{\ast }$
= $tu_{co}/D_o$
), for the base vortex ring (no particle) and the different
$tu_{co}/D_o$
), for the base vortex ring (no particle) and the different $D_p/D_{c,o}$
interactions cases at (a)
$D_p/D_{c,o}$
interactions cases at (a) $Re$
= 6000 and (b)
$Re$
= 6000 and (b) $Re$
= 67 300. The different stages (I to III) of the interaction are also marked. Also shown are the base ring positions obtained from the viscous vortex ring model (blue solid line) by Fukumoto & Moffatt (Reference Fukumoto and Moffatt2000).
$Re$
= 67 300. The different stages (I to III) of the interaction are also marked. Also shown are the base ring positions obtained from the viscous vortex ring model (blue solid line) by Fukumoto & Moffatt (Reference Fukumoto and Moffatt2000).
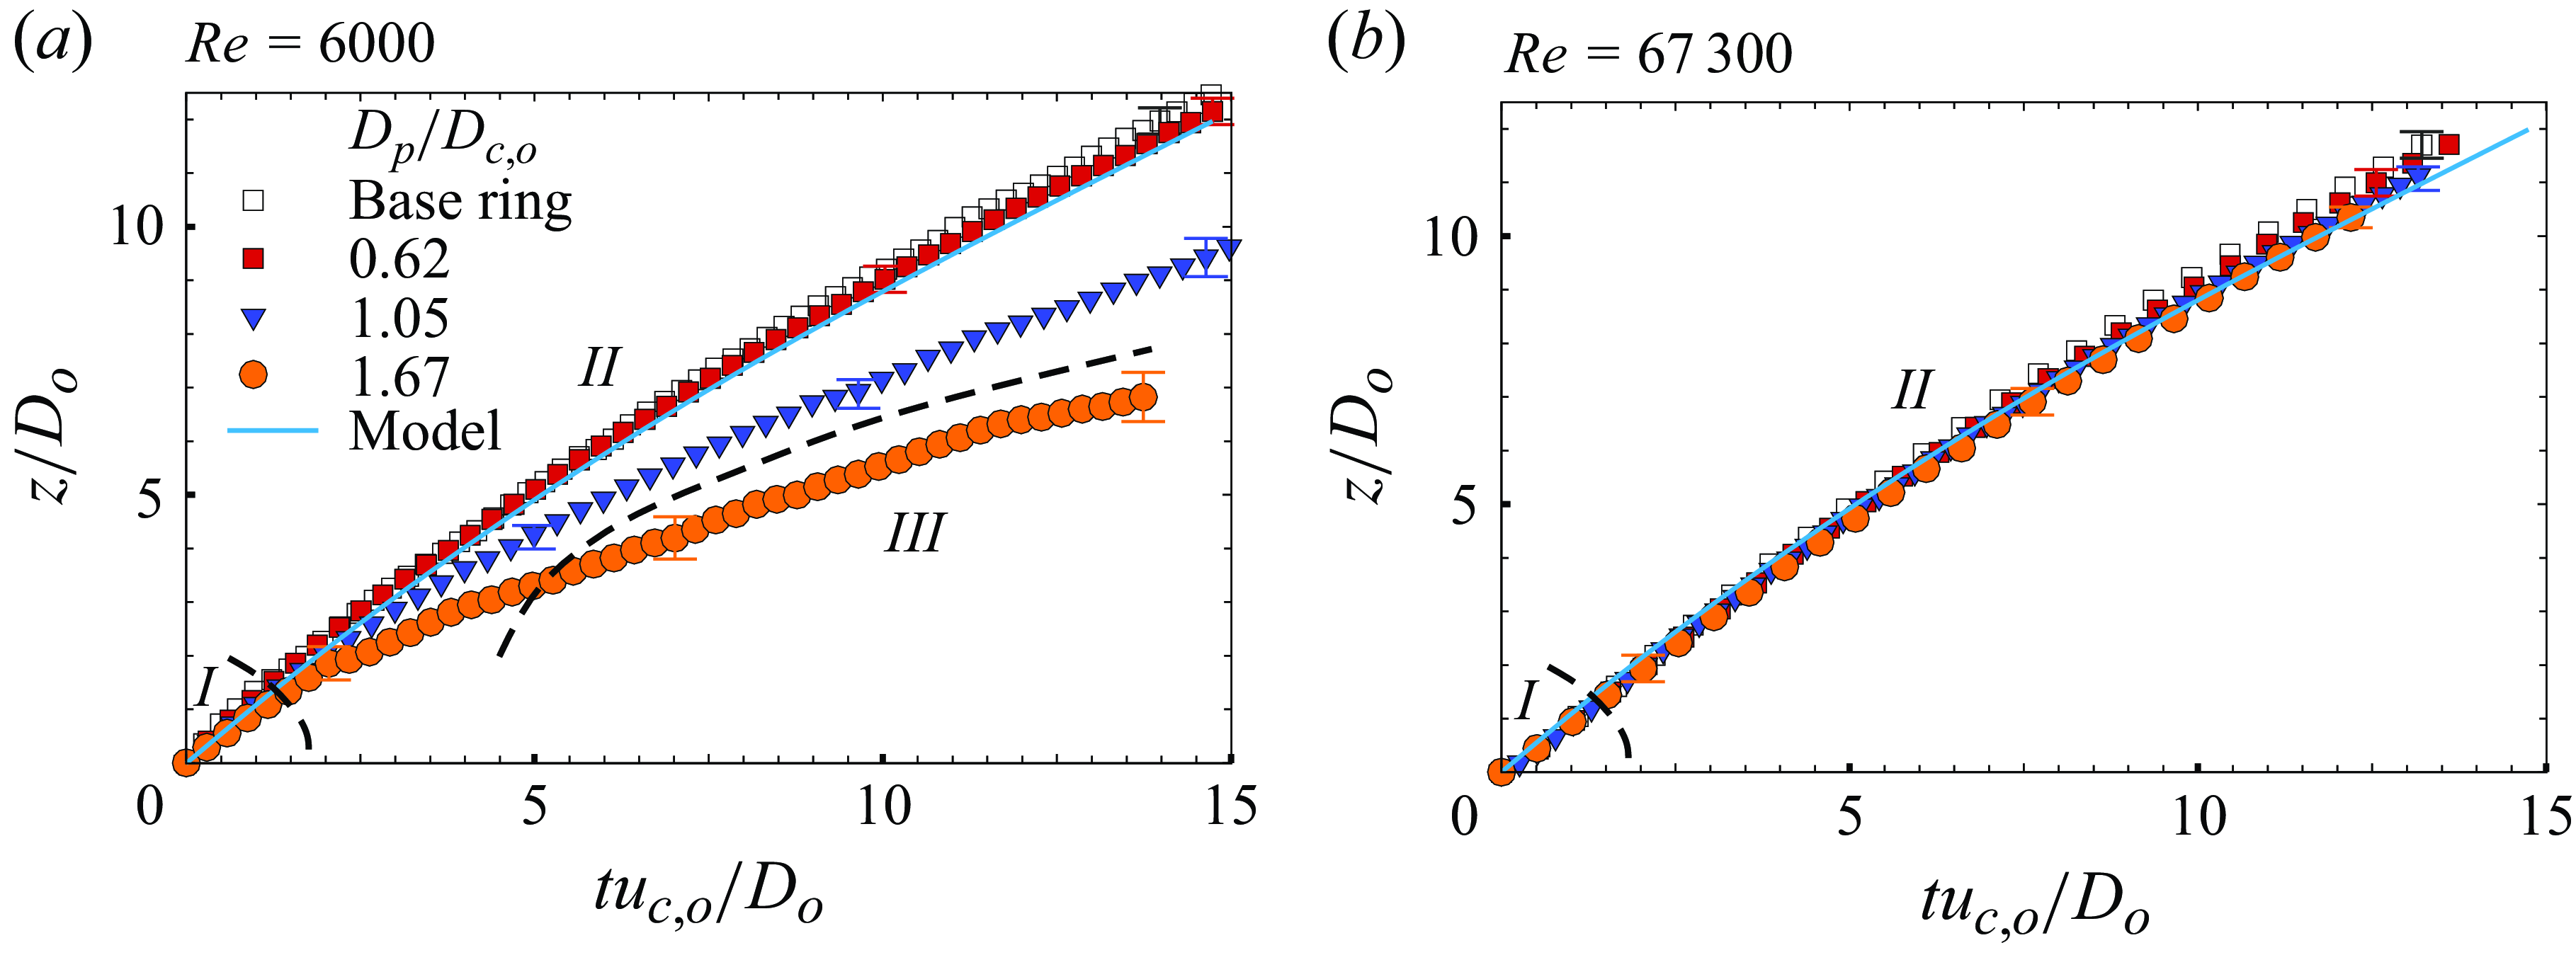
The most notable observation at $Re$
of 6000 in figure 12(a) is the distinct variation in ring positions (
$Re$
of 6000 in figure 12(a) is the distinct variation in ring positions ( $z^{\ast }$
) between small and large particle sizes in comparison with the base ring. Only small differences are observed between the base and the interaction case with a small particle of
$z^{\ast }$
) between small and large particle sizes in comparison with the base ring. Only small differences are observed between the base and the interaction case with a small particle of $D_p/D_{c,o}$
= 0.62. However, as the particle size increases, a significant reduction in the ring’s convection speed is seen as indicated by the drop in the ring’s position. On the other hand, at a high
$D_p/D_{c,o}$
= 0.62. However, as the particle size increases, a significant reduction in the ring’s convection speed is seen as indicated by the drop in the ring’s position. On the other hand, at a high $Re$
of 67 300 in figure 12(b), the differences in
$Re$
of 67 300 in figure 12(b), the differences in $z^{\ast }$
between various
$z^{\ast }$
between various $D_p/D_{c,o}$
cases are negligible and the ring’s position is seen to broadly align with the baseline ring. These differences in the variation of the vortex ring’s position (
$D_p/D_{c,o}$
cases are negligible and the ring’s position is seen to broadly align with the baseline ring. These differences in the variation of the vortex ring’s position ( $z^{\ast }$
) with time (
$z^{\ast }$
) with time ( $t^{\ast }$
) for different particle sizes and ring Reynolds numbers are reflected in the different scaling of
$t^{\ast }$
) for different particle sizes and ring Reynolds numbers are reflected in the different scaling of $z^{\ast }$
with
$z^{\ast }$
with $t^{\ast }$
, as summarised in table 5. It may be noted that all the scalings shown in the table correspond to
$t^{\ast }$
, as summarised in table 5. It may be noted that all the scalings shown in the table correspond to $t^{\ast }\approx$
10–15, which represents the later phases of interaction between the particle and the ring. The table shows that the scalings for the base cases follow a sublinear relation of
$t^{\ast }\approx$
10–15, which represents the later phases of interaction between the particle and the ring. The table shows that the scalings for the base cases follow a sublinear relation of $z^{\ast } \propto t^{\ast 0.9}$
(
$z^{\ast } \propto t^{\ast 0.9}$
( $R^2\gt$
0.95), aligning with previous studies (Bergdorf et al. Reference Bergdorf, Koumoutsakos and Leonard2007; Biswas & Govardhan Reference Biswas and Govardhan2023), where the exponent was reported to be approximately 0.9. At
$R^2\gt$
0.95), aligning with previous studies (Bergdorf et al. Reference Bergdorf, Koumoutsakos and Leonard2007; Biswas & Govardhan Reference Biswas and Govardhan2023), where the exponent was reported to be approximately 0.9. At $Re$
of 67 300, the interaction cases also exhibit similar scaling, indicating no discernible changes in the ring’s convection speed compared to the base ring. On the other hand, at
$Re$
of 67 300, the interaction cases also exhibit similar scaling, indicating no discernible changes in the ring’s convection speed compared to the base ring. On the other hand, at $Re$
= 6000, the low
$Re$
= 6000, the low $D_p/D_{c,o}$
= 0.62 case adheres to the baseline ring scaling, while with increasing particle size, the scaling deviates from the base case. Particularly noteworthy are the large-particle cases, for example,
$D_p/D_{c,o}$
= 0.62 case adheres to the baseline ring scaling, while with increasing particle size, the scaling deviates from the base case. Particularly noteworthy are the large-particle cases, for example, $D_p/D_{c,o}$
of 1.67, for which a substantially smaller exponent of 0.43 is seen. It is important to note that the exponents for low-
$D_p/D_{c,o}$
of 1.67, for which a substantially smaller exponent of 0.43 is seen. It is important to note that the exponents for low- $Re$
interaction cases, for example 0.43, are substantially smaller than those in (deforming) bubble–vortex ring interactions (Biswas & Govardhan Reference Biswas and Govardhan2023), as the reduction in the ring’s propagation speed caused by a non-deforming particle is found to be considerably larger compared with a deforming bubble.
$Re$
interaction cases, for example 0.43, are substantially smaller than those in (deforming) bubble–vortex ring interactions (Biswas & Govardhan Reference Biswas and Govardhan2023), as the reduction in the ring’s propagation speed caused by a non-deforming particle is found to be considerably larger compared with a deforming bubble.
The scaling for the ring’s position ( $z^{\ast }$
) with time (
$z^{\ast }$
) with time ( $t^{\ast }$
) for the base vortex ring and different
$t^{\ast }$
) for the base vortex ring and different $D_p/D_{c,o}$
interaction cases. These scalings are obtained for the later time of interactions,
$D_p/D_{c,o}$
interaction cases. These scalings are obtained for the later time of interactions, $t^{\ast }\approx$
10–15.
$t^{\ast }\approx$
10–15.
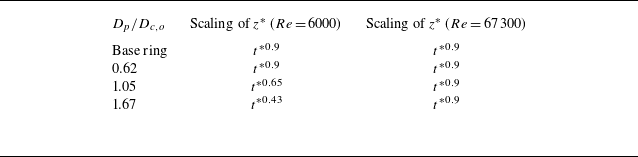
To show a comprehensive overview of the influence of particle size on the ring’s convection speed across different $Re$
, figure 13 depicts the percentage reduction in the ring’s convection speed (
$Re$
, figure 13 depicts the percentage reduction in the ring’s convection speed ( $\Delta u_c$
) relative to the base ring case; here,
$\Delta u_c$
) relative to the base ring case; here, $\Delta u_c$
is defined as 100
$\Delta u_c$
is defined as 100 $\times$
(
$\times$
( $u_{c,base}-u_{c,int}$
)/
$u_{c,base}-u_{c,int}$
)/ $u_{c,base}$
, where
$u_{c,base}$
, where $u_{c,base}$
and
$u_{c,base}$
and $u_{c,int}$
represent the convection speed of the base case and interaction case, respectively, all measured at a later time,
$u_{c,int}$
represent the convection speed of the base case and interaction case, respectively, all measured at a later time, $t^{\ast }$
= 13. The figure shows a significant increase in
$t^{\ast }$
= 13. The figure shows a significant increase in $\Delta u_c$
with
$\Delta u_c$
with $D_p/D_{c,o}$
particularly at low
$D_p/D_{c,o}$
particularly at low $Re=6000$
, with
$Re=6000$
, with $\Delta u_c$
reaching about 50 %. As
$\Delta u_c$
reaching about 50 %. As $Re$
increases from 6000, the variation of
$Re$
increases from 6000, the variation of $\Delta u_c$
with
$\Delta u_c$
with $D_p/D_{c,o}$
is similar, although the maximum reduction seen is lower, and this peak value of
$D_p/D_{c,o}$
is similar, although the maximum reduction seen is lower, and this peak value of $\Delta u_c$
keeps decreasing with
$\Delta u_c$
keeps decreasing with $Re$
, until at higher
$Re$
, until at higher $Re\gtrapprox$
50 000,
$Re\gtrapprox$
50 000, $\Delta u_c$
remains minimal (
$\Delta u_c$
remains minimal ( $\lt$
5 %) across all
$\lt$
5 %) across all $D_p/D_{c,o}$
values, which is within experimental error. The variation of
$D_p/D_{c,o}$
values, which is within experimental error. The variation of $\Delta u_c$
in the figure with both
$\Delta u_c$
in the figure with both $D_p/D_{c,o}$
and
$D_p/D_{c,o}$
and $Re$
is well represented over the entire parameter range by
$Re$
is well represented over the entire parameter range by $\Delta u_c \propto (D_p/D_{c,o})^{2.3}Re^{-0.37}$
. It is crucial to emphasise that the exponent of
$\Delta u_c \propto (D_p/D_{c,o})^{2.3}Re^{-0.37}$
. It is crucial to emphasise that the exponent of $D_p/D_{c,o}$
in this scaling is larger than that reported by Biswas & Govardhan (Reference Biswas and Govardhan2023) (
$D_p/D_{c,o}$
in this scaling is larger than that reported by Biswas & Govardhan (Reference Biswas and Govardhan2023) ( $\Delta u_c \propto (D_b/D_{c,o})^{1.5}Re^{-1}$
;
$\Delta u_c \propto (D_b/D_{c,o})^{1.5}Re^{-1}$
; $D_b$
= bubble diameter) for deforming bubble–ring interactions in a similar range of size ratio and
$D_b$
= bubble diameter) for deforming bubble–ring interactions in a similar range of size ratio and $Re$
, indicating that the increase in the particle size promotes more pronounced effects on the ring than a (deforming) bubble.
$Re$
, indicating that the increase in the particle size promotes more pronounced effects on the ring than a (deforming) bubble.
(a) The percentage reduction ( $\Delta u_c$
) of the ring’s convection speed versus
$\Delta u_c$
) of the ring’s convection speed versus $D_p/D_{c,o}$
is shown for different
$D_p/D_{c,o}$
is shown for different $Re$
; here,
$Re$
; here, $\Delta u_c$
is calculated as
$\Delta u_c$
is calculated as $\Delta u_c$
(%) = 100
$\Delta u_c$
(%) = 100 $\times$
(
$\times$
( $u_{c,base}-u_{c,int}$
)/
$u_{c,base}-u_{c,int}$
)/ $u_{c,base}$
, where
$u_{c,base}$
, where $u_{c,base}$
and
$u_{c,base}$
and $u_{c,int}$
are the ring’s convection speed in the base and the interaction cases, respectively, measured at
$u_{c,int}$
are the ring’s convection speed in the base and the interaction cases, respectively, measured at $t^{\ast }$
= 13. As can be noticed,
$t^{\ast }$
= 13. As can be noticed, $\Delta u_c$
scales as
$\Delta u_c$
scales as $(D_p/D_{c,o})^{2.3}Re^{-0.37}$
, with
$(D_p/D_{c,o})^{2.3}Re^{-0.37}$
, with $R^2\gt$
0.95. (b) The
$R^2\gt$
0.95. (b) The $\Delta u_c$
from (a) has been plotted in a universal curve by employing the proposed scaling law; here,
$\Delta u_c$
from (a) has been plotted in a universal curve by employing the proposed scaling law; here, $C_u$
is the proportionality constant from (a). It can be noted that the large-
$C_u$
is the proportionality constant from (a). It can be noted that the large- $Re$
cases (
$Re$
cases ( $Re\gtrapprox$
39 900) are not shown since
$Re\gtrapprox$
39 900) are not shown since $\Delta u_c$
in these cases were of the order of the experimental error. The
$\Delta u_c$
in these cases were of the order of the experimental error. The $x$
axis is shown in log scale.
$x$
axis is shown in log scale.
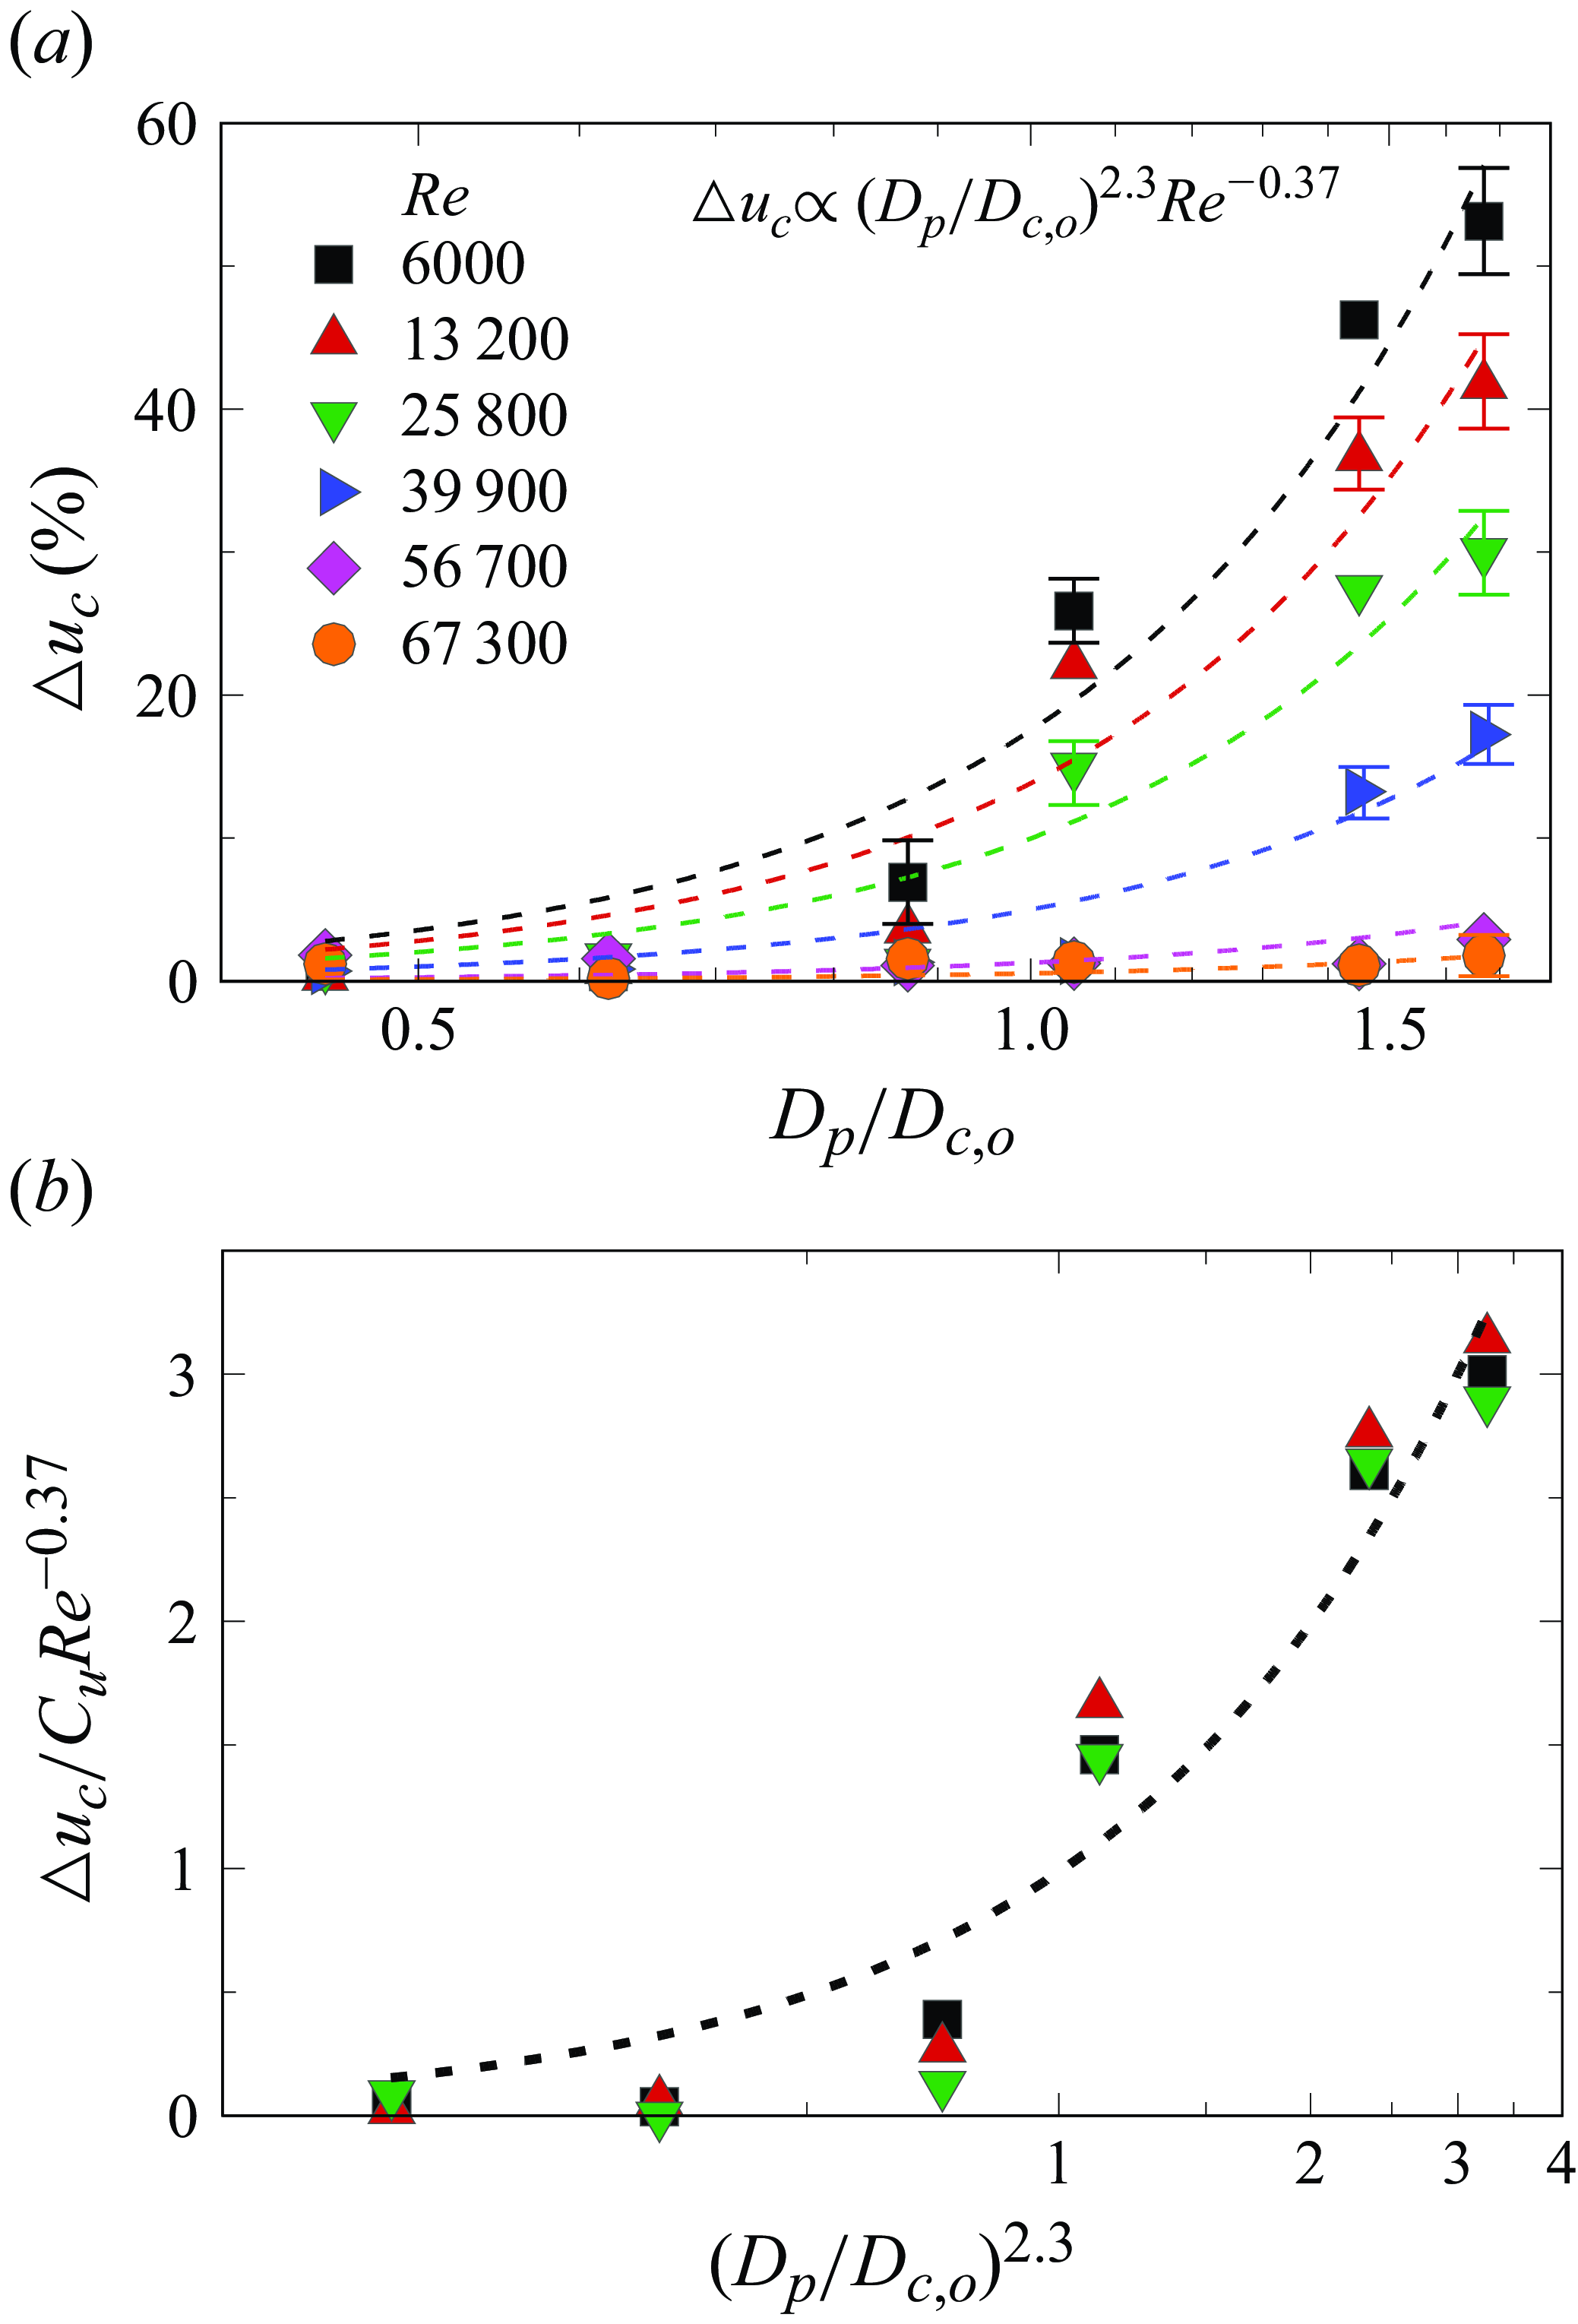
This scaling $\Delta u_c \propto ({D_p}/{D_{c,o}})^{2.3} Re^{-0.37}$
suggests a strong dependence of the reduction in convection speed on the particle-to-core diameter ratio. Although it would have been useful, getting this scaling law from simple theoretical grounds was challenging due to the complex interaction between the ring and the particle. Post-capture, the particle induces local strain and exerts forces on the surrounding fluid, continuously deforming the core. This process modifies the self-induced velocity of the ring. Additionally, the particle perturbs the core, making it susceptible to a range of instabilities (discussed later in this section). These effects would distort the core, redistribute vorticity and increase vorticity diffusion. One of the outcomes of these events is the increase in the vortex core diameter (compared with the base ring). Such an increase in the core size would lead to a reduction in the vortex ring convection speed, according to the classical convection speed relation for a vortex ring,
$\Delta u_c \propto ({D_p}/{D_{c,o}})^{2.3} Re^{-0.37}$
suggests a strong dependence of the reduction in convection speed on the particle-to-core diameter ratio. Although it would have been useful, getting this scaling law from simple theoretical grounds was challenging due to the complex interaction between the ring and the particle. Post-capture, the particle induces local strain and exerts forces on the surrounding fluid, continuously deforming the core. This process modifies the self-induced velocity of the ring. Additionally, the particle perturbs the core, making it susceptible to a range of instabilities (discussed later in this section). These effects would distort the core, redistribute vorticity and increase vorticity diffusion. One of the outcomes of these events is the increase in the vortex core diameter (compared with the base ring). Such an increase in the core size would lead to a reduction in the vortex ring convection speed, according to the classical convection speed relation for a vortex ring, $u_c = ({\varGamma }/{2\pi D_o}) (\ln({8D_{o}}/{D_{c,o}})-\alpha )$
(Sullivan et al. Reference Sullivan, Niemela, Hershberger, Bolster and Donnelly2008). Further, the expansion of the core is not uniform in the azimuthal direction, making it difficult to directly use the above relation. In larger-particle cases, the deformation of the core and azimuthal axis would also lead to an increased entrainment of the ambient fluid into the ring, and also the possibility of an increased drag on the translating ring. Also notable is that in large-particle cases, the core can be fragmented, and such cases would fundamentally alter the propagation dynamics of the vortex ring substantially, with consequent large changes in the convection speed relation for such a ring from the idealised convection speed velocity shown earlier.
$u_c = ({\varGamma }/{2\pi D_o}) (\ln({8D_{o}}/{D_{c,o}})-\alpha )$
(Sullivan et al. Reference Sullivan, Niemela, Hershberger, Bolster and Donnelly2008). Further, the expansion of the core is not uniform in the azimuthal direction, making it difficult to directly use the above relation. In larger-particle cases, the deformation of the core and azimuthal axis would also lead to an increased entrainment of the ambient fluid into the ring, and also the possibility of an increased drag on the translating ring. Also notable is that in large-particle cases, the core can be fragmented, and such cases would fundamentally alter the propagation dynamics of the vortex ring substantially, with consequent large changes in the convection speed relation for such a ring from the idealised convection speed velocity shown earlier.
In summary, our observations indicate that in low- $Re$
interactions, an increase in particle size leads to substantial reductions in the ring’s convection speed with the magnitudes of these reductions being significantly higher for the present buoyant particle case when compared with the deforming bubble cases. These findings would have critical implications in connection with the interactions of vortical structures with rigid (buoyant) particles and deforming bubbles in turbulent flows. As the convection speed of the ring is influenced by ring deformation and modifications of the core vorticity, we discuss these in the following subsections.
$Re$
interactions, an increase in particle size leads to substantial reductions in the ring’s convection speed with the magnitudes of these reductions being significantly higher for the present buoyant particle case when compared with the deforming bubble cases. These findings would have critical implications in connection with the interactions of vortical structures with rigid (buoyant) particles and deforming bubbles in turbulent flows. As the convection speed of the ring is influenced by ring deformation and modifications of the core vorticity, we discuss these in the following subsections.
4.2. Vortex ring deformation
The deformation of vortical structures in turbulent flows alters their dynamics, subsequently influencing the flow characteristics (Zhou et al. Reference Zhou, Adrian and Balachandar1996). Thus, to understand particle interactions with vortices in these flows, it becomes imperative to investigate the influence of particles on vortex deformation. In the present idealised scenario, the influence of particle size on the ring’s deformation is characterised by its instantaneous aspect ratio since the evolution of a vortex ring is known to be significantly influenced by its aspect ratio (Yao & Xungang Reference Yao and Xungang1997; Dhanak & Bernardinis Reference Dhanak and de Bernardinis1981). We show in figure 14(a) the temporal variation of the ring aspect ratio, ${\varPhi }(t^{\ast })$
, defined as the ratio of the instantaneous major (
${\varPhi }(t^{\ast })$
, defined as the ratio of the instantaneous major ( $D_{major}$
) to the minor (
$D_{major}$
) to the minor ( $D_{minor}$
) axis of the vortex ring, for both the base and interaction cases at low (
$D_{minor}$
) axis of the vortex ring, for both the base and interaction cases at low ( $Re$
= 6000) and high (
$Re$
= 6000) and high ( $Re$
= 67 300) Reynolds numbers. In the absence of particles (base case), the vortex rings remain nearly circular,
$Re$
= 67 300) Reynolds numbers. In the absence of particles (base case), the vortex rings remain nearly circular, ${\varPhi }(t^{\ast })\approx$
1. Also observed is a similar behaviour for large-
${\varPhi }(t^{\ast })\approx$
1. Also observed is a similar behaviour for large- $Re$
interaction cases, indicating that the vortex ring holds its (circular) shape across all particle sizes. On the other hand, at low
$Re$
interaction cases, indicating that the vortex ring holds its (circular) shape across all particle sizes. On the other hand, at low $Re$
, increasing deformation of the vortex ring is evident with increasing
$Re$
, increasing deformation of the vortex ring is evident with increasing $D_p/D_{c,o}$
, resulting in a larger aspect ratio (as in figure 6), for example,
$D_p/D_{c,o}$
, resulting in a larger aspect ratio (as in figure 6), for example, ${\varPhi }(t^{\ast })\approx$
1.65 (at later times) at
${\varPhi }(t^{\ast })\approx$
1.65 (at later times) at $D_p/D_{c,o}$
= 1.67. Such cases also involve substantially deformed ring cores in addition to the deformed azimuthal axis of the ring. Further, it may be noted that at low
$D_p/D_{c,o}$
= 1.67. Such cases also involve substantially deformed ring cores in addition to the deformed azimuthal axis of the ring. Further, it may be noted that at low $Re$
, small to intermediate particle sizes (e.g.
$Re$
, small to intermediate particle sizes (e.g. $D_p/D_{c,o}$
of 1.05 and 1.45) show
$D_p/D_{c,o}$
of 1.05 and 1.45) show ${\varPhi }(t^{\ast })$
to be undergoing mild oscillations with time. In comparison, the large particle (
${\varPhi }(t^{\ast })$
to be undergoing mild oscillations with time. In comparison, the large particle ( $D_p/D_{c,o}$
of 1.67), despite resulting in significantly higher deformation of the ring’s azimuthal axis, shows nearly no oscillatory deformation in the ring shape. This could be attributed to the fact that the large particle remains at a relatively fixed azimuthal location within the ring (as seen in figure 9), resulting in a ring deformation biased towards one side, which persists even after the particle leaves the ring (at
$D_p/D_{c,o}$
of 1.67), despite resulting in significantly higher deformation of the ring’s azimuthal axis, shows nearly no oscillatory deformation in the ring shape. This could be attributed to the fact that the large particle remains at a relatively fixed azimuthal location within the ring (as seen in figure 9), resulting in a ring deformation biased towards one side, which persists even after the particle leaves the ring (at $t^{\ast }$
around 5). Conversely, at low and intermediate
$t^{\ast }$
around 5). Conversely, at low and intermediate $D_p/D_{c,o}$
(0.62 and 1.05), the aspect ratio experiences mild oscillatory variations with time, as seen typically in elliptic rings in the absence of particles. In the present particle–ring interacting cases, smaller particles are seen to have a higher azimuthal drift within the ring, as shown in figure 9. Also shown in the figure is the scaling of
$D_p/D_{c,o}$
(0.62 and 1.05), the aspect ratio experiences mild oscillatory variations with time, as seen typically in elliptic rings in the absence of particles. In the present particle–ring interacting cases, smaller particles are seen to have a higher azimuthal drift within the ring, as shown in figure 9. Also shown in the figure is the scaling of ${\varPhi }(t^{\ast })$
with time (
${\varPhi }(t^{\ast })$
with time ( ${\varPhi } \propto t^{\ast \,n}$
, dashed lines), where the exponent in the scaling is seen to increase with particle size.
${\varPhi } \propto t^{\ast \,n}$
, dashed lines), where the exponent in the scaling is seen to increase with particle size.
(a) The instantaneous aspect ratio ( ${\varPhi }(t^{\ast })$
) of the ring is shown for the base ring and different interaction cases at
${\varPhi }(t^{\ast })$
) of the ring is shown for the base ring and different interaction cases at $Re$
of 6000 and 67 300. Here,
$Re$
of 6000 and 67 300. Here, ${\varPhi }(t^{\ast })$
is defined as the ratio of the instantaneous major (
${\varPhi }(t^{\ast })$
is defined as the ratio of the instantaneous major ( $D_{major}$
) and minor (
$D_{major}$
) and minor ( $D_{minor}$
) diameter of the vortex ring. (b) The aspect ratio of the ring (
$D_{minor}$
) diameter of the vortex ring. (b) The aspect ratio of the ring ( ${\varPhi }_{t^{\ast }=13}$
) measured at a later time of
${\varPhi }_{t^{\ast }=13}$
) measured at a later time of $t^{\ast }\approx$
13 is plotted with
$t^{\ast }\approx$
13 is plotted with $D_p/D_{c,o}$
for different
$D_p/D_{c,o}$
for different $Re$
.
$Re$
.
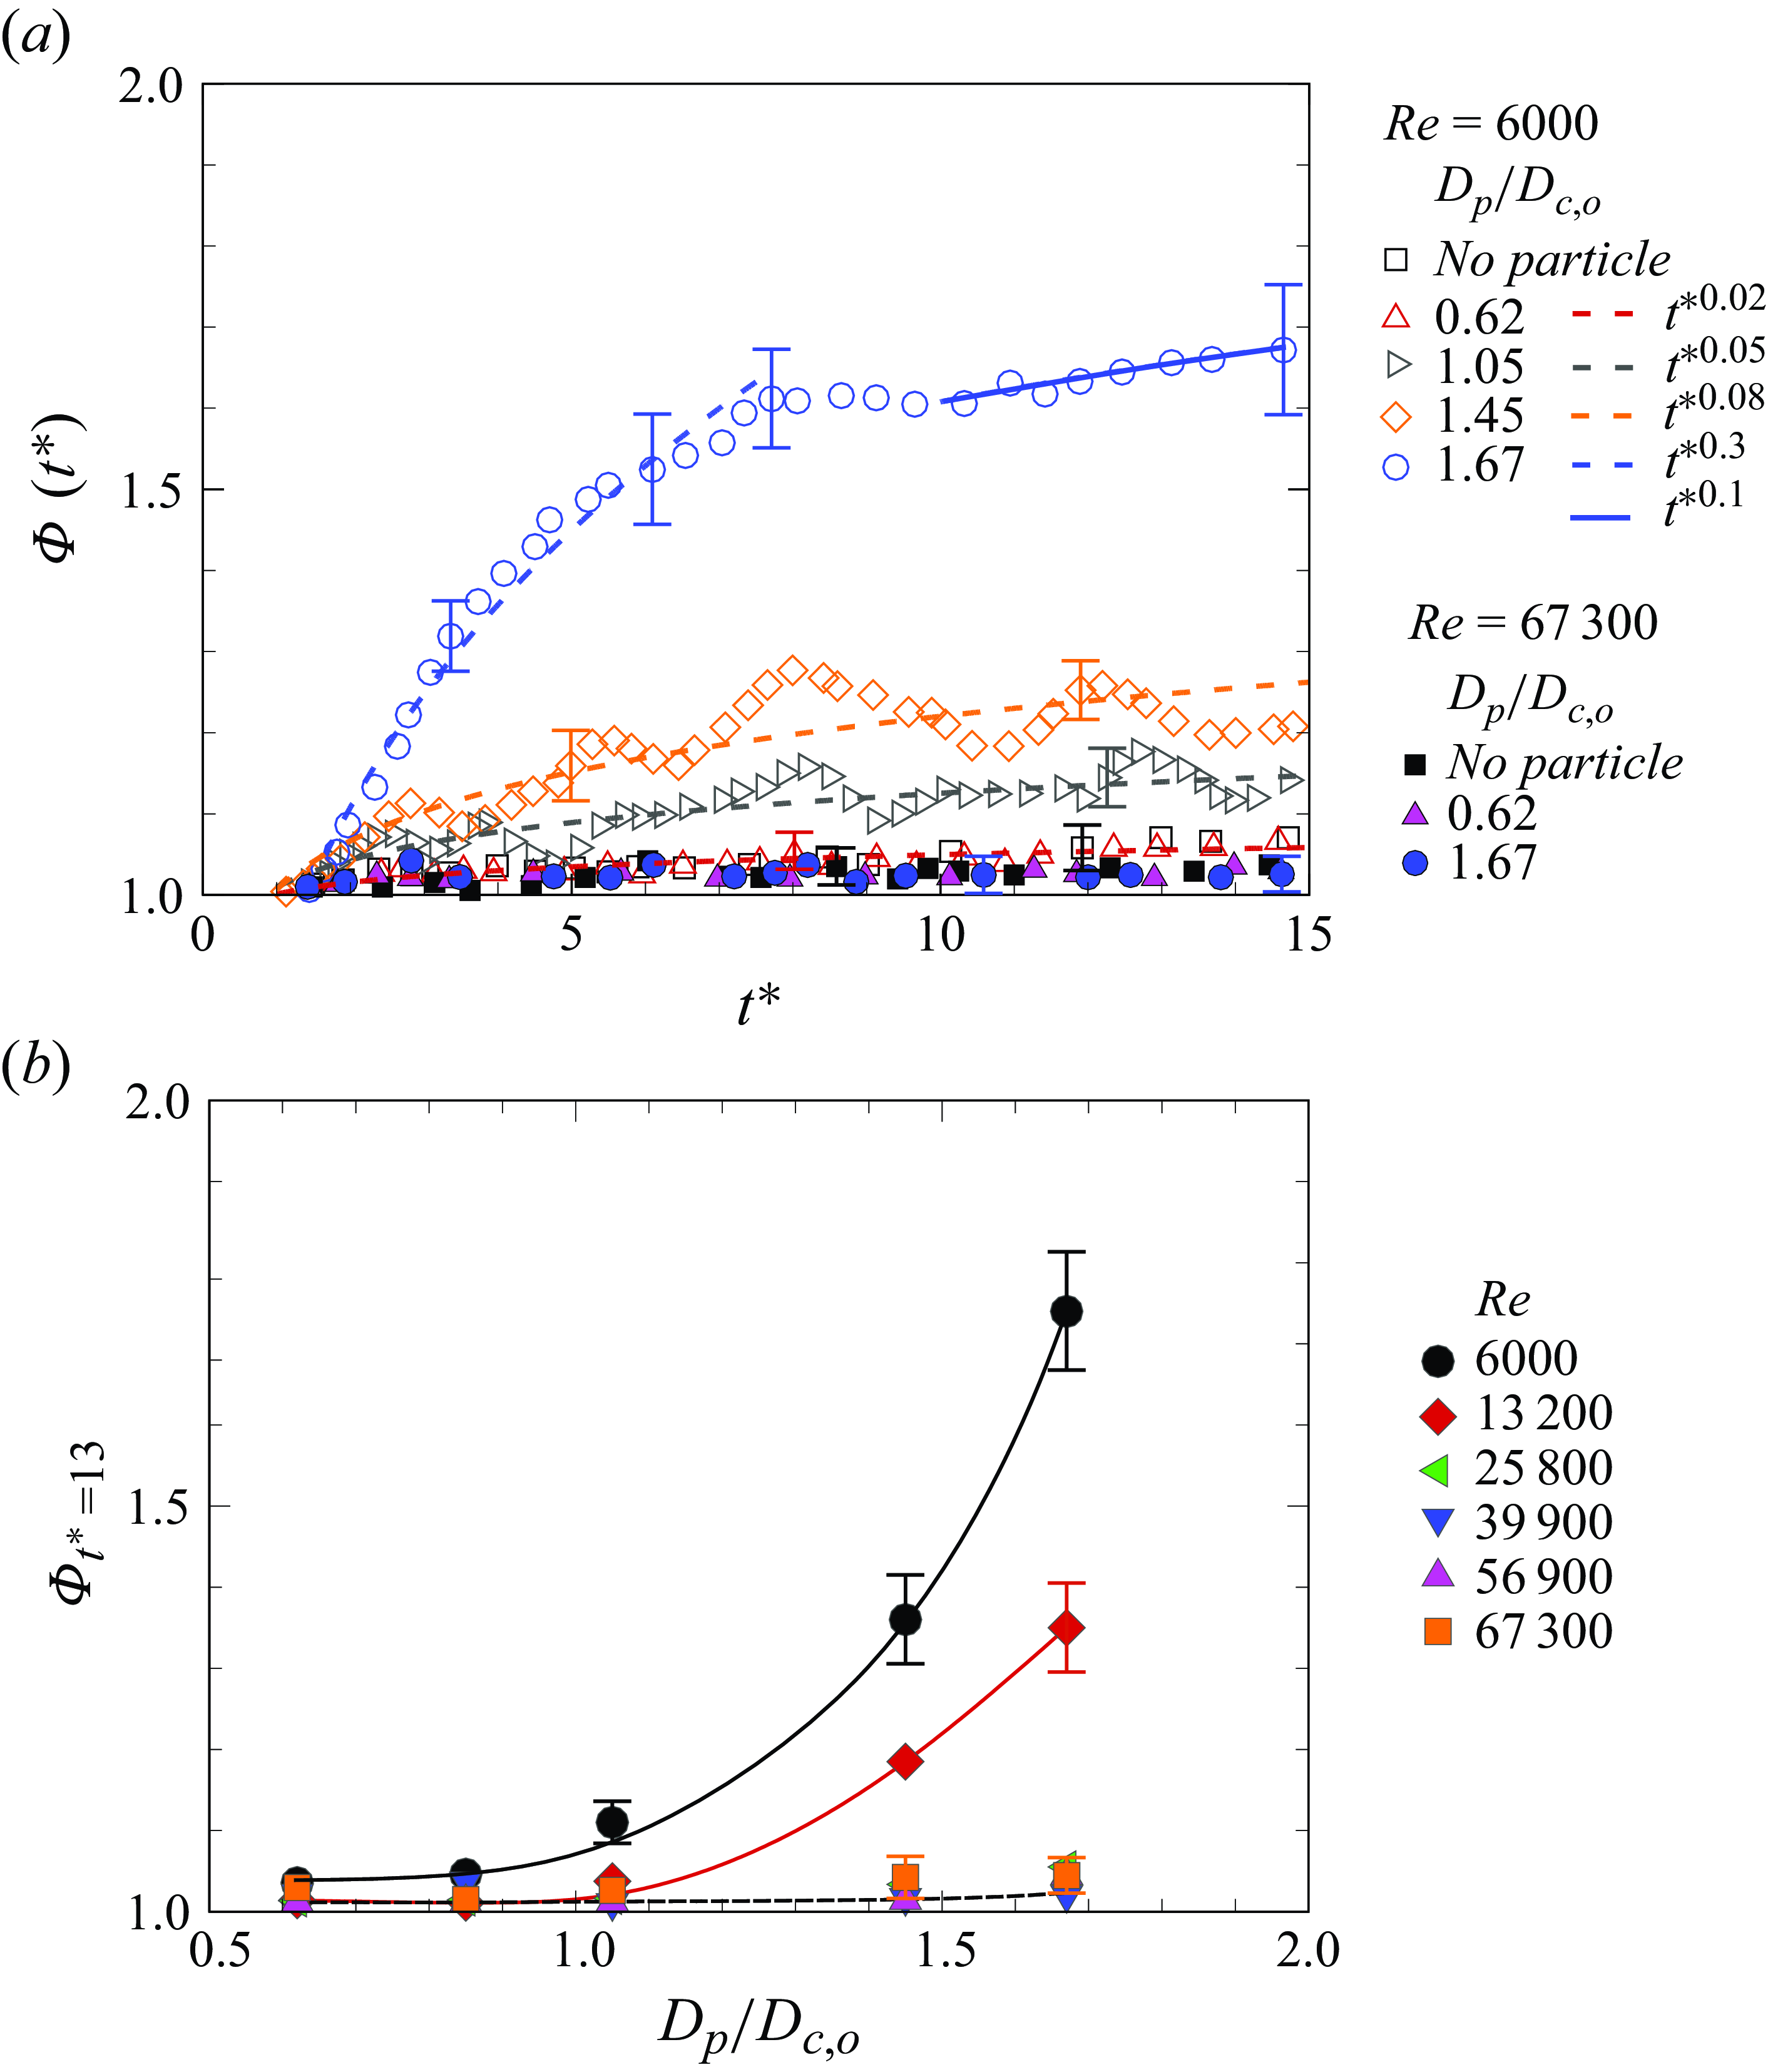
Following the temporal evolution of the ring’s aspect ratio, we present in figure 14(b) an overview of the aspect ratio ( ${\varPhi }_{t^{\ast }=13}$
) measured at a later time,
${\varPhi }_{t^{\ast }=13}$
) measured at a later time, $t^{\ast }$
= 13. The trends in this plot are qualitatively similar to those observed in the reduction of ring convection speed in figure 13. As can be seen at low
$t^{\ast }$
= 13. The trends in this plot are qualitatively similar to those observed in the reduction of ring convection speed in figure 13. As can be seen at low $Re$
,
$Re$
, ${\varPhi }_{t^{\ast }=13}$
shows an increase with
${\varPhi }_{t^{\ast }=13}$
shows an increase with $D_p/D_{c,o}$
, while at large
$D_p/D_{c,o}$
, while at large $Re$
,
$Re$
, ${\varPhi }_{t^{\ast }=13}$
remains closer to 1 across all
${\varPhi }_{t^{\ast }=13}$
remains closer to 1 across all $D_p/D_{c,o}$
cases, implying minimal deformation of the vortex ring during interactions, similar to the base ring. It is noteworthy that the observed oscillatory deformation of the vortex ring could lead to augmented entrainment of ambient fluid mass into the vortex ring, as was discussed by Husain & Hussain (Reference Husain and Hussain1993) in the context of a (non-interacting) elliptic vortex ring, with implications in terms of a reduced convection speed of the ring. Simultaneously, a larger aspect ratio can render the ring more susceptible to instability (Cheng, Lou & Lim Reference Cheng, Lou and Lim2016), since during this deformation, the vortex cores approach each other, thus introducing the possibility of increased mutually induced strain and leading towards vortex instability, as discussed by Leweke et al. (Reference Leweke, Le Dizès and Williamson2016) for parallel line vortices.
$D_p/D_{c,o}$
cases, implying minimal deformation of the vortex ring during interactions, similar to the base ring. It is noteworthy that the observed oscillatory deformation of the vortex ring could lead to augmented entrainment of ambient fluid mass into the vortex ring, as was discussed by Husain & Hussain (Reference Husain and Hussain1993) in the context of a (non-interacting) elliptic vortex ring, with implications in terms of a reduced convection speed of the ring. Simultaneously, a larger aspect ratio can render the ring more susceptible to instability (Cheng, Lou & Lim Reference Cheng, Lou and Lim2016), since during this deformation, the vortex cores approach each other, thus introducing the possibility of increased mutually induced strain and leading towards vortex instability, as discussed by Leweke et al. (Reference Leweke, Le Dizès and Williamson2016) for parallel line vortices.
4.3. Azimuthal vorticity and enstrophy
4.3.1. Azimuthal vorticity
We now look into the effects of particle size on the core vorticity distribution, as obtained through two-dimensional time-resolved PIV. In figures 15 and 16, a comparison across two particle-to-vortex size ratios, in terms of the instantaneous principal azimuthal vorticity ( ${{\omega }D_o}/{u_{co}}$
) of the vortex ring, is shown for low (
${{\omega }D_o}/{u_{co}}$
) of the vortex ring, is shown for low ( $Re$
= 6000)- and large (
$Re$
= 6000)- and large ( $Re$
= 67 300)-Reynolds-number interaction cases, respectively. Since the convection of the vortex ring is an integral output of the vorticity distribution within the core, these figures will help us to better understand the dynamics behind the reduced convection speed of the vortex ring caused by the particle, and also other aspects such as enstrophy. It may be noted that the vorticity fields are shown, starting from the pre-capture instant to up to
$Re$
= 67 300)-Reynolds-number interaction cases, respectively. Since the convection of the vortex ring is an integral output of the vorticity distribution within the core, these figures will help us to better understand the dynamics behind the reduced convection speed of the vortex ring caused by the particle, and also other aspects such as enstrophy. It may be noted that the vorticity fields are shown, starting from the pre-capture instant to up to $t^{\ast }\approx$
8, at which point the convection speed of the vortex ring has significantly reduced (compared with base ring), especially in cases of low
$t^{\ast }\approx$
8, at which point the convection speed of the vortex ring has significantly reduced (compared with base ring), especially in cases of low $Re$
and large
$Re$
and large $D_p/D_{c,o}$
.
$D_p/D_{c,o}$
.
The azimuthal vorticity ( ${\omega }D_o/u_{co}$
) of both cores shown at different time instants, at
${\omega }D_o/u_{co}$
) of both cores shown at different time instants, at $Re$
of 6000, for two particle sizes of (a)
$Re$
of 6000, for two particle sizes of (a) $D_p/D_{c,o}$
= 0.62 and (b)
$D_p/D_{c,o}$
= 0.62 and (b) $D_p/D_{c,o}$
= 1.67. The
$D_p/D_{c,o}$
= 1.67. The $x$
and
$x$
and $z$
axes are normalised by the diameter of the vortex ring (
$z$
axes are normalised by the diameter of the vortex ring ( $D_o$
). The particle is marked as a hatched area (magenta). Here, solid and dashed line contours represent positive and negative vorticity, respectively. The time instants (
$D_o$
). The particle is marked as a hatched area (magenta). Here, solid and dashed line contours represent positive and negative vorticity, respectively. The time instants ( $t^{\ast }$
) shown are about (i) 1.75, (ii) 2.19, (iii) 2.81, (iv) 4.27 and (v) 7.47. The non-dimensional vorticity levels are
$t^{\ast }$
) shown are about (i) 1.75, (ii) 2.19, (iii) 2.81, (iv) 4.27 and (v) 7.47. The non-dimensional vorticity levels are $\pm$
16,
$\pm$
16, $\pm$
15,
$\pm$
15, $\pm$
14, …,
$\pm$
14, …, $\pm$
2. It may be noted that in (a(i,v)) and (b(i,v)), we show dashed radial lines, along which the extracted azimuthal vorticity is shown in figure 17. In this low-
$\pm$
2. It may be noted that in (a(i,v)) and (b(i,v)), we show dashed radial lines, along which the extracted azimuthal vorticity is shown in figure 17. In this low- $Re$
case, the convection speed of the vortex ring (measured just before capture) was smaller than the particles’ rising speed. To ensure capture, the particles were released behind the vortex ring, and hence it appears in (i) that the particles are below the ring. It may be noted that the speed of the rising particle does not influence the ring–particle interaction dynamics, which appears to be primarily governed by the particle’s size and the ring
$Re$
case, the convection speed of the vortex ring (measured just before capture) was smaller than the particles’ rising speed. To ensure capture, the particles were released behind the vortex ring, and hence it appears in (i) that the particles are below the ring. It may be noted that the speed of the rising particle does not influence the ring–particle interaction dynamics, which appears to be primarily governed by the particle’s size and the ring $Re$
.
$Re$
.
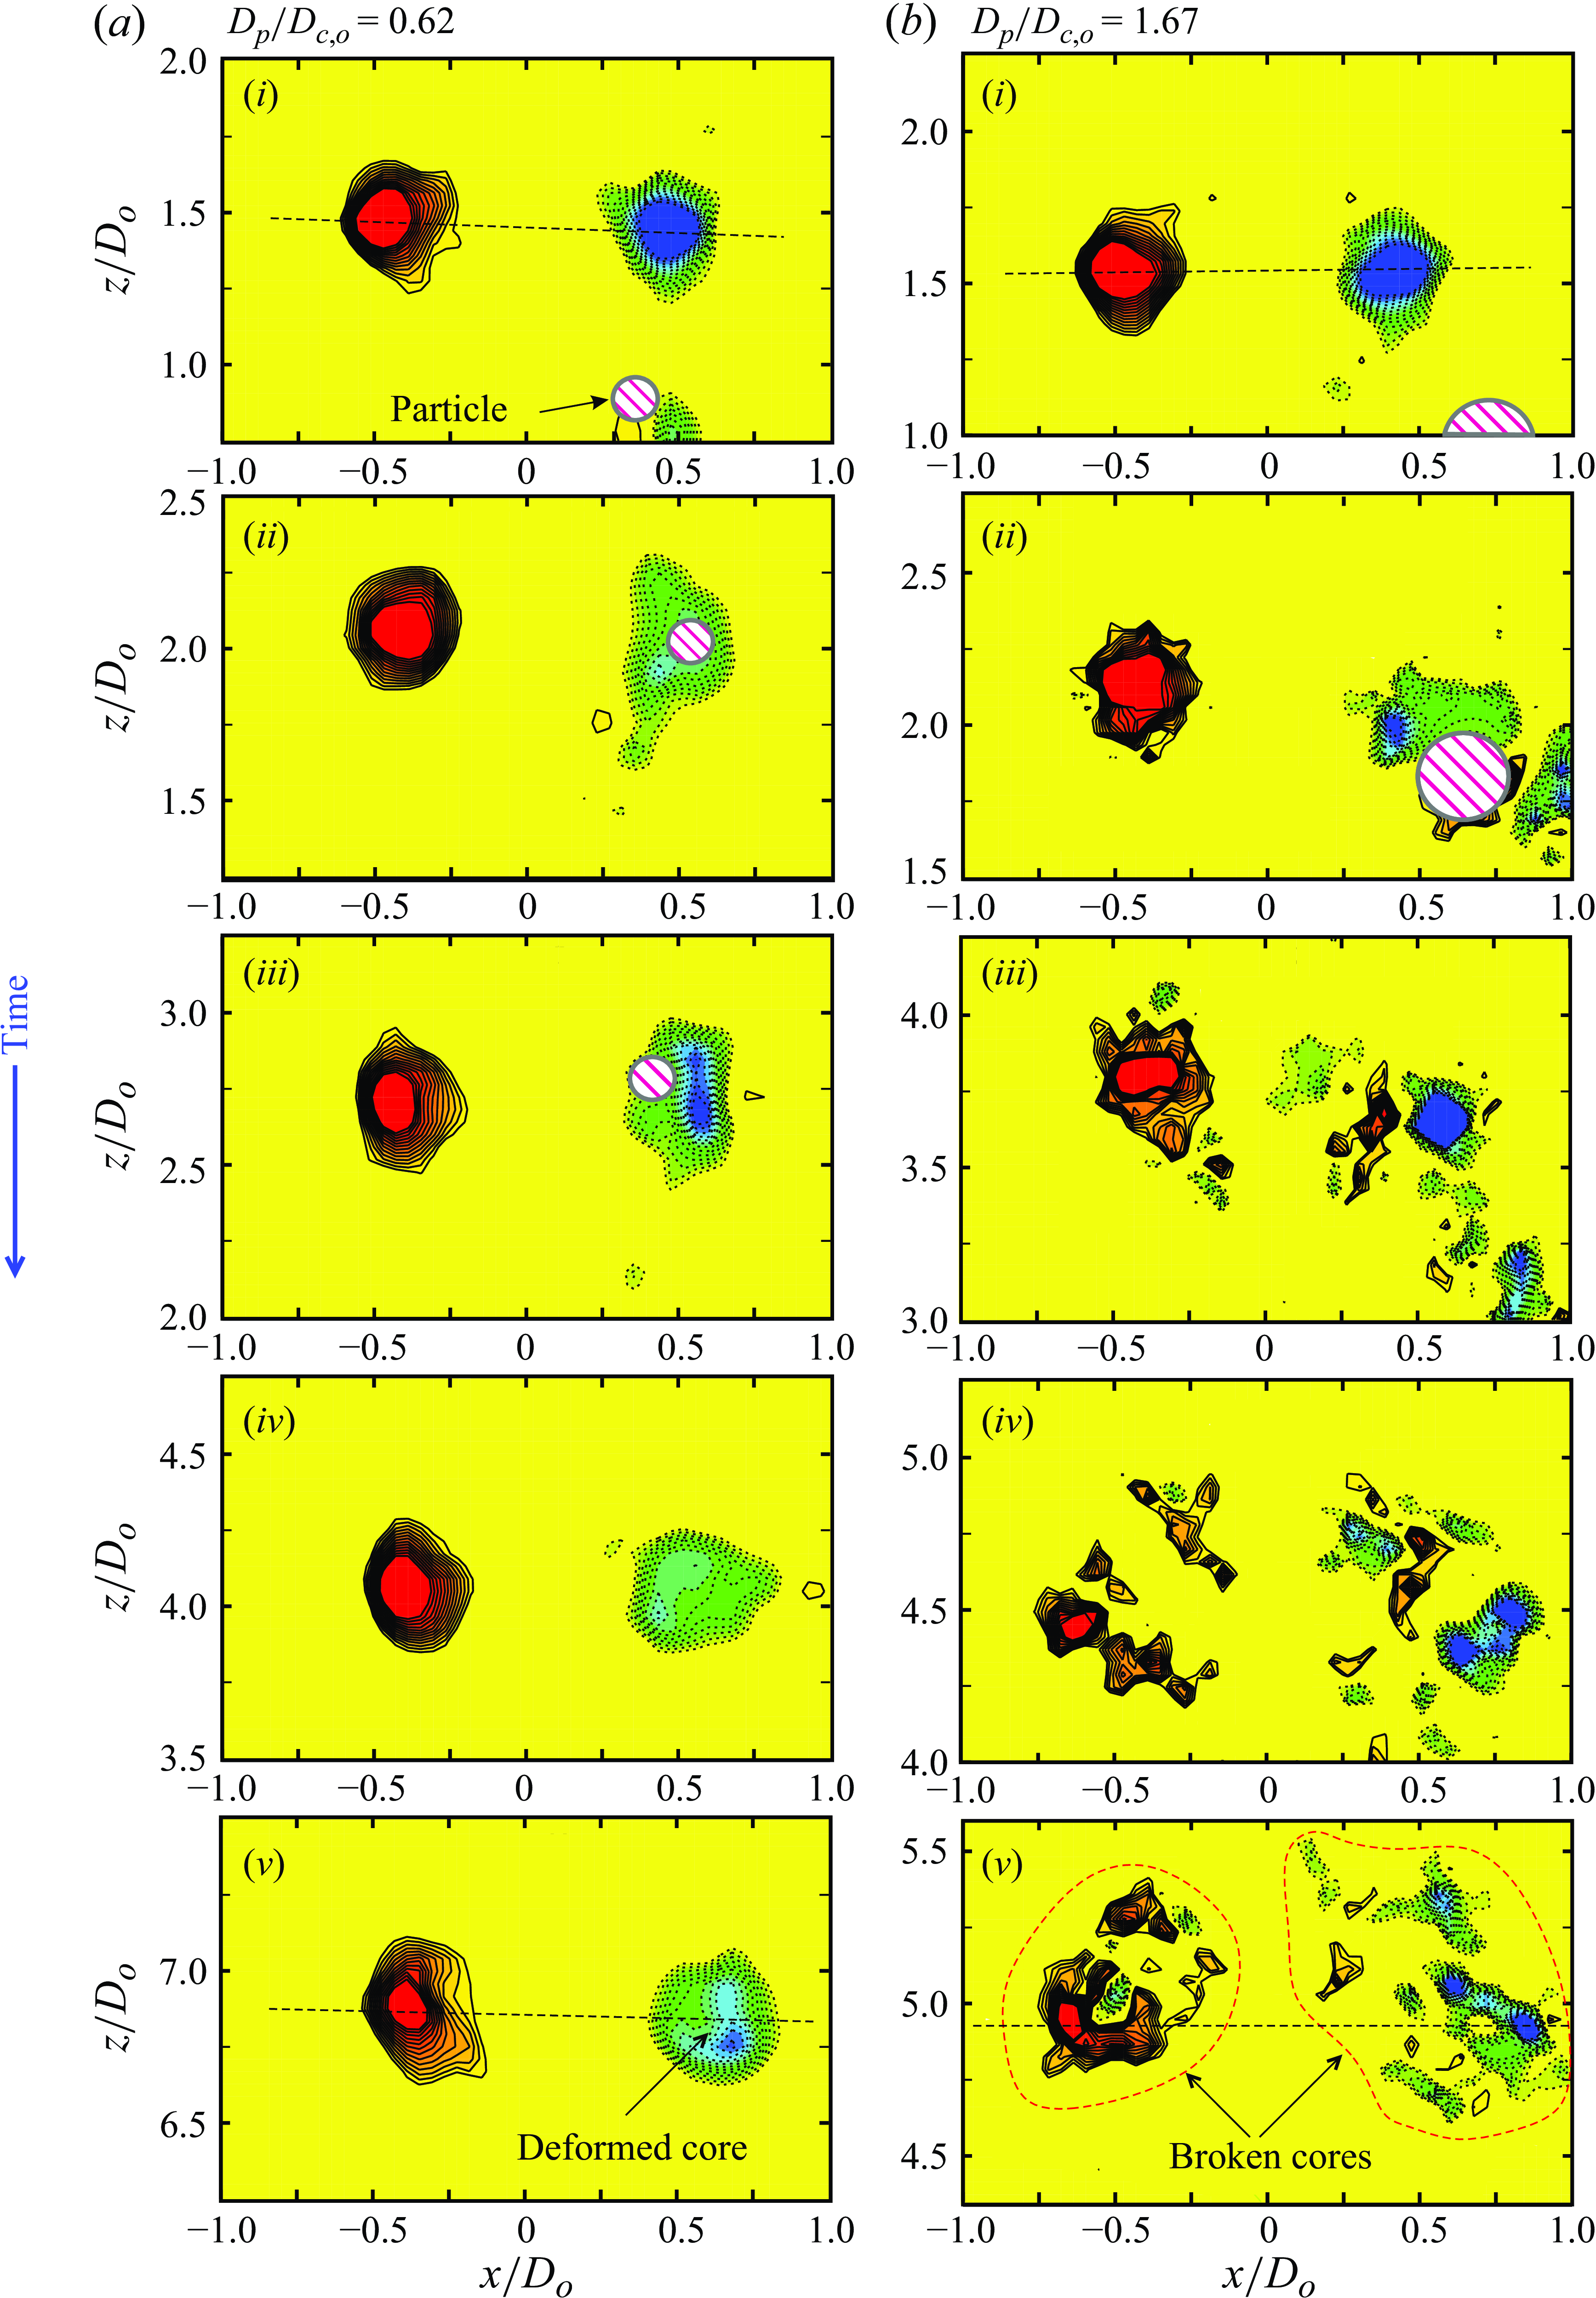
The azimuthal vorticity ( ${\omega }D_o/u_{co}$
) of both cores shown at different time instants, at
${\omega }D_o/u_{co}$
) of both cores shown at different time instants, at $Re$
of 67 300, for two particle sizes of (a)
$Re$
of 67 300, for two particle sizes of (a) $D_p/D_{c,o}$
= 0.62 and (b)
$D_p/D_{c,o}$
= 0.62 and (b) $D_p/D_{c,o}$
= 1.67. The
$D_p/D_{c,o}$
= 1.67. The $x$
and
$x$
and $z$
axes are normalised by the diameter of the vortex ring (
$z$
axes are normalised by the diameter of the vortex ring ( $D_o$
). The particle is marked as a hatched area (magenta). Here, solid and dashed line contours represent positive and negative vorticity, respectively. The time instants (
$D_o$
). The particle is marked as a hatched area (magenta). Here, solid and dashed line contours represent positive and negative vorticity, respectively. The time instants ( $t^{\ast }$
) shown are about (i) 1.31, (ii) 1.83, (iii) 2.05, (iv) 3.81 and (v) 7.33. The non-dimensional vorticity levels are
$t^{\ast }$
) shown are about (i) 1.31, (ii) 1.83, (iii) 2.05, (iv) 3.81 and (v) 7.33. The non-dimensional vorticity levels are $\pm$
16,
$\pm$
16, $\pm$
15,
$\pm$
15, $\pm$
14, …,
$\pm$
14, …, $\pm$
2. In the large-
$\pm$
2. In the large- $Re$
cases, since the convection speed of the vortex ring was higher than the particles’ rising speeds, the ring was generated behind the particle. This appears in (i) as the ring is under the particle.
$Re$
cases, since the convection speed of the vortex ring was higher than the particles’ rising speeds, the ring was generated behind the particle. This appears in (i) as the ring is under the particle.
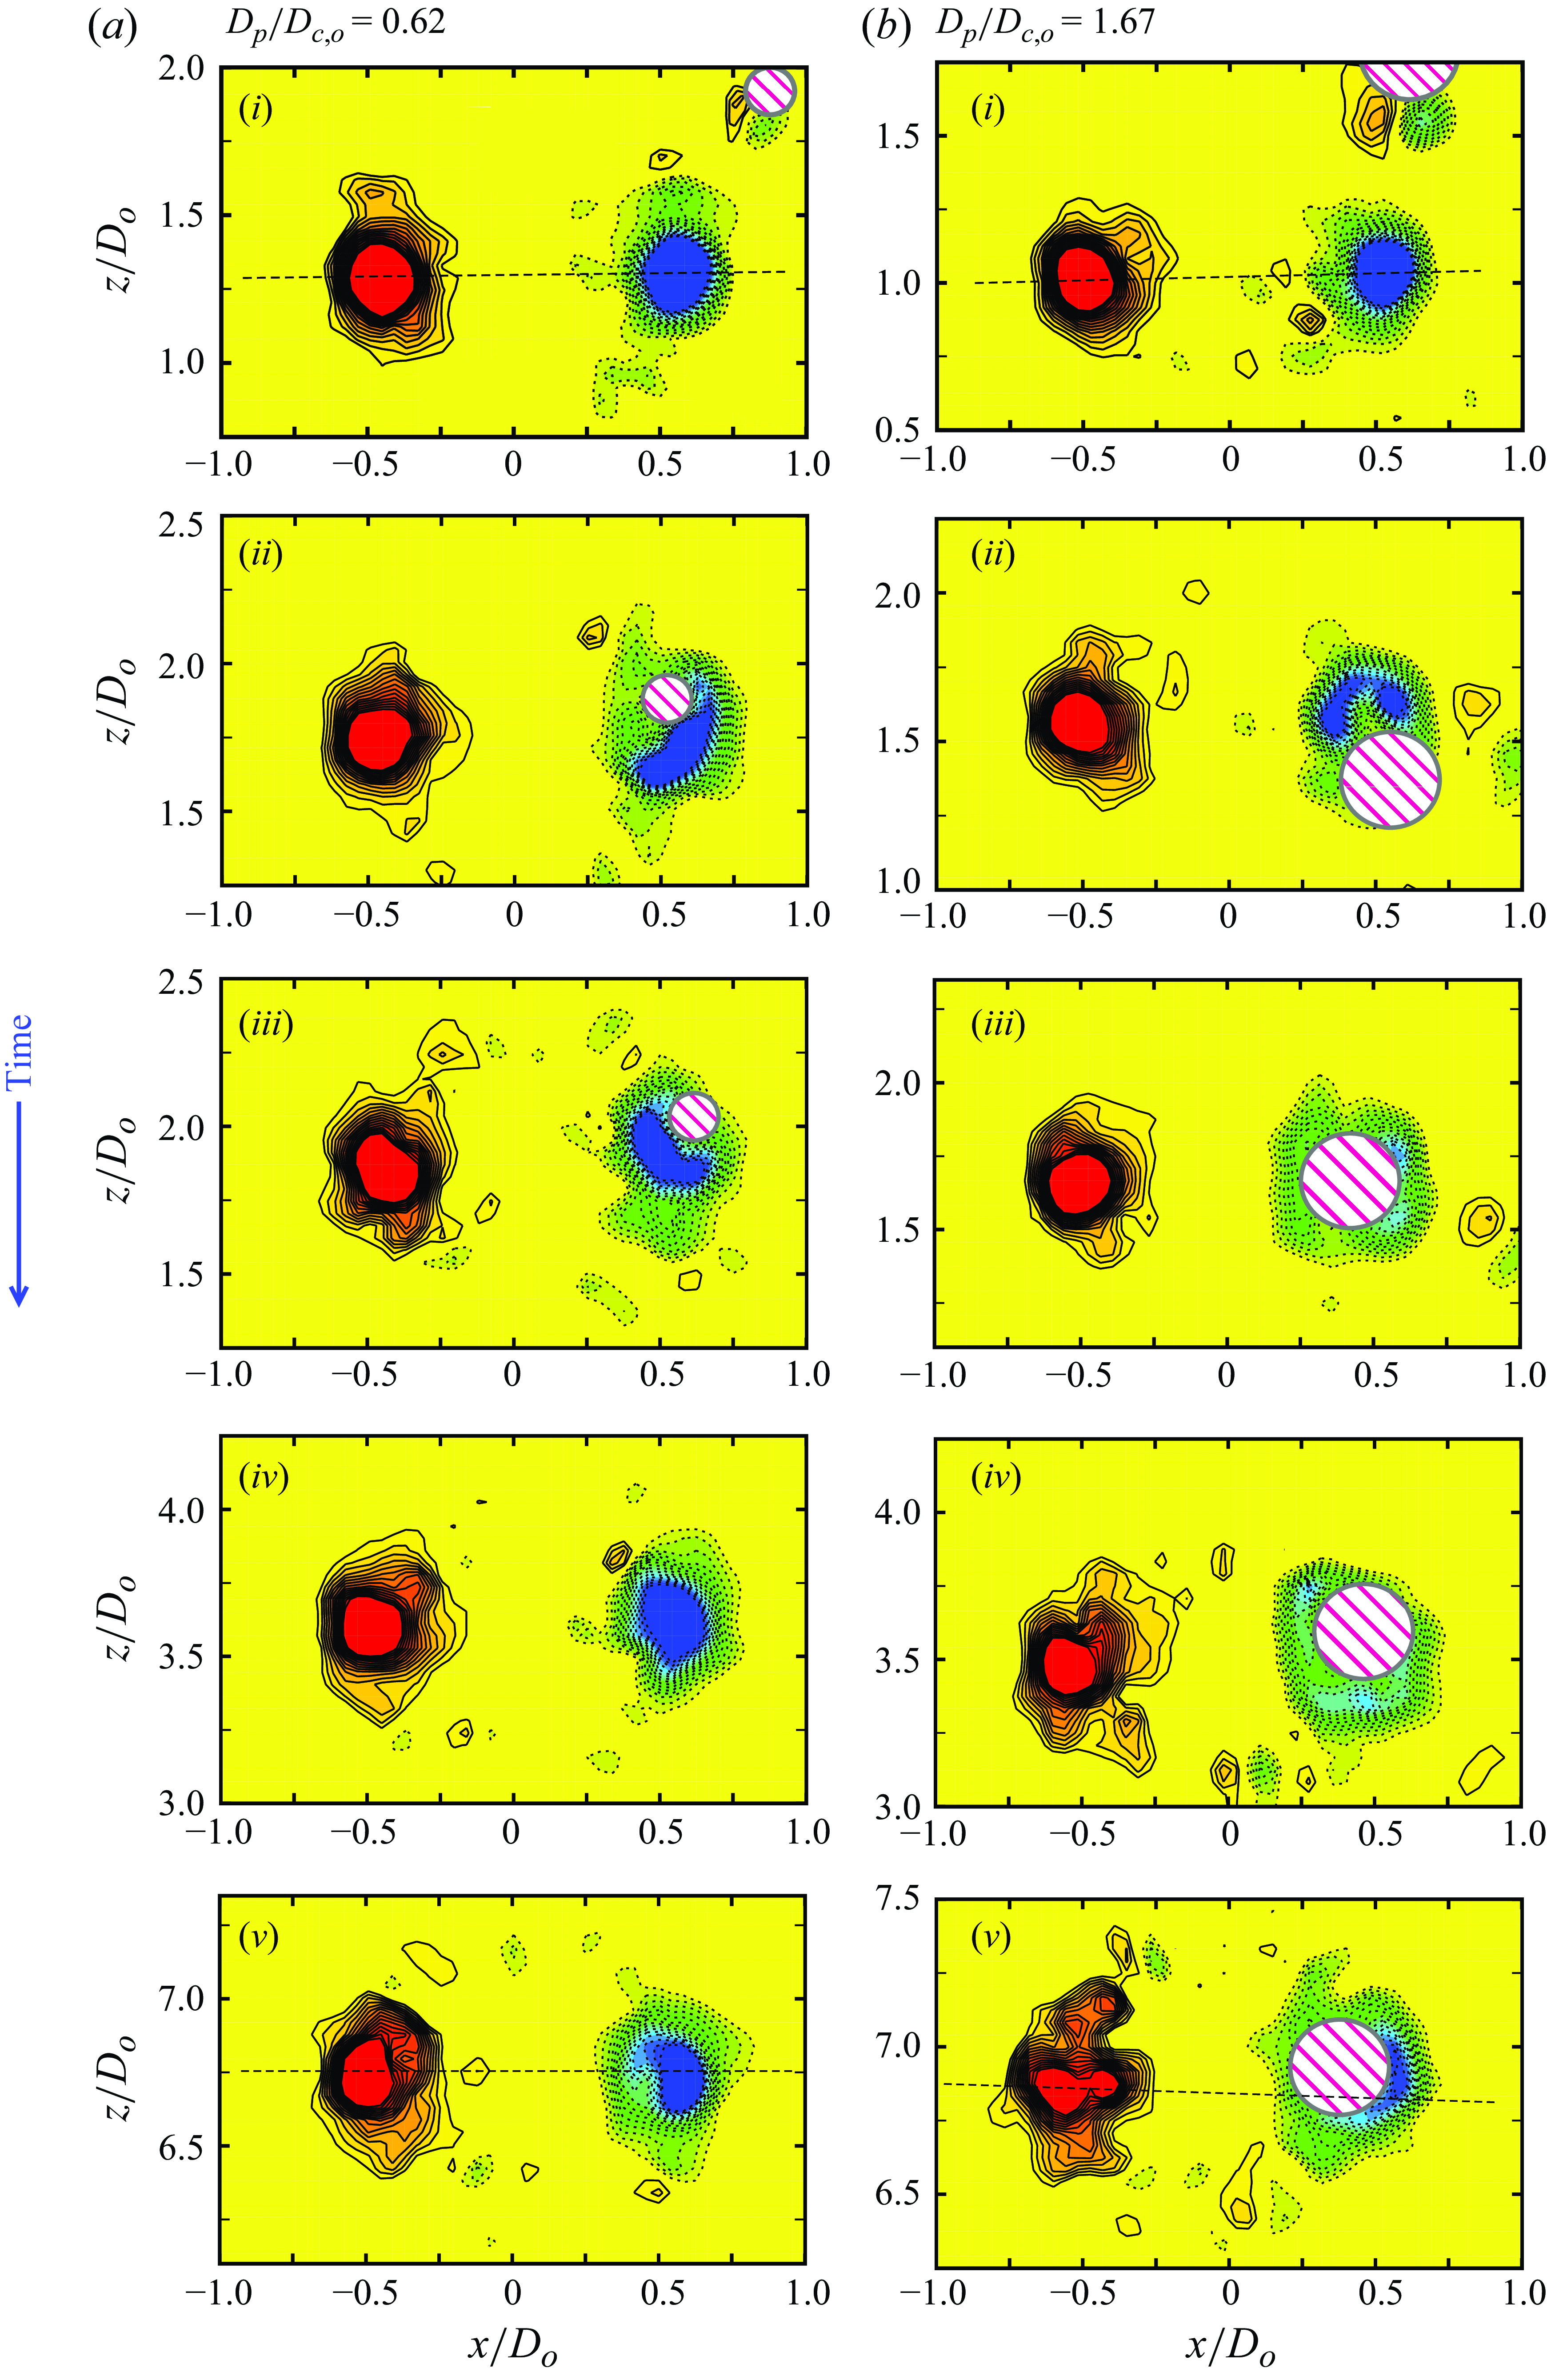
We begin with figure 15(a) corresponding to a smaller particle size ( $D_p/D_{c,o}$
= 0.62) interaction case. We can notice in figure 15(a(i)) that the particle is situated outside the vortex cores while approaching towards the vortex. Following this, in figure 15(a(ii)), the particle gets captured into the right vortex core, resulting in a deformed core with reduced peak vorticity. Moving forward in time, in figure 15(a(iii)), we find that the right-core deformation varies substantially compared with figure 15(a(ii)). Also noted across these two figures is the altered radial position of the particle, which we have discussed previously (figure 7
b). In the following time instant in figure 15(a(iv)), the absence of the particle is noted since the particle has already left the capture plane (right core) and has drifted (azimuthally) towards the out-of-plane direction. However, to be noted is that even after the particle has left its plane of capture, the deformation of the right core still persists, and moving further in time, the left vortex core deforms as well, as seen in figure 15(a(v)). This broadly indicates that the particle affects the vortex ring volumetrically. In this small-particle interaction, the mild deformation of the vortex cores and the reduction in the peak vorticity result in a smaller drop in enstrophy of about 10 %, as is discussed in § 4.3.2. However, such relatively weaker effects of the small particle on the ring do not translate into any considerable drop in the overall convection speed of the ring (
$D_p/D_{c,o}$
= 0.62) interaction case. We can notice in figure 15(a(i)) that the particle is situated outside the vortex cores while approaching towards the vortex. Following this, in figure 15(a(ii)), the particle gets captured into the right vortex core, resulting in a deformed core with reduced peak vorticity. Moving forward in time, in figure 15(a(iii)), we find that the right-core deformation varies substantially compared with figure 15(a(ii)). Also noted across these two figures is the altered radial position of the particle, which we have discussed previously (figure 7
b). In the following time instant in figure 15(a(iv)), the absence of the particle is noted since the particle has already left the capture plane (right core) and has drifted (azimuthally) towards the out-of-plane direction. However, to be noted is that even after the particle has left its plane of capture, the deformation of the right core still persists, and moving further in time, the left vortex core deforms as well, as seen in figure 15(a(v)). This broadly indicates that the particle affects the vortex ring volumetrically. In this small-particle interaction, the mild deformation of the vortex cores and the reduction in the peak vorticity result in a smaller drop in enstrophy of about 10 %, as is discussed in § 4.3.2. However, such relatively weaker effects of the small particle on the ring do not translate into any considerable drop in the overall convection speed of the ring ( $\approx$
5 %), as was seen previously in figure 13.
$\approx$
5 %), as was seen previously in figure 13.
In comparison with the small-particle case, the large-particle ( $D_p/D_{c,o}$
= 1.67) interaction in figure 15(b) is seen to be substantially different. As we notice, immediately from the instant of particle capture, the right vortex core undergoes large deformation and a large drop in the core’s peak vorticity, as clearly visible in figure 15(b(ii)). In addition, the left vortex core is also seen to be affected immediately. In figure 15(b(iii)), we notice the broken right core while the particle has already left the measurement plane (right core) and drifted (azimuthally) towards the out-of-plane direction. The deformed state of the vortex becomes worse over time, as seen in figure 15(b(iv)), where both the left and right vortex cores are fragmented. Also to be noted is that by this time, the particle had already left the vortex ring since such a broken vortex is no longer able to hold the particle. The vortex ring, with such broken (cores) and a highly deformed state, experiences a substantial drop in azimuthal enstrophy of about 90 %, as is shown in § 4.3.2. In such large particle interaction cases, the effects of the particle on the vortex ring are more lasting even after the escape of the particle, which results in a significant drop in the ring’s convection speed by about 60 % (compared with the base ring), as was discussed previously in § 4.1. It may be noted that such fragmentation/breakup of a vortex into smaller structures is analogous to the energy cascade through the weakening/breakup of near-wall coherent structures in turbulent shear flows (Weiss Reference Weiss1991) and particle-laden turbulence (Dritselis & Vlachos Reference Dritselis and Vlachos2008; Feng et al. Reference Feng, Liu and Zheng2024).
$D_p/D_{c,o}$
= 1.67) interaction in figure 15(b) is seen to be substantially different. As we notice, immediately from the instant of particle capture, the right vortex core undergoes large deformation and a large drop in the core’s peak vorticity, as clearly visible in figure 15(b(ii)). In addition, the left vortex core is also seen to be affected immediately. In figure 15(b(iii)), we notice the broken right core while the particle has already left the measurement plane (right core) and drifted (azimuthally) towards the out-of-plane direction. The deformed state of the vortex becomes worse over time, as seen in figure 15(b(iv)), where both the left and right vortex cores are fragmented. Also to be noted is that by this time, the particle had already left the vortex ring since such a broken vortex is no longer able to hold the particle. The vortex ring, with such broken (cores) and a highly deformed state, experiences a substantial drop in azimuthal enstrophy of about 90 %, as is shown in § 4.3.2. In such large particle interaction cases, the effects of the particle on the vortex ring are more lasting even after the escape of the particle, which results in a significant drop in the ring’s convection speed by about 60 % (compared with the base ring), as was discussed previously in § 4.1. It may be noted that such fragmentation/breakup of a vortex into smaller structures is analogous to the energy cascade through the weakening/breakup of near-wall coherent structures in turbulent shear flows (Weiss Reference Weiss1991) and particle-laden turbulence (Dritselis & Vlachos Reference Dritselis and Vlachos2008; Feng et al. Reference Feng, Liu and Zheng2024).
In comparison with the low- $Re$
cases, the large-
$Re$
cases, the large- $Re$
interactions in figure 16(a,b) are found to be substantially different, where despite the increase in the particle size, the vortex cores remain broadly intact, for example, in figures 16(a(iii)) and 16(b(iii)). However, there would be clearly visible differences across different particle sizes in terms of the particle dynamics and core vorticity modifications, as we discuss here. In the smaller-particle case, immediately after capture, the right core shows deformation, as in figure 16(a(ii,iii)). Following this, after the particle had left the right core and drifted azimuthally in the out-of-plane direction (following figure 16(a(iv))), the right core had come back to the nearly undeformed state (figure 16(a(iv))), with some minor reductions in the core vorticity. At a relatively later time of interactions, as in figure 16(a(v)), we find very minor reductions in core vorticity, which is also seen from the radial vorticity distribution in figure 17(b(i)), obtained along the dashed line in vorticity contours in figure 16(a(v)). In comparison with the smaller-particle interaction, the large-particle case shows a higher deformation of the vortex cores, with the deformation being more dramatic for the right core. Also to be noted is that the particle stays much longer at the right core. In addition, there is a considerable drop in cores’ vorticity, as indicated by the radial vorticity distribution, shown in figure 17(b(ii)), unlike the smaller-particle case, in figure 17(b(i)). Such extensive deformations of the vortex core and reductions in the peak vorticity by the large particle lead to a large reduction in the azimuthal enstrophy, as is discussed later.
$Re$
interactions in figure 16(a,b) are found to be substantially different, where despite the increase in the particle size, the vortex cores remain broadly intact, for example, in figures 16(a(iii)) and 16(b(iii)). However, there would be clearly visible differences across different particle sizes in terms of the particle dynamics and core vorticity modifications, as we discuss here. In the smaller-particle case, immediately after capture, the right core shows deformation, as in figure 16(a(ii,iii)). Following this, after the particle had left the right core and drifted azimuthally in the out-of-plane direction (following figure 16(a(iv))), the right core had come back to the nearly undeformed state (figure 16(a(iv))), with some minor reductions in the core vorticity. At a relatively later time of interactions, as in figure 16(a(v)), we find very minor reductions in core vorticity, which is also seen from the radial vorticity distribution in figure 17(b(i)), obtained along the dashed line in vorticity contours in figure 16(a(v)). In comparison with the smaller-particle interaction, the large-particle case shows a higher deformation of the vortex cores, with the deformation being more dramatic for the right core. Also to be noted is that the particle stays much longer at the right core. In addition, there is a considerable drop in cores’ vorticity, as indicated by the radial vorticity distribution, shown in figure 17(b(ii)), unlike the smaller-particle case, in figure 17(b(i)). Such extensive deformations of the vortex core and reductions in the peak vorticity by the large particle lead to a large reduction in the azimuthal enstrophy, as is discussed later.
The azimuthal vorticity ( ${\omega }D_o/u_{co}$
) of both the cores along the radial (dashed) line, as indicated in figures 15(a(i,v),b(i,v)) and 16(a(i,v),b(i,v)), shown at two time instants of
${\omega }D_o/u_{co}$
) of both the cores along the radial (dashed) line, as indicated in figures 15(a(i,v),b(i,v)) and 16(a(i,v),b(i,v)), shown at two time instants of $t^{\ast }$
= 1.75 (before capture) and
$t^{\ast }$
= 1.75 (before capture) and $t^{\ast }$
= 7.5 (later time). The cases shown here are for two
$t^{\ast }$
= 7.5 (later time). The cases shown here are for two $D_p/D_{c,o}$
of 0.62 and 1.67 at (a)
$D_p/D_{c,o}$
of 0.62 and 1.67 at (a) $Re$
= 6000 and (b)
$Re$
= 6000 and (b) $Re$
= 67 300. In (b(ii)), the vorticity is not shown for
$Re$
= 67 300. In (b(ii)), the vorticity is not shown for $t^{\ast }$
= 7.5 (dashed line), since the area was masked (dashed rectangle) due to the presence of the particle, as seen in figure 16(b(v)).
$t^{\ast }$
= 7.5 (dashed line), since the area was masked (dashed rectangle) due to the presence of the particle, as seen in figure 16(b(v)).
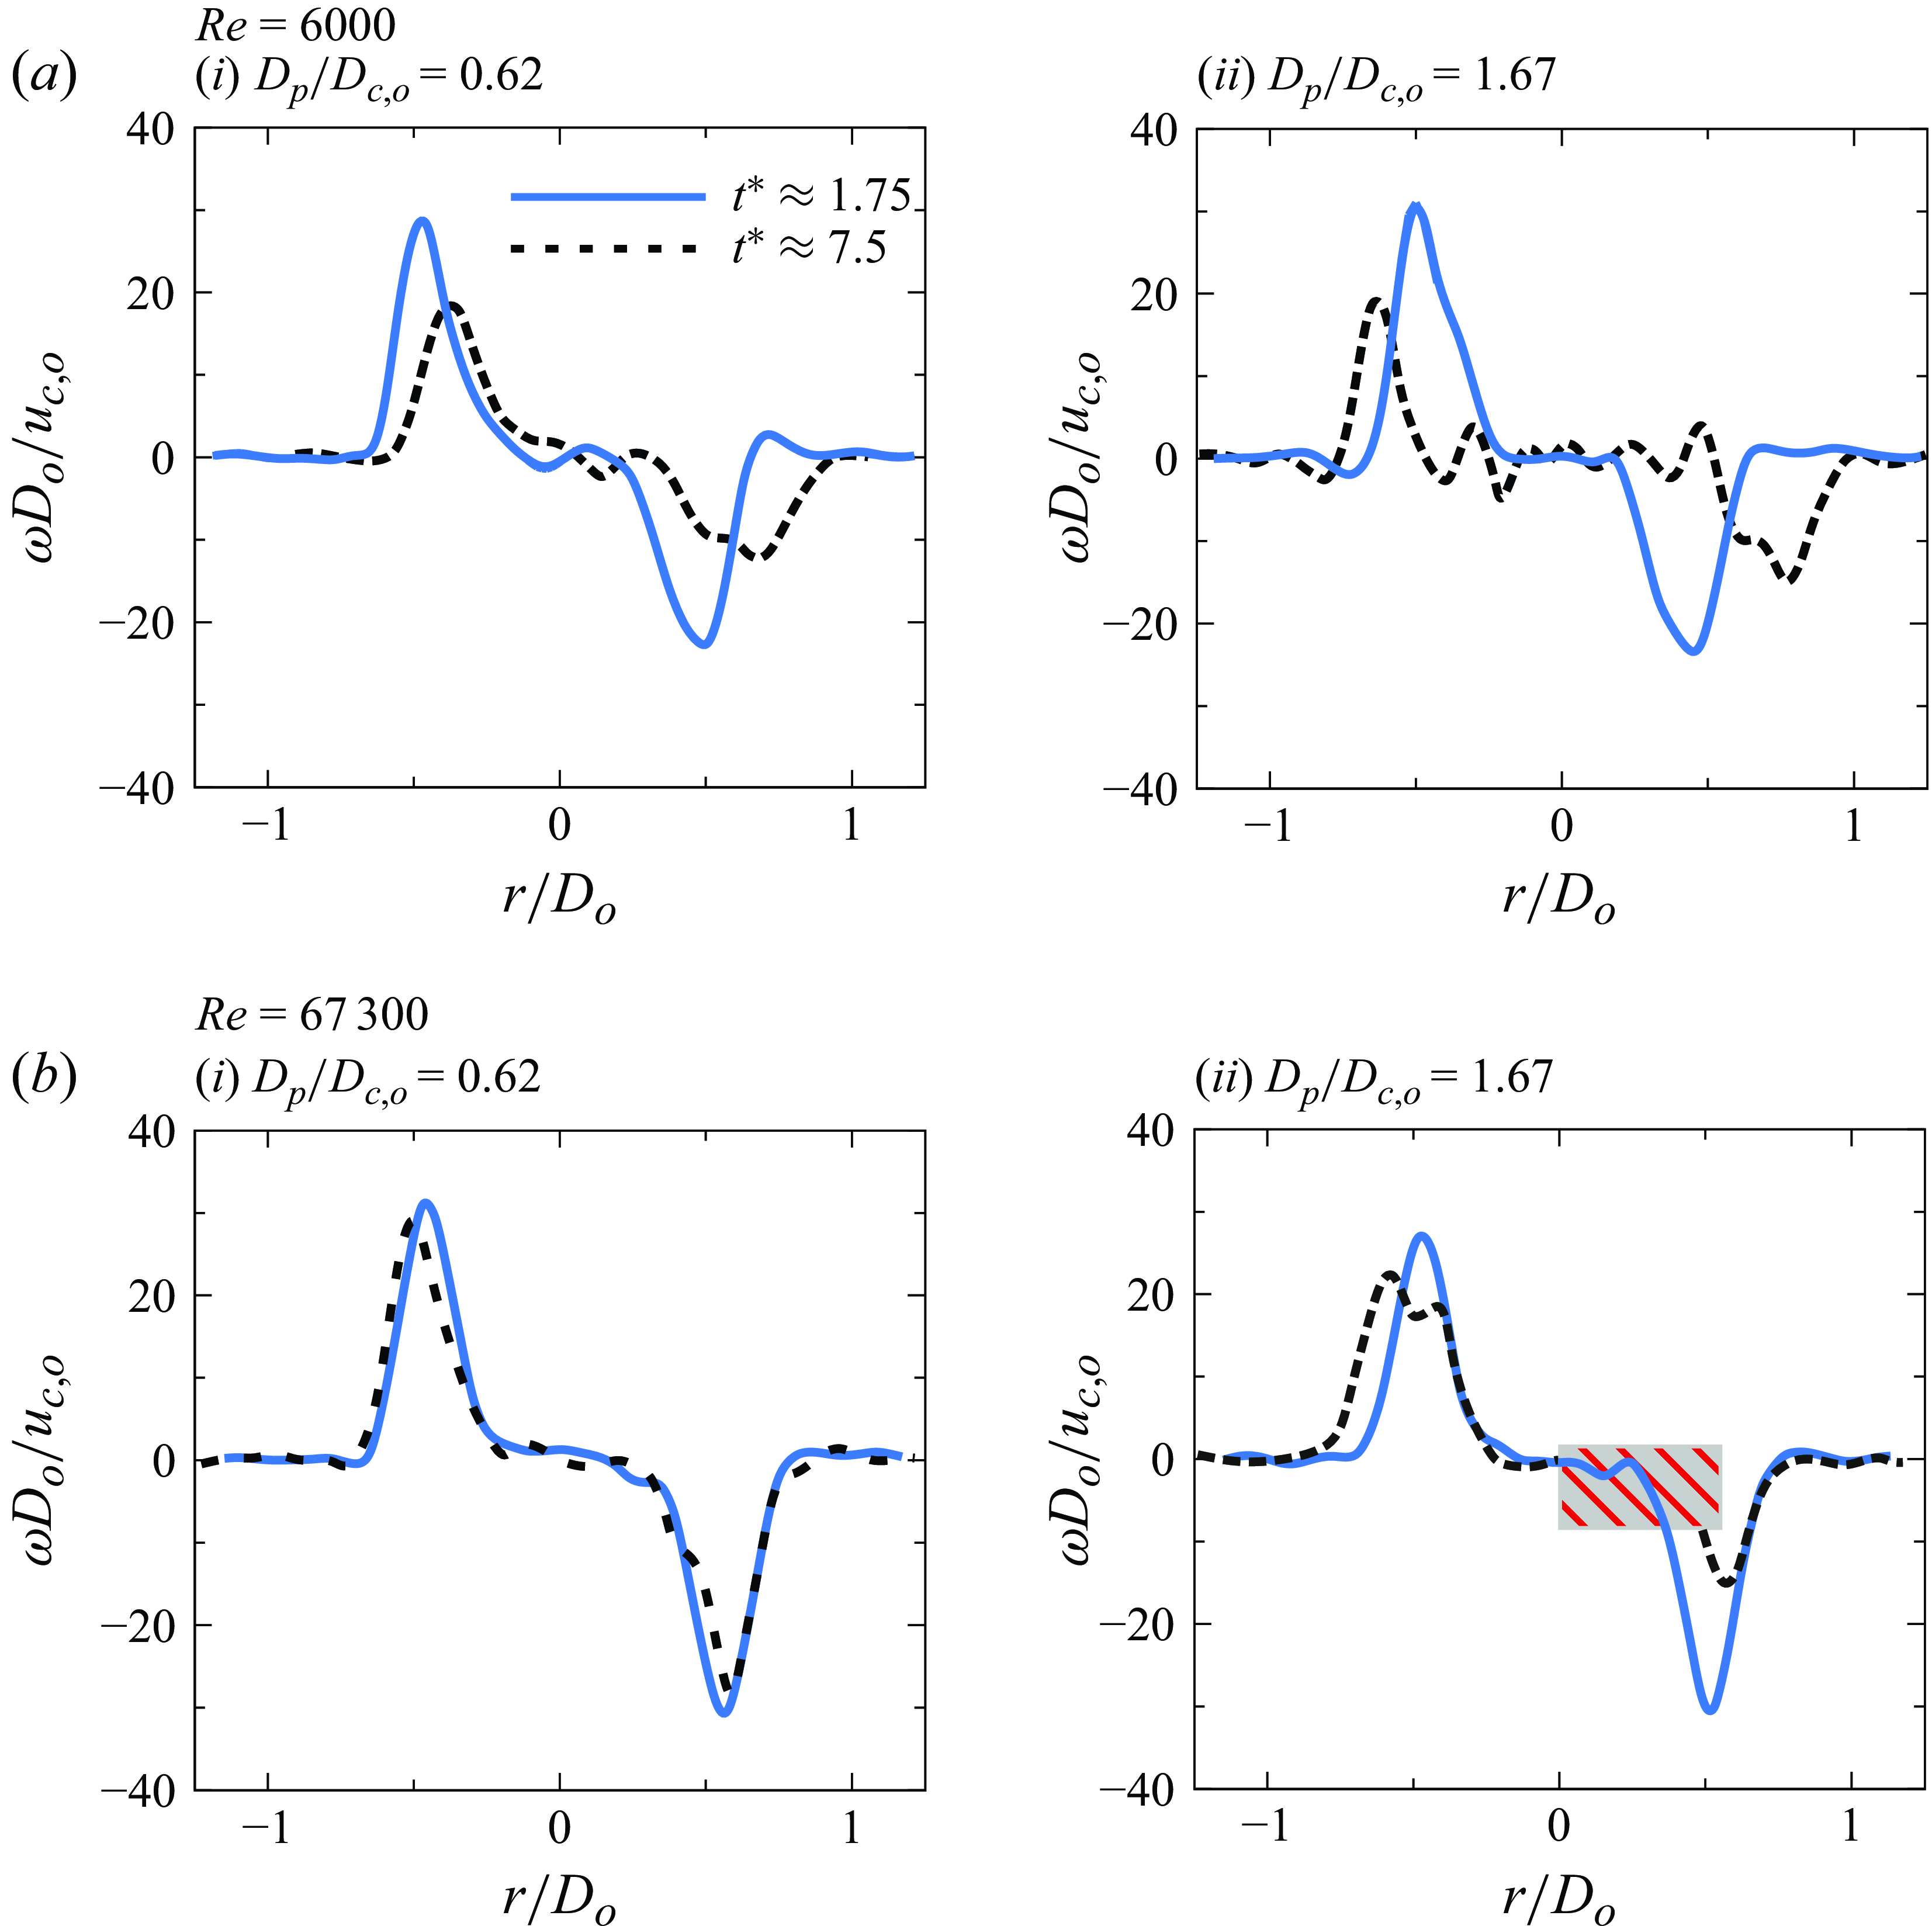
In summary, increasing particle size leads to an increasing deformation of the vortex core, which is related to the fact that the larger particle has a higher local particle-to-core size ratio, thus acting like a larger perturbation to the vortex ring. The particle size effects are more dramatic in low- $Re$
cases, where the effects of a large particle on the ring would be more lasting, where even after the particle had left the core, the ring would still be substantially deformed with a broken/fragmented core, essentially losing its coherence. Such fragmentation/breakup of a vortex into smaller structures is analogous to the energy cascade in turbulent shear flows (Weiss Reference Weiss1991) and breakup of vortices in particle-laden turbulence (Dritselis & Vlachos Reference Dritselis and Vlachos2008; Feng et al. Reference Feng, Liu and Zheng2024). At large
$Re$
cases, where the effects of a large particle on the ring would be more lasting, where even after the particle had left the core, the ring would still be substantially deformed with a broken/fragmented core, essentially losing its coherence. Such fragmentation/breakup of a vortex into smaller structures is analogous to the energy cascade in turbulent shear flows (Weiss Reference Weiss1991) and breakup of vortices in particle-laden turbulence (Dritselis & Vlachos Reference Dritselis and Vlachos2008; Feng et al. Reference Feng, Liu and Zheng2024). At large $Re$
, despite increasing core deformation with increasing particle size, the vortex cores remain broadly intact and coherent, which indicates that in turbulent flows at large Reynolds numbers, increasing the particle size would not make any considerable difference to the disruption of the intense vortices. These observations, in connection with particle-laden turbulent flows, indicate that in cases where disruption of the vortices would be the primary mechanism for turbulence modulations, increasing particle size would make considerable differences at low
$Re$
, despite increasing core deformation with increasing particle size, the vortex cores remain broadly intact and coherent, which indicates that in turbulent flows at large Reynolds numbers, increasing the particle size would not make any considerable difference to the disruption of the intense vortices. These observations, in connection with particle-laden turbulent flows, indicate that in cases where disruption of the vortices would be the primary mechanism for turbulence modulations, increasing particle size would make considerable differences at low $Re$
. However, the particle size effects would diminish with increasing
$Re$
. However, the particle size effects would diminish with increasing $Re$
since the vortical structures would become more intense at larger
$Re$
since the vortical structures would become more intense at larger $Re$
, and the particle would not be able to substantially disrupt those intense structures.
$Re$
, and the particle would not be able to substantially disrupt those intense structures.
4.3.2. Azimuthal enstrophy
In turbulent flows, enstrophy is a good indicator of the coherence of vortices (Hu & Peterson Reference Hu and Peterson2021), and also plays a key role in characterising the energy cascade (Weiss Reference Weiss1991) and the vortical motions (McWilliams Reference Mcwilliams1990; Kerr Reference Kerr2012). In the present context, since the propagation of the vortex ring is an integral effect of the vorticity distribution within it, it is useful to help better understand the reduction in convection speed. In the present case, since two-dimensional PIV measurements have been conducted, the azimuthal enstrophy of the vortex ring is quantified by performing an area integral of the azimuthal vorticity squared ( $E=\int {\omega }^{2}\, {\rm d}A$
), performed over a substantial area encompassing both cores and ensuring the inclusion of all in plane azimuthal vorticity. It can be noted that the particle area is not included in the cross-sectional area used to compute the enstrophy (
$E=\int {\omega }^{2}\, {\rm d}A$
), performed over a substantial area encompassing both cores and ensuring the inclusion of all in plane azimuthal vorticity. It can be noted that the particle area is not included in the cross-sectional area used to compute the enstrophy ( $E$
) for all the cases shown. There was no velocity/vorticity in that (particle) area since it was excluded from the domain during PIV processing. Figure 18 illustrates the influence of
$E$
) for all the cases shown. There was no velocity/vorticity in that (particle) area since it was excluded from the domain during PIV processing. Figure 18 illustrates the influence of $D_p/D_{c,o}$
on the temporal evolution of the azimuthal enstrophy, at low (
$D_p/D_{c,o}$
on the temporal evolution of the azimuthal enstrophy, at low ( $Re=6000$
) and high (
$Re=6000$
) and high ( $Re=67\,300$
) Reynolds numbers, alongside the respective base cases. The enstrophy is normalised by its respective initial value (
$Re=67\,300$
) Reynolds numbers, alongside the respective base cases. The enstrophy is normalised by its respective initial value ( $E_o$
) just before the particle capture and is shown for the individual cores (left ‘L’, and right ‘R’) and the average of both cores (‘B’). In the base ring (no-particle) case, a slow and gradual reduction in enstrophy over time is observed due to the viscous diffusion of the core. This can be noted as
$E_o$
) just before the particle capture and is shown for the individual cores (left ‘L’, and right ‘R’) and the average of both cores (‘B’). In the base ring (no-particle) case, a slow and gradual reduction in enstrophy over time is observed due to the viscous diffusion of the core. This can be noted as $E/E_o$
reaches a value
$E/E_o$
reaches a value $\approx$
0.9 at later times (
$\approx$
0.9 at later times ( $t^{\ast }\approx$
7.5), indicating a roughly 10 % reduction in both low-
$t^{\ast }\approx$
7.5), indicating a roughly 10 % reduction in both low- $Re$
and high-
$Re$
and high- $Re$
base rings. In the interaction cases, the particle capture occurs at a dimensionless time
$Re$
base rings. In the interaction cases, the particle capture occurs at a dimensionless time $t^{\ast }$
of about 1.3, following which the enstrophy variation with time is dramatically different from that of the base vortex ring as seen in the figure, and also varies substantially with particle size and
$t^{\ast }$
of about 1.3, following which the enstrophy variation with time is dramatically different from that of the base vortex ring as seen in the figure, and also varies substantially with particle size and $Re$
, as discussed below.
$Re$
, as discussed below.
The variation of the azimuthal enstrophy ( $E(t^{\ast })/E_o$
) is shown with time (
$E(t^{\ast })/E_o$
) is shown with time ( $t^{\ast }$
) for base ring and two particle size interaction cases; here, the instantaneous enstrophy (
$t^{\ast }$
) for base ring and two particle size interaction cases; here, the instantaneous enstrophy ( $E(t^{\ast })$
) is normalised by the enstrophy (
$E(t^{\ast })$
) is normalised by the enstrophy ( $E_o$
) before the particle capture. The left core (‘L’), right core (‘R’) and both cores’ average (‘B’) enstrophy are shown, along with the respective scalings with time for both cores’ average enstrophy, as indicated by the dashed lines: the base ring (dashed black) and the interaction cases at
$E_o$
) before the particle capture. The left core (‘L’), right core (‘R’) and both cores’ average (‘B’) enstrophy are shown, along with the respective scalings with time for both cores’ average enstrophy, as indicated by the dashed lines: the base ring (dashed black) and the interaction cases at $D_p/D_{c,o}$
of 0.62 (dashed blue) and 1.67 (dashed red).
$D_p/D_{c,o}$
of 0.62 (dashed blue) and 1.67 (dashed red).
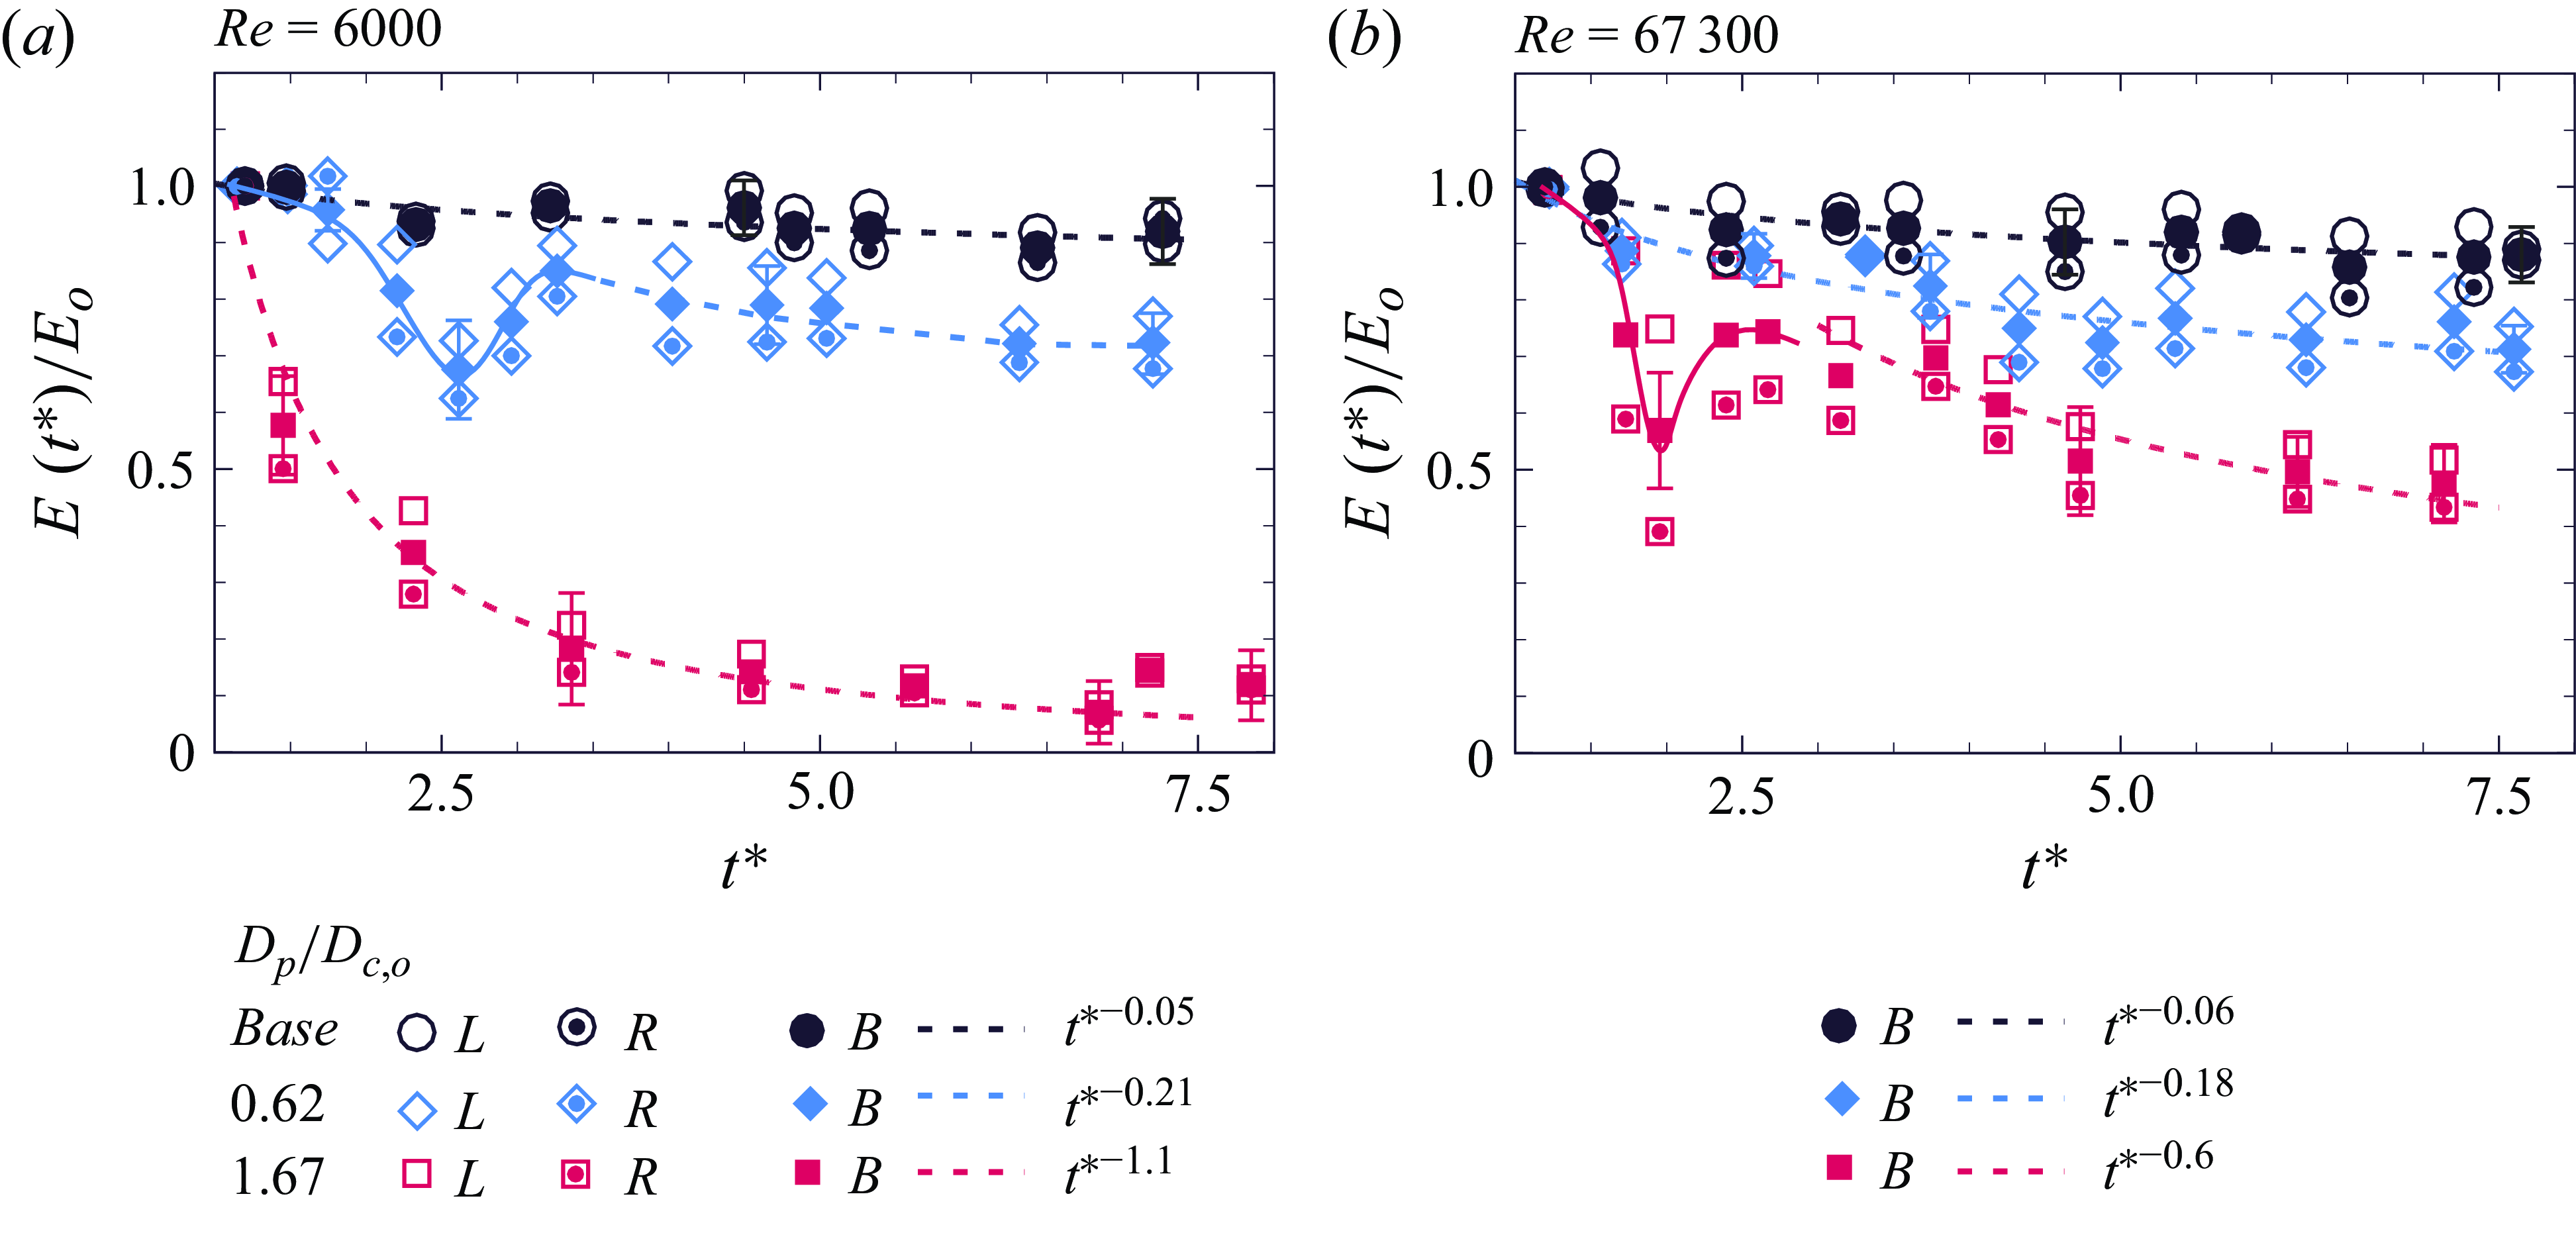
The enstrophy, as with other parameters seen before, is seen to have more dramatic effects in the case of the lower- $Re$
ring (
$Re$
ring ( $Re$
= 6000), as seen in figure 18(a). The smaller-particle (
$Re$
= 6000), as seen in figure 18(a). The smaller-particle ( $D_p/D_{c,o}$
= 0.62) case here shows a reduction of about 20 % in enstrophy at a later time, which is larger than the reduction seen in the base ring. A closer look at the time-varying nature of enstrophy, in this case, shows that there is a drop in enstrophy after the particle capture (at
$D_p/D_{c,o}$
= 0.62) case here shows a reduction of about 20 % in enstrophy at a later time, which is larger than the reduction seen in the base ring. A closer look at the time-varying nature of enstrophy, in this case, shows that there is a drop in enstrophy after the particle capture (at $t^{\ast }\approx$
1.75), which is attributed to the deformation of the vortex core and reduction in peak vorticity (see figure 15
a(ii)). Moving forward in time, the enstrophy increases (in the measurement plane) as the vortex core regains its shape (figure 15
a(iv)) after the particle has drifted azimuthally in the out-of-plane direction. Subsequently, there is a more gradual reduction in enstrophy, as
$t^{\ast }\approx$
1.75), which is attributed to the deformation of the vortex core and reduction in peak vorticity (see figure 15
a(ii)). Moving forward in time, the enstrophy increases (in the measurement plane) as the vortex core regains its shape (figure 15
a(iv)) after the particle has drifted azimuthally in the out-of-plane direction. Subsequently, there is a more gradual reduction in enstrophy, as $\propto {t^{\ast }}^{-0.21}$
(both cores averaged), with about 10 % drop compared with the base ring, at later times. This trend of enstrophy increasing after the drop is observed up to
$\propto {t^{\ast }}^{-0.21}$
(both cores averaged), with about 10 % drop compared with the base ring, at later times. This trend of enstrophy increasing after the drop is observed up to $D_p/D_{c,o} = 1.05$
and not seen for larger
$D_p/D_{c,o} = 1.05$
and not seen for larger $D_p/D_{c,o}$
, as we discuss later. It may be noted that the left (L) and right core (R) enstrophy showed some differences in the initial phase of interactions, with the right core experiencing a greater drop due to relatively larger deformation occurring from particle capture within it. However, in the later phase, the enstrophy of the right (R) and left (L) cores becomes nearly the same and hence also close to the average value of enstrophy of both cores (B).
$D_p/D_{c,o}$
, as we discuss later. It may be noted that the left (L) and right core (R) enstrophy showed some differences in the initial phase of interactions, with the right core experiencing a greater drop due to relatively larger deformation occurring from particle capture within it. However, in the later phase, the enstrophy of the right (R) and left (L) cores becomes nearly the same and hence also close to the average value of enstrophy of both cores (B).
The evolution of enstrophy in large-particle cases is dramatically different from that of the smaller-particle case discussed above. This is illustrated by the $D_p/D_{c,o}$
of 1.67 case also shown in figure 18(a), where we notice an immediate (sharp) large drop in enstrophy after the particle capture, following a scaling of
$D_p/D_{c,o}$
of 1.67 case also shown in figure 18(a), where we notice an immediate (sharp) large drop in enstrophy after the particle capture, following a scaling of ${t^{\ast }}^{-1.1}$
(both cores averaged) which at later times reaches an asymptotic value that is close to 0.1, indicating a dramatic drop in enstrophy of close to 90 %. This dramatic drop is attributed to the large reduction in peak vorticity and very large deformation of the core(s). In such interaction cases, we do not find any recovery/increase in enstrophy since even after the particle has left the ring, the core deformation is permanent and eventually leads to fragmentation of the core resulting in a significant enstrophy reduction of around 90 % at a later time. It may be noted that in the large-particle interaction case, enstrophy reductions in the initial phase of interactions are different from that in bubble–ring interactions (Biswas & Govardhan Reference Biswas and Govardhan2022), where they reported a local increase in enstrophy as the bubble elongates azimuthally within the ring post-capture, a phenomenon that does not occur in the present rigid-particle case.
${t^{\ast }}^{-1.1}$
(both cores averaged) which at later times reaches an asymptotic value that is close to 0.1, indicating a dramatic drop in enstrophy of close to 90 %. This dramatic drop is attributed to the large reduction in peak vorticity and very large deformation of the core(s). In such interaction cases, we do not find any recovery/increase in enstrophy since even after the particle has left the ring, the core deformation is permanent and eventually leads to fragmentation of the core resulting in a significant enstrophy reduction of around 90 % at a later time. It may be noted that in the large-particle interaction case, enstrophy reductions in the initial phase of interactions are different from that in bubble–ring interactions (Biswas & Govardhan Reference Biswas and Govardhan2022), where they reported a local increase in enstrophy as the bubble elongates azimuthally within the ring post-capture, a phenomenon that does not occur in the present rigid-particle case.
In comparison with the lower- $Re$
case above, the higher-Reynolds-number interactions (
$Re$
case above, the higher-Reynolds-number interactions ( $Re$
= 67 300) in figure 18(b) show less dramatic effects as may be expected from smaller changes seen in the corresponding vorticity distributions in figure 16 compared with that in figure 15 for the lower-
$Re$
= 67 300) in figure 18(b) show less dramatic effects as may be expected from smaller changes seen in the corresponding vorticity distributions in figure 16 compared with that in figure 15 for the lower- $Re$
case. In the case of the smaller particle (
$Re$
case. In the case of the smaller particle ( $D_p/D_{c,o}$
= 0.62) in this large-
$D_p/D_{c,o}$
= 0.62) in this large- $Re$
case, we find a smooth gradual enstrophy reduction with time that follows the scaling
$Re$
case, we find a smooth gradual enstrophy reduction with time that follows the scaling ${t^{\ast }}^{-0.18}$
(both cores averaged). This is different from the corresponding low-
${t^{\ast }}^{-0.18}$
(both cores averaged). This is different from the corresponding low- $Re$
case, where we observed an initial enstrophy drop that was followed by an increase and then a more gradual reduction in enstrophy at late times. This difference is likely due to the relatively slower post-capture drop in the core peak vorticity at large
$Re$
case, where we observed an initial enstrophy drop that was followed by an increase and then a more gradual reduction in enstrophy at late times. This difference is likely due to the relatively slower post-capture drop in the core peak vorticity at large $Re$
compared with low
$Re$
compared with low $Re$
. However, at later times, the drop in enstrophy is nearly similar for both
$Re$
. However, at later times, the drop in enstrophy is nearly similar for both $Re$
at this
$Re$
at this $D_p/D_{c,o}$
of 0.62. The larger
$D_p/D_{c,o}$
of 0.62. The larger $D_p/D_{c,o}$
of 1.67 at
$D_p/D_{c,o}$
of 1.67 at $Re$
of 67 300, however, does show a sharp drop in enstrophy immediately after particle capture, and this is due to the core deformation and a reduction in peak vorticity. Subsequently, there is enstrophy increase/generation as the vortex core regains its shape and peak vorticity, after the particle has drifted azimuthally in the out-of-plane direction. This is followed by a gradual enstrophy reduction (
$Re$
of 67 300, however, does show a sharp drop in enstrophy immediately after particle capture, and this is due to the core deformation and a reduction in peak vorticity. Subsequently, there is enstrophy increase/generation as the vortex core regains its shape and peak vorticity, after the particle has drifted azimuthally in the out-of-plane direction. This is followed by a gradual enstrophy reduction ( $\propto {t^{\ast }}^{-0.6}$
), resulting in a 50 % reduction in enstrophy at later time, compared with the base ring. It may be noted that this is substantially smaller than the enstrophy reduction in the low-
$\propto {t^{\ast }}^{-0.6}$
), resulting in a 50 % reduction in enstrophy at later time, compared with the base ring. It may be noted that this is substantially smaller than the enstrophy reduction in the low- $Re$
interactions (
$Re$
interactions ( $\approx$
90 % in figure 18
a), which is consistent with the milder deformations in core vorticity seen at higher
$\approx$
90 % in figure 18
a), which is consistent with the milder deformations in core vorticity seen at higher $Re$
(figure 16) compared with that of core fragmentation at lower
$Re$
(figure 16) compared with that of core fragmentation at lower $Re$
(figure 15).
$Re$
(figure 15).
A broad overview of the reduction in enstrophy (compared with base ring) over the whole range of $D_p/D_{c,o}$
and
$D_p/D_{c,o}$
and $Re$
studied is shown in figure 19. In the plot, we present the overall percentage reduction in enstrophy (
$Re$
studied is shown in figure 19. In the plot, we present the overall percentage reduction in enstrophy ( $\Delta E$
), where
$\Delta E$
), where $\Delta E =100 \times$
(
$\Delta E =100 \times$
( $1-E_{int}/E_{base}$
) with
$1-E_{int}/E_{base}$
) with $E_{base}$
and
$E_{base}$
and $E_{int}$
representing the enstrophy of the base case and interaction cases, respectively, all measured at
$E_{int}$
representing the enstrophy of the base case and interaction cases, respectively, all measured at $t^{\ast }$
= 7.5. We find that at each
$t^{\ast }$
= 7.5. We find that at each $Re$
,
$Re$
, $\Delta E$
shows an increasing trend with particle size, qualitatively similar to the trend seen earlier for the reduction in the convection speed of the ring (figure 13). As discussed earlier, the reduction in enstrophy is more dramatic at low
$\Delta E$
shows an increasing trend with particle size, qualitatively similar to the trend seen earlier for the reduction in the convection speed of the ring (figure 13). As discussed earlier, the reduction in enstrophy is more dramatic at low $Re$
, for example, at
$Re$
, for example, at $Re$
= 6000, where
$Re$
= 6000, where $\Delta E$
is about 90 % at
$\Delta E$
is about 90 % at $D_p/D_{c,o}$
of 1.67, in which case the ring cores become fragmented and showed about 60 % reduction in convection speed. With increasing
$D_p/D_{c,o}$
of 1.67, in which case the ring cores become fragmented and showed about 60 % reduction in convection speed. With increasing $Re$
, the rate of increase in
$Re$
, the rate of increase in $\Delta E$
with increasing particle size decreases, compared with the smaller-
$\Delta E$
with increasing particle size decreases, compared with the smaller- $Re$
cases, and beyond a
$Re$
cases, and beyond a $Re$
of about 40 000, all the
$Re$
of about 40 000, all the $Re$
cases nearly collapse, indicating a similar rate of reduction in enstrophy with increasing particle size. It is noteworthy that in high-
$Re$
cases nearly collapse, indicating a similar rate of reduction in enstrophy with increasing particle size. It is noteworthy that in high- $Re$
interactions (typically
$Re$
interactions (typically $Re\gt$
40 000), previous studies on bubble–vortex ring interactions indicated enstrophy to be similar to that of the base ring, even at larger bubble-to-vortex size ratios (Biswas & Govardhan Reference Biswas and Govardhan2023). In contrast, in the present particle interaction case, even large-
$Re\gt$
40 000), previous studies on bubble–vortex ring interactions indicated enstrophy to be similar to that of the base ring, even at larger bubble-to-vortex size ratios (Biswas & Govardhan Reference Biswas and Govardhan2023). In contrast, in the present particle interaction case, even large- $Re$
rings exhibit a significant drop in enstrophy. This is also illustrated by the present scaling for enstrophy reduction,
$Re$
rings exhibit a significant drop in enstrophy. This is also illustrated by the present scaling for enstrophy reduction, $\Delta E \propto (D_p/D_{c,o})^{1.3}Re^{-1/4}$
, in which the exponents are substantially different from that in ring–bubble interactions (Biswas & Govardhan Reference Biswas and Govardhan2023), where the scaling was reported to be
$\Delta E \propto (D_p/D_{c,o})^{1.3}Re^{-1/4}$
, in which the exponents are substantially different from that in ring–bubble interactions (Biswas & Govardhan Reference Biswas and Govardhan2023), where the scaling was reported to be $\Delta E \propto (D_b/D_{c,o})^{1.5}Re^{-1}$
.
$\Delta E \propto (D_b/D_{c,o})^{1.5}Re^{-1}$
.
(a) The percentage reduction in both cores’ average azimuthal enstrophy ( $\Delta E(\%)$
) with
$\Delta E(\%)$
) with $D_P/D_{c,o}$
, for different
$D_P/D_{c,o}$
, for different $Re$
cases; here,
$Re$
cases; here, $\Delta E$
(%) = 100
$\Delta E$
(%) = 100 $\times$
(
$\times$
( $1-E_{int}/E_{base}$
), where
$1-E_{int}/E_{base}$
), where $E_{int}$
and
$E_{int}$
and $E_{base}$
are the azimuthal enstrophy for the interaction and base cases, respectively, all measured at
$E_{base}$
are the azimuthal enstrophy for the interaction and base cases, respectively, all measured at $t^{\ast }=7.5$
. The results show
$t^{\ast }=7.5$
. The results show $\Delta E$
to scale as
$\Delta E$
to scale as $(D_p/D_{c,o})^{1.3}Re^{-0.25}$
, with
$(D_p/D_{c,o})^{1.3}Re^{-0.25}$
, with $R^2\gt$
0.94. (b) The
$R^2\gt$
0.94. (b) The $\Delta E$
from (a) is plotted in a universal curve by employing the proposed scaling law; here,
$\Delta E$
from (a) is plotted in a universal curve by employing the proposed scaling law; here, $C_e$
is the proportionality constant from (a). The
$C_e$
is the proportionality constant from (a). The $x$
axis is shown in log scale.
$x$
axis is shown in log scale.
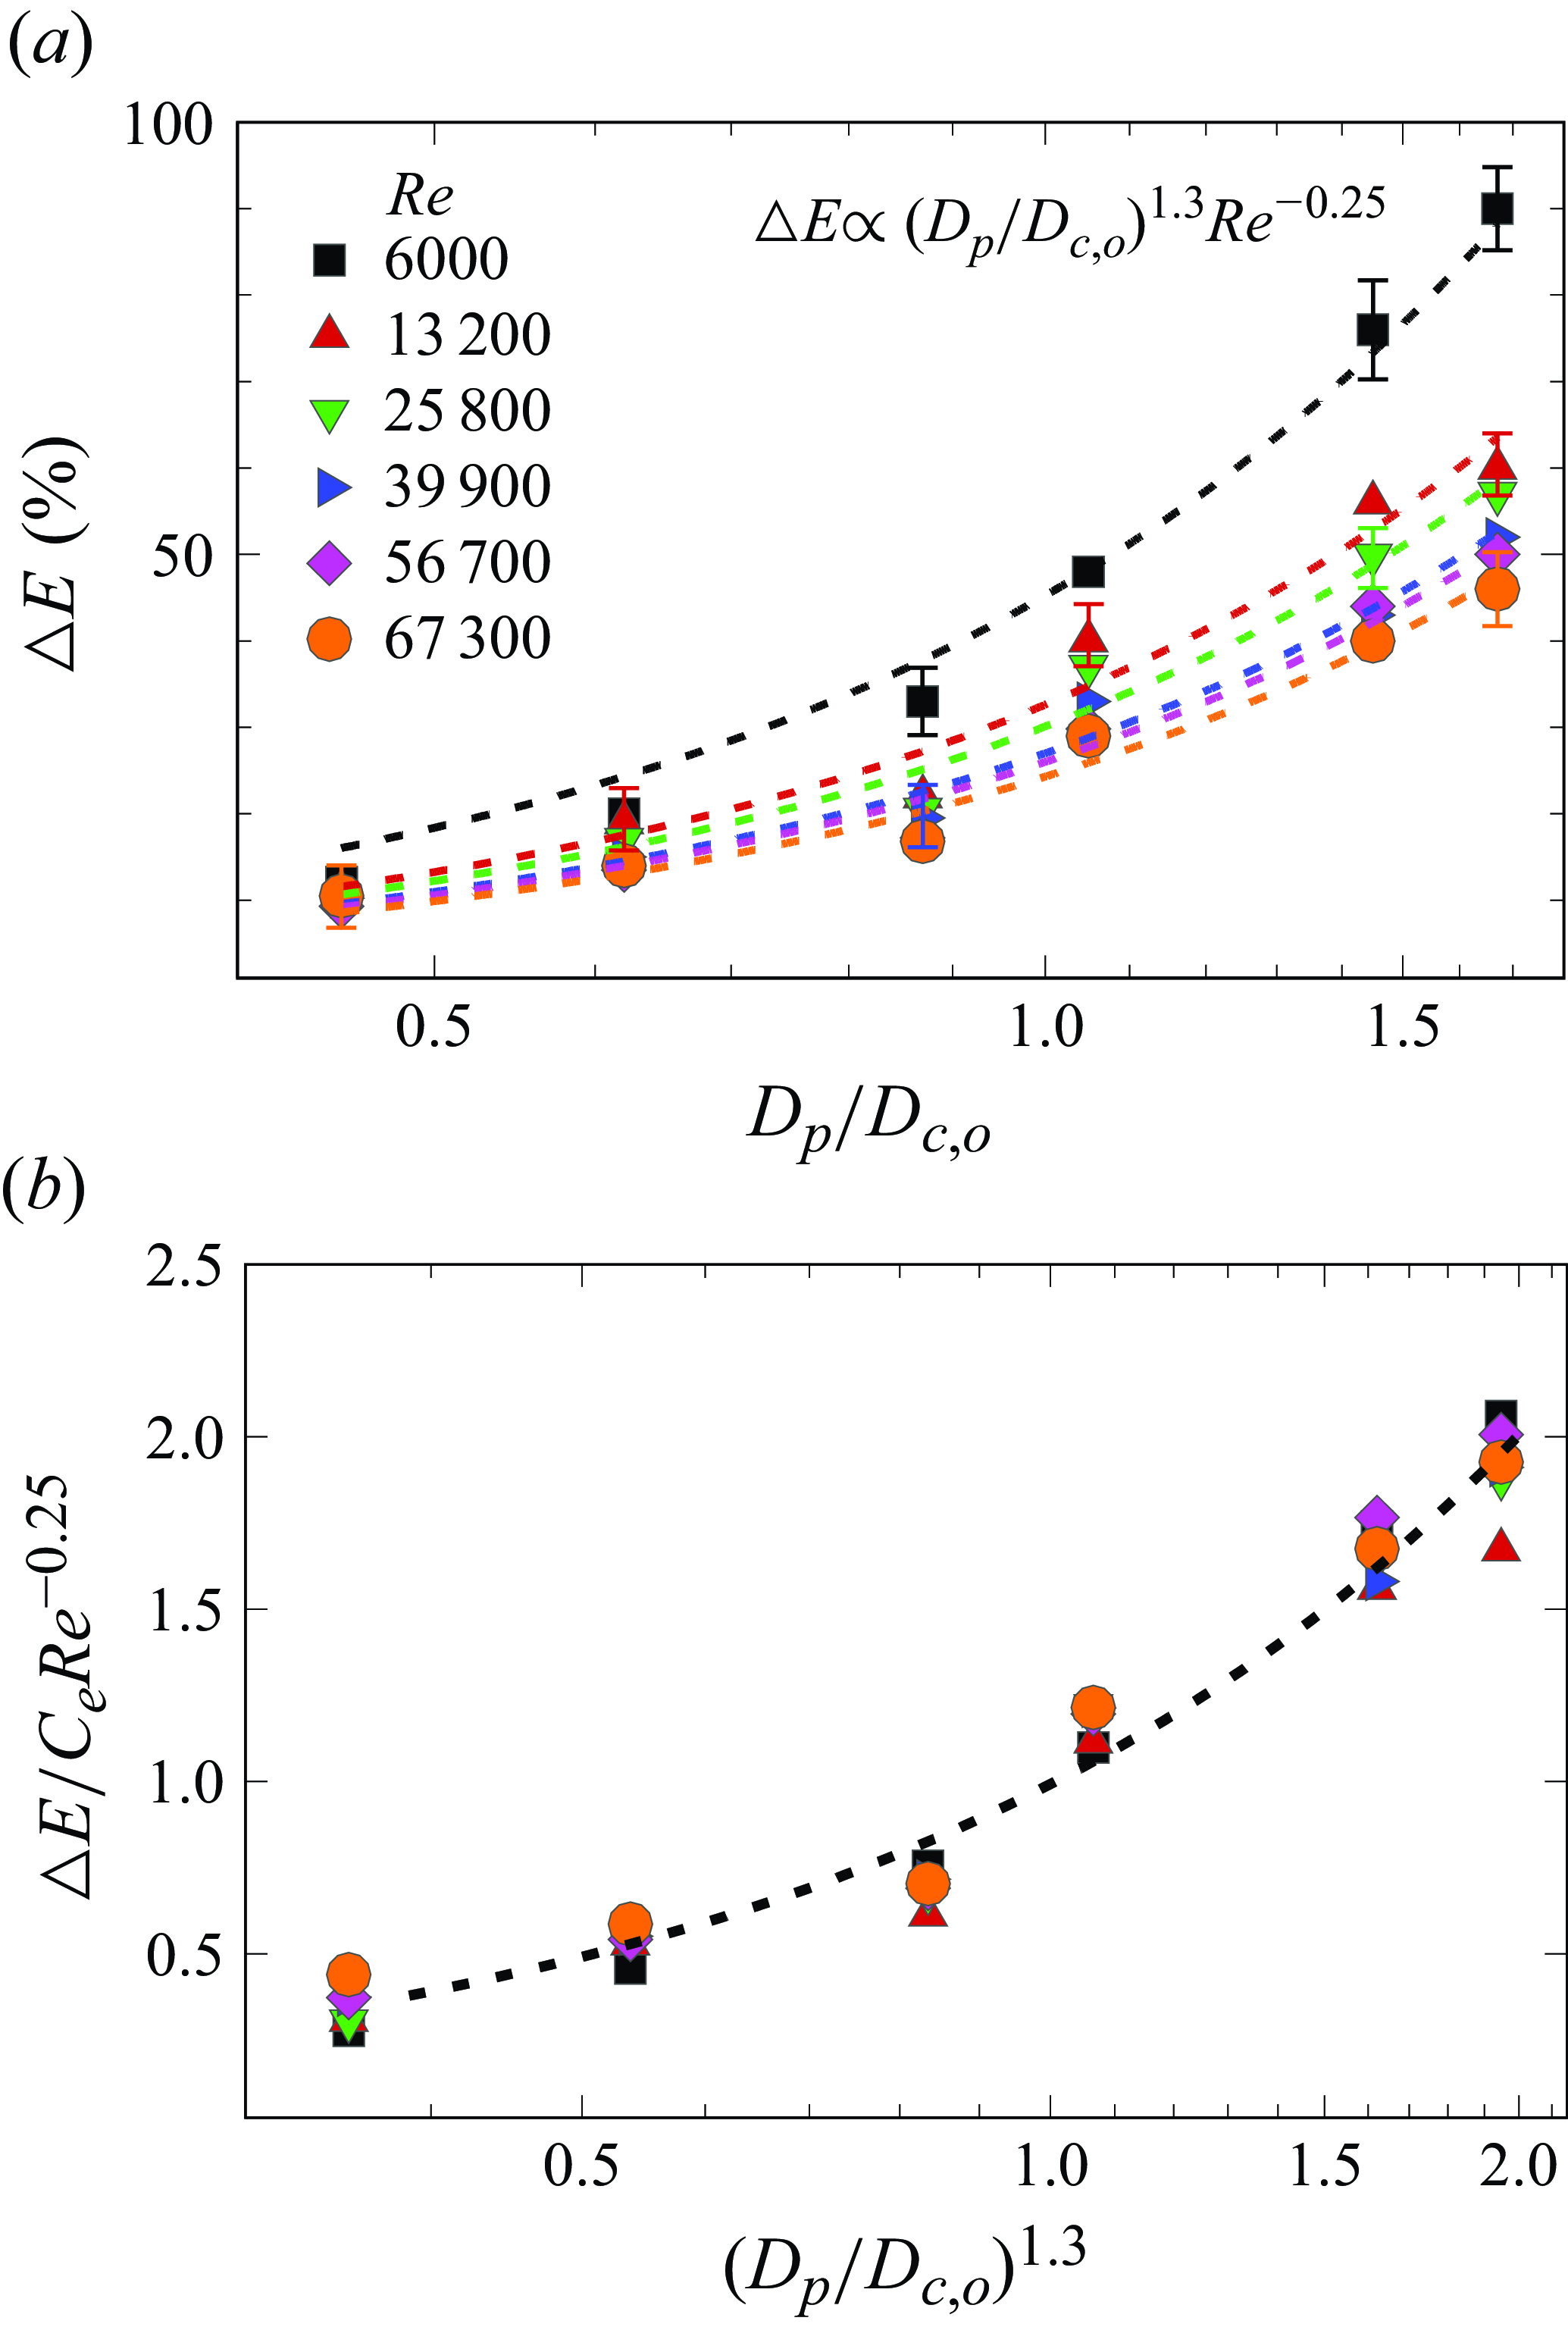
We now discuss a few key points in the context of reductions in enstrophy. We show in figures 18 and 19 both cores’ average enstrophy (B), and also the enstrophy of the individual (left (L) and right (R)) cores. The data show that all three values (L, R, B) are similar at later time of interaction (in figure 18 a), indicating a nearly uniform influence of the particle on the entire vortex ring. In addition, it may be noted that the measured circulations of both cores are similar and are very close to that of the base ring, as shown in figure 20, suggesting that the circulation remains nearly the same in both the base case and the interaction cases, with only minor reductions attributable to cancellation of vorticity (of opposite signs) due to viscous diffusion. These points collectively indicate that the azimuthal vorticity mostly stays within the plane, with no substantial reorientation in non-azimuthal directions. This suggests that our two-dimensional measurement of both cores’ averaged azimuthal enstrophy provides a reasonable representation of the volumetric enstrophy reductions, as also indicated in our previous study (Biswas & Govardhan Reference Biswas and Govardhan2022).
The variations in the azimuthal circulation ( ${\varGamma }(t^{\ast })$
/
${\varGamma }(t^{\ast })$
/ ${\varGamma }_o$
) with time (
${\varGamma }_o$
) with time ( $t^{\ast }$
) are shown for the base ring and the different
$t^{\ast }$
) are shown for the base ring and the different $D_p/D_{c,o}$
interaction cases, as shown in figure 18(a,b). The left core (‘L’), right core (‘R’) and both cores’ average (‘B’) circulations are shown. Here, the instantaneous circulation (
$D_p/D_{c,o}$
interaction cases, as shown in figure 18(a,b). The left core (‘L’), right core (‘R’) and both cores’ average (‘B’) circulations are shown. Here, the instantaneous circulation ( ${\varGamma }(t^{\ast })$
) is normalised by the circulation (
${\varGamma }(t^{\ast })$
) is normalised by the circulation ( ${\varGamma }_o$
) before the particle capture.
${\varGamma }_o$
) before the particle capture.
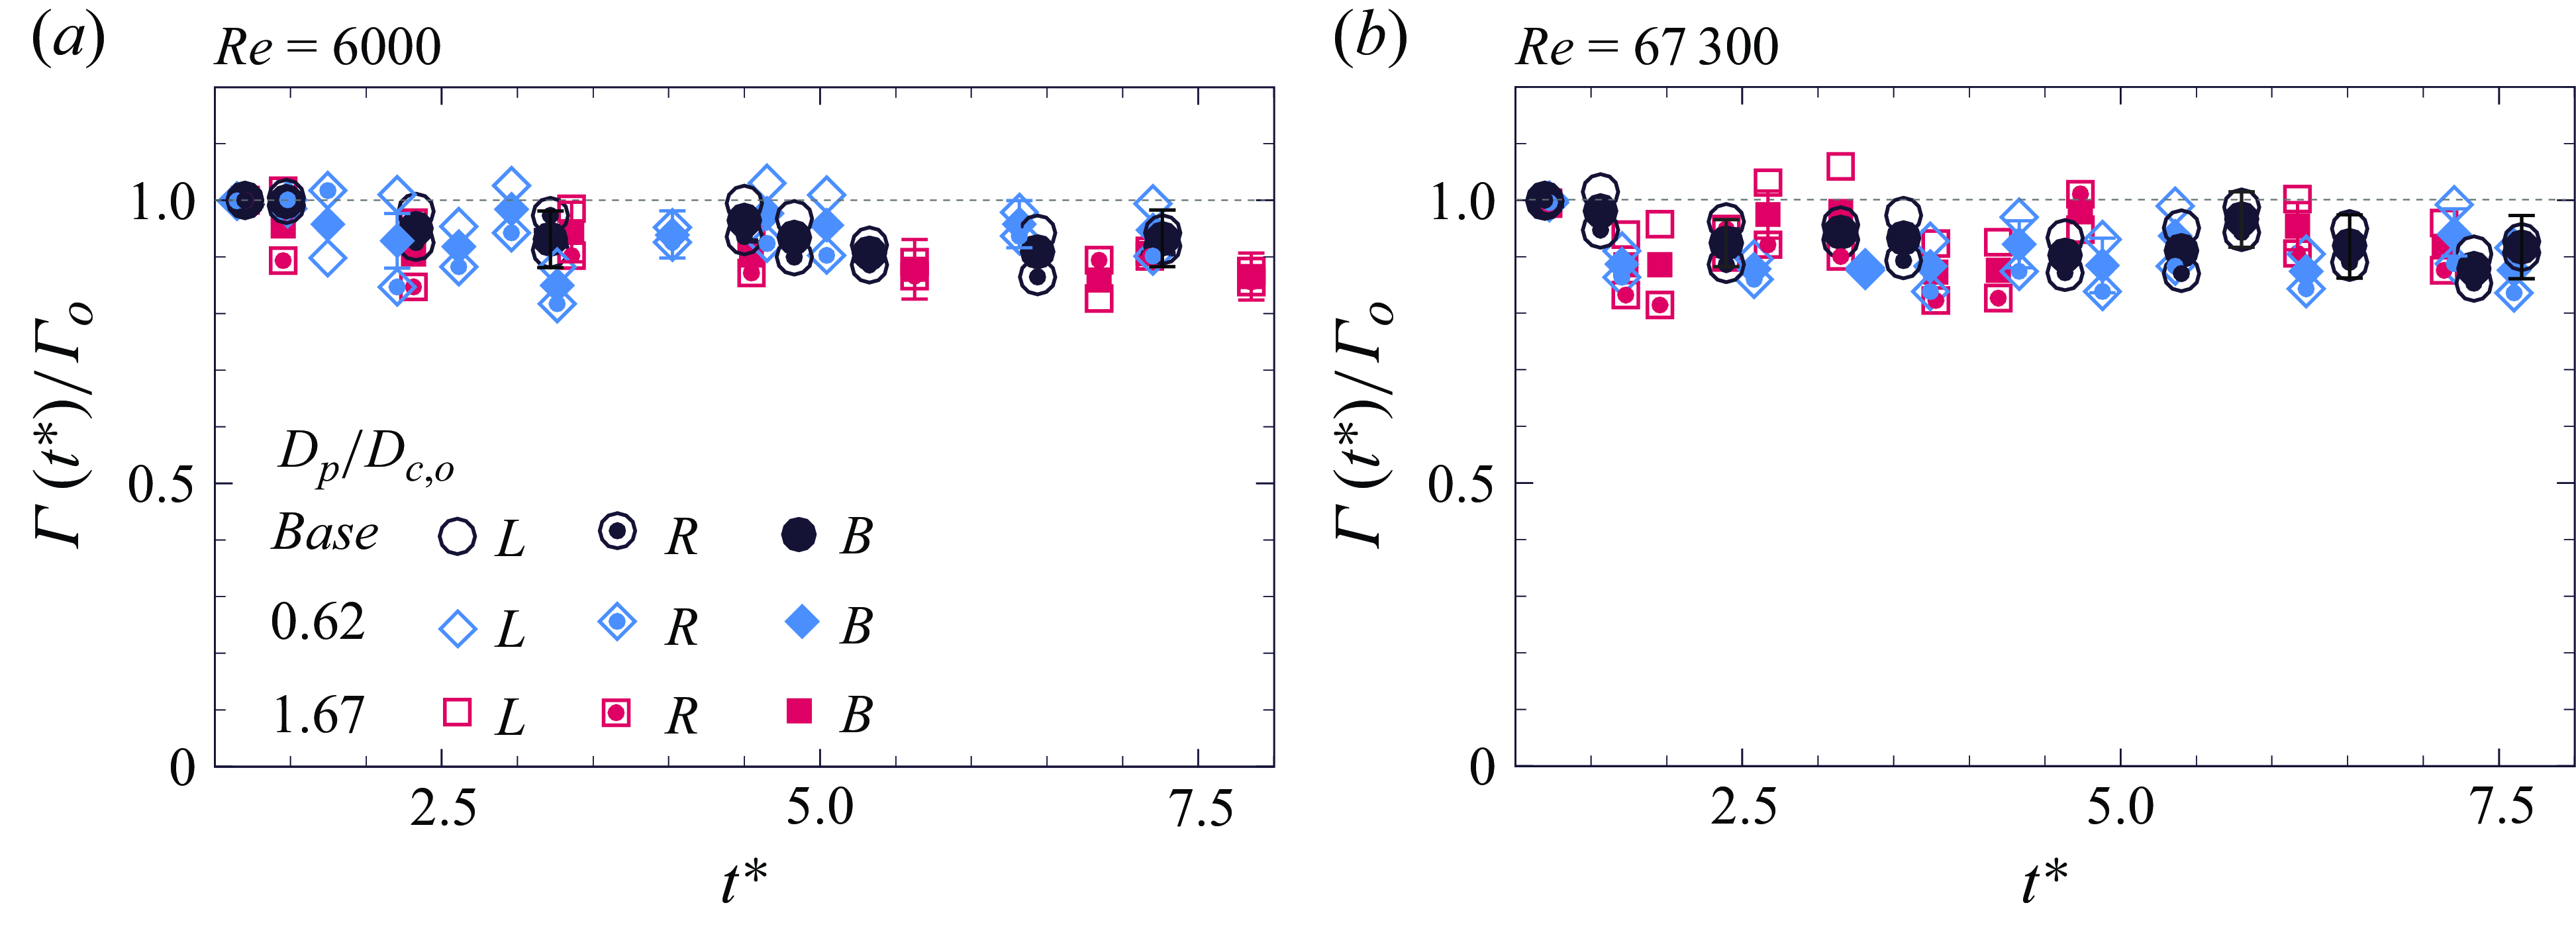
To summarise this section, for low- $Re$
interactions, increasing particle size leads to a higher rate of reduction in the ring’s azimuthal enstrophy at the initial phase of interactions. At later times, the final reduction is substantially higher in the large-particle case, for example,
$Re$
interactions, increasing particle size leads to a higher rate of reduction in the ring’s azimuthal enstrophy at the initial phase of interactions. At later times, the final reduction is substantially higher in the large-particle case, for example, $\approx\,$
90 % enstrophy reduction at
$\approx\,$
90 % enstrophy reduction at $D_p/D_{c,o}$
= 1.67, much higher than
$D_p/D_{c,o}$
= 1.67, much higher than $\approx$
10 % reduction in the base ring. The drop in enstrophy at large
$\approx$
10 % reduction in the base ring. The drop in enstrophy at large $Re$
, although smaller than for the low-
$Re$
, although smaller than for the low- $Re$
cases, is still not negligible, for example, about 50 % at
$Re$
cases, is still not negligible, for example, about 50 % at $Re$
= 67 300 and
$Re$
= 67 300 and $D_p/D_{c,o}$
= 1.67. The circulation, on the other hand, stays nearly constant in all the interaction cases and is almost identical to the base cases, thus indicating no substantial transfer of azimuthal vorticity into the non-azimuthal directions. Also observed is the marginal difference between the left and right core enstrophy, at a later time of interaction. These facts indicate that the increasing particle size leads to a higher reduction in the ring’s global (volumetric) enstrophy compared with the base case.
$D_p/D_{c,o}$
= 1.67. The circulation, on the other hand, stays nearly constant in all the interaction cases and is almost identical to the base cases, thus indicating no substantial transfer of azimuthal vorticity into the non-azimuthal directions. Also observed is the marginal difference between the left and right core enstrophy, at a later time of interaction. These facts indicate that the increasing particle size leads to a higher reduction in the ring’s global (volumetric) enstrophy compared with the base case.
One may note that a recent numerical study by Foronda-Trillo et al. (Reference Foronda-Trillo, Rodríguez-Rodríguez, Gutiérrez-Montes and Martínez-Bazán2021) on the interaction of a transitional vortex ring with a bubble reported a partial transfer of azimuthal enstrophy into non-azimuthal directions, resulting in a reduction of azimuthal enstrophy while conserving the (total) global enstrophy, same as in the base ring, a phenomenon not observed in our work. It may be noted that although the reasons for the differences in observations between our study and that by Foronda-Trillo et al. (Reference Foronda-Trillo, Rodríguez-Rodríguez, Gutiérrez-Montes and Martínez-Bazán2021) are not immediately apparent, it is noteworthy that the base ring azimuthal enstrophy shows substantial distinctions between the two works. A significant reduction (approximately 60 %) in the base ring’s azimuthal enstrophy was observed in their study, while the reduction is around 10 % in our present and previous studies. These differences in both base and interaction cases across their and ours may arise from a number of factors, such as the transitional ring $Re$
in Foronda-Trillo et al. (Reference Foronda-Trillo, Rodríguez-Rodríguez, Gutiérrez-Montes and Martínez-Bazán2021), the positioning of the bubble outside the ring in their study, a smaller core-to-ring thickness and larger relative velocities between the ring and the bubble (travelling in opposite directions) in their case, in contrast to our configurations where both the ring and the particle travel in the same direction.
$Re$
in Foronda-Trillo et al. (Reference Foronda-Trillo, Rodríguez-Rodríguez, Gutiérrez-Montes and Martínez-Bazán2021), the positioning of the bubble outside the ring in their study, a smaller core-to-ring thickness and larger relative velocities between the ring and the bubble (travelling in opposite directions) in their case, in contrast to our configurations where both the ring and the particle travel in the same direction.
The large deformation and suppression of coherent structures in bubbles/particle-laden turbulent flows lead to reductions in enstrophy, as observed here, and in turn, reduces Reynolds stress (Lu et al. Reference Lu, Fernández and Tryggvason2005; Dritselis & Vlachos Reference Dritselis and Vlachos2008), with these having several implications, for example, drag reductions (Lu et al. Reference Lu, Fernández and Tryggvason2005; Dritselis & Vlachos Reference Dritselis and Vlachos2008; Sugiyama, Calzavarini & Lohse Reference Sugiyama, Calzavarini and Lohse2008; Zhao, Andersson & Gillissen Reference Zhao, Andersson and Gillissen2010; Zhao et al. Reference Zhao, Andersson and Gillissen2010; Gillissen Reference Gillissen2013; Wang, Xu & Zhao Reference Wang, Xu and Zhao2021). Additionally connections can be established between our findings and turbulent flows. For example, in relation to hairpin vortices in a boundary layer, Zhou et al. (Reference Zhou, Adrian, Balachandar and Kendall1999) demonstrated that primary hairpin vortices with peak vorticity surpassing a specific threshold lead to the formation of secondary hairpin vortices. As seen in the present work, the presence of a particle in a vortex reduces peak vorticity, and this indicates that in turbulent flows, the presence of particles inside the coherent structures could potentially result in the vorticity falling below the threshold necessary for the regeneration of a hairpin. Consequently, this reduction would contribute to a reduction in the population of hairpin structures, ultimately leading to decreased wall shear stress. These broad observations indicate that the present results on the evolution of vorticity and enstrophy in idealised particle–vortex interactions will help us better understand and model the evolution of enstrophy in more complex dispersed (bubble/droplet/particle) turbulent flow conditions. However, it is important to acknowledge the differences between the current idealised scenario involving a single vortical structure interacting with a particle and the situation of particles within a turbulent flow. In the latter scenario, the inherent complex nature of turbulence suggests that the particles interact with multiple eddies at the same time, and in addition, particles interact among themselves, thus introducing an increased level of complexity to the problem.
4.4. Critical particle size
We have observed the particle-to-vortex core size ratio to have dramatic effects on various aspects of the ring dynamics over a broad range of ring Reynolds numbers. In particular, the interesting cases were seen to belong to the lower-ring-Reynolds-number regime ( $Re\lessapprox$
30 000), where substantial changes in the vortex ring dynamics were observed with increasing
$Re\lessapprox$
30 000), where substantial changes in the vortex ring dynamics were observed with increasing $D_p/D_{c,o}$
. It is now intriguing to further look into this low-
$D_p/D_{c,o}$
. It is now intriguing to further look into this low- $Re$
regime to determine whether there exists a range of
$Re$
regime to determine whether there exists a range of $D_p/D_{c,o}$
where the increase in the particle size leads to abrupt significant impact on the ring dynamics.
$D_p/D_{c,o}$
where the increase in the particle size leads to abrupt significant impact on the ring dynamics.
We begin by referring to figures 13 and 19, where we compare the reduction in the ring’s convection speed ( $\Delta u_c$
) and enstrophy (
$\Delta u_c$
) and enstrophy ( $\Delta E$
) across different particle-to-vortex size ratios. We have chosen these two parameters since they are known to be good representatives of the coherence of vortical structures in turbulent flows (Zhou et al. Reference Zhou, Adrian, Balachandar and Kendall1999; Hu & Peterson Reference Hu and Peterson2021). It may be noted that the
$\Delta E$
) across different particle-to-vortex size ratios. We have chosen these two parameters since they are known to be good representatives of the coherence of vortical structures in turbulent flows (Zhou et al. Reference Zhou, Adrian, Balachandar and Kendall1999; Hu & Peterson Reference Hu and Peterson2021). It may be noted that the $\Delta E$
values are measured at a much later stage of the interaction, where the effects of the particle on the ring, and in particular the (planar) enstrophy, appear to be reasonably independent of the azimuthal location of the measurement plane. In these figures, we normalise
$\Delta E$
values are measured at a much later stage of the interaction, where the effects of the particle on the ring, and in particular the (planar) enstrophy, appear to be reasonably independent of the azimuthal location of the measurement plane. In these figures, we normalise $\Delta u_c$
and
$\Delta u_c$
and $\Delta E$
, at each
$\Delta E$
, at each $Re$
, with their corresponding maximum reductions that occur at the largest
$Re$
, with their corresponding maximum reductions that occur at the largest $D_p/D_{c,o}$
of 1.67. The normalised data in figure 21 show
$D_p/D_{c,o}$
of 1.67. The normalised data in figure 21 show ${\Delta u_c}/{\Delta u_{c, max}}$
and
${\Delta u_c}/{\Delta u_{c, max}}$
and ${\Delta E}/{\Delta E_{max}}$
from different
${\Delta E}/{\Delta E_{max}}$
from different $Re$
to be nearly collapsing. The broad trend for the variation of the collapsed data with
$Re$
to be nearly collapsing. The broad trend for the variation of the collapsed data with $D_p/D_{c,o}$
can be represented with a sigmoid curve (solid line
$D_p/D_{c,o}$
can be represented with a sigmoid curve (solid line $^{\underline{\;\;\;\;\;\;\;\;\;\;}}$
, with
$^{\underline{\;\;\;\;\;\;\;\;\;\;}}$
, with $R^2\gt$
0.94) having the form of
$R^2\gt$
0.94) having the form of $1/(1+{\rm e}^{-{a}(D_p/D_{c,o}-{b})})$
, where the constant
$1/(1+{\rm e}^{-{a}(D_p/D_{c,o}-{b})})$
, where the constant $a$
represents the growth rate of the curve, while
$a$
represents the growth rate of the curve, while $b$
signifies the sigmoid’s midpoint values (Kyurkchiev & Markov Reference Kyurkchiev and Markov2015; Von Seggern Reference Von and David2017; Fathi & Shoja Reference Fathi and Shoja2018; Hertz Reference Hertz2018), with these two being obtained from the least-squares curve fit. As can be seen, this sigmoid curve undergoes a relatively slow change initially (
$b$
signifies the sigmoid’s midpoint values (Kyurkchiev & Markov Reference Kyurkchiev and Markov2015; Von Seggern Reference Von and David2017; Fathi & Shoja Reference Fathi and Shoja2018; Hertz Reference Hertz2018), with these two being obtained from the least-squares curve fit. As can be seen, this sigmoid curve undergoes a relatively slow change initially ( $D_p/D_{c,o}\lessapprox$
0.8), followed by an intermediate region of rapid change (1.3
$D_p/D_{c,o}\lessapprox$
0.8), followed by an intermediate region of rapid change (1.3 $\gtrapprox$ $D_p/D_{c,o}\gtrapprox$
0.8) and then further followed by a region where the rate of change is minimal (
$D_p/D_{c,o}\gtrapprox$
0.8) and then further followed by a region where the rate of change is minimal ( $D_p/D_{c,o}\gtrapprox$
1.3). It may also be noted that in the intermediate size range, both
$D_p/D_{c,o}\gtrapprox$
1.3). It may also be noted that in the intermediate size range, both ${\Delta u_c}/{\Delta u_{c, max}}$
and
${\Delta u_c}/{\Delta u_{c, max}}$
and ${\Delta E}/{\Delta E_{max}}$
show a nearly linear variation with the size ratio. We use a 50 % cutoff criterion in the normalised data (
${\Delta E}/{\Delta E_{max}}$
show a nearly linear variation with the size ratio. We use a 50 % cutoff criterion in the normalised data ( ${\Delta u_c}/{\Delta u_{c, max}}$
= 0.5,
${\Delta u_c}/{\Delta u_{c, max}}$
= 0.5, ${\Delta E}/{\Delta E_{max}}$
= 0.5) to define a critical size ratio. Although there is no sudden or abrupt change, we used this definition consistently with that in our previous studies of vortex ring–air bubble interaction, to help compare the two. Following this, we find from the curve fits in the case of the particle that the critical size ratio corresponding to the 50 % criterion is about 1.03 for
${\Delta E}/{\Delta E_{max}}$
= 0.5) to define a critical size ratio. Although there is no sudden or abrupt change, we used this definition consistently with that in our previous studies of vortex ring–air bubble interaction, to help compare the two. Following this, we find from the curve fits in the case of the particle that the critical size ratio corresponding to the 50 % criterion is about 1.03 for ${\Delta u_c}/{\Delta u_{c, max}}$
and 0.97 for
${\Delta u_c}/{\Delta u_{c, max}}$
and 0.97 for ${\Delta E}/{\Delta E_{max}}$
(as demarcated in the figures). These values essentially are the
${\Delta E}/{\Delta E_{max}}$
(as demarcated in the figures). These values essentially are the $D_p/D_{c,o}$
values corresponding to the points of inflection of the data and referred to here as critical size ratio (
$D_p/D_{c,o}$
values corresponding to the points of inflection of the data and referred to here as critical size ratio ( $(D_p/D_{c,o})_{critical}\approx 1$
). This may be directly compared with the critical ratio defined using the same criterion for a deforming bubble, as discussed later.
$(D_p/D_{c,o})_{critical}\approx 1$
). This may be directly compared with the critical ratio defined using the same criterion for a deforming bubble, as discussed later.
The normalised reduction of the (a) convection speed $\Delta u_c$
/
$\Delta u_c$
/ $\Delta u_{c, max}$
and (b) enstrophy
$\Delta u_{c, max}$
and (b) enstrophy $\Delta E$
/
$\Delta E$
/ $\Delta E_{max}$
with
$\Delta E_{max}$
with $D_p/D_{c,o}$
at three
$D_p/D_{c,o}$
at three $Re$
. The different
$Re$
. The different $Re$
cases are seen to be nearly collapsing. The data are seen to follow a sigmoid curve with the forms of
$Re$
cases are seen to be nearly collapsing. The data are seen to follow a sigmoid curve with the forms of $ {1}/({1+{\rm e}^{-{a}(D_p/D_{c,o}-{b})})}$
, as shown with the solid black line (
$ {1}/({1+{\rm e}^{-{a}(D_p/D_{c,o}-{b})})}$
, as shown with the solid black line ( $R^2\gt 0.94$
).
$R^2\gt 0.94$
).
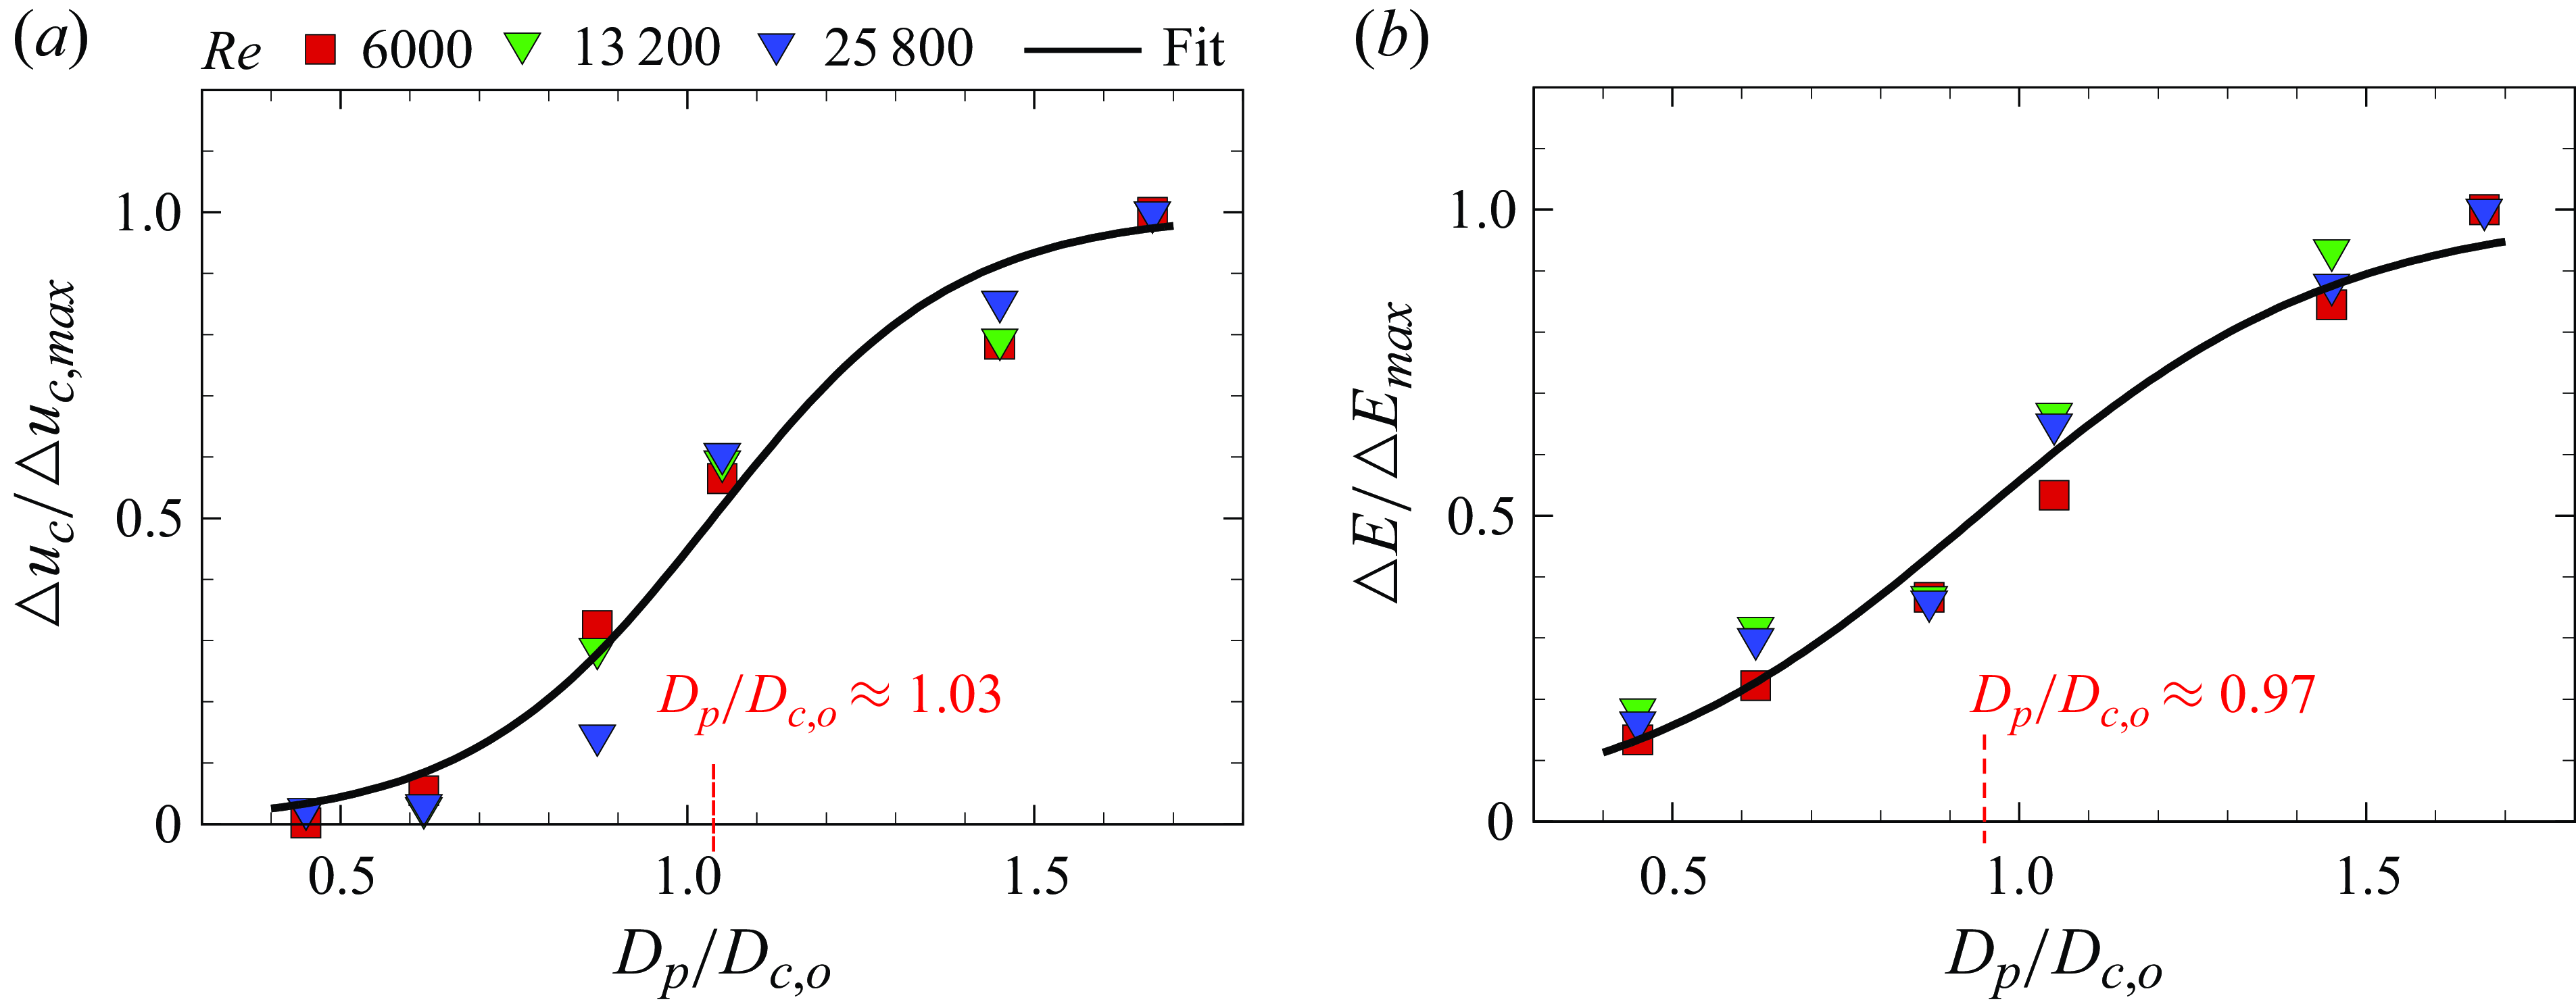
The size ratio of $(D_p/D_{c,o})_{critical}\approx 1$
is smaller than in the case for a (deforming) bubble for a 50 % cutoff, where this size ratio was found to be
$(D_p/D_{c,o})_{critical}\approx 1$
is smaller than in the case for a (deforming) bubble for a 50 % cutoff, where this size ratio was found to be $D_b/D_{c,o}\approx 1.23$
from our previous study on a vortex ring–bubble interaction (Biswas & Govardhan Reference Biswas and Govardhan2023). These observations would have several implications. For example, this implies that in (buoyant) particle-laden flows, the particle would have a more dramatic influence on the vortices beyond a critical size ratio. In addition, this also indicates that the level of disruption of a vortex by a smaller particle would be comparable to that caused by a larger (deforming) bubble. This would be due to the fact that a rigid particle acts like an asymmetric perturbation to the vortex in comparison with a deformed/broken bubble that spreads azimuthally across the ring and would act like a distributed perturbation to the vortex. These findings, in connection with bubbly/particle-laden turbulent flows, suggest that where vortex disruption is the primary mechanism for turbulence modulation, (buoyant) rigid particles of smaller size may be more efficient than larger (deforming) bubbles.
$D_b/D_{c,o}\approx 1.23$
from our previous study on a vortex ring–bubble interaction (Biswas & Govardhan Reference Biswas and Govardhan2023). These observations would have several implications. For example, this implies that in (buoyant) particle-laden flows, the particle would have a more dramatic influence on the vortices beyond a critical size ratio. In addition, this also indicates that the level of disruption of a vortex by a smaller particle would be comparable to that caused by a larger (deforming) bubble. This would be due to the fact that a rigid particle acts like an asymmetric perturbation to the vortex in comparison with a deformed/broken bubble that spreads azimuthally across the ring and would act like a distributed perturbation to the vortex. These findings, in connection with bubbly/particle-laden turbulent flows, suggest that where vortex disruption is the primary mechanism for turbulence modulation, (buoyant) rigid particles of smaller size may be more efficient than larger (deforming) bubbles.
4.5. Discussion
In connection with the size ratio effect on the ring, we now briefly discuss the different potential instabilities of the vortex ring which would possibly be responsible for the disruption of the ring at later times. We have observed that an increase in particle size results in an increasing disruption of the vortex ring in terms of its deformation and fragmentation of the core. This phenomenon is likely caused by an instability of the modified vortex core associated with increasing particle size. We now briefly discuss some potential mechanisms associated with such a ring instability. We begin with the increase in the radial offset of the particle within the vortex core seen with increasing particle size. A larger offset can introduce a higher level of asymmetry to the vortex core (Finn et al. Reference Finn, Shams and Apte2011) and a larger reaction force on the core fluid (Biswas & Govardhan Reference Biswas and Govardhan2023), promoting a more unstable core. Another contributing factor to instability in the modified vortex core may arise from the annular form of the core vorticity distribution as the particle resides within the vortex core (Dritschel Reference Dritschel1986). This effect could intensify with larger particles, given the increase in the local particle-to-core size ratio. In a vortex ring, the presence of oppositely signed cores can induce a strain field, potentially leading to core/vortex instability. This phenomenon, known as ‘cooperative’ instability, has been discussed in the case of vortex pairs by Leweke & Williamson (Reference Leweke and Williamson1998). As particle size increases, the deformation of the ring’s cores increases, altering their mutual strain field and pushing the vortex towards instability. Additionally, a larger particle that stays relatively localised (azimuthally) within the ring acts as a more asymmetric perturbation to the ring and asymmetrically deforms the ring’s azimuthal axis, thereby altering the curvature of the vortex ring. This change in curvature may also serve as a source of instability (Blanco-Rodríguez & Le Dizès Reference Blanco-Rodríguez and Le Dizès2017). Furthermore, increasing the particle size is also seen to result in an augmented oscillatory deformation and a larger ring aspect ratio, potentially yielding a more unstable ring (Cheng et al. Reference Cheng, Lou and Lim2016). Lastly, larger particles could induce a higher azimuthal pressure difference within the vortex core due to largely modified core vorticity, thus potentially initiating an axial (azimuthal) flow development. This axial flow could act as a source of instability, a phenomenon discussed by Roy et al. (Reference Roy, Leweke, Thompson and Hourigan2011) and Leweke et al. (Reference Leweke, Le Dizès and Williamson2016) for vortex pairs. In summary, there are a number of potential mechanisms that could be responsible for the development of instability associated with increasing particle size. However, identifying the dominant mechanism may be challenging given that these different mechanisms could potentially act together, and the dominating mechanism may vary depending on the particle size and ring Reynolds number.
5. Summary and conclusion
The present work investigates an idealisation of buoyant particle interactions with vortical structures in turbulent flows, namely the interaction of a buoyant (spherical) particle with a (water) vortex ring, with the primary focus being on the effect of particle-to-vortex size ratio ( $D_p/D_{c,o}$
) on these interactions. The particle size is varied to obtain different
$D_p/D_{c,o}$
) on these interactions. The particle size is varied to obtain different $D_p/D_{c,o}$
of 0.62–1.67, which corresponds to a particle-to-vortex core volume ratio of
$D_p/D_{c,o}$
of 0.62–1.67, which corresponds to a particle-to-vortex core volume ratio of $V_R\approx$
0.01–0.2. The effects of
$V_R\approx$
0.01–0.2. The effects of $D_p/D_{c,o}$
on both the vortex ring dynamics and the particle dynamics is investigated for a large range of ring circulation (
$D_p/D_{c,o}$
on both the vortex ring dynamics and the particle dynamics is investigated for a large range of ring circulation ( $\varGamma$
)-based Reynolds numbers (
$\varGamma$
)-based Reynolds numbers ( $Re=\varGamma /\nu$
) of about 6000–67 300. In particular, we measure the motions of the particle within the ring directly using high-speed visualisations, while the flow-field information is obtained using time-resolved PIV measurements. The results from the particle dynamics side include the particle’s azimuthal translation, rotation about an axis parallel to the vortex azimuthal axis and radial oscillatory motion within the core. On the other hand, the vortex ring dynamics side includes the ring’s propagation speed, deformation of the ring, modifications of the vortex core’s azimuthal vorticity and some integral measures of it, such as the circulation and azimuthal enstrophy.
$Re=\varGamma /\nu$
) of about 6000–67 300. In particular, we measure the motions of the particle within the ring directly using high-speed visualisations, while the flow-field information is obtained using time-resolved PIV measurements. The results from the particle dynamics side include the particle’s azimuthal translation, rotation about an axis parallel to the vortex azimuthal axis and radial oscillatory motion within the core. On the other hand, the vortex ring dynamics side includes the ring’s propagation speed, deformation of the ring, modifications of the vortex core’s azimuthal vorticity and some integral measures of it, such as the circulation and azimuthal enstrophy.
Varying particle size brings striking changes in both the particle dynamics and the ring dynamics. The particle within the vortex core can undergo radial oscillation, where the radial offset between the particle and vortex core centre varies with time. During this motion, the radial offset and its amplitude of oscillation (with time) are found to be higher for a larger particle. A higher radial offset leads to a larger displaced core fluid volume and, in addition, a greater reaction force on the core, which would have implications in terms of making the vortex core more unstable. During this radial motion, the particle simultaneously translates azimuthally. A larger particle is likely to undergo shorter translation azimuthally and stays more localised, and hence would act more like a localised source of perturbation to the ring. On the other hand, smaller particles, which are seen to undergo longer translation azimuthally, would act as a relatively more distributed source of perturbation at various azimuthal locations on the vortex ring. These differences across smaller and larger particles result in differences in the ring dynamics, with the larger particle leading towards more dramatic modifications in the ring dynamics. It may be noted that these motions of the particle are very different from (deforming) bubble dynamics within a vortex ring (summarised in table 6), as reported in our previous studies, where the bubble, post-capture, settles at an equilibrium radial position, followed by an azimuthal elongation and breakup, and then the broken bubbles spread (azimuthally) within the ring.
A comparison between particle–ring interaction case from the present study and the deforming bubble–ring interaction from our previous studies (Jha & Govardhan Reference Jha and Govardhan2015; Biswas & Govardhan Reference Biswas and Govardhan2023), for the same range of particle (and bubble)-to-core size ratio ( $D_p/D_{c,o}, D_b/D_{c,o}$
= 0.62–1.67) and ring Reynolds numbers (
$D_p/D_{c,o}, D_b/D_{c,o}$
= 0.62–1.67) and ring Reynolds numbers ( $Re$
= 6000–67 300).
$Re$
= 6000–67 300).
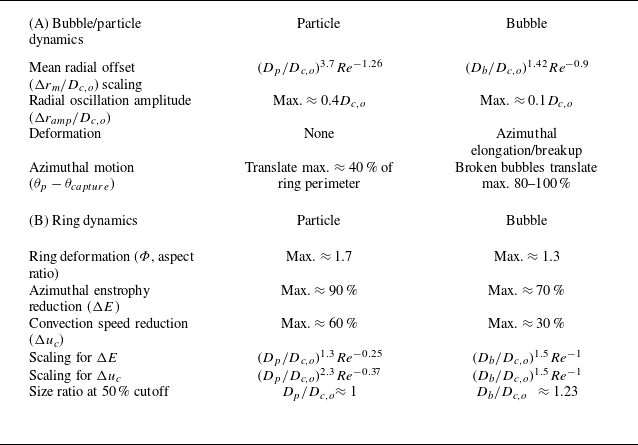
The interaction of the particle with the ring also leads to substantial changes in the ring dynamics. We observe that increasing the size ratio leads to increasing disruption of the vortex ring, especially above a critical $D_p/D_{c,o}$
of about 1. The effects are especially dramatic for low-
$D_p/D_{c,o}$
of about 1. The effects are especially dramatic for low- $Re$
vortex rings interacting with a larger particle, with this leading to large vortex core deformation and fragmentation. Such interactions can lead to significant reductions in the ring’s convection speed (up to
$Re$
vortex rings interacting with a larger particle, with this leading to large vortex core deformation and fragmentation. Such interactions can lead to significant reductions in the ring’s convection speed (up to $\approx\,$
60 %) and azimuthal enstrophy (
$\approx\,$
60 %) and azimuthal enstrophy ( $\approx\,$
90 %), compared with the base vortex ring, for low-
$\approx\,$
90 %), compared with the base vortex ring, for low- $Re$
and large-
$Re$
and large- $D_p/D_{c,o}$
cases. With increased
$D_p/D_{c,o}$
cases. With increased $Re$
, although the changes in the ring dynamics due to increasing particle size become smaller, the vortex core deformation and enstrophy reductions remain substantial. For example, the enstrophy reduction could be up to 50 % at
$Re$
, although the changes in the ring dynamics due to increasing particle size become smaller, the vortex core deformation and enstrophy reductions remain substantial. For example, the enstrophy reduction could be up to 50 % at $Re$
of 67 300 and
$Re$
of 67 300 and $D_p/D_{c,o}$
of 1.67, although the convection speed of the ring remains nearly the same as for the base ring. Notably, over the entire range of parameters studied, the reductions in convection speed and enstrophy exhibit a scaling
$D_p/D_{c,o}$
of 1.67, although the convection speed of the ring remains nearly the same as for the base ring. Notably, over the entire range of parameters studied, the reductions in convection speed and enstrophy exhibit a scaling $(D_p/D_{c,o})^{2.3}Re^{-0.37}$
and
$(D_p/D_{c,o})^{2.3}Re^{-0.37}$
and $(D_b/D_{c,o})^{1.3}Re^{-0.25}$
, respectively.
$(D_b/D_{c,o})^{1.3}Re^{-0.25}$
, respectively.
It is important to note that the degree of disruption of the vortex ring by the particle, in terms of the deformation of the ring, modifications in the core(s) vorticity and reductions in convection speed and enstrophy, all are found to be considerably higher than in a (deforming) bubble–vortex ring interaction (from previous studies) at similar size ratios ( $D_p/D_{c,o}$
,
$D_p/D_{c,o}$
, $D_b/D_{c,o}$
= 0.62–1.67) and ring strengths (
$D_b/D_{c,o}$
= 0.62–1.67) and ring strengths ( $Re=\varGamma /\nu$
= 6000–67 300). These, in turn, reflect in the values and scalings in particle–ring interactions to be notably different from those in bubble–ring interactions (see table 6). Also to be noted are the similar scalings for convection speed and enstrophy in the bubble–ring interaction case (
$Re=\varGamma /\nu$
= 6000–67 300). These, in turn, reflect in the values and scalings in particle–ring interactions to be notably different from those in bubble–ring interactions (see table 6). Also to be noted are the similar scalings for convection speed and enstrophy in the bubble–ring interaction case ( $(D_b/D_{c,o})^{1.5}Re^{-1}$
), unlike the particle–ring case (noted in table 6). These differences in scalings between the particle–ring and bubble–ring cases are likely related to the different shape/motion of the particle and the bubble inside the vortex ring. For example, post-capture, the particle undergoes significant radial oscillatory motion about a mean position, while the bubble settles at a mean equilibrium position (with minor radial oscillation), resulting in differences in the scaling for the mean radial position. Following this, the particle stays relatively localised azimuthally, while the elongated/broken bubbles are dispersed nearly uniformly azimuthally. Also to be noted, the particle has a larger local particle-to-core size ratio than the deforming bubble due to the bubble’s elongation within the vortex, and hence the particle behaves as a localised large perturbation to the vortex, whereas the deformable bubble acts as a distributed perturbation along the ring.
$(D_b/D_{c,o})^{1.5}Re^{-1}$
), unlike the particle–ring case (noted in table 6). These differences in scalings between the particle–ring and bubble–ring cases are likely related to the different shape/motion of the particle and the bubble inside the vortex ring. For example, post-capture, the particle undergoes significant radial oscillatory motion about a mean position, while the bubble settles at a mean equilibrium position (with minor radial oscillation), resulting in differences in the scaling for the mean radial position. Following this, the particle stays relatively localised azimuthally, while the elongated/broken bubbles are dispersed nearly uniformly azimuthally. Also to be noted, the particle has a larger local particle-to-core size ratio than the deforming bubble due to the bubble’s elongation within the vortex, and hence the particle behaves as a localised large perturbation to the vortex, whereas the deformable bubble acts as a distributed perturbation along the ring.
The degree of disruption of the vortex ring by the particle is larger than in a (deforming) bubble–vortex ring interaction. This also results in a higher rate of ‘increase in ring disruption’ with size ratio in the particle case. These broadly indicate that rigid particles would lead to more disruptions of a vortex than a deforming bubble. The present observations, along with our previous studies on (deforming) bubble interactions with a single vortex, would have implications in connection with bubbly/(buoyant) particle-laden flows. For example, our results indicate that in these complex flows, when disruption of vortical structures is the primary mechanism for turbulence modulations, the buoyant particle effects would be more significant than those of (deforming) bubbles of similar size. In summary, our results could help to better understand the effects of buoyant rigid particles and deforming bubbles on the coherent structures in complex turbulent flow, which would be important in helping us to model and understand particle (and bubble)–turbulence interactions.
Acknowledgements
S.B. thanks K. Roy for helping with the experiments.
Funding
The support from the Science and Engineering Research Board (SERB, reference no. EMR/2017/004154 & CRG/2022/005841), India is gratefully acknowledged. UKRI Fellowship (no. MR/S015566/1) at the University of Southampton for S.B. is acknowledged.
Declaration of interests
The authors report no conflict of interest.
Data availability
Data will be made available on request.
Author contributions
S.B. contributed to conceptualisation, investigation, methodology, data curation, validation and writing–original draft. R.N.G. contributed to conceptualisation, supervision and writing–review and editing.


 Open access