





Introduction
Weed management remains one of the most critical constraints limiting productivity in organic cropping systems (Snyder et al. Reference Snyder, Schonbeck, Vélez and Tencer2022). In the absence of synthetic herbicides, organic growers rely on integrated strategies that combine soil disturbance (e.g., tillage, cultivation) with cultural practices such as diversified rotations, competitive crop cultivars, narrow row spacing, and cover crops to suppress weed recruitment and reproductive output (Liebman and Davis Reference Liebman, Davis and Francis2009). Although the efficacy of these practices may be lower than that of herbicides when applied in isolation, their cumulative effects can limit weed interference and seed rain (Gallandt Reference Gallandt, Chauhan and Mahajan2014).
Cumulative effects of diverse weed management practices influence not only total weed abundance but also the weed community assembly, shaping the identity and functional traits of species that ultimately compete with the crop. As demonstrated by Adeux et al. (Reference Adeux, Vieren, Carlesi, Bàrberi, Munier-Jolain and Cordeau2019), not all weed communities exert the same impact on crop performance: communities composed of a few competitive species can cause yield loss exceeding 50%, whereas more functionally diverse and evenly structured communities have more limited effects on crop productivity. For example, in soybean [Glycine max (L.) Merr.], higher weed diversity reduced production risks, while in corn (Zea mays L.), the effect varied with climate and weed composition (Esposito et al. Reference Esposito, Westbrook, Maggio, Cirillo and DiTommaso2023; Ferrero et al. Reference Ferrero, Lima, Davis and González-Andújar2017). Conservation agriculture practices that promote weed diversity while controlling dominant species can support both yield and sustainability (Sahoo et al. Reference Sahoo, Seleiman, Roy, Ranjan, Sow, Jat, Alhammad and Gitari2024; Zhang and Wu Reference Zhang and Wu2021).
These findings emphasize the potential of weed diversity to mitigate yield losses by limiting the dominance and ecological impact of well-adapted and more competitive species. This challenges the conventional perspective of weeds as exclusively yield-reducing agents and highlights the importance of considering community composition and functional structure in the development of sustainable weed management strategies.
Understanding the ecological processes underlying weed community assembly is essential for designing effective weed management strategies in organic grain systems. Community assembly theory conceptualizes weed communities as the product of hierarchical filters—environmental, system level, and management driven—that determine which species establish, persist, and dominate (Booth and Swanton Reference Booth and Swanton2002; Smith and Mortensen Reference Smith, Mortensen and Alexander Wezel2017). In organic systems, in the absence of synthetic herbicides, the relative influence of abiotic filters (e.g., tillage, cultivation) and biotic filters (e.g., crop competition, cover crops) can vary widely, creating distinct selection events that shape weed population dynamics.
Primary tillage is a management-driven abiotic filter that influences vertical seed distribution, surface seed exposure, dormancy-breaking cues, and seed longevity. These factors, in turn, affect weed emergence and survival probabilities (Mohler Reference Mohler1993; Smith Reference Smith2006). Moldboard-based inversion tillage remains standard in organic grain, because it reliably controls weeds and stabilizes yields, whereas reduced and non‑inversion tillage, though beneficial for soil health, still demand sophisticated weed and rotation management to avoid yield loss and remain a developing, site‑specific practice (Cooper et al. Reference Cooper, Baranski, Stewart, Nobel-de Lange, Bàrberi, Fließbach, Peigné, Berner, Brock, Casagrande, Crowley, David, De Vliegher, Döring and Dupont2016; Salonen and Ketoja Reference Salonen and Ketoja2020). According to Mohler’s model, no-till systems may initially promote higher seedling emergence due to accumulation of seeds at the surface, where light and thermal cues are more abundant. This may particularly benefit small-seeded species such as common chickweed [Stellaria media (L.) Vill.] or shepherd’s purse [Capsella bursa-pastoris (L.) Medik.], which have shallow emergence limits and rely on light exposure for germination. However, in the absence of seed return, seedling emergence in no-till tends to decline over time due to surface seed mortality, unless dormancy is prolonged or near-surface survival is high. In contrast, moldboard plowing may bury seeds beyond their maximum emergence depth, contributing to a longer-term decline in emergence, especially for small-seeded species. At the same time, survival of certain species that remain dormant and buried can be prolonged, due to more favorable temperature and moisture conditions and lack of exposure to predation and environmental stress. If these “living” seeds are returned to more shallow depths, they can join the “active pool” and potentially continue their life cycle. Therefore, tillage intensity can act as a selective filter, favoring species with traits that match the depth and disturbance regime of the soil.
Mechanical cultivation remains a cornerstone of weed control in organic row-crop systems. Interrow cultivation can cause substantial weed mortality—ranging from 70% to greater than 90% depending on crop and timing (Mohler et al. Reference Mohler, Iqbal, Shen and DiTommaso2016)—but its efficacy is spatially variable. While interrow control tends to be effective, intrarow zones often receive minimal disturbance due to the need to protect the crop row, reducing weed mortality. This spatial heterogeneity may allow disturbance-sensitive species to persist in protected niches within the crop row, ultimately influencing both species composition and seedbank trajectories.
Despite extensive research on mechanical weed management, few studies have explicitly compared weed community composition and seedbank dynamics in interrow versus intrarow zones across different tillage regimes. Spatial heterogeneity in soil disturbance intensity within row-crop systems has important implications for weed survival and weed community assembly. Mohler et al. (Reference Mohler, Iqbal, Shen and DiTommaso2016) found that weed control was better in corn than in soybean due to the ability to use more aggressive cultivation, which enhanced soil burial and mortality of intrarow seedlings. In contrast, because of concern for crop damage, soybean cultivation largely targeted the interrow zone, allowing intrarow weeds to escape control. These spatial differences suggest that intrarow areas may serve more as refugia in certain crops for certain weed species, potentially altering selective pressures and contributing to persistent seedbank recruitment. For example, S. media—a small-statured, fast-reproducing species—was found to increase in low-disturbance systems such as ridge tillage, where reduced mechanical intervention likely favored survival in intrarow zones (Mohler et al. Reference Mohler, Caldwell, Marschner, Cordeau, Maqsood, Ryan and DiTommaso2018).
Cover crops act as short-term biotic filters that suppress species with overlapping phenology and similar resource acquisition strategies. These effects tend to be strongest on small-seeded annual dicotyledons and in systems with low disturbance (Smith et al. Reference Smith, Ryan, Menalled, Hatfield and Sauer2015; Teasdale Reference Teasdale1996). However, the suppressive capacity of cover crops is not absolute and can be modulated by interacting filters such as nutrient amendments and cultivation practices (Smith and Mortensen Reference Smith, Mortensen and Alexander Wezel2017).
Recent research emphasizes that the filtering strength of cover crops is context dependent, varying with weed life-history traits like emergence timing and seed size (Adeux et al., Reference Adeux, Rodriguez, Penato, Antichi, Carlesi, Sbrana, Bàrberi and Cordeau2023; Wallace et al. Reference Wallace, Mazzone, Pelzer, Ryan and Wayman2024). Moreover, legacy effects from previous management—including seedbank density, species composition, and vegetative propagules—can mediate the outcomes of current practices and shape community trajectories across time (Teasdale et al. Reference Teasdale, Mirsky and Cavigelli2019). In organic grain production in the northeastern United States, winter cereal grain production is commonly integrated into corn and soybean rotations for crop life-cycle diversification and to introduce variability in disturbance regimes and resource availability (Mirsky et al. Reference Mirsky, Ryan, Teasdale, Curran, Reberg-Horton, Spargo, Moyer, Wells, Keene and Moyer2013; Vincent-Caboud et al. Reference Vincent-Caboud, Casagrande, David, Ryan, Silva and Peigné2019). This rotation offers two windows for cover crop establishment: namely, after the winter cereal (before corn) and after corn (and before soybean). To limit tillage frequency, high-biomass cover crops can be integrated to facilitate rotational no-till corn or soybean phases in a grain rotation (Mirsky et al. Reference Mirsky, Ryan, Curran, Teasdale, Maul, Spargo, Moyer, Grantham, Weber, Way and Camargo2012). In such a phase, cover crops are mechanically terminated using a roller-crimper, which forms a surface mulch for weed suppression. However, initial establishment of cover crops frequently requires primary and secondary tillage to ensure a clean and level seedbed.
Rotational no-till practices face agronomic challenges, including limited cover crop biomass after late fall harvest and incomplete cover crop termination with roller-crimpers, which can lead to volunteer cover crop issues in subsequent phases (Keene et al. Reference Keene, Curran, Wallace, Ryan, Mirsky, Vangessel and Barbercheck2017; Mirsky et al. Reference Mirsky, Curran, Mortensen, Ryan and Shumway2009). Relay intercropping, or interseeding cover crops into standing corn, is an alternative practice that can extend the cover crop establishment window in northern climates (Curran et al. Reference Curran, Hoover, Mirsky, Roth, Ryan, Ackroyd, Wallace, Dempsey and Pelzer2018), although commonly used species such as annual ryegrass [Lolium perenne (L.) ssp. multiflorum (Lam.) Husnot] often fail to produce sufficient biomass for weed suppression and may require tillage-based termination (Caswell et al. Reference Caswell, Wallace, Curran, Mirsky and Ryan2019; Curran et al. Reference Curran, Hoover, Mirsky, Roth, Ryan, Ackroyd, Wallace, Dempsey and Pelzer2018). Similarly, in some regions, organic growers often underseed red clover (Trifolium pratense L.) into winter cereals to provide nitrogen for subsequent corn crops (Mohler Reference Mohler, Mohler and Johnson2009). While this approach avoids tillage for establishment, it typically requires inversion tillage to terminate the legume, thereby reintroducing a soil disturbance event (Caldwell et al. Reference Caldwell, Mohler, Ketterings and DiTommaso2014; Cox et al. Reference Cox, Hanchar and Cherney2018).
In this study, we evaluated how three cropping systems that integrated different tillage and cover cropping strategies in a 3-yr organic grain rotation (corn–soybean–spelt [Triticum spelta L.]) affected (1) in-crop weed suppression, (2) spatial variation in weed community composition, and (3) weed seedbank dynamics. Drawing from community assembly theory, we hypothesized that weed communities are structured by the interaction of abiotic (e.g., soil disturbance) and biotic (e.g., crop competition and cover crop residue) management filters and higher-level cropping system level filters (e.g., crop sequence and cover crop legacy effects). We expected that (1) greater tillage intensity would strengthen abiotic filtering, resulting in lower diversity in the emerged weed community, particularly in interrow zones, where cultivation is concentrated with slower seedbank accumulation; (2) reduced-tillage systems with longer periods without soil disturbance would favor the dominance of opportunistic species, especially in soybean, where biotic filtering by the crop is weaker; and (3) cropping system level filtering would reflect the influence of management legacy filters on weed community composition, where interactions between management and environmental conditions shape both the emerged and seedbank communities across time.
Materials and Methods
Site Description and Experimental Design
A cropping systems experiment was conducted on certified organic land at the Pennsylvania State University Russell E. Larson Agricultural Research Center (RELARC) near Rock Springs, Pennsylvania (40.715000°N, 77.934167°W) from 2014 to 2017. The site had been managed using organic production practices in a corn–soybean–small grain rotation since 2010. The soil at the site was mainly Hagerstown silt loam soil (fine, mixed, semiactive, mesic Typic Hapludalfs), with some Opequon-Hagerstown soils (clayey, mixed, active, mesic Lithic Hapludalfs). The site has an average annual high/low temperature of 25/5.1 C, with annual rainfall averaging 1,006 mm. Annual precipitation was within 10% of the 10-yr average during each year of the study, and mean temperatures were 0.4 to 1.0 C warmer than the 10-yr average.
The cropping system experiment consisted of a 3-yr corn–soybean–winter spelt rotation with cover crops and tillage regimes differing across crop sequences. The experiment was designed as a randomized complete block, split-plot design with four replications. Corn, soybean, and winter spelt (CSW) were imposed in three main plots (18 by 96 m) using a full entry design by starting the experiment in each crop phase and maintaining the 3-yr rotation sequence (CSW, SWC, WCS), which allows for the presence of each cash crop in each production year. Due to our focus on weed community assembly in the corn–soybean sequences, we limit our analysis to the CSW and WCS entry points.
Experimental Systems and Field Operations
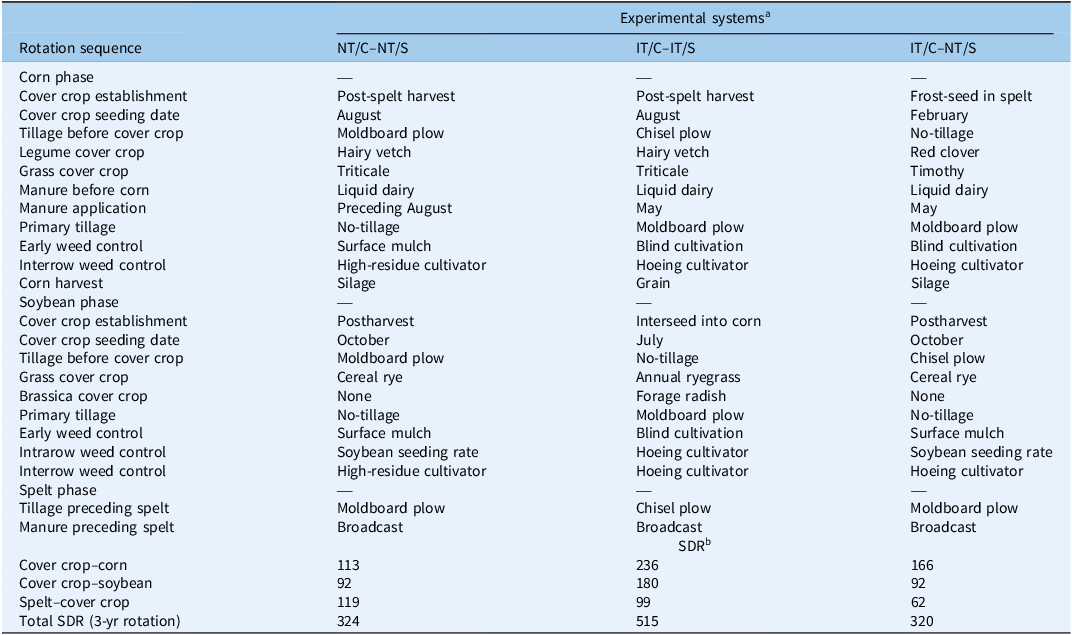
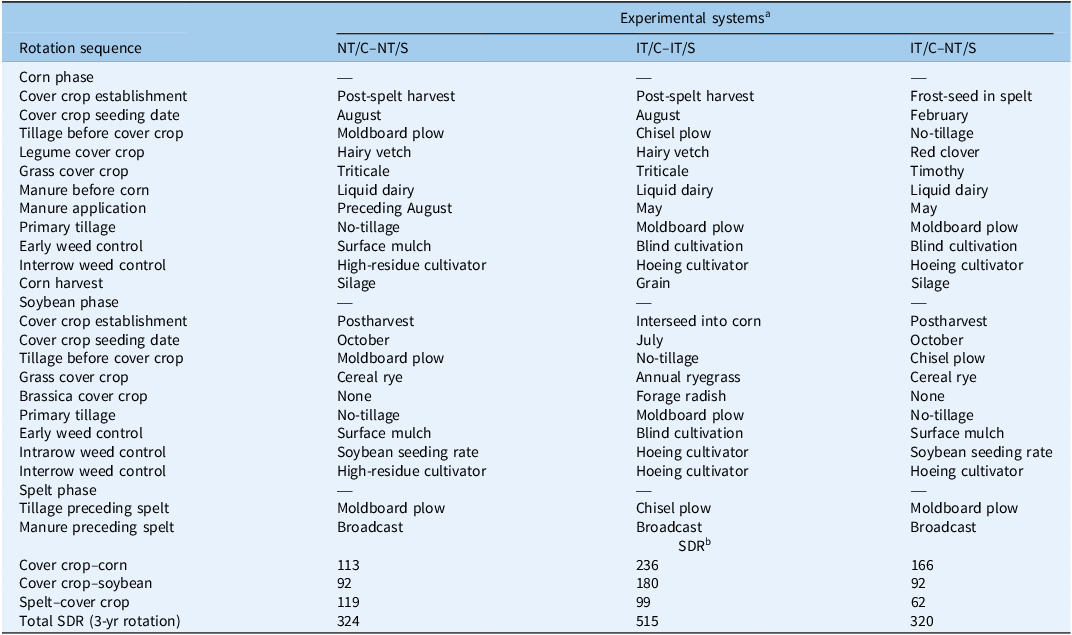
Three experimental cropping system treatments were imposed as split plots (9 by 49 m), including a (1) rotational no-till corn and no-till soybean (NT/C–NT/S) phase, (2) inversion tillage (moldboard plow, IT) preceding corn and soybean (IT/C–IT/S) phase, and (3) inversion tillage preceding corn and no-till preceding soybean (IT/C–NT/S) phase. Experimental systems were designed to vary in tillage intensity and frequency by coupling different cash and cover crop establishment methods. The term “no-till” (NT) refers specifically to the absence of primary tillage immediately before crop planting but does not preclude the use of high-residue cultivator. Corn and soybean were planted in 76-cm rows. The corn phase received 74,831 L ha⁻¹ liquid dairy manure applied and incorporated either in late summer before cover crop establishment or in spring at cover crop termination before corn planting. Cover crop termination, planting dates, and cultivation events were adaptively managed each season based on weather conditions and weed pressure. The disturbance regime was quantified within and across cash crop–cover crop sequences using the soil disturbance rating (SDR) derived from Revised Universal Soil Loss Equation 2 (RUSLE2) (USDA-NRCS 2016; Table 1). The SDR ranges from 0 (low) to 30 (high) for a single operation and is based on ratings for soil inversion, mixing, lifting, shattering, aeration, and compaction for a given practice. Summing SDRs of disturbance events within or across cropping sequences provides a relative and integrated assessment of tillage intensity and frequency (Kemanian and Stöckle Reference Kemanian and Stöckle2010). Cash and cover crop sequences are best viewed as coupled, with both previous and future crop sequences and cover crop management goals determining the level of tillage intensity employed.
Summary of management differences between four experimental systems within the winter spelt to cover crop sequence of a 3-yr corn–soybean–spelt rotation and mean soil disturbance ratings (SDR) between these systems within each cash crop to cover crop sequence.
a Experimental system treatments: NT, no-tillage; IT, moldboard plow; C, corn; S, soybean.
b The SDR (USDA-NRCS 2016) is derived from RUSLE2. Lower values indicate less cumulative soil disturbance across operations. Factors used to determine SDR index values include tillage type, equipment speed, depth of operation, and percentage of soil area disturbed. SDR is calculated by multiplying each field operation by its respective SDR value and summing all the values per year; the 3-yr average is reported.
In the rotational no-till corn and soybean system (NT/C–NT/S), a hairy vetch (Vicia villosa Roth ‘Groff’) and triticale (×Triticosecale Wittm. ‘TriCal 815’) mixture was seeded after spelt harvest and manure application and before the corn phase in late August at 34 + 34 kg ha−1 on 19-cm row spacing. The cover crop mixture was terminated using a front-mounted roller-crimper the following spring at hairy vetch early pod set. Corn (‘Master’s Choice 4050’, 90 d) was no-till planted immediately after roll-crimping at 81,510 plantsha−1 using a conservation no-till planter. Double-disk row cleaners were employed at planting to move cover crop residue away from the seed furrow and facilitate better seed-to-soil contact. Roll-crimping was repeated a second time just before corn emergence, as previous research has shown that multiple roller-crimper passes may be needed to improve termination efficacy (Keene et al. Reference Keene, Curran, Wallace, Ryan, Mirsky, Vangessel and Barbercheck2017). High-residue interrow cultivation was employed using up to two passes 4 and 5 wk after planting (WAP) as a supplemental weed control tactic. High-residue cultivators are designed with a single 50-cm sweep that runs between each corn row at approximately a 2- to 4-cm depth below the surface of the soil, severing the root from shoots of small weeds while minimizing cover crop residue and soil surface disturbance. Corn was harvested for silage in late September before a no-till soybean sequence. Both primary and secondary tillage were used to prepare a seedbed (Table 1), and cereal rye (Secale cereale L. ‘Aroostook’) was drill-seeded on 19-cm row spacing. Cereal rye was terminated with a roller-crimper the following spring at full anthesis (Zadoks 69), with termination timing ranging from the last week of May to the first week of June. Roll-crimping methods were similar to those used for corn. Soybean were no-till planted at 555,750 plt ha−1. We used higher cash crop seeding rates for no-till planting, because previous research has shown that (1) reduced stand establishment can occur when no-till planting into high-residue, cover crop mulch (Keene et al. Reference Keene, Curran, Wallace, Ryan, Mirsky, Vangessel and Barbercheck2017; Snyder et al. Reference Snyder, Curran, Karsten, Malcolm, Duiker and Hyde2016); and (2) increasing soybean planting rates can be an effective cultural weed management practice due to enhanced weed–crop competition via earlier crop canopy closure (Liebert and Ryan Reference Liebert and Ryan2017; Ryan et al. Reference Ryan, Mirsky, Mortensen, Teasdale and Curran2011). This experimental system employs the lowest tillage intensity in corn (SDR = 113) and soybean (SDR = 92) sequences due to use of rotational no-till practices.
In the second experimental system, inversion tillage was used preceding both corn and soybean (IT/C–IT/S). Following spelt, the hairy vetch–triticale mixture was established using the same seeding method. In the spring, the cover crop mixture was rotary mowed, and manure was applied just before moldboard plowing. Corn was planted approximately 7 to 10 d following primary tillage; planting occurred 1 to 2 wk earlier than in the no-till corn sequence. After corn planting, blind- (flex-tine weeder and rotary hoe) and interrow cultivation was used adaptively to provide in-season weed control. In-season cultivation events varied by year and were driven by weed recruitment levels and environmental conditions. At the last cultivation event between the V4-V5 corn growth stage, a cover crop mixture was interseeded. The mixture consisted of annual ryegrass ‘KB Supreme’, orchardgrass (Dactylis glomerata L. ‘Potomac’), and forage radish (Raphanus sativus L. ‘Tillage’) drilled at 11, 11, and 3.4 kg ha−1, respectively. This mixture was interseeded to allow cover crop establishment before corn grain harvest and was designed to increase nitrogen retention in manure-based, organic dairy systems (Finney et al. Reference Finney, White and Kaye2016). Field corn was harvested for grain in late October to early November, and the overwintering cover crop mixture was terminated in the spring before soybean planting in late May using inversion (moldboard) tillage. Secondary and tertiary tillage were conducted to create a seedbed, and soybean was planted at 444,600 plt ha−1 using a four-row planter. Terminating the cover crop via inversion tillage facilitated earlier soybean planting, except when wet spring conditions hindered field operations and delayed planting into June. After soybean planting, blind cultivation with a spring-tine harrow or a rotary hoe was used to control in-row weeds, and an interrow cultivator was used to control interrow weeds (Table 1). Following soybean harvest, non-inversion tillage (chisel plow) was employed before spelt seeding, which resulted in a comparatively lower average SDR rating (99) in the spelt–cover crop sequence. However, full inversion tillage was used in both corn and soybean, which resulted in the highest total tillage intensity and frequency (total SDR = 515) across the 3-yr rotation among experimental systems (Table 1).
In the third experimental system, inversion and no-tillage was used preceding corn and soybean, respectively (IT/C–NT/S). A cover crop mixture of medium red clover (‘VNS’) and timothy (Phleum pratense L. ‘Climax’) was frost seeded into spelt in March by drill-seeding on 19-cm row spacing at a seeding rate of 12 + 4.5 kg ha−1. Following spelt harvest, red clover/timothy was adaptively managed by either harvesting for forage in early fall or by mowing to suppress weeds, depending on sufficient fall growth. In spring, the cover crop was mowed again and incorporated with a moldboard plow following manure application. Corn was grown for silage, and planting and cultivation followed the same methods as in IT/C–IT/S. After corn harvest, cereal rye was established and rolled before NT soybean planting the next spring. This system combined high early-season disturbance in corn (SDR = 166) with low-disturbance soybean establishment (SDR = 92).
Data Collection
In corn and soybean phases, late-season weed biomass was sampled in mid-August using nine randomly placed 0.5-m2 quadrats per split plot. Each sample was positioned between crop rows in the middle of a planter pass. Quadrats (66 by 76 cm) were constructed to sample the area between crop rows (76 cm) and included a grid to partition interrow weeds from in-row weeds. The in-row weed grid space included the outside 12.7-cm width on each side, which corresponds to the zone that is not (or less) disturbed by high residue or interrow cultivator. The interrow weed grid space included the inside 51-cm width of the quadrat, which corresponded to the zone targeted by interrow cultivation. In each quadrat, weeds were collected separately by location (in-row and interrow). Weeds were clipped at ground level, separated by species, and dried for at least 5 d at 65 C before weighing. Biomass was averaged across subsamples and by location (in-row and interrow) before statistical analyses.
Weed seedbanks were sampled annually in early March from 2015 to 2017 (n = 3 sampling periods) at the split-plot level in corn and soybean main plots. This sampling scheme allowed for assessment of two annual time steps (2015 to 2016 and 2016 to 2017) to measure cover crop–corn and cover crop–soybean sequence effects on weed seedbanks within our 3-yr crop rotation. Weed seedbanks were sampled by taking nine random soil cores in the interior (6 by 30 m) of each split plot. Soil was sampled using a 5-cm-diameter core at a 20-cm depth, resulting in 720 cm2 of surface area and a 400-cm3 volume sampled per split plot. Seedbank samples (n = 9) were composited at the split-plot level.
Germinable weed seedbank assays were conducted to quantify relative differences among experimental systems in annual weed seedbank density (Reinhardt and Leon Reference Reinhardt and Leon2018). Before initiation of germinable assays, soils were stored at 4 C for 2 mo, removed from storage and allowed to thaw, sieved to 5 mm, homogenized, and then transferred to plastic trays with drainage holes (25 by 50 cm depth) containing 1 cm of vermiculite to facilitate draining. Prepared samples were placed in a greenhouse with 28 C day temperatures and 13 to 15 h of daylight and watered daily to maintain soil moisture close to field capacity. Weed seedlings were counted when identifiable by species and then removed by hand on a weekly to biweekly basis. When no new weed seedlings emerged over a 2-wk time span, the soil was allowed to air-dry, remixed, sieved, and fertilized. Each germination cycle lasted 4 to 6 wk, and the procedure was repeated for a total of three consecutive cycles to exhaust the germinable seedbank. The total number of weed seedlings emerged per treatment was scaled to 1-m2 surface area and used as an estimate of weed seedbank density.
Statistical Analysis
Species richness and alpha diversity metrics, which included Shannon’s diversity (H′) and Pielou’s evenness (J′), were calculated at the split-plot level by summing across subsamples using the vegan package (Oksanen et al. Reference Oksanen, Simpson, Blanchet, Kindt, Legendre, Minchin, O’Hara, Solymos, Stevens, Szoecs, Wagner, Barbour, Bedward, Bolker and Borcard2025). Each ANOVA model was fit using experimental system (n = 3), crop entry (n = 2), and their interaction as fixed effects and block as a random effect. The emmeans package was used to obtain least-square means on the response scale and pair-wise comparisons for significant interactions using the adjusted Tukey’s procedure (Lenth Reference Lenth2017).
To make entry points more comparable, data collected at the same crop:system for both entry points were included in each analysis, rather than comparing entry points within a given system and crop. The effect of experimental entry (n = 2; CSW, WCS), system (n = 3), crop (n = 2; corn, soybean), and their interaction on the composition of the seedbank was evaluated with permutation-based, multivariate ANOVA and Bray-Curtis distances using the adonis2 function in the vegan package (Oksanen et al. Reference Oksanen, Simpson, Blanchet, Kindt, Legendre, Minchin, O’Hara, Solymos, Stevens, Szoecs, Wagner, Barbour, Bedward, Bolker and Borcard2025).
For the expressed weed community, a second analysis was also performed in the same way as for the weed seedbank. Pair-wise comparisons were conducted between systems within each crop phase, specifically comparing tilled and no-till systems (NT/C–NT/S corn vs. IT/C–IT/S corn; NT/C–NT/S corn vs. IT/C–NT/S corn; IT/C–IT/S corn vs. IT/C–NT/S corn; NT/C–NT/S soybean vs. IT/C–IT/S soybean; NT/C–NT/S soybean vs. IT/C–NT/S soybean; IT/C–IT/S soybean vs. IT/C–NT/S soybean) to identify potential differences. Additionally, the interaction with sampling location (interrow vs. intrarow) was included to evaluate how weed community composition varied across these spatial positions.
Weed species that occurred in less than 2% of sampled quadrats were removed from the data, and the biomass of each species was then expressed as a proportion of the total biomass at the split-plot level before analysis. Standardizing biomass data in this way allows for assessment of differences in community composition rather than abundance. Significant differences between treatments were evaluated using a Monte Carlo procedure (2,000 permutations) at the P < 0.05 level. We conducted distance-based redundancy analysis (dbRDA) to visualize the variation in weed communities, which is a constrained ordination technique suitable for exploring the relationship between community composition (Legendre and Anderson Reference Legendre and Anderson1999). The dbRDA was performed using the dbrda function in the vegan package (Oksanen et al. Reference Oksanen, Simpson, Blanchet, Kindt, Legendre, Minchin, O’Hara, Solymos, Stevens, Szoecs, Wagner, Barbour, Bedward, Bolker and Borcard2025). The envfit function was used to fit weed species and entry point, crop, experimental system, and location as factors (i.e., centroids) to the ordination and assess the relative strength of association (adjusted r2). In addition, an indicator species analysis (ISA) was conducted to identify species significantly associated with specific experimental systems and crop. This analysis was performed using the indicspecies package in R (De Cáceres and Legendre Reference De Cáceres and Legendre2009), which calculates indicator values based on species fidelity and specificity. Indicator species were determined using 999 permutations, and species with significant associations (P < 0.05) were reported for each treatment combination. Finally, heat map plots were constructed to visualize relative abundance of species within both emerged communities and seedbank. All statistical analysis was carried out in R v. 4.1.2 (R Core Team 2022) with visualization in ggplot2 (Wickham Reference Wickham2016). Minor language editing of the manuscript was assisted by ChatGPT. No scientific content, data analyses, or interpretations were generated by AI.
Results and Discussion
Our study was grounded in community assembly theory, which posits that weed communities are shaped by a combination of abiotic, biotic, and management legacy filters. We hypothesized that tillage intensity, crop competition, and cover crop practice would interact to influence weed diversity and composition, with more intensive and frequent disturbance reducing diversity, reduced-tillage systems favoring opportunistic annuals species like giant foxtail (Setaria faberi Herrm.), and entry point effects reflecting the influence of prior management on both the seedbank and emerged communities. Our results partially confirmed these expectations, although the relative strength of each filter varied with crop phase and spatial location within the field.
Dominant Species in the Experiment
A total of 402,270 seedlings representing 38 weed species were identified in the seedbank assay. The most frequently occurring species within seedbank assays included S. faberi (54.6% of all seedlings pooled), purslane speedwell (Veronica peregrina L.) (8.5%), eastern black nightshade (Solanum ptychanthum Dunal) (8.4%), yellow woodsorrel (Oxalis stricta L.) (7.9%), smooth pigweed (Amaranthus hybridus L.) (5.5%), and common lambsquarters (Chenopodium album L.) (4.2%)
In the emerged weed community, there were 33 identified weed species. The most frequently occurring species varied based on the crop, but several species dominated when pooled over crops: S. faberi (83.5% of total biomass), common ragweed (Ambrosia artemisiifolia L.) (4.9%), redroot pigweed (Amaranthus retroflexus L.) (4.3%), and yellow nutsedge (Cyperus esculentus L.) (2.0%).
Weed Diversity Indexes of the Seedbank and Emerged Weed Community
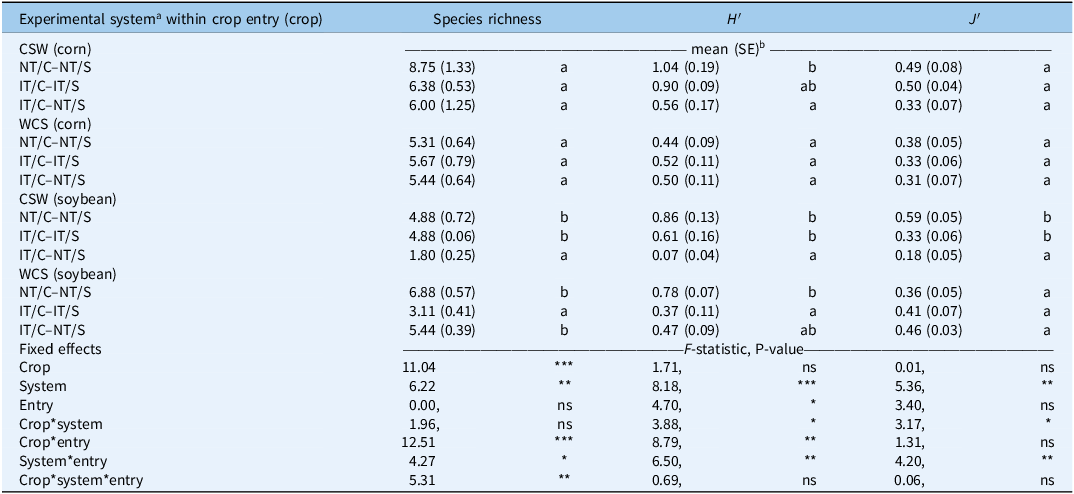
The impact of the experimental system on weed community structure varied across crop entries and crop (Table 2). The entry point in the rotation (CSW vs. WCS) significantly influenced both seedbank- and biomass-based diversity measures.
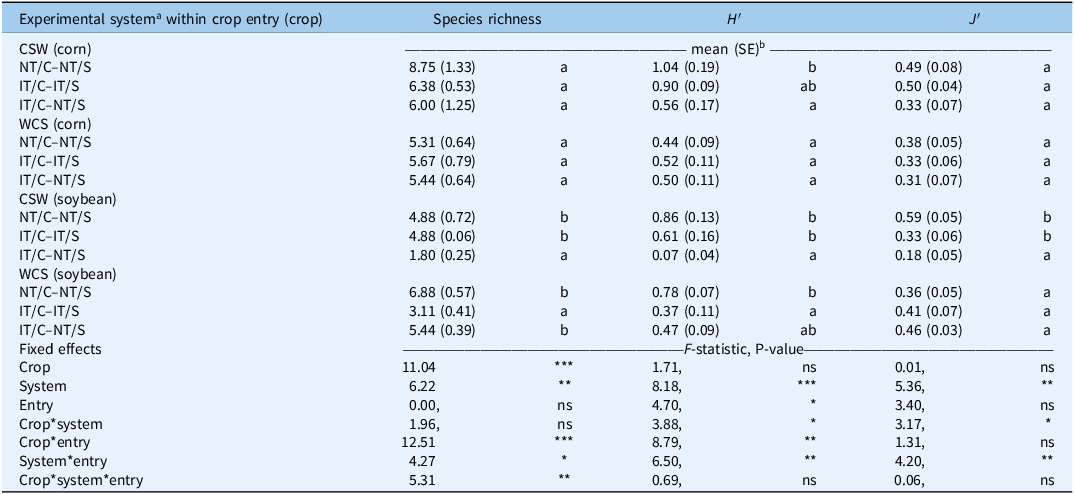
Effect of experimental system, crop, and their interaction on weed species richness, diversity (Shannon diversity index; H′), and evenness (Pielou’s index; J′).a
a Experimental system treatments: NT, no-tillage; IT, moldboard plow; C, corn; S, soybean.
b Responses are presented as treatment level means (SE). Significance tests: ns, P > 0.05; *, P < 0.05; **, P < 0.01; ***, P < 0.001. Mean separations are displayed in the presence of a significant interaction, where treatments containing the same lowercase letter within entry: crop are not significantly different (P > 0.05).
As shown in Table 2, in the soybean phase of the CSW entry, significant differences were observed in species richness, species diversity (H′), and evenness (J′) with a similar pattern. Both NT/C–NT/S and IT/C–IT/S had similarly high Shannon diversity values (0.86 and 0.61, respectively), while IT/C–NT/S showed markedly lower diversity (0.07), significantly different from the other two systems. Similarly, the evenness index was higher in NT/C–NT/S and IT/C–IT/S (0.59 and 0.33, respectively) compared with IT/C–NT/S (0.18). In the soybean phase of the WCS entry, species richness differed significantly among systems: NT/C–NT/S and IT/C–NT/S had the highest number of species (6.88 and 5.44, respectively), and significantly more than IT/C–IT/S (3.11). Shannon diversity (H′) followed the same trend (0.78 in NT/C–NT/S, 0.47 in IT/C–NT/S, and 0.37 in IT/C–IT/S), but only NT/C–NT/S was significantly higher than IT/C–IT/S (Table 2).
In the corn phase of both crop entries (CSW and WCS), diversity responses were less pronounced. In the CSW entry, NT/C–NT/S showed the highest species richness but also a high variability (8.75 ± 1.33) that may explain the lack of significant differences across systems. However, Shannon diversity (H′) was significantly higher in NT/C–NT/S (1.04) compared with IT/C–NT/S (0.56), with IT/C–IT/S (0.90) not differing from either. In the WCS entry, no significant differences were detected for species richness or diversity indices among systems (Table 2).
WCS entry consistently exhibited lower species richness, suggesting less complex communities potentially shaped by preceding winter annual spelt. These legacy effects may result from less competitive crop stands in CSW or prolonged periods of reduced disturbance, which promote species accumulation in the soil seedbank (Jernigan et al. Reference Jernigan, Caldwell, Cordeau, DiTommaso, Drinkwater, Mohler and Ryan2017; Smith and Gross Reference Smith and Gross2006). Similarly, Teasdale et al. (Reference Teasdale, Mirsky and Cavigelli2019) highlighted the persistent influence of crop sequence and cereal entry points on weed seedbank composition, even when other management factors were held constant.
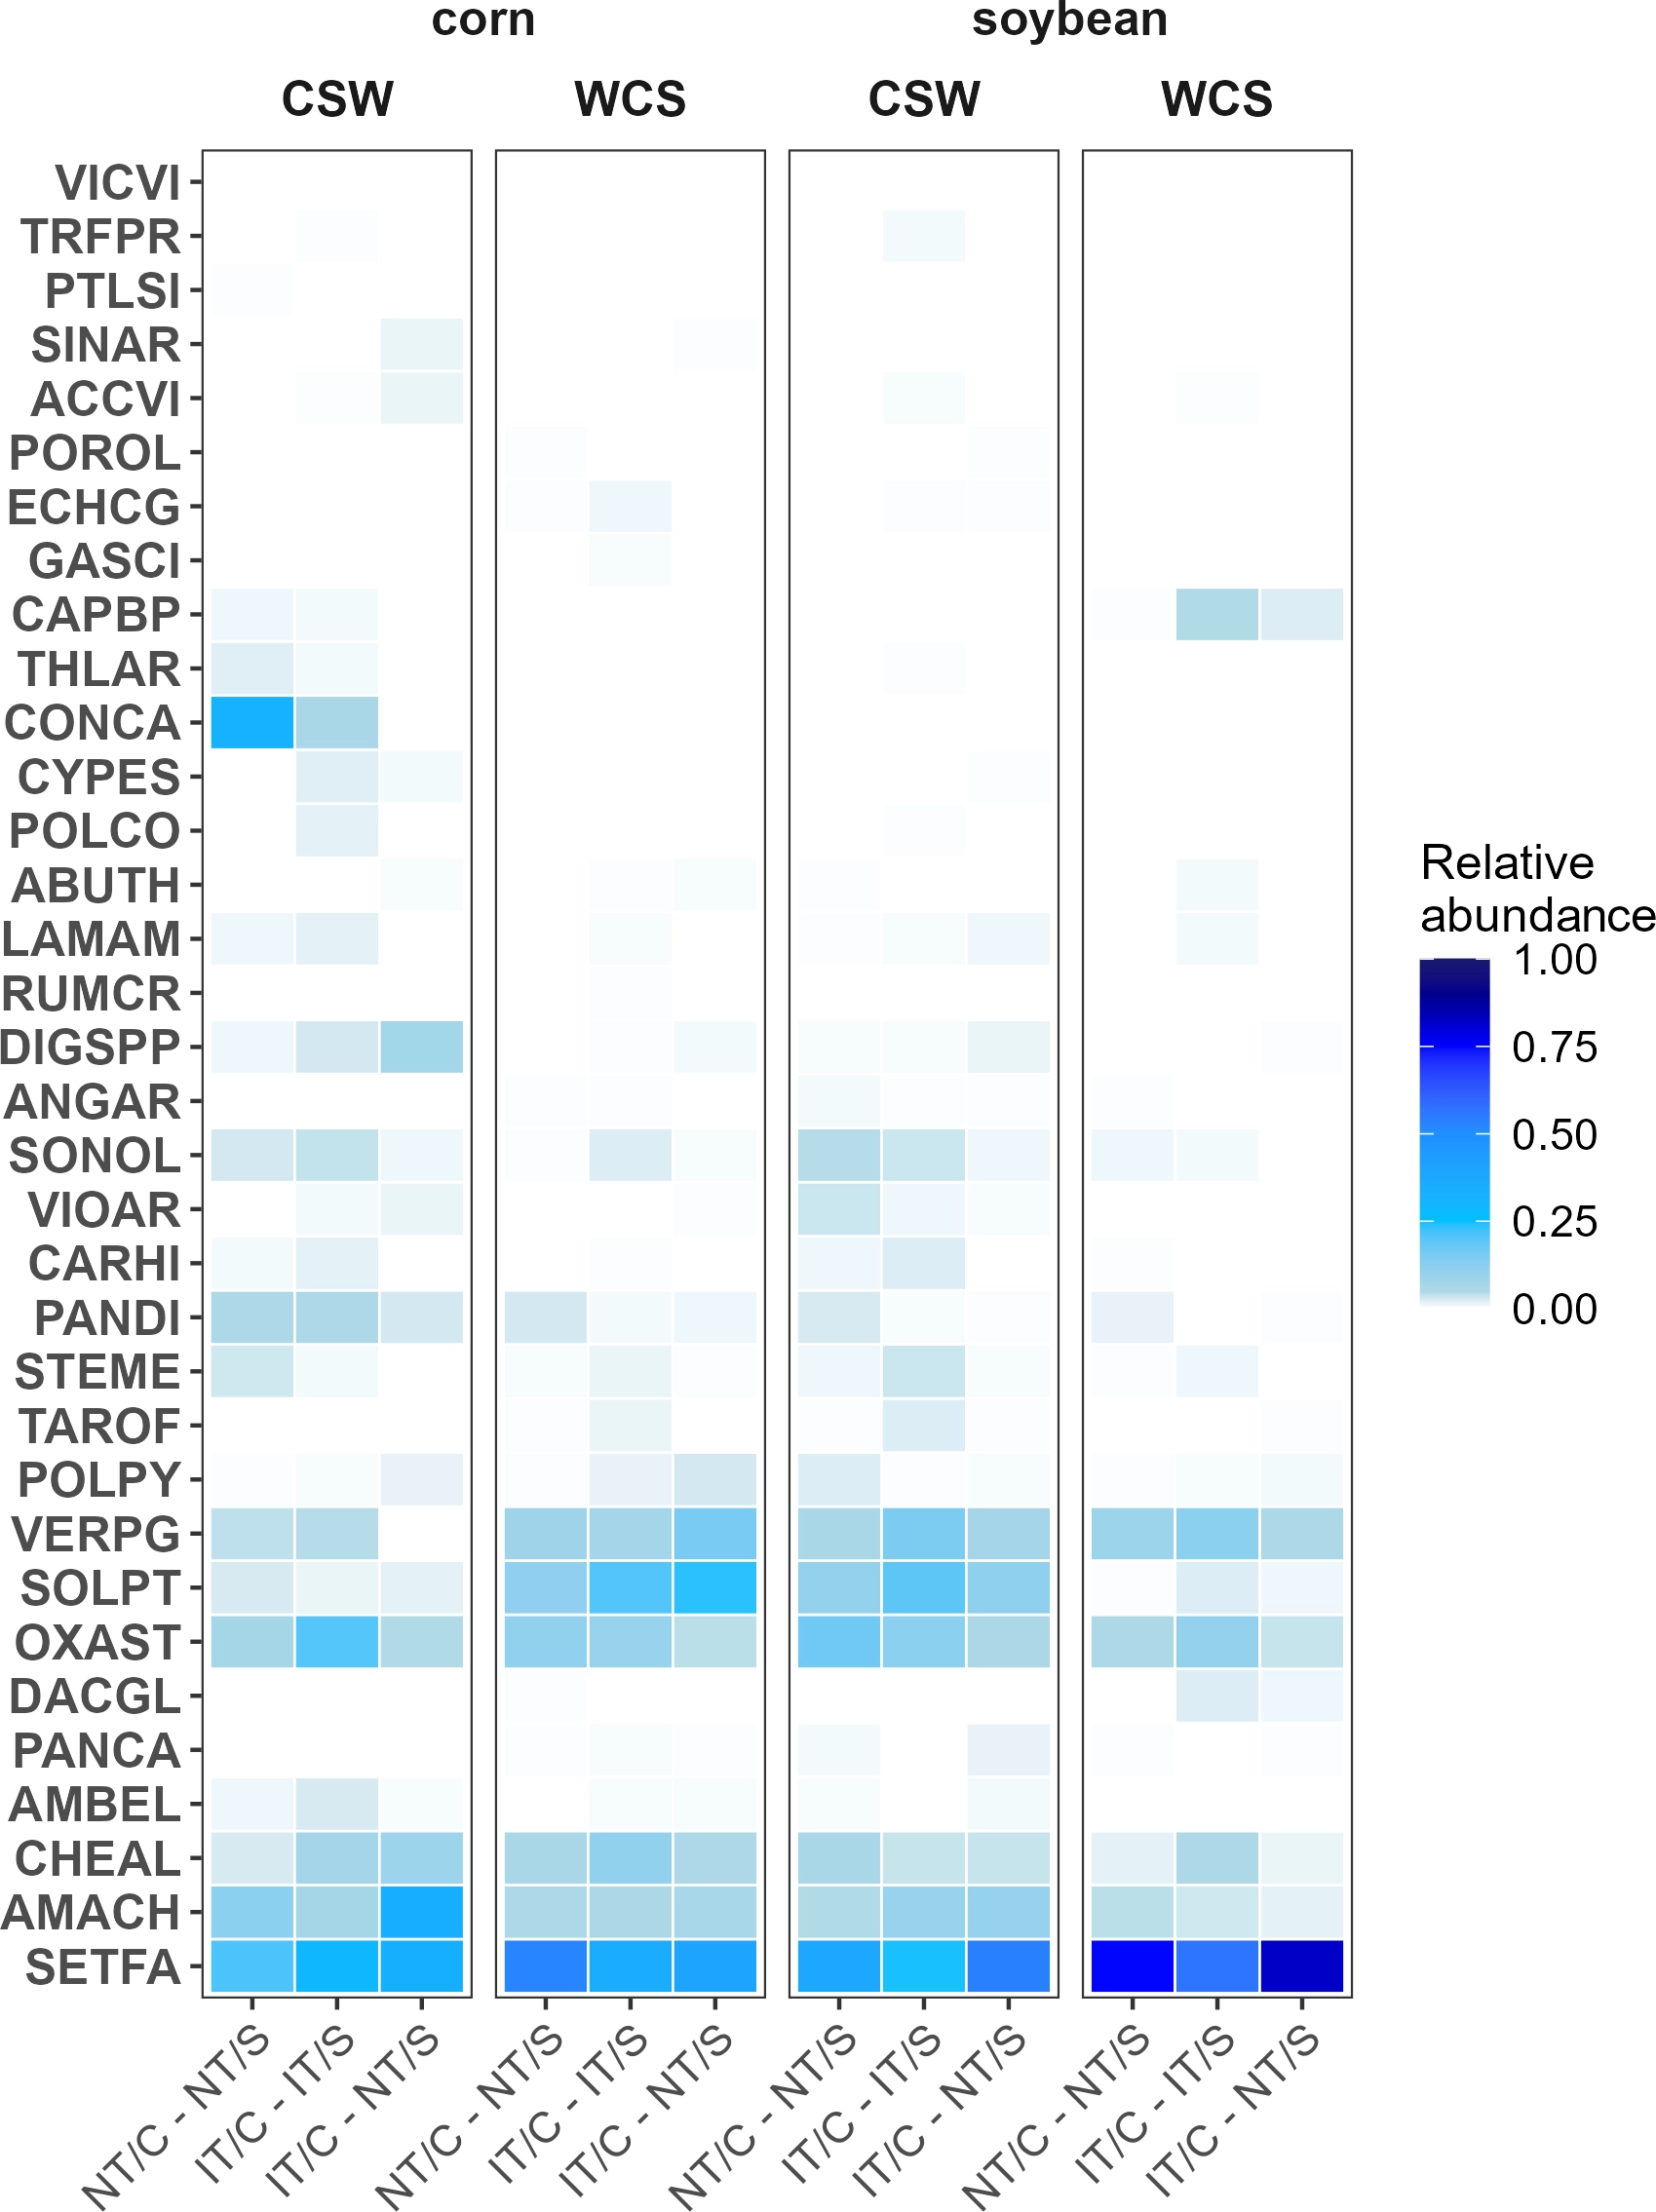
The ISA of seedbank density suggested that horseweed [Erigeron canadensis L.; syn.: Conyza canadensis (L.) Cronquist] was strongly associated with NT/C–NT/S in corn (P = 0.0074) in entry CSW (Figure 1). While S. faberi was the most abundant species across all treatments, it was particularly dominant in the soybean crop (P = 0.03, Figure 1).
Proportional abundance of weed species present in the weed seedbank, expressed as proportion of total weed seedlings by cropping system sequence, crop, and crop entry. Weed species are denoted using EPPO codes. The species present in the analysis include: Vicia villosa (VICVI), Trifolium pratense (TRFPR), Potentilla simplex Michx. (PTLSI), Sinapis arvensis L. (SINAR), Acalypha virginica L. (ACCVI), Portulaca oleracea L. (POROL), Echinochloa crus-galli (L.) P. Beauv. (ECHCG), Galeopsis speciosa Mill. (GASCI), Capsella bursa-pastoris (CAPBP), Thlaspi arvense L. (THLAR), Erigeron canadensis (CONCA), Cyperus esculentus (CYPES), Polygonum convolvulus L. (POLCO), Abutilon theophrasti Medik. (ABUTH), Lamium amplexicaule L. (LAMAM), Rumex crispus L. (RUMCR), Digitaria spp. (DIGSPP), Anagallis arvensis L. (ANGAR), Sonchus oleraceus L. (SONOL), Viola arvensis Murray (VIOAR), Cardamine hirsuta L.(CARHI), Panicum dichotomiflorum Michx. (PANDI), Stellaria media (STEME), Taraxacum officinale (TAROF), Polygonum persicaria L. (POLPY), Veronica peregrina L. (VERPG), Solanum ptychanthum (SOLPT), Oxalis stricta (OXAST), Dactylis glomerata (DACGL), Panicum capillare L. (PANCA), Ambrosia elatior L. (AMBEL), Chenopodium album (CHEAL), Amaranthus hybridus (AMACH), and Setaria faberi (SETFA). Experimental system treatments: NT, no-tillage; IT, moldboard plow; C, corn; S, soybean. Crop entries include CSW and WCS, which correspond to corn and soybean production.

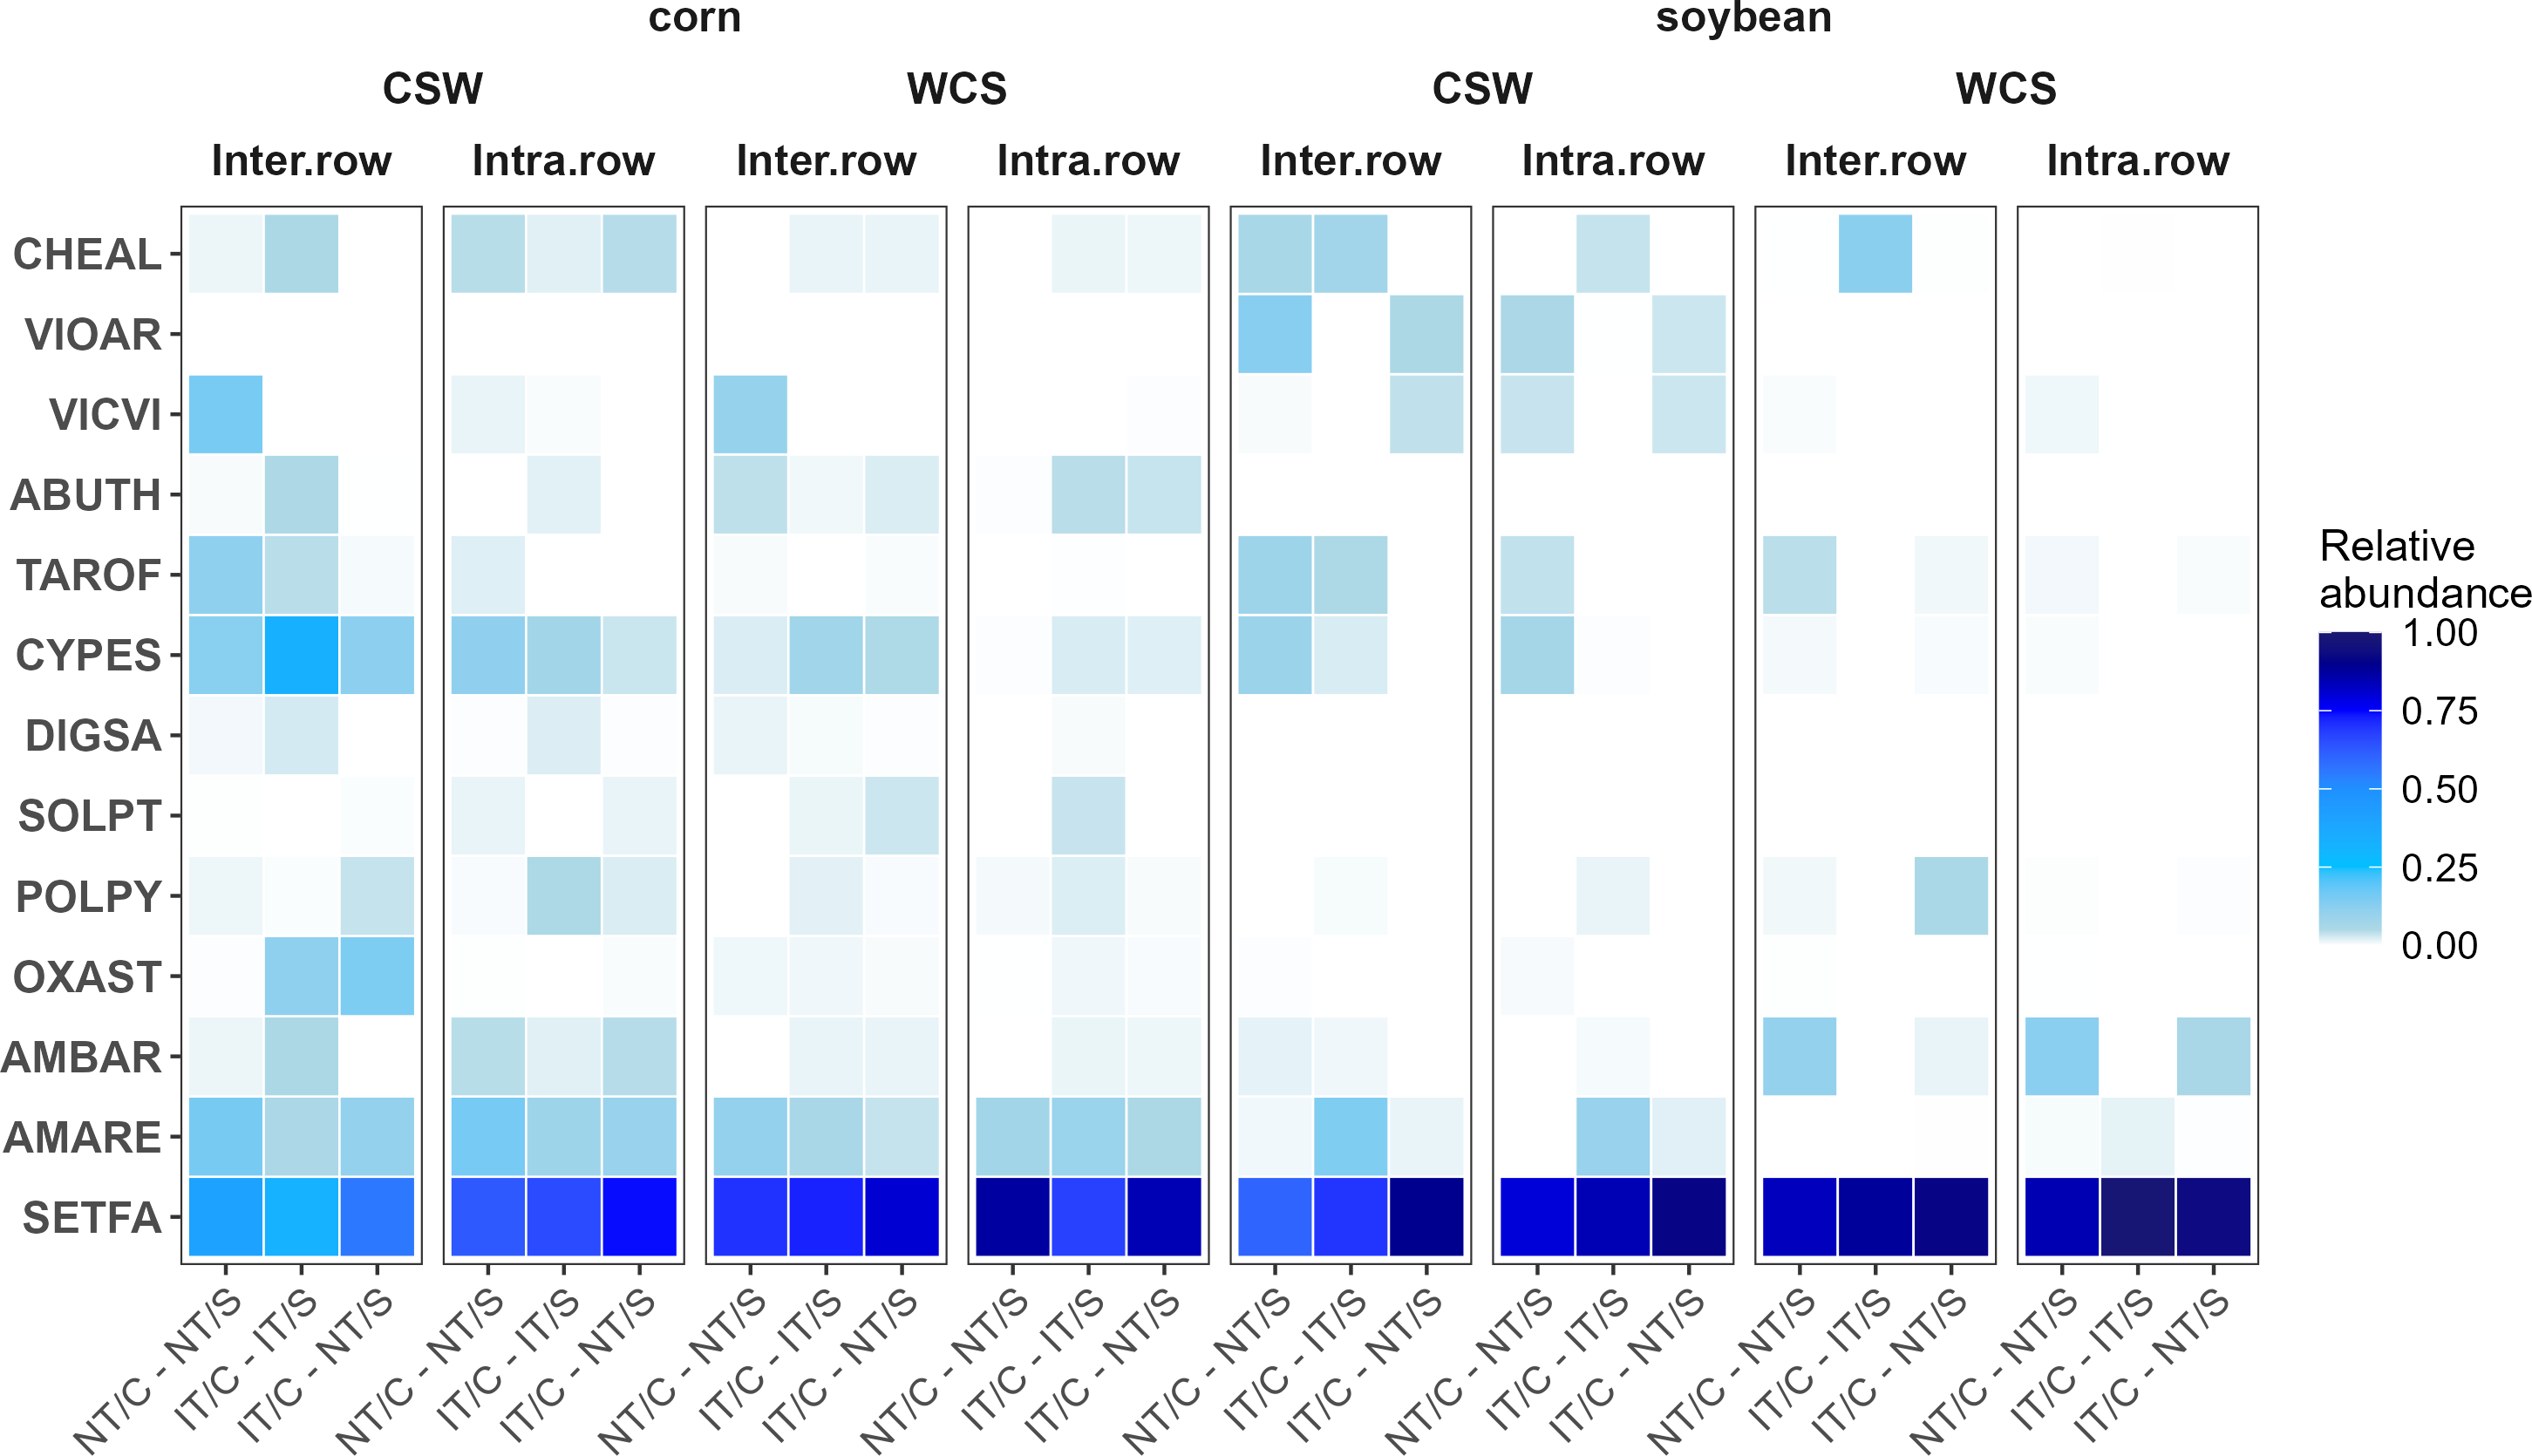
The aboveground biomass of the dominant annual weed S. faberi was significantly associated with IT/C–NT/S in the soybean crop (P = 0.0012) and was also more prevalent in intrarow locations (P = 0.0038). Amaranthus retroflexus and the cover crop species V. villosa were strongly associated with NT/C–NT/S in corn (P = 0.0002 and P = 0.0088, respectively), with A. retroflexus also showing a significant association with intrarow locations in corn (P = 0.0004; Figure 2). Similarly, dandelion (Taraxacum officinale F.H. Wigg) was strongly associated with the NT/C–NT/S cropping system in soybean (P = 0.004).
Proportional abundance of weed species, expressed as proportion of total emergent weed biomass by sampling location, crop entry, crop, and cropping system. Weed species are denoted using EPPO codes. The species included in the analysis are: Chenopodium album (CHEAL), Viola arvensis Murray (VIOAR), Vicia villosa (VICVI), Abutilon theophrasti Medik. (ABUTH), Taraxacum officinale (TAROF), Cyperus esculentus (CYPES), Digitaria sanguinalis (DIGSA), Solanum ptychanthum (SOLPT), Polygonum persicaria L. (POLPY), Oxalis stricta (OXAST), Ambrosia artemisiifolia (AMBAR), Amaranthus retroflexus (AMARE), and Setaria faberi (SETFA). Experimental system treatments: NT, no-tillage; IT, moldboard plow; C, corn; S, soybean. Crop entries include CSW and WCS, which correspond to corn and soybean production; sampling location was interrow or intrarow.
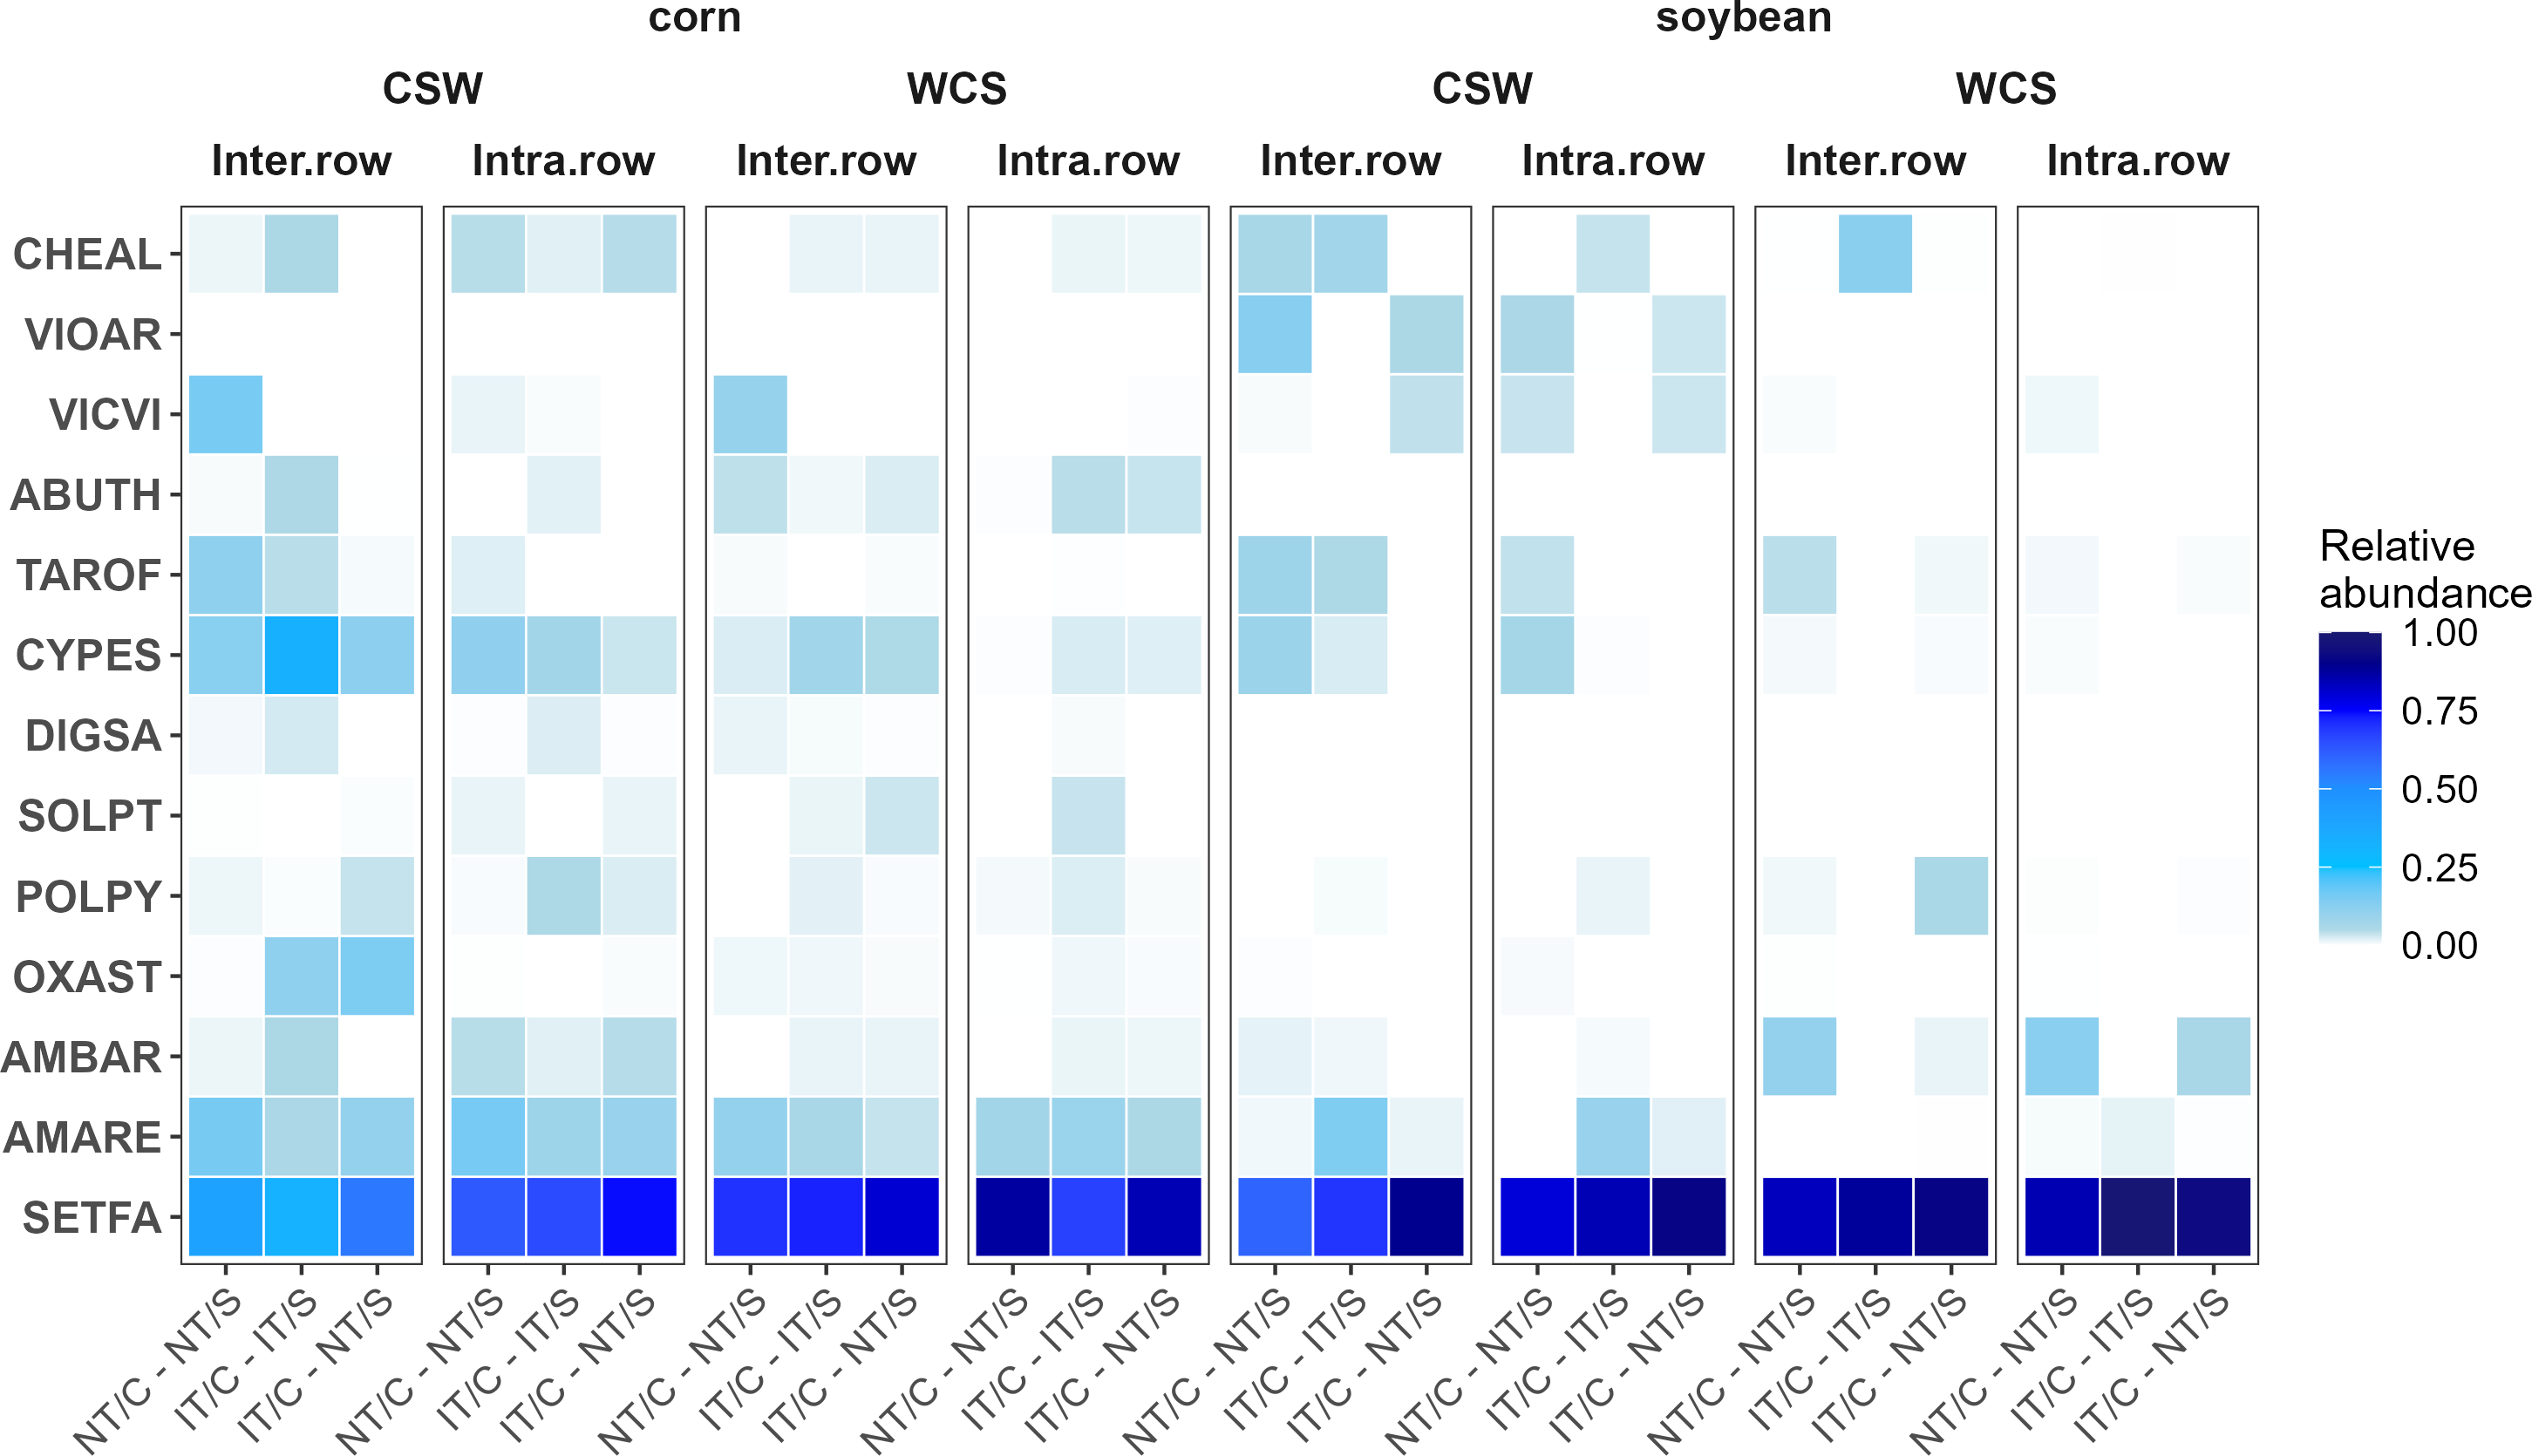
Additionally, large crabgrass [Digitaria sanguinalis (L.) Scop.] and the perennial species C. esculentus were strongly associated with IT/C–IT/S in corn (P = 0.020 and P = 0.028, respectively). Notably, C. esculentus and O. stricta were predominantly found in interrow locations in corn (P = 0.0004 and P = 0.0096, respectively). These patterns, visualized in the heat map (Figure 2), highlight the differential responses of weed species to cropping systems and spatial positioning within the crop row structure.
Setaria faberi was consistently identified as an indicator species for IT/C–NT/S in soybean and in intrarow zones, reinforcing its dominance under low-competition conditions and low disturbance. In contrast, species such as D. sanguinalis and C. esculentus were associated with IT/C–IT/S in corn, likely reflecting adaptation to higher-disturbance regimes. These patterns are consistent with studies reporting that cover crop termination strategy and mulch quality determine which species persist in reduced-tillage systems (Mirsky et al. Reference Mirsky, Ryan, Curran, Teasdale, Maul, Spargo, Moyer, Grantham, Weber, Way and Camargo2012; Vincent-Caboud et al. Reference Vincent-Caboud, Casagrande, David, Ryan, Silva and Peigné2019).
Seedbank and Emerged Weed Community Composition
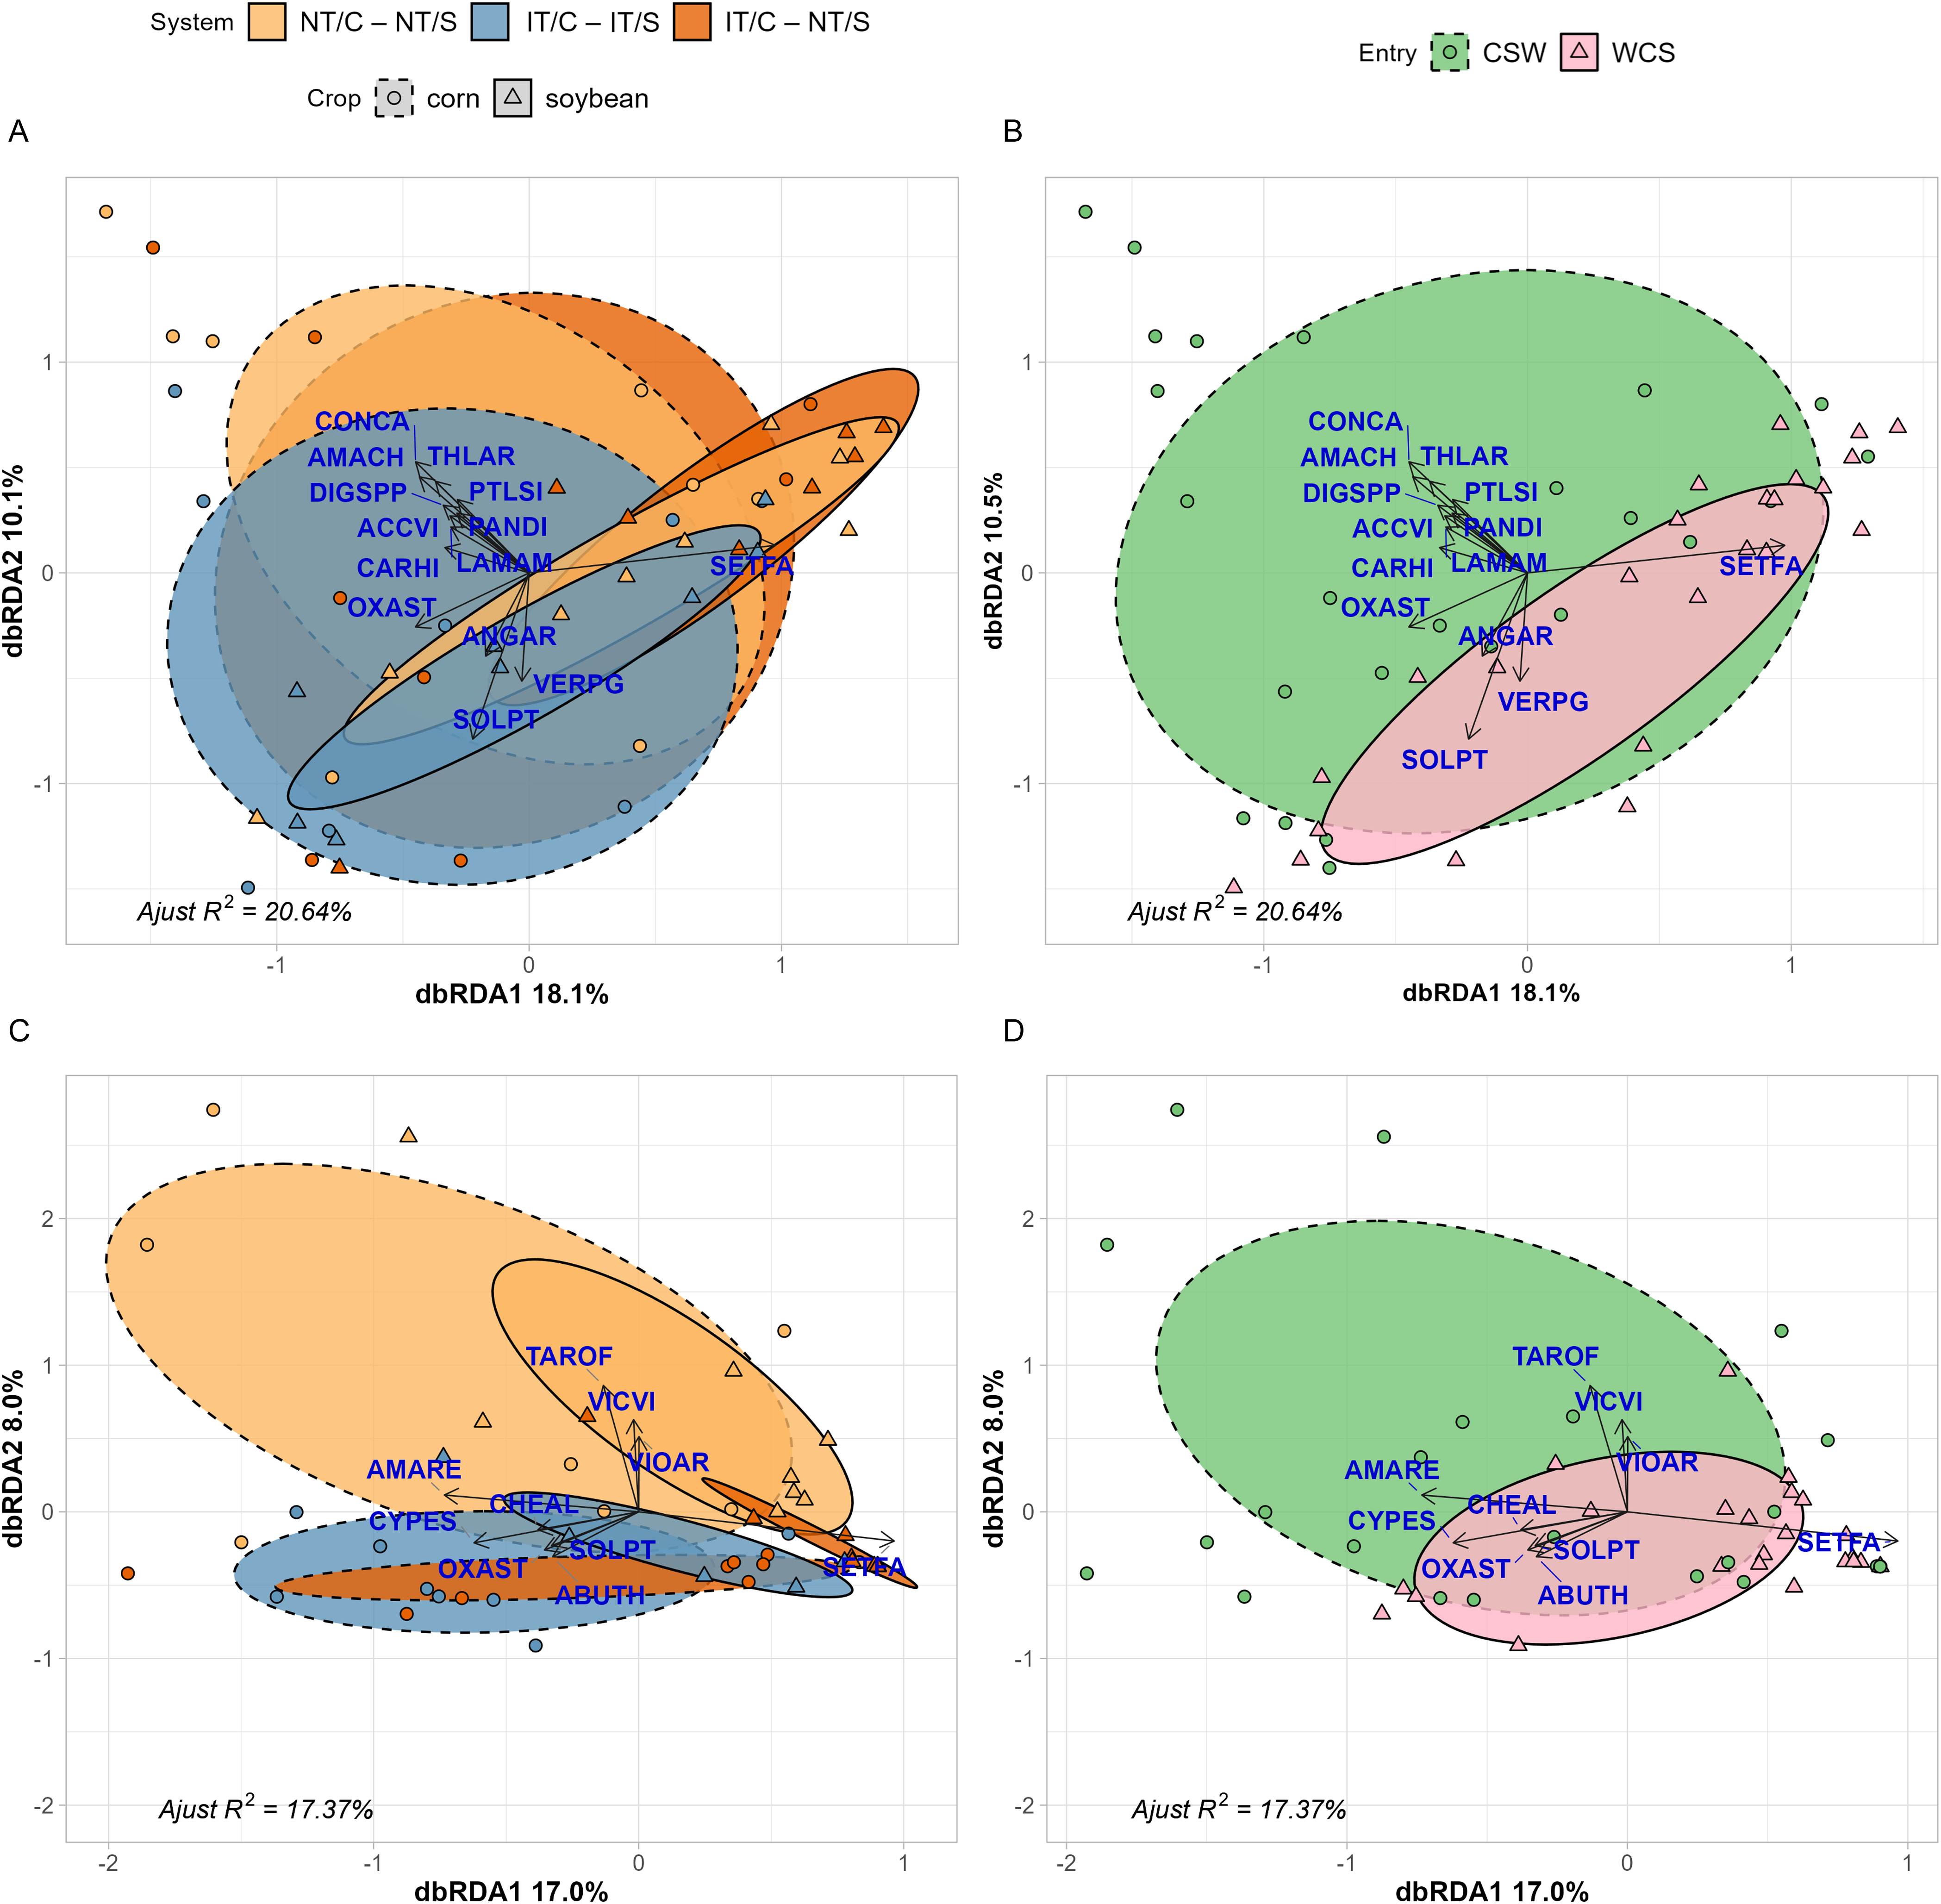
Crop and entry points influenced weed seedbank communities (Figure 3A and B, P = 0.01and P = 0.001, respectively). However, cropping system and its interaction with crop did not significantly affect them (P = 0.065 and P = 0.191, respectively).
Results of distance-based redundancy analysis (dbRDA) at the weed community level using weed seedbank density (A and B) and emerged weed biomass abundance metrics (C and D). (A and C) Models show species responses to cropping system (NT/C–NT/S, IT/C–IT/S, IT/C–NT/S), crop (corn and soybean), and their interaction after removing variance in experimental block. (B and D) Position of entry points in the ordination space. Ellipses show 95% confidence interval around system:crop centroids. The labels are EPPO codes. The species included in the analysis are: Abutilon theophrasti Medik. (ABUTH), Acalypha virginica L. (ACCVI), Amaranthus hybridus (AMACH), Amaranthus retroflexus (AMARE), Anagallis arvensis (ANGAR), Cardamine hirstua L. (CARHI), Erigeron canadensis (CONCA), Cyperus esculentus (CYPES), Digitaria spp. (DIGSSP), Lamium amplexicaule L. (LAMAM), Oxalis stricta (OXAST), Panicum dichotomiflorum Michx. (PANDI), Polygonum persicaria L. (POLPY), Potentilla simplex Mitchx. (PTLSI), Setaria faberi (SETFA), Solanum ptychanthum (SOLPT), Taraxacum officinale (TAROF), Thlaspi arvense (THLAR), Veronica persica L. (VERPG), Vicia villosa (VICVI), and Viola arvensis Murray (VIOAR). Arrows represent increasing species abundance, and points show the locations of the communities in each of the four experimental blocks for each system:crop combination (A and C) and entry point (B and D) in the ordination space. Experimental system treatments: NT, no-tillage; IT, moldboard plow; C, corn; S, soybean. Crop entries include CSW and WCS.
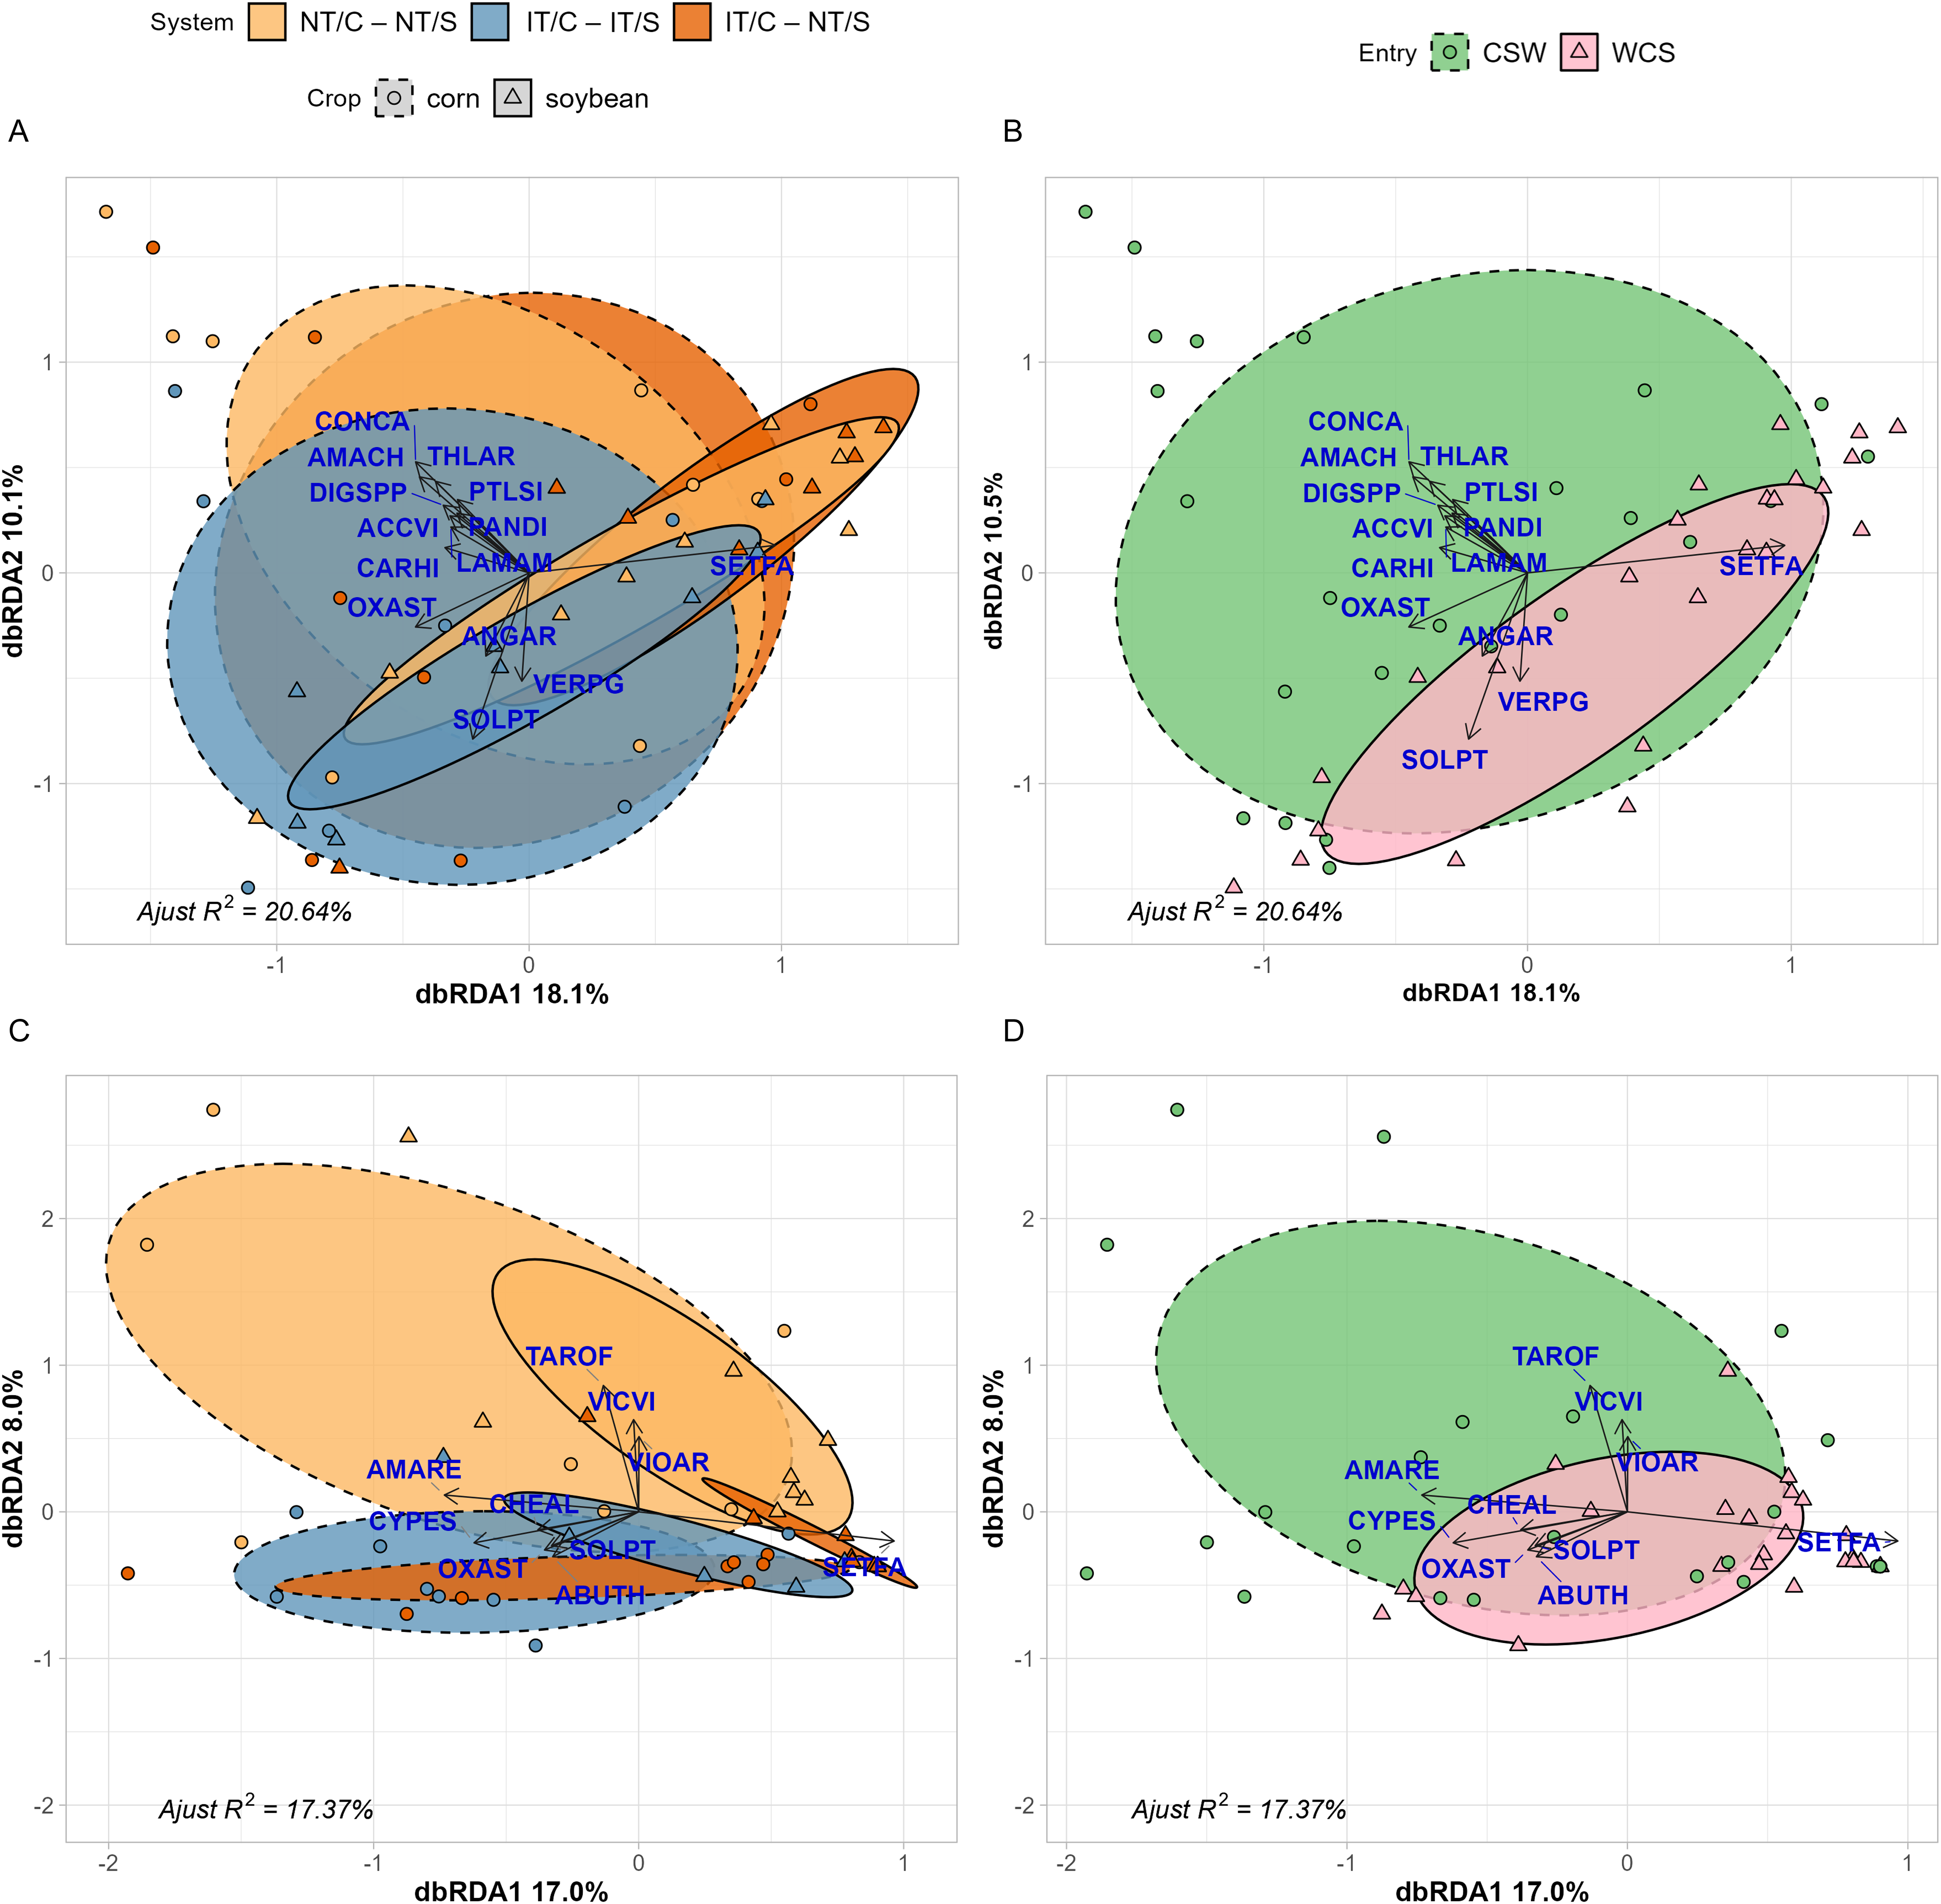
In the weed seedbank, the partial residual variance of the constrained terms, after the removal of block effect, explained 20.64% of the variance in the seedbank abundance matrix. Both the first (RDA1) and second (RDA2) axes accounted for 18.1% and 10.1% of this explained variance, respectively. The first axis primarily discriminated between corn and soybean, driven by the dominance of S. faberi in soybean and of E. canadensis in corn (Figure 3A). The cropping systems overlapped within both soybean and corn crops. Higher densities of winter annual species such as E. canadensis and field pennycress (Thlaspi arvense L.) and summer weed species such as A. hybridus explained the separation of corn in the second axis (Figure 3A). The weed community within the CSW seedbanks had a greater number of species compared with the WCS entry, which was strongly influenced by S. faberi (Figure 3B).
The interaction between cropping system and crop had a significant effect on emerged weed communities (P = 0.047; Figure 3C). Entry point, cropping system, and crop also significantly influenced the composition of the emerged weed community that survived weed control interventions (P = 0.001, P = 0.01 and P = 0.001, respectively; Figure 3D). The partial residual variance of the constrained terms, after the removal of block effect, explained 17.37% of the variance in the weed biomass abundance matrix. Both the first (RDA1) and second (RDA2) axes accounted for 17.0% and 8.0% of this explained variance, respectively.
The first axis discriminated between corn and soybean, driven by a strong association of S. faberi with soybean (Figure 3C). In contrast, the second axis discriminated among cropping systems. No significant differences were found among experimental systems in the corn phase. Conversely, all three experimental systems were distinct within the soybean phase (Figure 3C). As observed for the seedbank community, the emerged weed community had a greater diversity in the CSW entry, whereas entry WCS was predominantly influenced by S. faberi (Figure 3D).
These results indicate that the effects of organic cropping systems on weed biomass and seedbank abundance are highly dependent on crop phase (Figure 3) and within-field spatial context (Figure 2), particularly differences between interrow and intrarow zones that experience contrasting disturbance. The dominance of S. faberi in reduced-tillage, particularly in soybean, suggests that disturbance regimes interact with crop competition to filter weed species based on adaptive traits. In soybean, where canopy closure is delayed and competition is weaker, reduced soil disturbance (chisel plow) when establishing the cereal rye cover crop in IT/C–NT/S may have allowed S. faberi to establish and dominate, resulting in low-diversity communities. Although S. faberi is typically considered disturbance adapted (Nurse et al. Reference Nurse, Darbyshire, Bertin and DiTommaso2009), its dominance in reduced-tillage systems—particularly within intrarow zones of soybean—suggests that spatially restricted disturbance and weak crop competition can create ecological niches similar to open disturbed environments such as previous corn. Conversely, inversion tillage in previous cover crop of soybean in NT/C–NT/S, with greater disturbance (moldboard plow) to establish the cereal rye cover crop and tilled soybean in IT/C–IT/S, supported a more diverse weed community in soybean. These findings align with previous work (e.g., Allen et al. Reference Allen, Menalled, Adeux, Pelzer, Wayman, Jernigan, Cordeau, DiTommaso and Ryan2024; Ryan et al. Reference Ryan, Smith, Mirsky, Mortensen and Seidel2010) suggesting that disturbance may suppress dominant weeds without compromising overall diversity, and in contrast, reduced tillage selected for fewer dominant species (Adeux et al. Reference Adeux, Yvoz, Biju-Duval, Cadet, Farcy, Fried, Guillemin, Meunier, Munier-Jolain, Petit and Cordeau2022; Cordeau et al. Reference Cordeau, Smith, Gallandt, Brown, Salon, DiTommaso and Ryan2017).
This pattern is consistent with results from cover crop–based no-till studies, which show that weed suppression is strongly tied to cover crop biomass thresholds and the timing of termination (Mirsky et al. Reference Mirsky, Ryan, Curran, Teasdale, Maul, Spargo, Moyer, Grantham, Weber, Way and Camargo2012; Vincent-Caboud et al. Reference Vincent-Caboud, Casagrande, David, Ryan, Silva and Peigné2019). For example, Mirsky et al. (Reference Mirsky, Ryan, Curran, Teasdale, Maul, Spargo, Moyer, Grantham, Weber, Way and Camargo2012) observed that soybean planted into cereal rye required >8,000 kg ha⁻¹ of mulch biomass to adequately suppress early-emerging annual weeds like S. faberi. This may help explain the dominance of S. faberi in IT/C–NT/S. Champagne et al. (Reference Champagne, Wallace, Curran and Baraibar2019), reporting in the same study, reported that cover crop biomass in IT/C–NT/S did not exceed 7,500 kg ha⁻¹, a level likely below the threshold required for effective weed suppression.
In systems like IT/C–NT/S, where soybean followed an extended cover crop phase, reduced tillage and lack of cultivation in intrarow zones selected for a functionally narrower set of species. These communities showed strong dominance by disturbance-adapted annuals capable of exploiting low-competition environments. Similar patterns of trait convergence under reduced-tillage organic management have been reported in other systems, particularly where low-input conditions coincide with weak crop filtering (Armengot et al. Reference Armengot, Blanco-Moreno, Bàrberi, Bocci, Carlesi, Aendekerk, Berner, Celette, Grosse, Huiting, Kranzler, Luik, Mäder, Peigné and Stoll2016; Menalled et al. Reference Menalled, Adeux, Cordeau, Smith, Mirsky and Ryan2022).
Across both crops, the weed seedbank was greater in corn than soybean, and no significant differences in seedbank density were observed among systems. This suggests that current management practices exert weaker selective pressure on the seedbank than historical crop sequence and crop phase effects. This parallels findings from other long-term organic studies where seedbank composition reflected legacy effects of previous crops more than current management (Mohler et al. Reference Mohler, Caldwell, Marschner, Cordeau, Maqsood, Ryan and DiTommaso2018; Teasdale et al. Reference Teasdale, Mangum, Radhakrishnan and Cavigelli2004). As observed by Teasdale et al. (Reference Teasdale, Mirsky and Cavigelli2019), weed communities are often more responsive to rotational history and crop type than to management intensity alone.
Legacy effects of the cover crop preceding tillage-based corn (IT/C–IT/S and IT/C–NT/S) did not influence weed community despite the 14-mo undisturbed red clover phase in IT/C–NT/S. This result contradicts prior observations that even similar present-day practices can yield distinct communities if preceded by divergent management histories (Cordeau et al. Reference Cordeau, Smith, Gallandt, Brown, Salon, DiTommaso and Ryan2017; Rotchés-Ribalta et al. Reference Rotchés-Ribalta, Sans, Mayer and Mäder2020). Similar findings were reported by Vincent-Caboud et al. (Reference Vincent-Caboud, Peigné, Casagrande and Silva2017), who emphasized that cover crop legacy and incomplete termination are among the main factors that limit the effectiveness of organic no-till systems in Europe.
The seedbank remained relatively stable across systems despite differences in aboveground weed communities. This finding suggests that short-term emergent dynamics may not immediately translate into long-term seedbank shifts, particularly in systems with recent transitions or ongoing disturbance regimes. Nonetheless, entry effects and crop sequence appeared to shape seedbank diversity more consistently than system identity, reinforcing the idea that seedbank trajectories integrate both historical and immediate selective pressures (Allen et al. Reference Allen, Menalled, Adeux, Pelzer, Wayman, Jernigan, Cordeau, DiTommaso and Ryan2024; Teasdale et al. Reference Teasdale, Mangum, Radhakrishnan and Cavigelli2004).
Effects of Cropping Systems and Spatial Location on Weed Communities in Corn
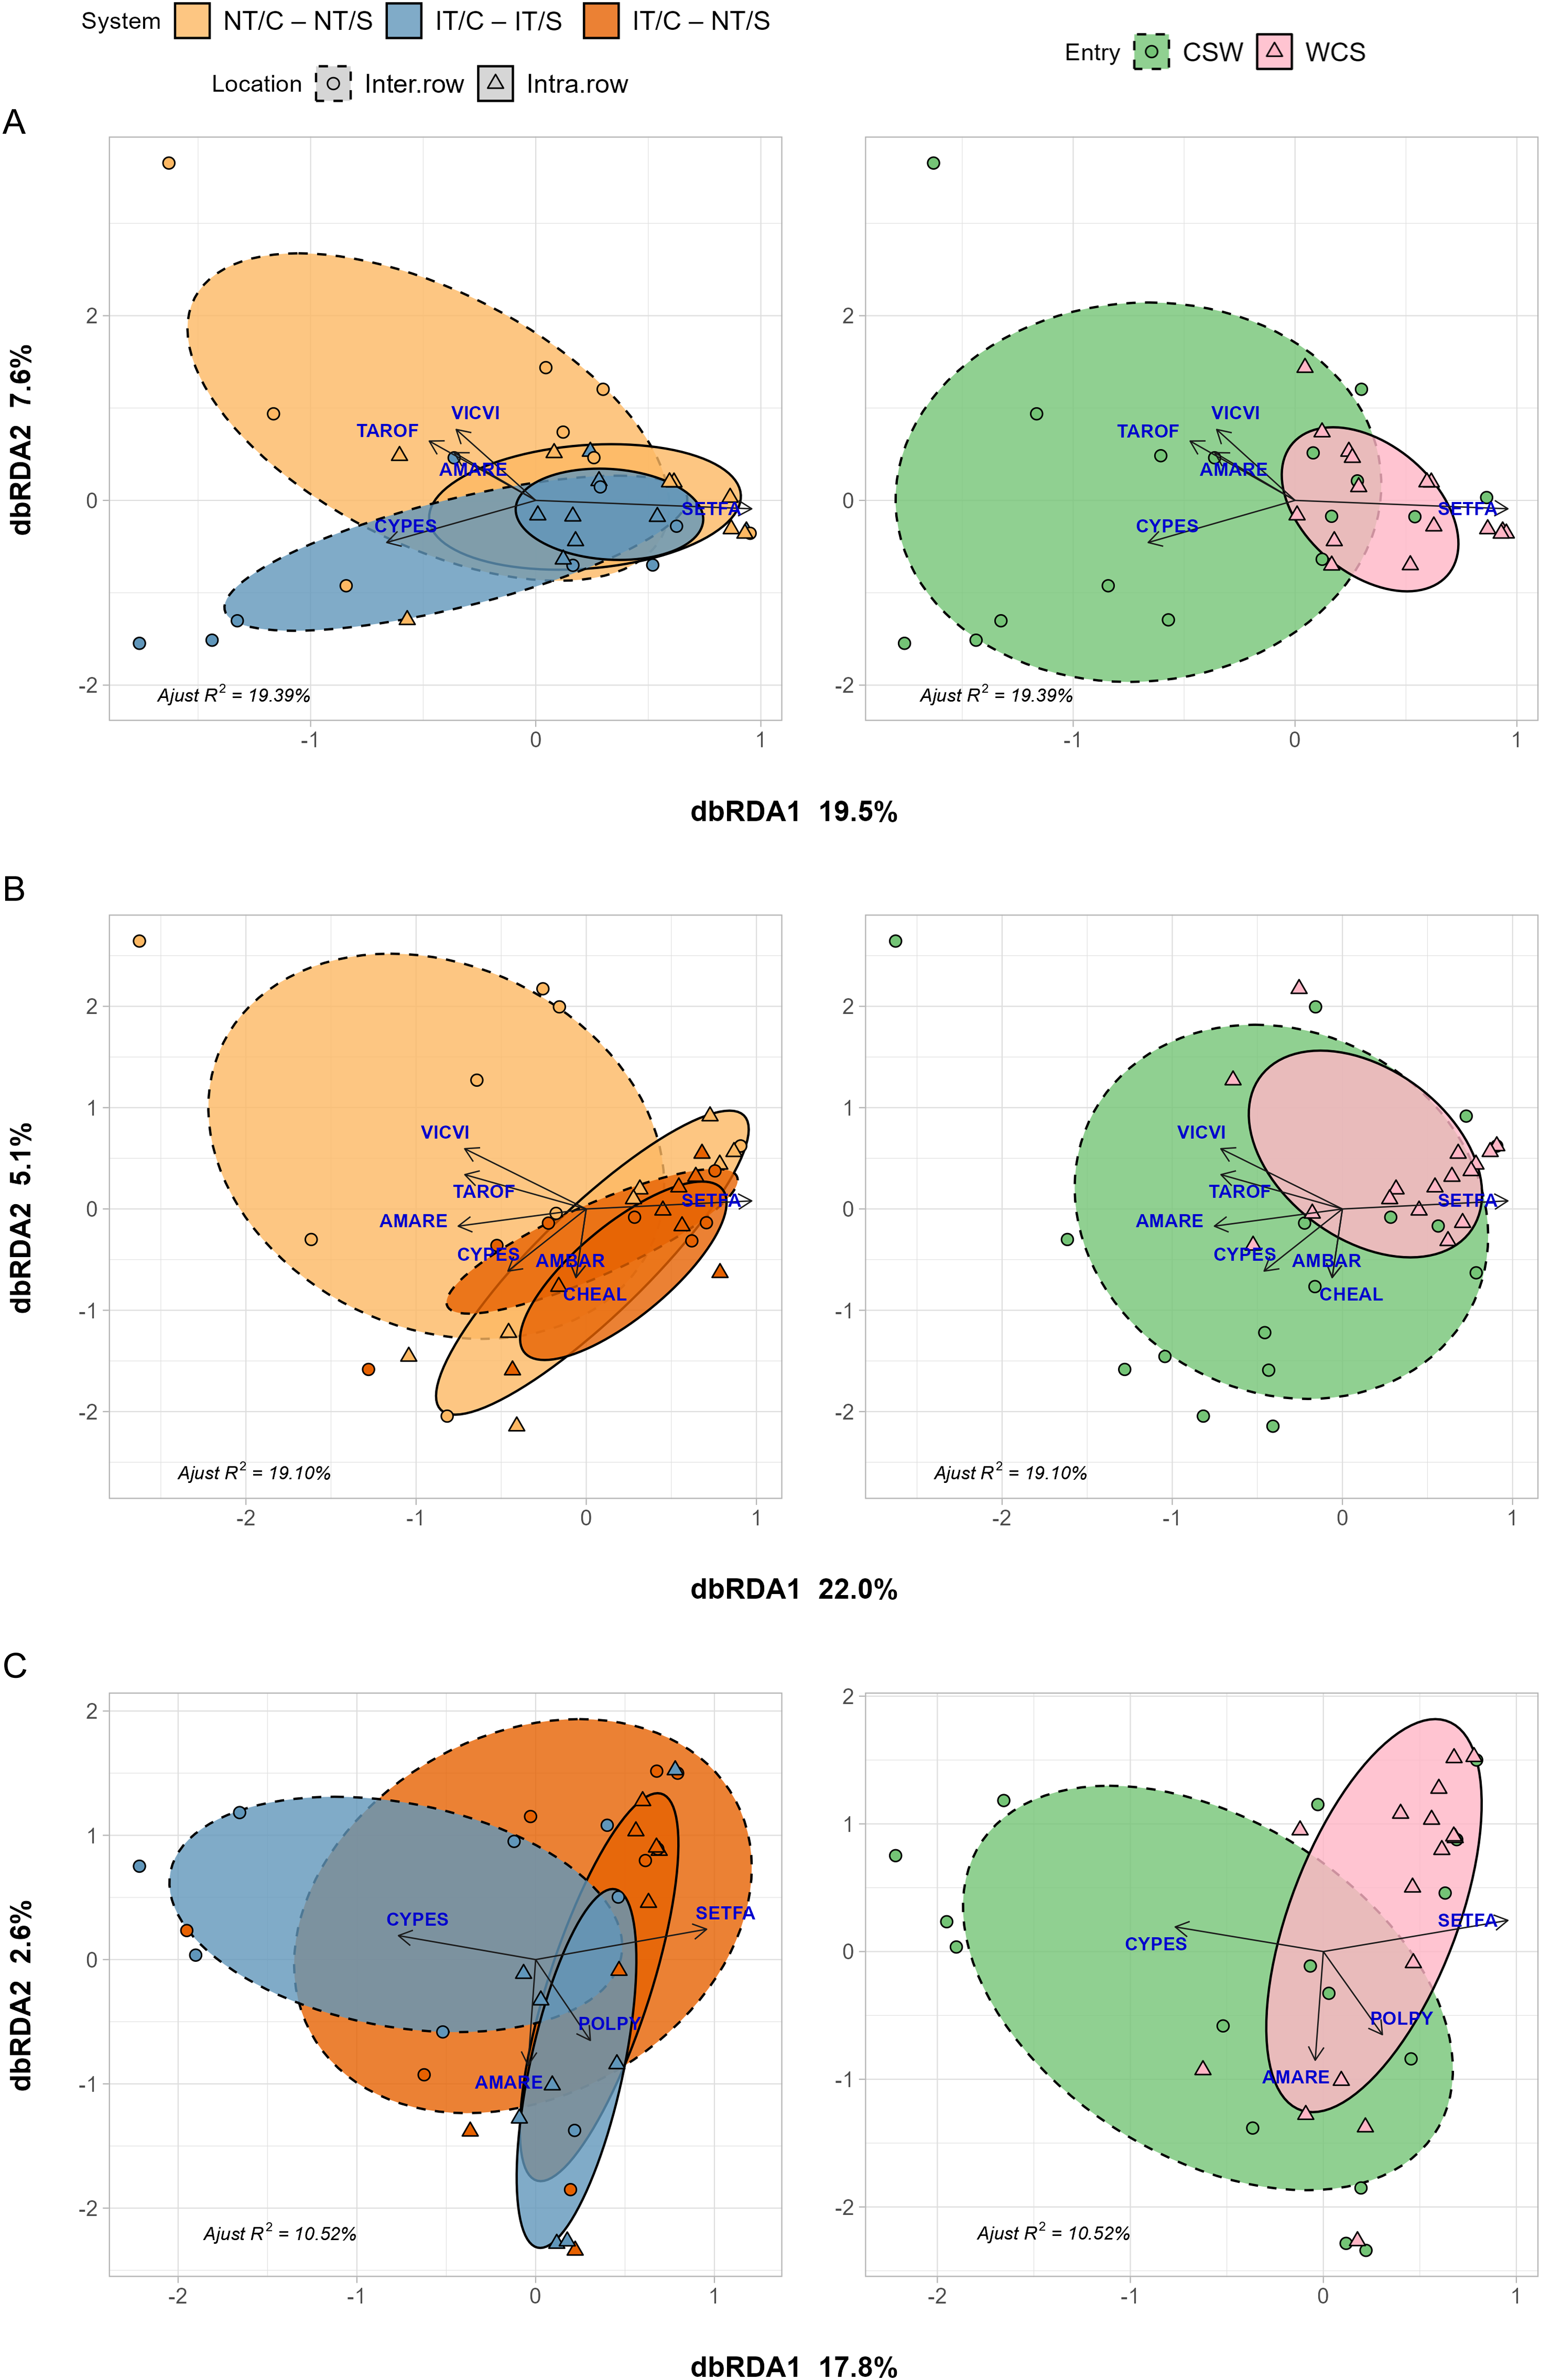
The partial residual variance of the constrained terms explained 19.39% of the variance in the weed biomass abundance matrix for pair-wise comparisons between no-till (NT/C–NT/S) and inversion-tillage (IT/C–IT/S) corn phases that included a hairy vetch/triticale cover crop (Figure 4A). The first (RDA1) and second (RDA2) axes accounted for 19.5% and 7.6% of this explained variance, respectively. No significant differences between emerged weed communities were detected. However, significant differences were observed between sampling locations (interrow vs. intrarow; P = 0.024), with intrarow communities generally exhibiting lower species richness and a higher abundance of S. faberi (Figure 4, solid and dashed lines). Additionally, as previously noted, entry point was significant (P = 0.003), with WCS supporting a less diverse weed community.
Distance-based redundancy analysis (dbRDA) of species emergent weed biomass in corn. Left, Models show species responses to sampling location (interrow and intrarow), and two systems (NT/C–NT/S vs. IT/C–IT/S in A; NT/C–NT/S vs. IT/C–NT/S in B; and IT/C–IT/S vs. IT/C–NT/S in C) and their interaction after removing variance in experimental block. Right, position of entry points in the ordination space. Ellipses show 95% confidence interval around location:crop centroids. Labels are EPPO codes. The species included in the analysis are: Taraxacum officinale (TAROF), Cyperus esculentus (CYPES), Amaranthus retroflexus (AMARE), Vicia villosa (VICVI), Setaria faberi (SETFA), Ambrosia artemisiifolia (AMBAR), Chenopodium album (CHEAL), and Polygonum persicaria L. (POLPY). Arrows represent increasing species abundance, and points show the locations of the communities in each of the four experimental blocks for each location:system combination (left) and entry point (right) in the ordination space. Experimental system treatments: NT, no-tillage; IT, moldboard plow; C, corn; S, soybean. Crop entries include CSW and WCS.
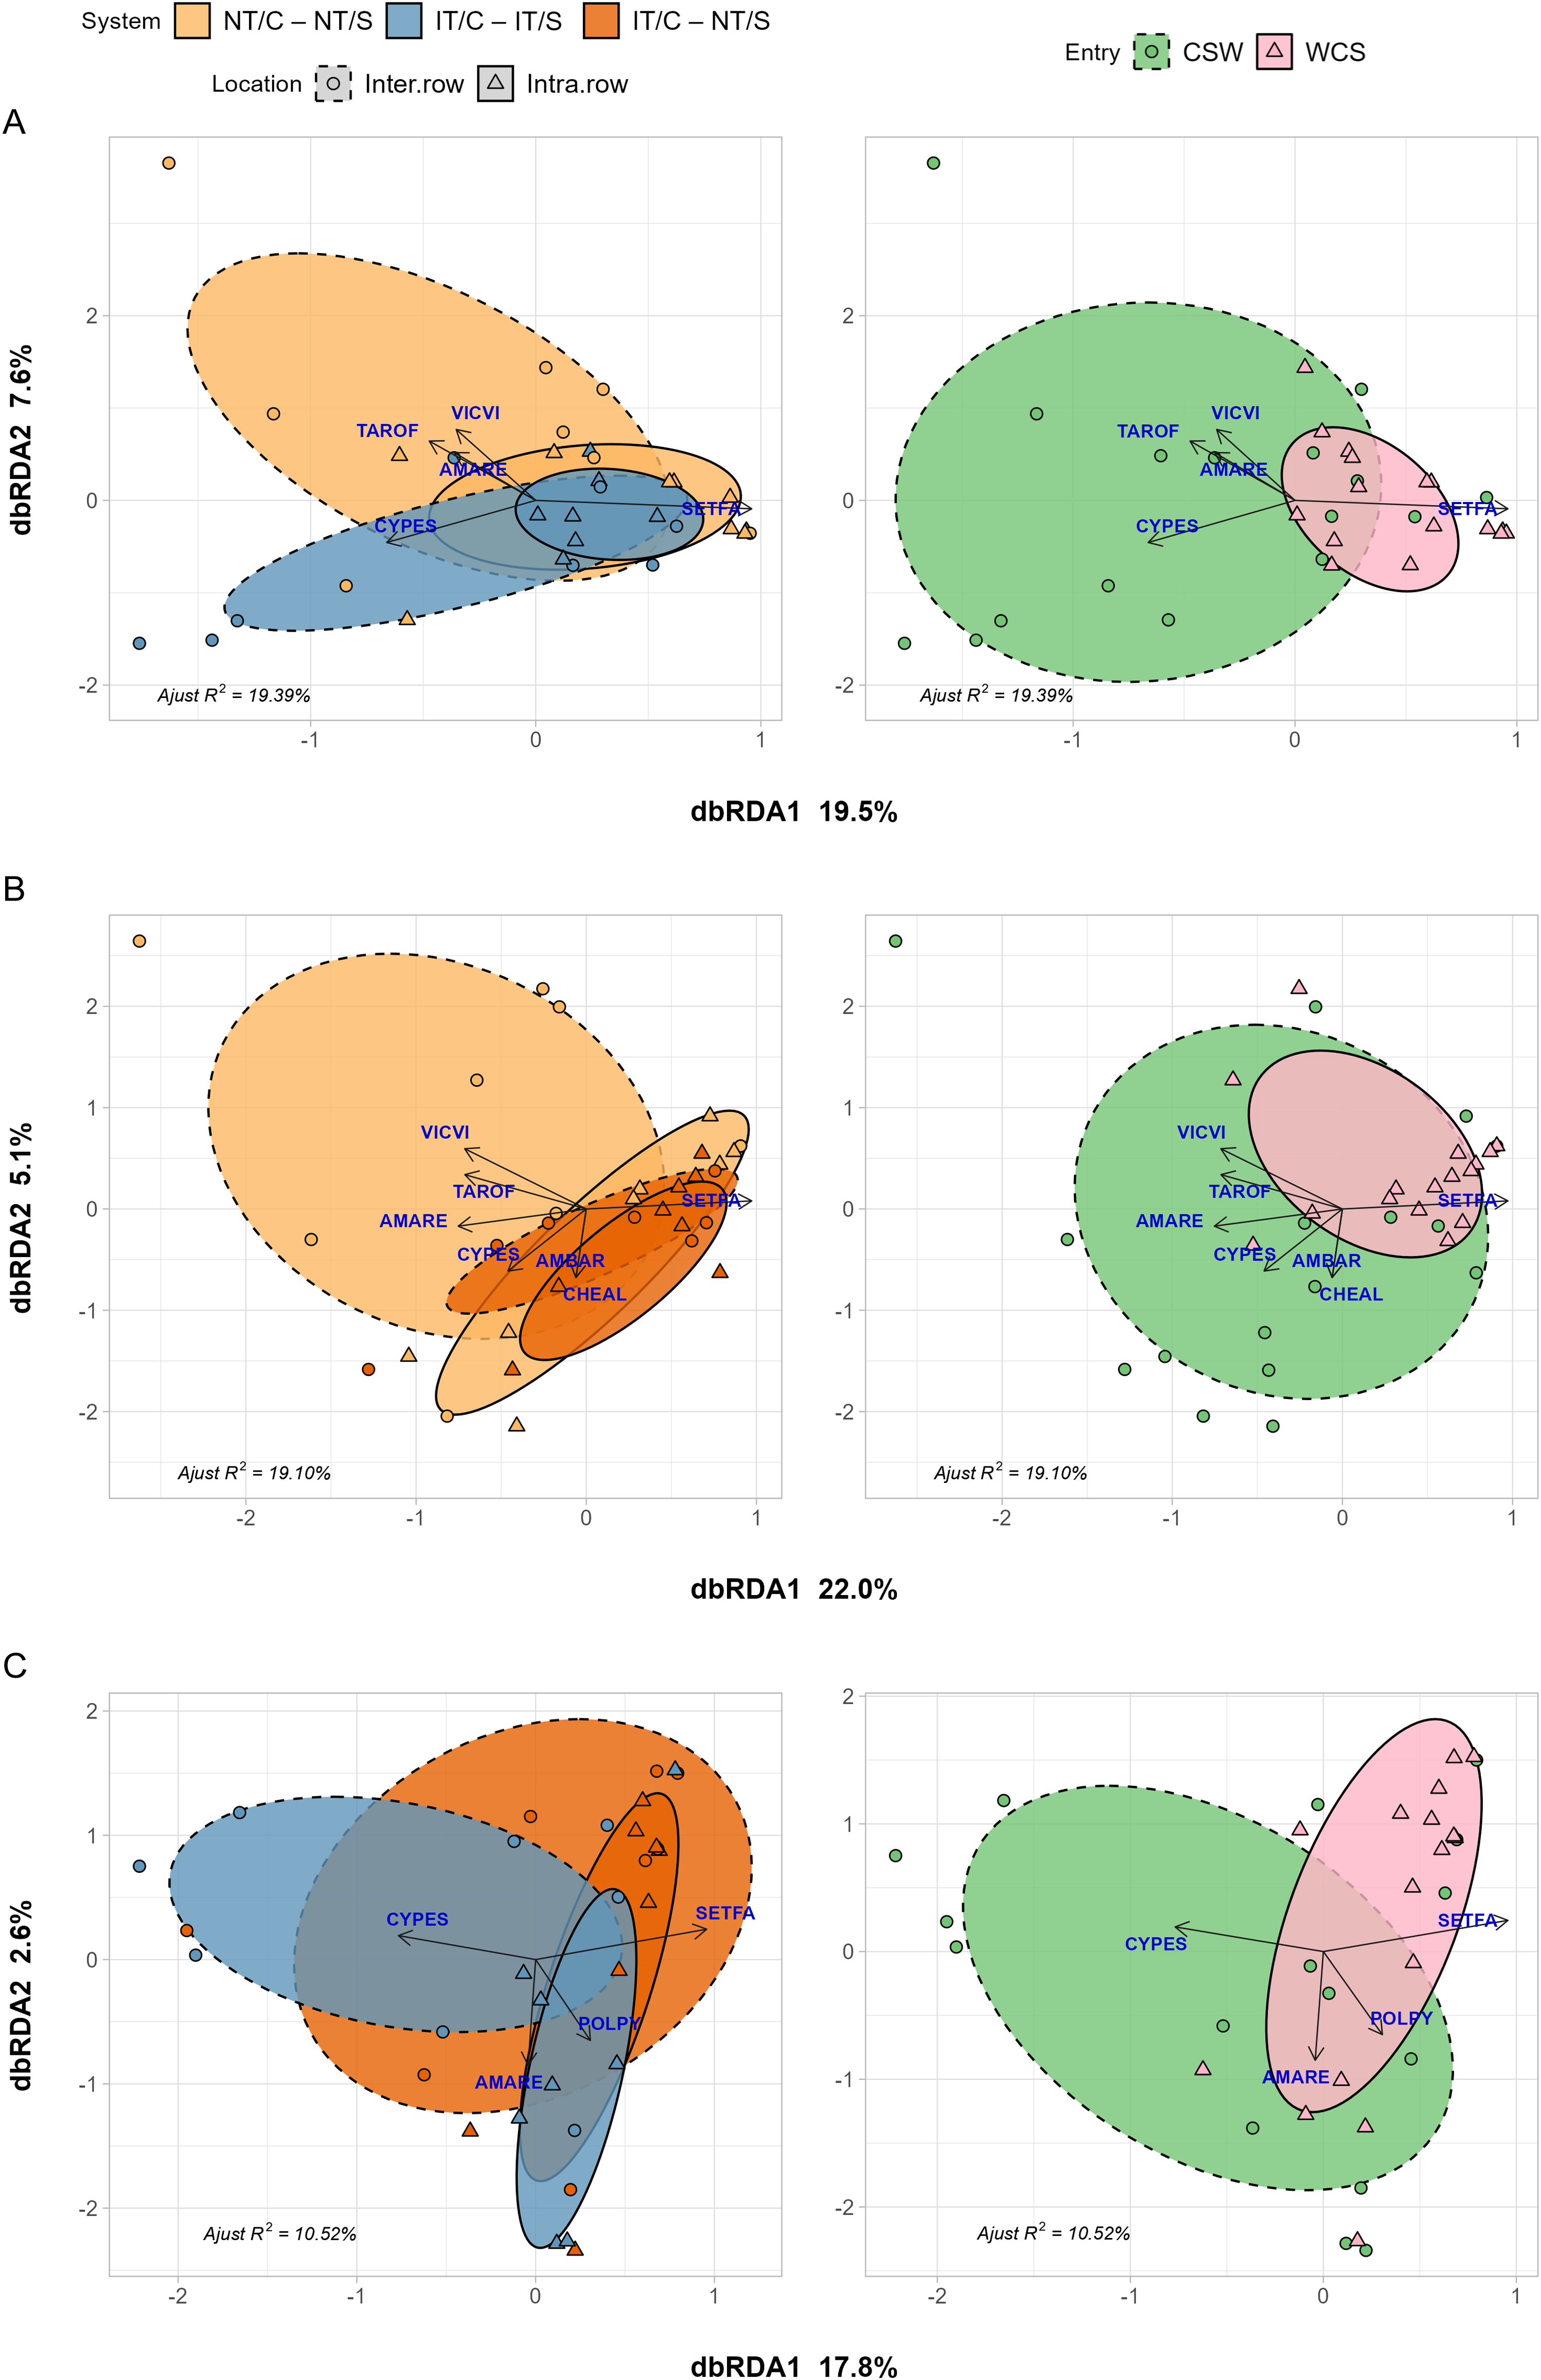
The partial residual variance of the constrained terms explained 19.10% of the variance in the weed biomass abundance matrix for pair-wise comparisons between the no-till (NT/C–NT/S) corn phase and the inversion-tillage corn phase that integrated relay cover cropping with medium red clover (IT/C–NT/S; Figure 4B). The first (RDA1) and second (RDA2) axes accounted for 22.0% and 5.1% of this explained variance, respectively. A significant difference between NT/C–NT/S and IT/C–NT/S (i.e., no-till and tilled systems; P = 0.05) was detected. However, in contrast to the previous comparison, no significant difference was observed between sampling locations (interrow vs. intrarow). Entry point remained a significant factor (P = 0.014), with WCS exhibiting a lower species richness (Table 1).
Finally, for pair-wise comparisons between inversion-tillage corn phases that integrated postharvest (IT/C–IT/S) and relay cover crops (IT/C–NT/S; Figure 4C), the partial residual variance of the constrained terms explained 10.52% of the variance in the weed biomass abundance matrix. The first (RDA1) and second (RDA2) RDA axes accounted for 17.8% and 2.6% of this explained variance, respectively. No significant differences in weed community composition were found between the two tilled systems. However, sampling location had a significant effect (interrow vs. intrarow; P = 0.038), so weed communities between these two locations were different. Additionally, as previously noted, entry point remained significant (P = 0.013), with WCS supporting a less diverse weed community.
These results suggest that in corn, where crop competition with weeds is stronger, emerged weed communities were less clearly differentiated by system. Instead, spatial position (intra- vs. interrow) played a stronger role, especially in the IT/C–NT/S, where intrarow spaces consistently harbored S. faberi, highlighting how within-field heterogeneity interacts with cultivation patterns to shape weed assembly (Mohler Reference Mohler1993; Smith Reference Smith2006).
Effects of Cropping Systems and Spatial Location on Weed Communities in Soybean
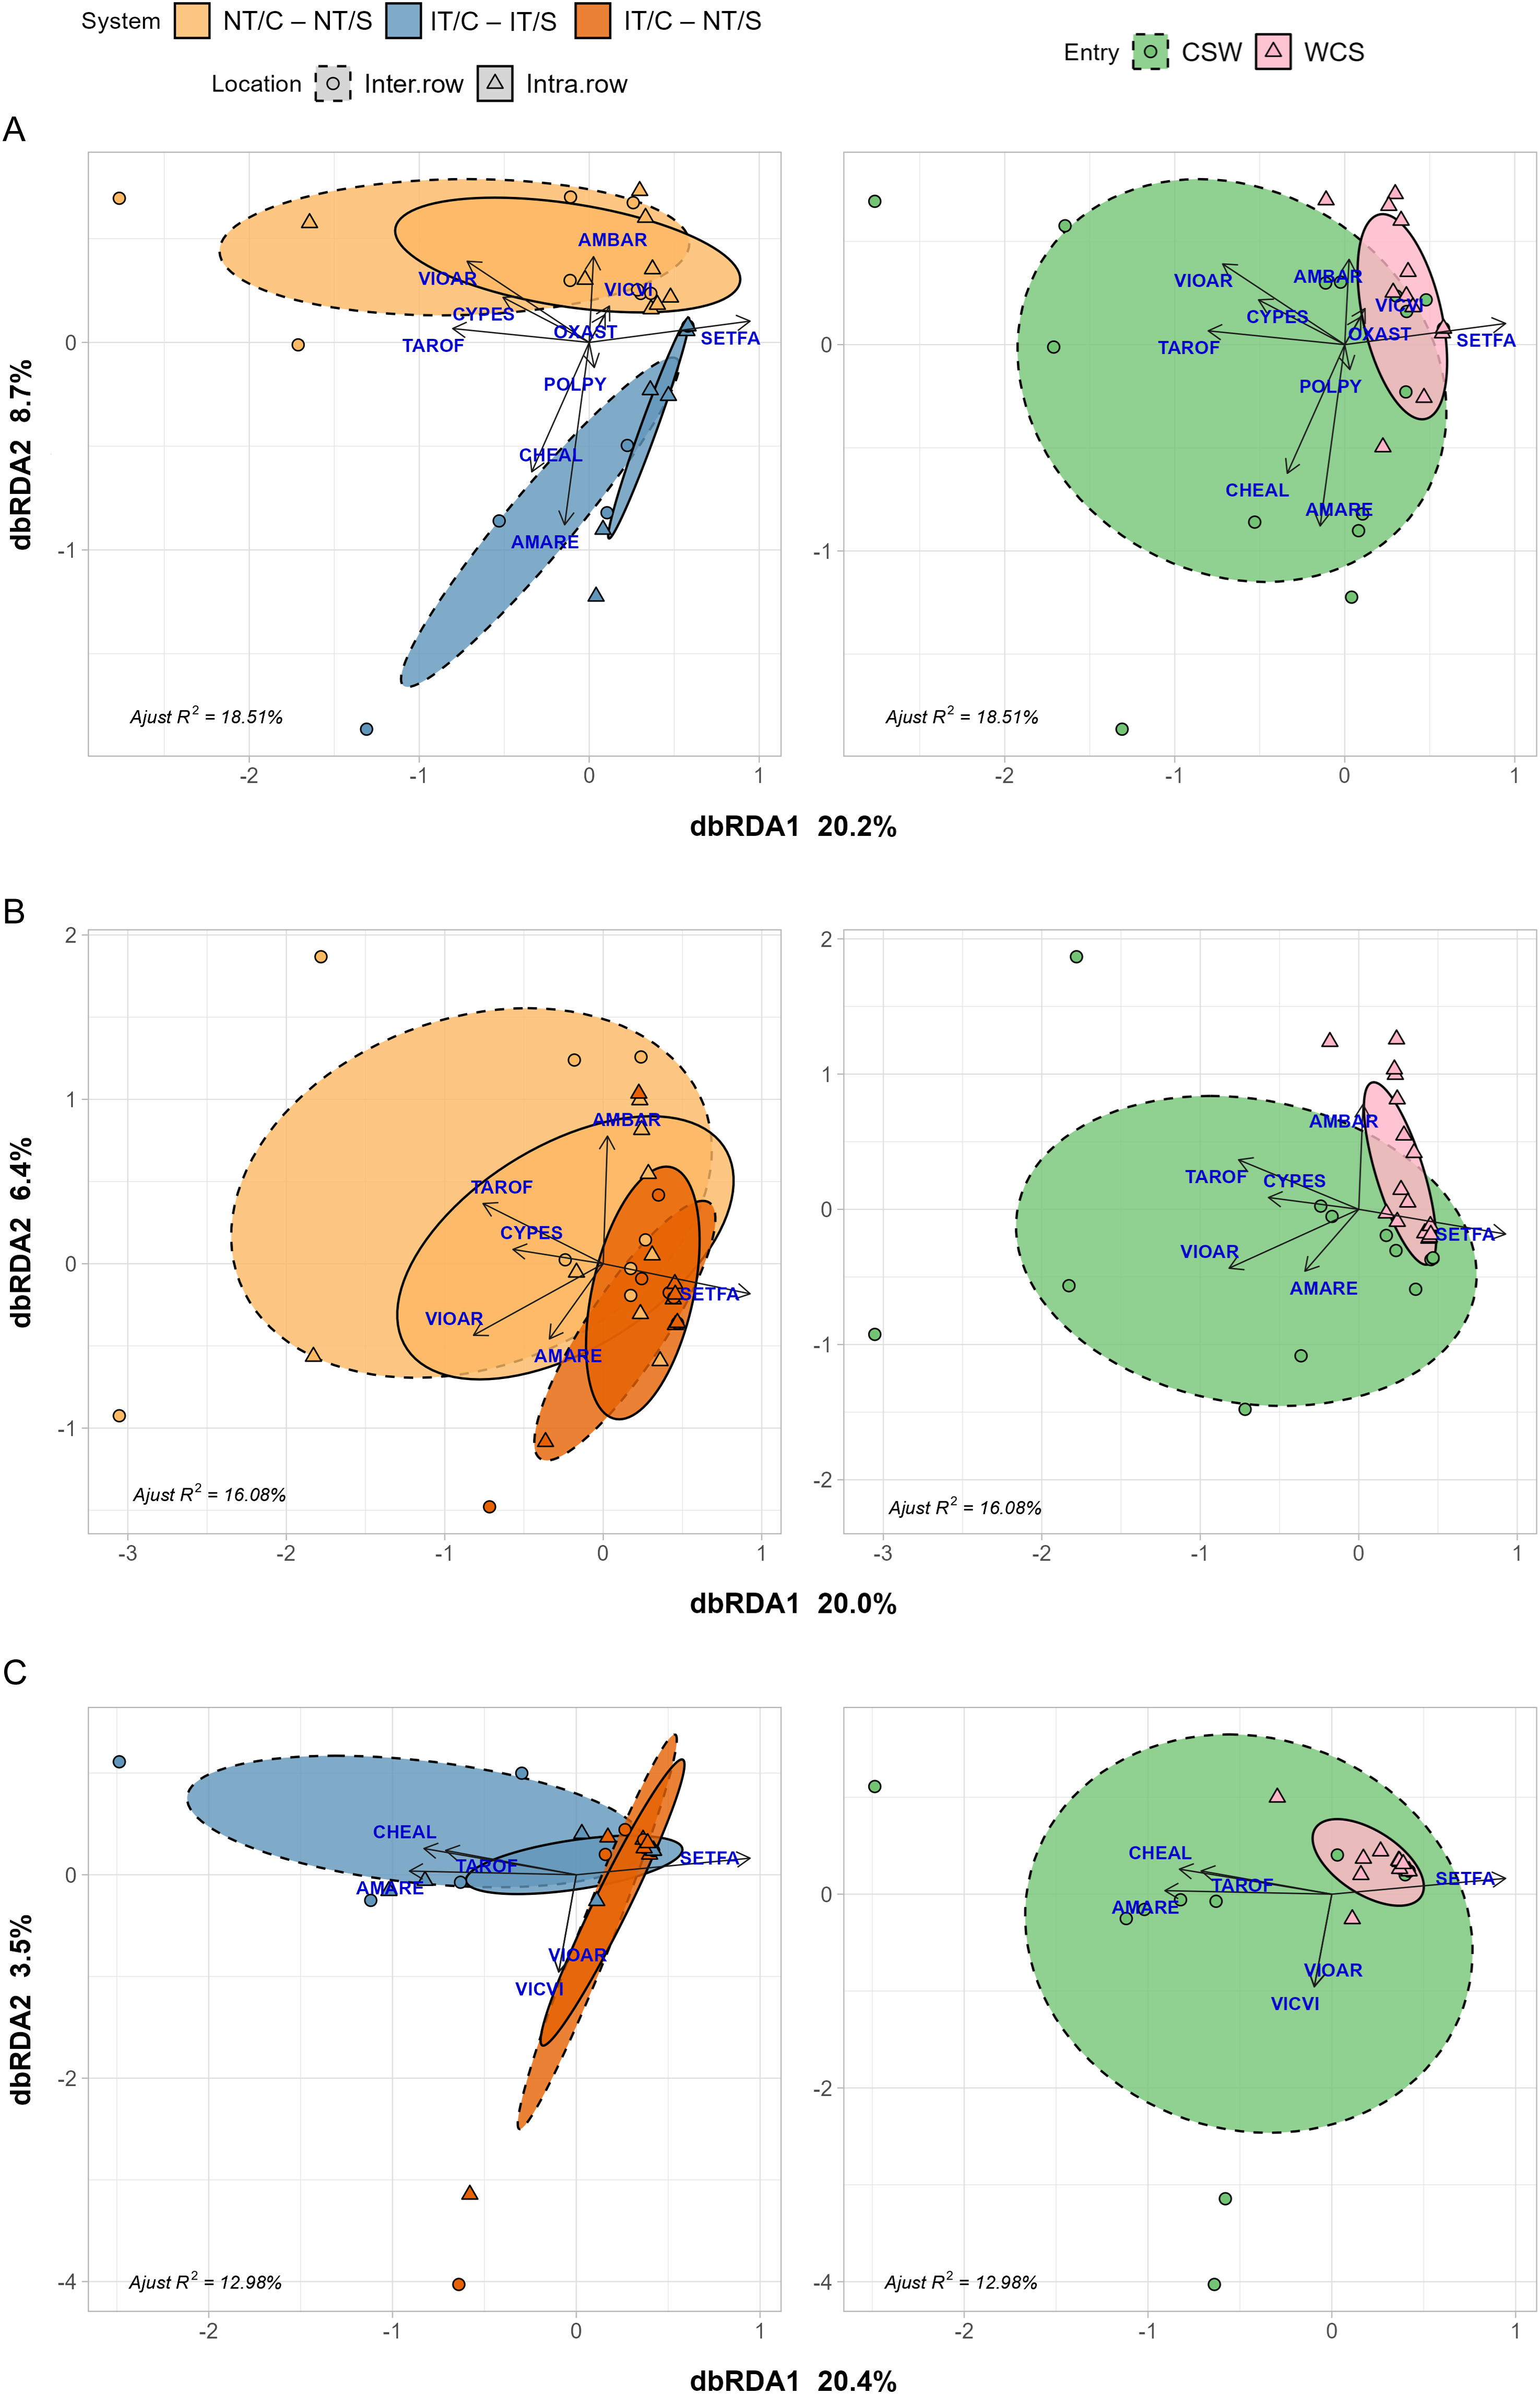
The partial residual variance of the constrained terms explained 18.51% of the variance in the weed biomass abundance matrix for pair-wise comparisons between no-till (NT/C–NT/S) and inversion tillage (IT/C–IT/S) soybean phases that included a cereal rye (NT/C–NT/S) and a multi-species (IT/C–NT/S) cover crop (Figure 5A). The first (RDA1) and second (RDA2) axes accounted for 20.2% and 8.7% of this explained variance, respectively. Unlike in corn, no significant differences were observed between sampling locations (interrow vs. intrarow). However, significant differences in weed communities were found between NT/C–NT/S and IT/C–IT/S (i.e., no-till and tilled systems; P = 0.015). The distinction between the two systems appears to be driven by differences in soil disturbance at the time of cover crop termination. Additionally, the entry point remained significant (P = 0.001).
Distance base redundancy analysis (dbRDA) of emergent weed biomass in soybean. Left, Models show species responses to sampling location (interrow and intrarow), and two systems (NT/C–NT/S vs. IT/C–IT/S in A; NT/C–NT/S vs. IT/C–NT/S in B; and IT/C–IT/S vs. IT/C–NT/S in C) and their interaction after removing variance in experimental block. Right, Position of entry points in the ordination space. Ellipses show 95% confidence interval around location:crop centroids. Labels are EPPO codes. The species included in the analysis are: Viola arvensis Murray (VIOAR), Ambrosia artemisiifolia (AMBAR), Cyperus esculentus (CYPES), Vicia villosa (VICVI), Oxalis stricta (OXAST), Taraxacum officinale (TAROF), Setaria faberi (SETFA), Polygonum persicaria L. (POLPY), Chenopodium album (CHEAL), and Amaranthus retroflexus (AMARE). Arrows represent increasing species abundance, and points show the locations of the communities in each of the four experimental blocks for each location: system combination (left) and entry point (right) in the ordination space. Experimental system treatments: NT, no-tillage; IT, moldboard plow; C, corn; S, soybean. Crop entries include CSW and WCS.
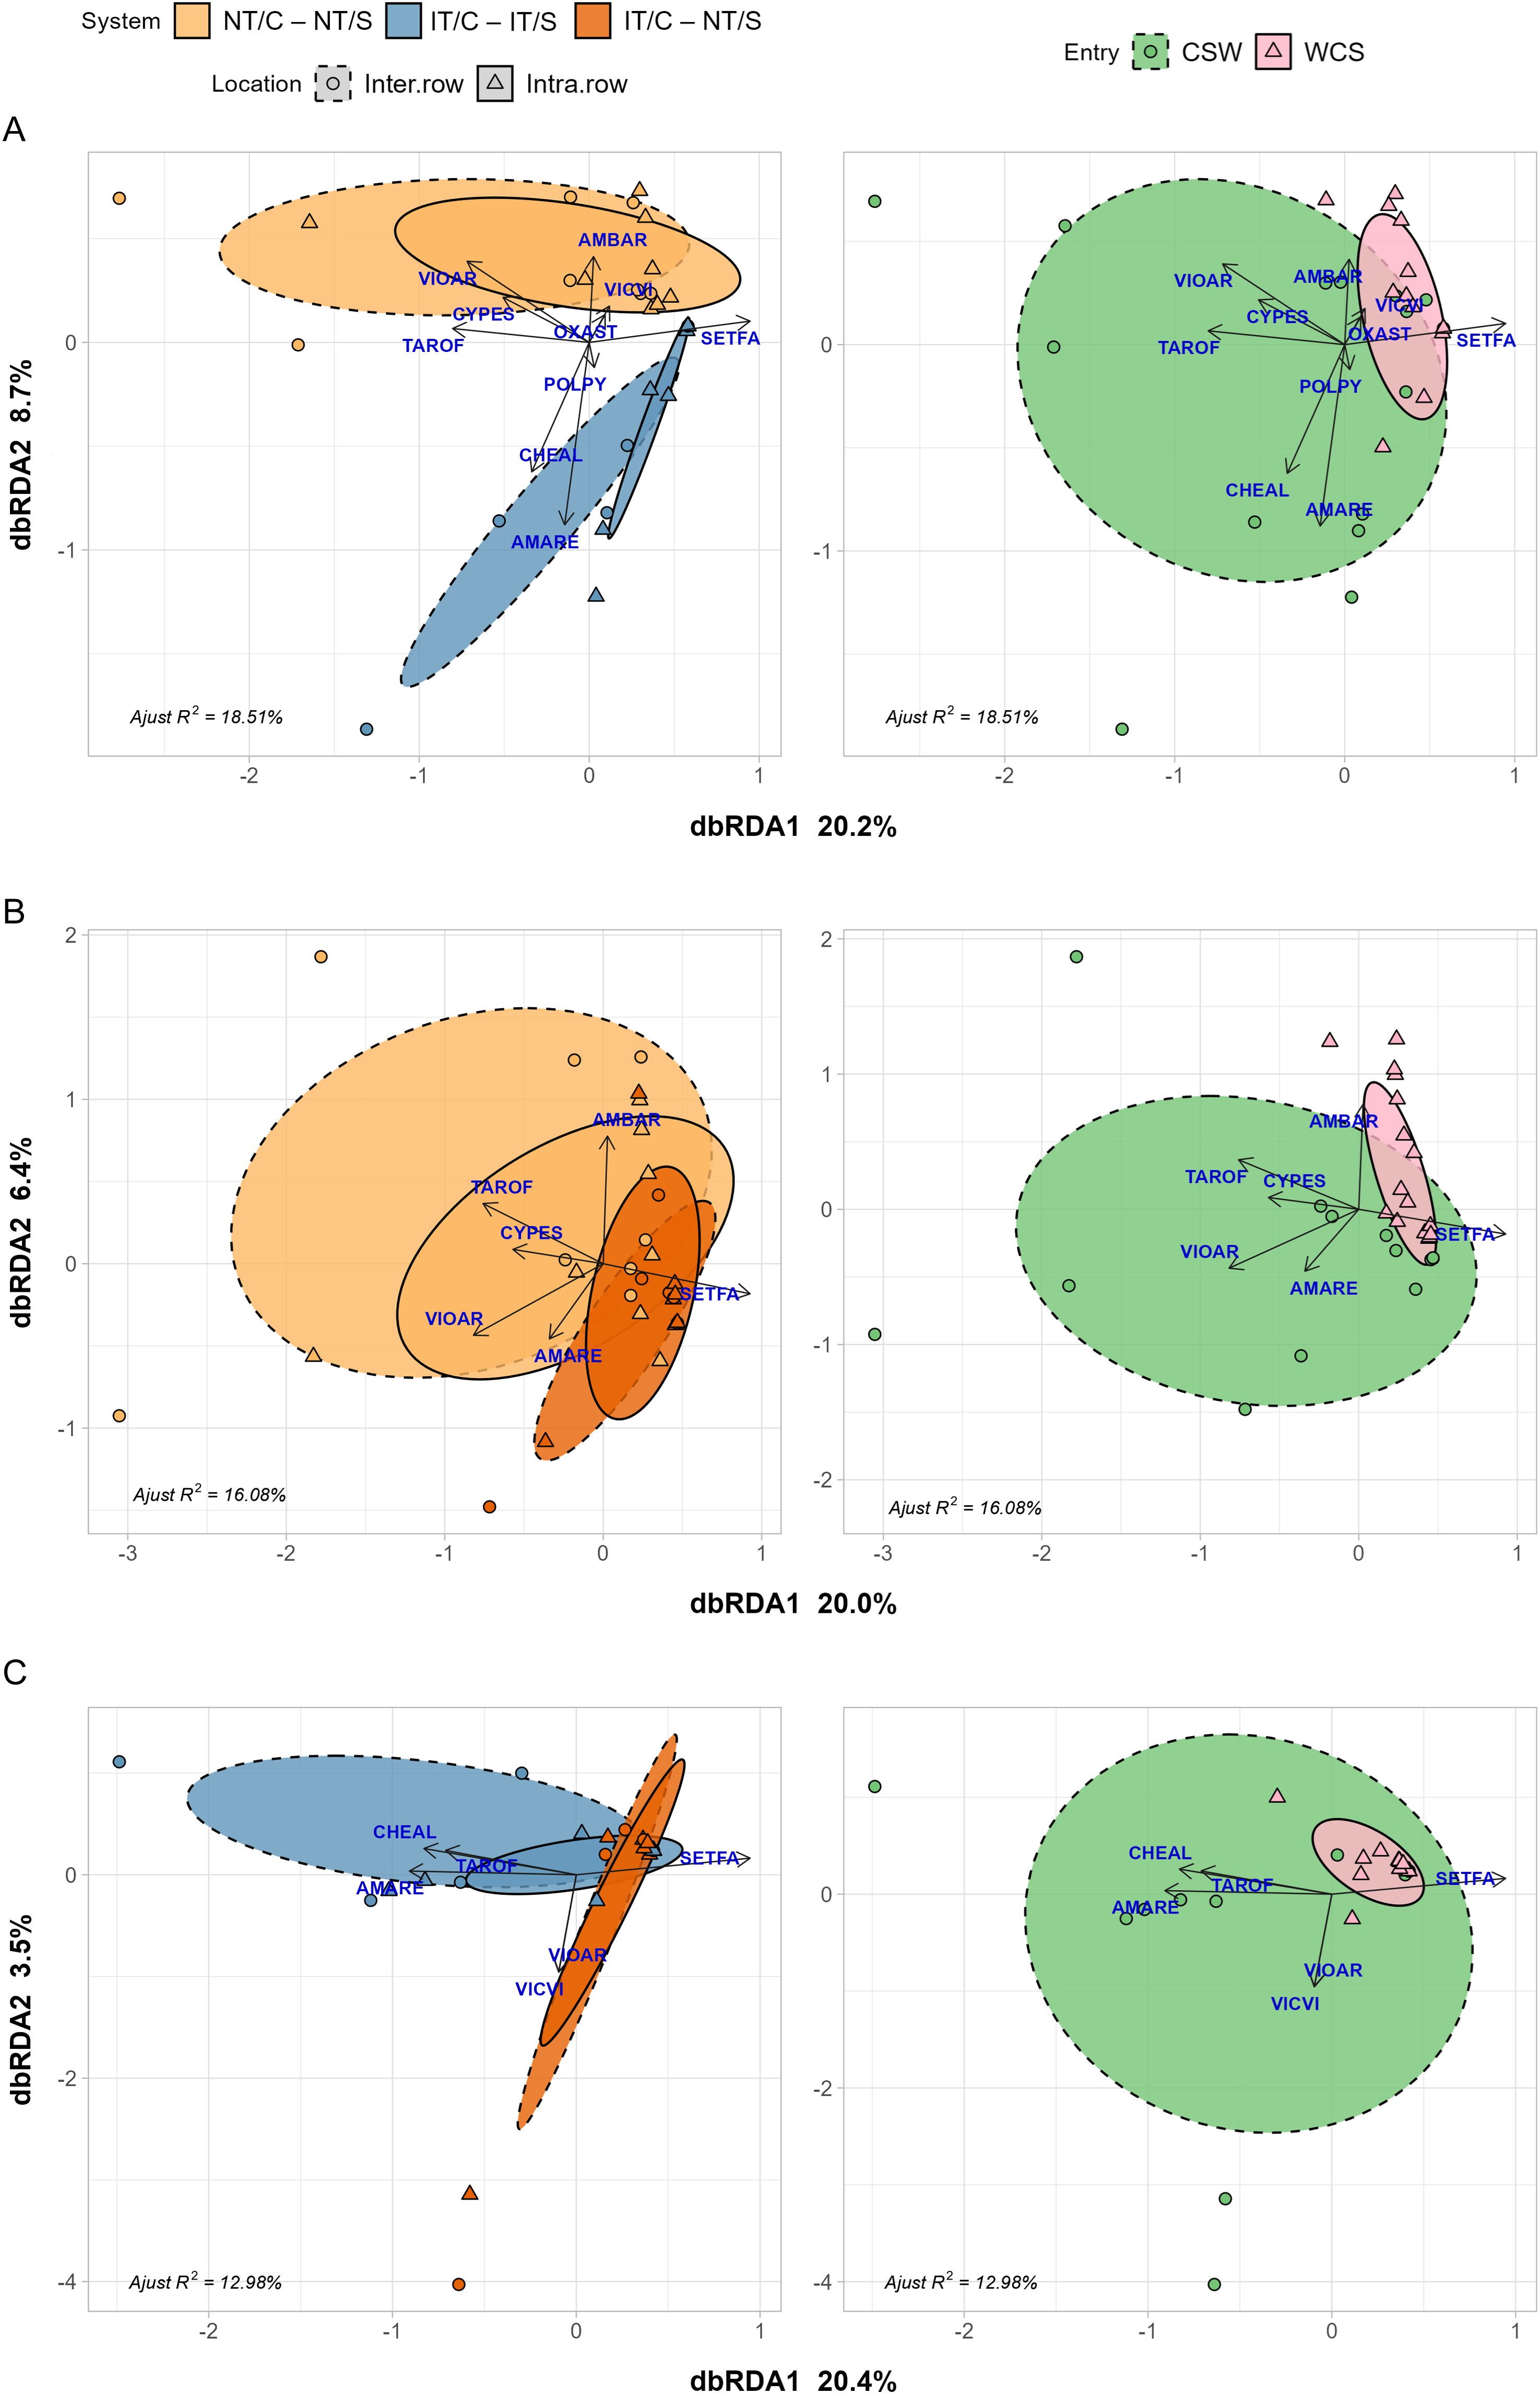
When comparing weed communities between two no-till soybean systems that differed in tillage intensity before sowing a cereal rye cover crop (NT/C–NT/S, inversion tillage; IT/C–NT/S, chisel plow), the partial residual variance of the constrained terms explained 16.08% of the variance in the weed biomass abundance matrix (Figure 5B). The first (RDA1) and second (RDA2) axes accounted for 20.0% and 6.4% of this explained variance, respectively. As in previous soybean comparisons, no significant differences were found between sampling locations. However, significant differences in weed community composition were detected between the systems (P = 0.004), despite both systems being no-till with a preceding cereal rye cover crop. NT/C–NT/S appeared to have a more diverse weed community. Here, the distinction between the two systems appears to be driven by differences in soil disturbance at the time of cover crop sowing. Entry point remained a key factor (P = 0.002), with the difference between CSW and WCS being more distinct than in corn, suggesting a stronger influence of cropping history in shaping weed community composition in soybean.
Finally, the partial residual variance of the constrained terms explained 12.98% of the variance in the weed biomass abundance matrix for pair-wise comparisons between the inversion-till (IT/C–IT/S) soybean phase and the no-tillage soybean phase (IT/C–NT/S; Figure 5C). The first (RDA1) and second (RDA2) axes accounted for 20.4% and 3.5% of this explained variance, respectively. Again, sampling location was not significant, but significant differences were found between IT/C–IT/S (tilled) and IT/C–NT/S (no-till) (P = 0.02), indicating that tillage had a more pronounced effect on weed community composition in soybean than in corn. Entry point remained highly significant (P = 0.001), with WCS presenting a noticeably less diverse weed community compared with CSW, reinforcing the stronger effect of cropping history observed in soybean.
Our results in soybean indicate that system identity was a stronger predictor of community structure, with IT/C–NT/S producing low-diversity communities across both entries. The convergence of intrarow communities across systems, dominated by S. faberi, underscores the homogenizing influence of reduced cultivation in that zone. Although tillage intensity and cover crop management influence community assembly, crop identity and within-field spatial heterogeneity were stronger predictors of weed dominance and diversity patterns. The consistent emergence of S. faberi in low-disturbance soybean systems highlights the selective pressure exerted by reduced tillage in low-competition environments. In contrast, more diverse weed communities were associated with intermediate disturbance and competitive crops like corn.
Overall, our results support a community assembly framework in which abiotic and biotic filters and legacy interact to shape weed communities. The spatial component (intra- vs. interrow) emerges as a critical axis of differentiation that modulates filtering strength.
For practitioners, these findings underscore the need to tailor weed management strategies not only to system-level practices (e.g., tillage type), but also to spatial position and crop-specific dynamics. In reduced-tillage systems, attention to intrarow management, such as high-residue cultivation or optimizing crop density and canopy, is especially important to avoid selection for disturbance-tolerant species like S. faberi. Conversely, integrating moderate disturbance with competitive crops and effective cover crop termination may sustain diversity while suppressing dominant weeds.
Our findings complement previous research indicating that the success of organic no-till depends not only on cover crop biomass and timing, but also on synchronizing disturbance, resource availability, and crop competition across the rotation (Mirsky et al. Reference Mirsky, Ryan, Curran, Teasdale, Maul, Spargo, Moyer, Grantham, Weber, Way and Camargo2012; Vincent-Caboud et al. Reference Vincent-Caboud, Casagrande, David, Ryan, Silva and Peigné2019). Also, this study shows that weed community dynamics in organic row-crop rotations are governed by a complex interplay of disturbance, competition, and legacy effects. Importantly, entry point effects and spatial variation within the crop (inter- vs. intrarow) explained substantial variation in both above- and belowground weed communities.
Future studies should explore how interactions between spatial heterogeneity and legacy filters shape weed trajectories over multiple cycles, particularly in systems undergoing transition to conservation tillage. Also, management strategies aiming to enhance weed diversity and reduce dominance by single species must consider not only system-level practices but also the spatial and temporal context of disturbance and cover crop use.
Acknowledgments
The authors gratefully acknowledge the contributions of Dayton Spackman, Tosh Mazzone, Austin Kirt, Rebecca Champagne, and RELARC farm staff for their assistance in completing this project.
Funding statement
DB-E obtained a PhD grant from the University of Lleida (Ph.D grants, PID2020-113229RB-C42) D. DB-E also acknowledges financial support from the University of Lleida through the 2024 call “Convocatòria d’ajuts per a estades en centres estrangers per desenvolupar tasques de recerca.” This work was supported by the USDA Organic Research and Extension Initiative grant program (NIFA no. 2014-51300-22231).
Competing interests
The authors declare no conflicts of interest.

 Open access

