

Consumption of added sugars (AS) has been suggested as a major contributor to the development of obesity and related co-morbidities such as diabetes( Reference Elliott, Keim and Stern 1 , Reference Yang, Zhang and Gregg 2 ). Consequently, as sugar-sweetened beverages (SSB) are the largest source of AS in the diet, excessive consumption may lead to increased energy intake and weight gain( Reference Johnson, Appel and Brands 3 ). Intake of SSB and AS represent approximately 7 % and 16 %, respectively, of total energy intake in US adults( Reference Kit, Fakhouri and Park 4 , Reference Marriott, Olsho and Hadden 5 ). Yet, the topic of AS continues to be highly controversial( Reference Sievenpiper and de Souza 6 , Reference Willett and Ludwig 7 ). For example, some have argued that ‘sugar comprises the single most important cause of the worldwide epidemics of obesity and diabetes’( Reference Ludwig 8 ), while others have stated that ‘there is no evidential basis for setting a quantitative target for sugar consumption’( Reference Cottrell 9 ). A recent review in this area cited the need for methodological advances, specifically instruments to measure dietary intake( Reference Althuis and Weed 10 ). Thus, objective methods of assessing AS intake are necessary to evaluate the impact of AS and SSB on health status in the US population( Reference Jahren, Bostic and Davy 11 ), especially in light of recent emphasis on public polices related to AS( Reference Farley, Just and Wansink 12 – Reference Sturm, Powell and Chriqui 14 ).
Most studies investigating diet and health are limited by their reliance on self-reported measures of habitual dietary intake, such as 24 h dietary recalls, which can require significant staff resources (i.e. time, personnel, expense) and participant burden( Reference Marshall, Eichenberger Gilmore and Broffitt 15 – Reference Willett and Lenart 17 ). These methods are not always practical in large-scale clinical trials and community-based studies; however, dietary biomarkers can overcome some of these limitations( 18 – Reference Thompson and Subar 22 ). It has been demonstrated that rural, low health-literacy populations consume greater amounts of SSB( Reference Han and Powell 23 – Reference Ogden, Kit and Carroll 25 ) and are more likely to be at risk for health disparities( Reference Zahnd, Scaife and Francis 26 , Reference Paasche-Orlow, Parker and Gazmararian 27 ); thus low-burden objective biomarkers of dietary intake are needed to assess population health status( Reference Althuis and Weed 10 , 18 ).
The δ 13C value of human blood, in various mediums, and hair has demonstrated preliminary validity as an AS biomarker for adults in three clinical laboratory-based investigations using self-reported dietary data: capillary fingerstick( Reference Davy, Jahren and Hedrick 28 ); serum, capillary fingerstick and clot( Reference Kraft, Jahren and Saudek 29 ); and serum( Reference Fakhouri, Jahren and Appel 30 ); and in one clinical investigation (n 5) which used a feeding study-type design to assess non-fasting plasma glucose δ 13C values( Reference Cook, Alvig and Liu 31 ). However, trials of free-living individuals are needed to further assess the utility of the δ 13C AS biomarker, as only two known studies currently exist in community- or field-based settings, both of which have been conducted in Alaska with a Yup’ik Eskimo population using either red blood cells( Reference Nash, Kristal and Bersamin 32 ) or hair, plasma and red blood cells( Reference Nash, Kristal and Hopkins 33 ), and no community-based studies have been conducted within a general US population. High natural concentrations of 13C are found in corn (e.g. high-fructose corn syrup) and in cane plant sugars and their derivatives( Reference Kraft, Jahren and Saudek 29 , Reference Jahren and Kraft 34 , Reference Jahren, Saudek and Yeung 35 ). Corn derivatives consist of corn starch, corn syrup, popcorn and corn meal; while molasses, plain cane sugar, brown cane sugar and powdered cane sugar are considered sugar cane derivatives( Reference Jahren, Saudek and Yeung 35 ). US Department of Agriculture data depict an increase in high-fructose corn syrup intake over the past 30 years, while intake of other sugar sources has remained relatively constant( 36 ). Moreover, as SSB is a primary dietary source of AS intake, δ 13C value of blood has shown potential as a biomarker for AS intake due to the high concentration of high-fructose corn syrup in SSB( Reference Davy, Jahren and Hedrick 28 , Reference Kraft, Jahren and Saudek 29 , Reference Jahren, Saudek and Yeung 35 ). Furthermore, it has been established that more research examining the effects of demographic characteristics on biomarker variability is needed for dietary intake biomarkers before generalizability to the overall population can be inferred( Reference Hedrick, Dietrich and Estabrooks 20 ). The current biomarker literature has a lack of variability in sex, race and age within the study samples, and consequently limited research is available examining the influence of demographic variance in relationship to biomarkers( Reference Hedrick, Dietrich and Estabrooks 20 ). To date, only one investigation has evaluated the independent effects of demographic variance on blood δ 13C values( Reference Yeung, Saudek and Jahren 37 ).
The Healthy Eating Index-2010 (HEI-2010)( Reference Guenther, Casavale and Reedy 38 ) is a dietary measure that evaluates the extent to which an individual’s dietary intake conforms to the 2010 Dietary Guidelines for Americans( 39 ). The HEI-2010 is composed of twelve dietary components (nine adequacy and three moderation categories) that combine to provide an overall dietary score and includes total fruit, whole fruit, total vegetables, dark-green vegetables and beans, whole grains, dairy, total protein foods, seafood and plant proteins, fatty acids, refined grains, sodium and empty calories (solid fat, alcohol and AS (SoFAAS)). While the HEI-2010 provides valuable information, it is not always feasible to obtain the scores due to high participant and researcher burden, as extensive dietary intake information is necessary to calculate this score. Therefore, additional research on the use of minimally invasive, objective biomarkers, which could be feasibly used in community or field settings to assess dietary quality, is needed.
The primary aims of the present investigation, conducted in a community-based sample of adults in a rural health-disparate region of Southwest Virginia, are to: (i) determine if HEI-2010 and SoFAAS scores, AS and SSB intakes predict δ 13C values in fingerstick blood, while controlling for age, sex and race; and (ii) explore the distribution of HEI-2010 scores among tertile levels of δ 13C values. The hypotheses, tested with four separate regression models, are that HEI-2010 and SoFAAS scores, AS and SSB intakes will each significantly predict δ 13C values while controlling for age, sex and race. Additionally, mean HEI-2010 and SoFAAS scores will be significantly greater in the low δ 13C value tertile as compared with the high δ 13C value tertile.
Experimental methods
Participants and design
The current cross-sectional, comparative validation investigation utilized baseline data from the ongoing clinical trial known as Talking Health( Reference Zoellner, Chen and Davy 40 ) (n 224). Talking Health is a 6-month, community-based, two-arm randomized controlled trial which targets SSB consumption behaviours among low socio-economic status (SES) adult (aged >18 years) residents in rural Southwest Virginia, as compared with a matched-contact control group targeting physical activity behaviours. Participants were recruited from April 2012 to September 2013. To be eligible, participants had to consume at least 837 kJ/d (200 kcal/d) from SSB, as assessed by the BEVQ-15 (an FFQ developed to measure beverage consumption patterns)( Reference Hedrick, Comber and Estabrooks 41 – Reference Riebl, Paone and Hedrick 44 ), prior to enrolment. In order to target low-SES adults, recruitment efforts were concentrated on counties that qualified as ‘medically underserved areas’ by using the benchmark of an Index of Medical Underservice of 62·0 or less( 45 ). Various recruitment methods were implemented: in-person community outreach efforts in various venues such day care centres, festivals, community colleges, retail stores, Head Start, health clinics, free clinics, WIC (Special Supplemental Nutrition Program for Women, Infants, and Children) clinics and health departments. Additionally, local extension agents were employed to recruit within the communities, and other recruitment methods included newspaper advertisements, flyers, email listservs and targeted postcard mailings. Although low-SES adults were targeted, income and education status were not eligibility criteria. The study was conducted according to the guidelines laid down in the Declaration of Helsinki and the Virginia Tech Institutional Review Board approved the study protocol. Participants provided written informed consent prior to enrolment.
Methods
Participants underwent assessments of height, measured in metres without shoes using a portable stadiometer; weight, measured in light clothing without shoes, to the nearest 0·1 kg using a digital scale (model 310GS; Tanita, Tokyo, Japan); calculated BMI; and habitual dietary intake using three 24 h dietary intake recalls( Reference Willett and Lenart 17 , Reference Monsen 46 ). The first 24 h food recall was completed in-person and the two remaining food recalls were completed unannounced via telephone; recalls were collected by trained research technicians who were supervised by a doctoral-level registered dietitian. One weekend and two weekdays were recalled to provide a more accurate representation of habitual dietary habits. The dietary intake recalls were analysed using the Nutrition Data System for Research (NSDR) nutritional analysis software (Nutrition Coordinating Center, University of Minnesota, 2011). HEI-2010 scores and AS intake were calculated using dietary intake recall data( Reference Guenther, Casavale and Reedy 38 ). HEI-2010 scores were derived from NDSR output based on guidelines developed by NDSR( 47 ). The HEI-2010 total and sub-component scores were calculated according to a standardized published protocol, which includes an adjustment for energy intake( 47 ). Briefly, total fruit, whole fruit, total vegetables, greens and beans, and dairy were converted into one cup equivalents; whole grains, refined grains, total protein foods, and seafood and plant proteins were converted into one ounce equivalents; and sodium was converted into a one gram equivalent. These components were divided by total daily energy intake/1000 to determine serving equivalents per 1000 kcal (4184 kJ), which determined the raw component scores. Fatty acid raw scores were calculated as a ratio of (PUFA+MUFA) to SFA, and the empty calories (SoFAAS) raw score was determined as the percentage of total energy from solid fats, alcohol and added sugars( 47 ). Standardized scores were calculated from the raw scores based on the HEI-2010 standards for minimum and maximum scores( Reference Guenther, Casavale and Reedy 38 ). HEI-2010 scores range from 0 to 100 (score is a total of all twelve component scores), and SoFAAS scores range from 0 to 20, with higher scores indicating greater adherence to the 2010 Dietary Guidelines for Americans( 39 ). HEI-2010 scores can also be divided into three categories based on dietary quality: good (>80), needs improvement (51–80) or poor (<51)( Reference Guenther, Casavale and Reedy 38 ). Participants also completed a multimedia version of the BEVQ-15( Reference Riebl, Paone and Hedrick 44 ) to determine SSB consumption and provided demographic information.
To determine δ 13C values, a fasting blood sample was provided via a routine fingerstick; samples were blotted onto sterilized Whatman spun glass filters (type GF/D), air-dried, then analysed for δ 13C value using natural abundance stable isotope mass spectrometry (NA-SIMS)( Reference Davy, Jahren and Hedrick 28 ). Stable isotope values are reported using standard δ notation in units of ‘permil’ (‰) relative to international standards (Vienna Pee Dee Belemnite). l-Alanine was used as an internal laboratory standard for carbon. The analytical error associated with each sample measurement was less than 0·05 ‰ in every case. The time course of δ 13C value demonstrated by a specific substrate is dependent upon the turnover rate of the substrate. Hair and nails represent the longest turnover rate (2–6 months depending on area of sampling), red blood cells represent approximately 120 d( Reference Jahren, Bostic and Davy 11 ) and serum measures intake over a 2- to 3-week period( Reference Nash, Kristal and Hopkins 33 ). The time course associated with fingerstick blood is 2–3 weeks (due to the serum content); however, δ 13C value may be diluted as a result of the red blood cell content of fingerstick blood. Davy et al. reported a δ 13C value range of −22·09 to −18·87 ‰ and indicated that higher AS and SSB consumption was associated with higher δ 13C value (i.e. δ 13C value closer to 0 corresponded to higher AS intake)( Reference Davy, Jahren and Hedrick 28 ). Therefore, as HEI-2010/SoFAAS scores improve (increase), indicating less AS intake, δ 13C value should decrease (i.e. become further away from 0), thus creating an inverse relationship; however, when assessing SSB kcal and AS gram intake as related to δ 13C value, values will demonstrate a direct relationship.
Data analysis
Statistical analyses were performed using the statistical software package IBM SPSS version 21·0 for Windows (2012). Descriptive statistics (means and standard deviations; frequencies) are reported for demographic characteristics. Multiple linear regression models were used to predict δ 13C values. Variables were entered into a multiple linear regression model using the ‘enter’ method with two blocks of independent variables. Four separate models predicting δ 13C values were run using HEI-2010 scores, SoFAAS scores, AS grams and SSB kcal in the first block; and age, sex and race in the second block. Sex and race (Caucasian and other) were dummy coded. One-way ANOVA evaluated differences in HEI-2010 and SoFAAS scores for tertiles of δ 13C values. Tertiles were created using an equal number of observations within each tertile. Missing data were addressed by using list-wise deletion methods for the multiple linear regression models and case-by-case deletion for ANOVA. The recommended approach for multiple regression analyses (n ≥50+8 m, where m equals the number of predictor variables) to detect a moderate effect size with 80 % power and an α of 0·05 was applied( Reference Green 48 ). A priori hypothesis included a maximum of four predictor variables per model; therefore a sample size of at least eighty-two participants provided sufficient power.
Results and discussion
Demographics
An initial sample size of 224 was utilized; however, to meet the assumptions of normality, participants with energy intake greater than 2 sd from the mean were excluded (n 8). Thus, a final sample size of 216 was used for the present investigation. Participants were primarily female (83 %), Caucasian (94 %), with a mean age of 41 (sd 14) years (range 18–81 years) and an annual household income of $US 24 132 (sd $US 17 340). Although BMI was widely distributed (mean 32·7 (sd 9·0) kg/m2; range 16·1–71·7 kg/m2), 55 % of the sample was considered obese (BMI≥30·0 kg/m2). When compared with US census data for this medically underserved region, the participants were representative in terms of age (census mean age=40·8 years), income level (census mean income=$US 21 751) and race (census: Caucasian=93·9 %); however, education status for the enrolled participants was slightly higher than in the US census (70 % v. 58 % with an education beyond a high school degree). Additionally, 74 % of the sample had an annual income of $US 35 000 or less, as compared with the state of Virginia (27 %) and the USA (33·5 %)( 49 ), indicating a lower SES study population (Table 1).
Table 1 Characteristics of the participants: adults aged >18 years (n 216), rural Southwest Virginia, USA, April 2012–September 2013

Dietary intake and δ13C value
The overall completion rate for the dietary intake recalls was 89 % (75 % had three complete days, 17·5 % had two and 7·5 % had only one complete day). Participants had a mean daily intake of 1094 (sd 828) ml (37 (sd 28) fl oz) and 1782 (sd 1443) kJ (426 (sd 345)kcal) from SSB, 7255 (sd 2499) kJ (1734 (sd 597)kcal) from all foods and beverages, and 93 (sd 65) g of AS. Total HEI-2010 score ranged from 14·4 to 81·1 with a mean of 43·4 (sd 12·2); SoFAAS score ranged from 0 to 20 with a mean of 10·2 (sd 5·7). In comparison, the mean total HEI-2010 score for the general US population was considered slightly healthier (49·9 (sd 0·5)); however, the mean SoFAAS score was comparable (9·4 (sd 0·2)) to that in the present sample( Reference Guenther, Kirkpatrick and Reedy 50 ). The majority of this sample’s dietary intake quality was considered ‘poor’ (75 %), with 24·5 % ‘needing improvement’, and only 0·5 % were in the ‘good’ category.
Fingerstick δ 13C value ranged from −21·05 to −17·00 ‰, with a mean value of −18·88 (sd 0·7) ‰. This mean δ 13C value suggests a higher AS and SSB intake than observed in a prior clinical laboratory-based investigation, which included individuals with a lower habitual AS (66 (sd 5) g/d) and SSB (561 (sd 105) kJ/d, 134 (sd 25) kcal/d) intake and a mean fingerstick δ 13C value of −19·94 (sd 0·1) ‰( Reference Davy, Jahren and Hedrick 28 ).
Multiple linear regression analysis for variables predicting δ13C value
In step 1, HEI-2010, SoFAAS, AS grams and SSB kcal were all significant predictors (all P≤0·001) of δ 13C value (Table 2). With the addition of the demographic factors (age, sex and race), the models remained significant with R 2 values increasing by about twofold. The β weights remained relatively consistent and significant for HEI-2010, SoFAAS, AS grams and SSB kcal (all P≤0·001). Age was also a significant predictor of δ 13C value in all four models (HEI-2010, SoFAAS, AS grams and SSB kcal; all P≤0·001); however, sex and race were not predictive of δ 13C value, with the exception of sex for HEI-2010 SoFAAS (P=0·04). The significant contribution of age when predicting δ 13C value may be explained by the fact that different age groups consume varying amounts of SSB and AS (typically older adults consume less SSB and AS than younger adults)( Reference Marriott, Olsho and Hadden 5 , Reference Popkin 51 ). While controlling for demographic factors, for every 1 sd increase in HEI-2010 and SoFAAS scores, there is a decrease of 0·23 and 0·28 sd in δ 13C values. That is, as HEI-210 and SoFAAS scores increase (indicating greater adherence to the Dietary Guidelines for Americans), δ 13C values significantly decrease (indicating a lower level of AS consumption). Similarly, for every 1 sd increase in consumption of AS grams and SSB kcal, there is an increase of 0·21 and 0·19 sd in δ 13C value, respectively.
Table 2 Summary of multiple linear regression analysis for variables predicting δ 13C value among adults aged >18 years (n 216), rural Southwest Virginia, USA, April 2012–September 2013

*P≤0·05, **P≤0·01, ***P≤0·001.
† Healthy Eating Index-2010 (HEI-2010) score ranges from 0 to 100, higher scores indicate greater adherence to the 2010 Dietary Guidelines for Americans.
‡ Sex is dummy-coded.
§ Race is dummy-coded into ‘Caucasian’ and ‘other’.
|| SoFAAS, the empty calorie component of the HEI-2010, is comprised of solid fats, added sugars and alcohol intake. Score ranges from 0 to 20, higher scores indicate greater adherence to the 2010 Dietary Guidelines for Americans (i.e. higher score=less sugar intake).
¶ AS, added sugar intake in grams.
†† SSB, sugar-sweetened beverage intake in kilocalories.
Prior biomarker studies have been shown to predict dietary intake with wide variance, ranging from 14 % to 99 %( Reference Hedrick, Dietrich and Estabrooks 20 ), and a wide range of correlations have been reported in validity studies of dietary biomarkers (0·03–0·73)( Reference Willett and Lenart 17 ). Even so, acceptable correlations for this area of research should range from 0·5 to 0·7( Reference Willett and Lenart 17 ). In the present study, although significant, the 14–19 % variance explained by HEI-2010 and SoFAAS scores, AS grams and SSB kcal when predicting δ 13C value is on the low end of the spectrum. Importantly, there are known limitations to self-reported dietary intake methods (i.e. underestimating intake( Reference Willett and Lenart 17 ), especially socially undesirable foods such as sugar-rich foods( Reference Kuhnle 52 )), which may partially explain this lower variance when using self-reported dietary intake to predict a biomarker. However, given that there is limited available research on biomarkers which assess AS intake and/or overall dietary quality, falling within a similar correlation range as other dietary biomarker studies indicates promise and the need for further investigations utilizing δ 13C analysis. To fully understand the potential of using the minimally invasive fingerstick δ 13C value to predict dietary intake in large-scale community trials, δ 13C validation studies using controlled feeding methods as the comparison are also needed. With improved accuracy in the comparison method, it is plausible to suggest that the amount of variance explained by similar δ 13C models would increase.
Differences in HEI-2010 and SoFAAS scores for tertiles of δ13C value
ANOVA were also used to further explore potential differences in mean HEI-2010 and SoFAAS scores across δ 13C value tertiles to determine if δ 13C value was able to distinguish between different levels of dietary quality. HEI-2010 scores were significantly different for upper and lower δ 13C value tertiles (39·6 (sd 10) and 48·1 (sd 14), respectively; absolute difference=8·5, P≤0·0001) and middle and lower tertiles (42·4 (sd 11) and 48·1 (sd 14), respectively; absolute difference=5·8, P≤0·01). SoFAAS scores were significantly different for upper and lower δ 13C value tertiles (7·7 (sd 6) and 12·0 (sd 5), respectively; absolute difference=4·3, P≤0·0001) and upper and middle tertiles (7·7 (sd 6) and 10·7 (sd 5), respectively; absolute difference=3·0, P≤0·01; Fig. 1(a) and (b)). In line with the stated hypothesis that δ 13C value is associated with AS and SSB, it was expected that differences in HEI-2010 scores would be slightly less robust than SoFAAS scores across δ 13C value tertiles, in that HEI-2010 scores are comprised of twelve dietary components while SoFAAS scores are more representative of AS and SSB consumption. Even though SoFAAS scores are a part of total HEI-2010 scores, the mean difference in upper and lower δ 13C value tertiles for HEI-2010 scores was double the difference for SoFAAS scores (8·5 v. 4·3), indicating an effect of AS intake on the diet beyond the SoFAAS component. Although additional research is needed in this area, these data suggest that δ 13C value may be predictive of overall dietary quality. While dietary biomarkers have been previously utilized to develop and validate HEI scores( Reference Weinstein, Vogt and Gerrior 53 ), no investigations have assessed the potential of δ 13C to serve as an indicator of overall dietary quality.
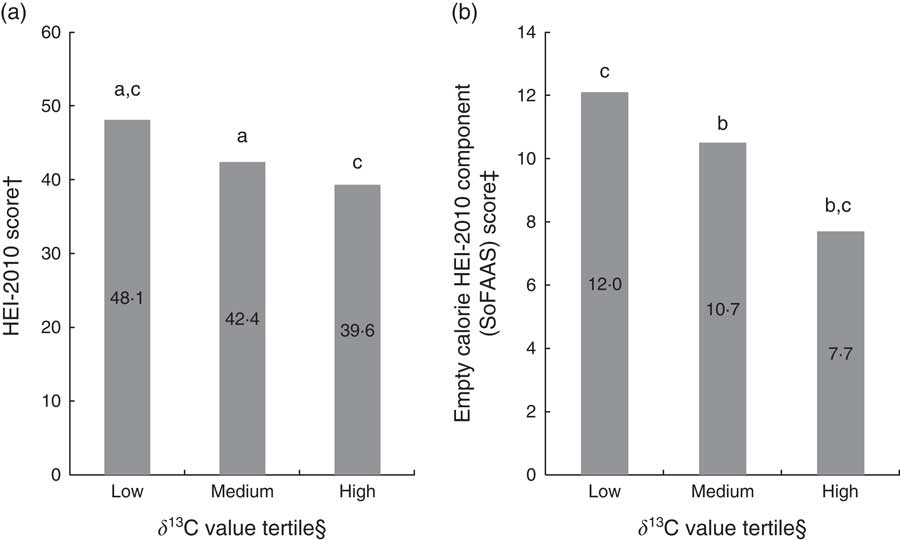
Fig. 1 (a) Mean Healthy Eating Index-2010 (HEI-2010) score and (b) mean empty calorie HEI-2010 component (SoFAAS) score by tertile level of δ 13C value among adults aged >18 years (n 216), rural Southwest Virginia, USA, April 2012–September 2013. †HEI-2010 score ranges from 0 to 100, higher scores indicate greater adherence to the 2010 Dietary Guidelines for Americans. ‡SoFAAS (solid fats, alcohol and added sugars) score ranges from 0 to 20, higher scores indicate greater adherence to the 2010 Dietary Guidelines for Americans (i.e. higher score=less sugar intake). §δ 13C value tertiles determined by low (mean –19·60 (sd 0·46) ‰), medium (mean –18·90 (sd 0·15) ‰) and high (mean –18·13 (sd 0·40) ‰) δ 13C value. aLow and medium δ 13C value tertiles significantly different (HEI-2010; P≤0·01). bMedium and high δ 13C value tertiles significantly different (SoFAAS; P≤0·01). cLow and high δ 13C value tertiles significantly different (HEI-2010 and SoFAAS; P≤0·0001)
Strengths/limitations
The present investigation is the first to report δ 13C fingerstick values in a free-living community-based sample within a general US population, and the first examination of associations of δ 13C fingerstick blood values with overall dietary quality in adults while controlling for relevant demographic factors. One limitation of the study is lack of variability in race/ethnicity and sex, as well as small sample sizes for non-Caucasian (n 13, 6 %) and male participants (n 36, 17 %). However, the targeted Southwest Virginia region is 95 % Caucasian and thus our sample is representative of the study region( Reference Zoellner, Chen and Davy 40 , 49 ). Furthermore, given that eligibility criteria included an average intake of at least 837 kJ (200 kcal) from SSB per day, overall AS intake was high. Nevertheless, HEI-2010 scores had an adequate range from 14·4 to 81·1. Given these limitations, examining fingerstick blood δ 13C values among more ethnic/racially diverse participants and among those with lower AS consumption should be a future research priority. An additional limitation is the reliance on self-reported dietary intake data, which is subject to reporting error and participant bias( Reference Willett and Lenart 17 , Reference Kuhnle 52 ). However, gold-standard dietary recall methodology and state-of-the-art nutritional analysis (NDSR) software were used in efforts to mitigate this limitation. Other dietary items (corn, beet sugar, honey, animal protein) are known to have a similar δ 13C value to AS and SSB( Reference Jahren, Bostic and Davy 11 ). Several investigations have preliminarily assessed the potential confounds from these items by utilizing a dual-isotope model to explain AS intake using δ 13C as a predictor and δ 15N as a covariate, which may increase the biomarker’s sensitivity for AS intake( Reference Nash, Kristal and Bersamin 32 , Reference Hedrick, Zoellner and Jahren 54 ); however, further research is warranted. Two preliminary validation studies have reported that fasting plasma glucose δ 13C is not associated with AS or SSB( Reference Cook, Alvig and Liu 31 , Reference Nash, Kristal and Hopkins 33 ); however, postprandial plasma glucose levels demonstrated strong positive correlations with recent AS intake( Reference Cook, Alvig and Liu 31 ). Collectively, these findings suggest that carbon present in fasting blood glucose reflects acute (e.g. recent meal) and not usual AS consumption, possibly because fasting glucose is primarily derived from non-carbohydrate sources via gluconeogenesis( Reference Jahren, Bostic and Davy 11 , Reference Cook, Alvig and Liu 31 , Reference Nash, Kristal and Hopkins 33 ). However, when our group compared the variances of δ 13C values between a fasting whole-blood fingerstick sample( Reference Zoellner, Chen and Davy 40 , Reference Hedrick, Davy and Wilburn 55 ) (n 202; mean −19·19 (sd 0·87) ‰) and a non-fasting whole-blood fingerstick sample( Reference Davy, Jahren and Hedrick 28 ) (n 60; mean −19·94 (sd 0·76) ‰) from two separate cross-sectional studies in adults, no significant differences in the variance of the two groups were found (F=1·31, P=0·22); thus demonstrating the robustness of whole-blood fingerstick δ 13C value against acute dietary intake. Additional research is needed to determine the optimal substrate and analytical process to assess AS intake using δ 13C values and the time frame reflected by various approaches.
Conclusions
The present results suggest that the δ 13C value of fingerstick blood may be useful as an objective indicator of AS intake and overall dietary quality. It may be able to identify individuals at a low v. high risk for poor dietary quality, which might be especially useful in large-scale public health studies. Additionally, the present investigation helps to address gaps in the biomarker literature by examining the effects of age, sex and race on the variance of δ 13C value. However, given the relatively low amount of variance explained by the prediction models, additional studies are needed, with an emphasis on controlled feeding studies. Future directions include assessing changes in associations of δ 13C value and HEI-2010 over time, determining the ability of the δ 13C biomarker to reflect long-term SSB and AS consumption habits and assessing the sensitivity to change of the δ 13C biomarker, comparing various δ 13C tissue substrates, as well as the inclusion of more ethnic/racially diverse participants and those with lower AS consumption. Also, given the influence of age, age should be controlled for in future research pertaining to δ 13C value and dietary quality. These preliminary findings contribute to research aimed at constructing a ‘δ 13C fingerstick blood level’ guideline that could eventually be used in research and in clinical or community settings to objectively evaluate AS intake, based on the expansion and validation of the association between δ 13C in human blood and AS intake. In conclusion, since HEI-2010 scores are resource-intensive to calculate and are based upon a subjective measure of dietary intake, fingerstick δ 13C values show preliminary promise for use as a minimally invasive, objective measure of AS intake, and an indicator of overall dietary quality and adherence to the Dietary Guidelines for Americans, in community settings.
Acknowledgements
Financial support: This work was supported by the National Institutes of Health (J.M.Z. Principal Investigator, grant number 1R01CA154364-01A1) and the American Heart Association (V.E.H. Principal Investigator, grant number 13POST16560008). The National Institutes of Health and the American Heart Association had no role in the design, analysis or writing of this article. Conflict of interest: None. Authorship: V.E.H., B.M.D., G.A.W., A.H.J. and J.M.Z. designed the research, wrote the paper and had primary responsibility for final content; V.E.H. and G.A.W. conducted the research; V.E.H. and G.A.W. analysed the data; V.E.H. performed the statistical analysis; A.H.J. provided essential reagents and materials. All authors read and approved the final manuscript. Ethics of human subject participation: This study was conducted according to the guidelines laid down in the Declaration of Helsinki and the Virginia Tech Institutional Review Board approved the study protocol. Participants provided written informed consent prior to enrolment.


