


1. Introduction
Confinement of liquids by solid surfaces is common in everyday life and in industrial applications. The relative movement between liquids and the surfaces that confine them affects wear and tear, lubrication, and energy consumption (Hu & Granick Reference Hu and Granick1998; Lugt Reference Lugt2009). These occur whether the surfaces move past each other or if the liquids are pumped in pipes or channels by external forcing. The importance of these processes has led to intensive industrial and fundamental research (Klein Reference Klein1996; Gropper, Wang & Harvey Reference Gropper, Wang and Harvey2016). Control of the lubrication properties of liquids is desirable in many circumstances. For example, switchable drag reduction could provide a method to increase or decrease the flow in channels or pipes (Terwagne, Brojan & Reis Reference Terwagne, Brojan and Reis2014). Electrorheological fluids are particle suspensions that respond to the application of an external electric field (Hao Reference Hao2001). The long-range interactions between the induced dipoles lead to particle chaining and a dramatic increase of the suspension's viscosity. In the viscoelectric effect, a liquid's viscosity changes due the coupling of an electric field with molecular dipoles (Andrade & Dodd Reference Andrade and Dodd1939, Reference Andrade and Dodd1946).
Room-temperature ionic liquids attracted considerable interest in recent years as thin-film wear protectors and in energy applications (Marsh, Boxall & Lichtenthaler Reference Marsh, Boxall and Lichtenthaler2004). The arrangement of the molecules near a charged surface is not trivial due to screening of the field, packing in layers, steric effects, and size asymmetry between anions and cations (Sweeney et al. Reference Sweeney, Hausen, Hayes, Webber, Endres, Rutland, Bennewitz and Atkin2012; Bresme et al. Reference Bresme, Kornyshev, Perkin and Urbakh2022; Pivnic et al. Reference Pivnic, de Souza, Kornyshev, Urbakh and Bazant2023). The effective viscosity of a film can be measured with an atomic force microscope or surface force balance, and usually it increases with the charge of the confining surface (Fajardo et al. Reference Fajardo, Bresme, Kornyshev and Urbakh2017; Pivnic et al. Reference Pivnic, Bresme, Kornyshev and Urbakh2020).
Recently, we found a new effect that we call ‘electrolubrication’, whereby the effective viscosity of liquid mixtures can be controlled by electric fields (Tsori Reference Tsori2023). Here, a field transverse to the confining surfaces couples differently to the mixture's constituents, and screening by existing ions leads to layering of the mixture. The different viscosities of the pure constituents facilitate larger shear, which changes the flow. When the more polar liquid is the less viscous one, lubrication at surfaces is enhanced. In that work, we focused on lubrication between moving surfaces. The unperturbed velocity gradient (without imposed potential) and the resulting stress were constant. The maximal unperturbed velocity was at the moving surface, where the more polar liquid adsorbs. Here, we extend the theory to flows in channels between stationary walls, where the stress is not constant and the maximal unperturbed velocity is where there is less polar liquid. The velocity vanishes at the boundary, where the polar liquid adsorbs.
2. Model
Consider a binary mixture of two liquids. The more polar liquid may be water, and the less polar one is a partially miscible cosolvent. The volume fraction, permittivity and viscosity of the water are  $\phi$, $\varepsilon _w$ and $\eta _w$, respectively. The same quantities for the cosolvent are denoted by $\phi _{cs}$, $\varepsilon _{cs}$ and $\eta _{cs}$. The mixture is coupled to a reservoir containing dissolved anions and cations whose number density is $n_0$. The water and cosolvent have partial miscibility given by their coexistence (binodal) curve. It is assumed that the bulk water composition, $\phi =\phi _0$ and temperature correspond to a homogeneous (mixed) state. While the theory is general, in some curves, as an example for a liquid pair, we use the properties of water and glycerol.
The mixture is pumped into a gap between two parallel and smooth surfaces, and flows parallel to the  $y$-direction; see figure 1. The pressure gradient along the gap can result from a pump, gravitational force, etc. The length of the channel is $L$, and its walls are at $x=\pm D/2$. An electrostatic potential is applied across the channel in the $x$-direction. The resultant electric field modifies the mixture's composition and leads to composition gradients perpendicular to the main flow direction. We assume long channels where edge effects can be ignored. The system is then effectively one-dimensional, and all quantities depend on the $x$-coordinate only. In addition, we focus on steady-state conditions.

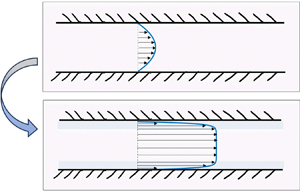
Figure 1. Schematic illustration of the channel. Two flat and smooth walls parallel to  $y$–
$y$– $z$ plane are separated by a distance $D$ in the $x$-direction. The confined mixture is flowing along $y$. In steady state, the velocity depends on $x$:
$x$:  ${\boldsymbol {v}}=v(x)\,\hat {y}$. (a) When the mixture is homogeneous, its viscosity is $\eta (\phi _0)$ and the flow is the classic parabolic profile. (b) When a potential is applied across the walls, the mixture phase separates and two regions rich in the more polar solvent appear near the walls (faint blue shade). When the more polar solvent is the less viscous one, the lubrication layers modify the flow profile. The strong shear near the surfaces facilitates a large flux.
We start by formulating the flow behaviour based on a generic mixture free energy density  $f$, and only later choose a specific model. The governing equations for the flow velocity ${\boldsymbol {v}}$, mixture composition $\phi$, ion densities $n^\pm$, and electrostatic potential $\psi$ are (Samin & van Roij Reference Samin and van Roij2017)
 $$\begin{gather} \boldsymbol{\nabla}\boldsymbol{\cdot}{\boldsymbol{v}}=0, \end{gather}$$
 $$\begin{gather}\frac{\partial\phi}{\partial t}+{\boldsymbol{v}}\boldsymbol{\cdot}\boldsymbol{\nabla}\phi= \boldsymbol{\nabla}\boldsymbol{\cdot}\left(D_\phi\,\boldsymbol{\nabla}\frac{\delta f}{\delta\phi}\right)\!,\end{gather}$$
 $$\begin{gather}\rho\left(\frac{\partial{\boldsymbol{v}}}{\partial t}+({\boldsymbol{v}}\boldsymbol{\cdot} \boldsymbol{\nabla}){\boldsymbol{v}}\right)=-\boldsymbol{\nabla} p+\boldsymbol{\nabla}\left(\eta\,\boldsymbol{\nabla} {\boldsymbol{v}}+\eta(\boldsymbol{\nabla}{\boldsymbol{v}})^{\dagger}\right) -\phi\,\boldsymbol{\nabla}\frac{\partial f}{\partial\phi}+{\boldsymbol{f}}_{\!elec}, \end{gather}$$
 $$\begin{gather}\boldsymbol{\nabla}\left(\varepsilon_0\varepsilon\,\boldsymbol{\nabla}\psi\right)= e\left(n^--n^+\right)\!, \end{gather}$$
 $$\begin{gather}\frac{\partial n^\pm}{\partial t}+\boldsymbol{\nabla}\boldsymbol{\cdot}(n^\pm{\boldsymbol{v}})= \boldsymbol{\nabla}\boldsymbol{\cdot}\left(D_i\,\boldsymbol{\nabla}\frac{\delta f}{\delta n^\pm}\right)\!. \end{gather}$$
 Equation (2.1) is the condition of incompressibility, and (2.2) is a diffusion–advection equation, with diffusion coefficient  $D_\phi$. Equation (2.4) is the Poisson equation, with $\psi$ the electrostatic potential, $e$ the electron's charge, and $\varepsilon _0$ and $\varepsilon (\phi )$ the vacuum and relative permittivities, respectively. Equation (2.5) is the Poisson–Nernst–Planck equation, with ion diffusion constant $D_i$ common to both ionic species. We use a modified Poisson–Boltzmann framework that takes the finite volume of the ions into account, thus
 \begin{equation} \phi+\phi_{cs}+v_0n^++v_0n^-=1, \end{equation}
where  $v_0$ is a volume common to all molecules – water, cosolvent and ions. Equation (2.3) is a Navier–Stokes equation with a force due to composition gradients, and a term ${\boldsymbol {f}}_{\!elec}$, derivable from the Maxwell stress tensor, given by ${\boldsymbol {f}}_{\!elec}=(1/2)\boldsymbol {\nabla }(\varepsilon _0 E^2 \phi \,\partial \varepsilon /\partial \phi )_T-(1/2)\varepsilon _0E^2\,\boldsymbol {\nabla }\varepsilon + e(n^+-n^-){\boldsymbol {E}}$, with the electric field ${\boldsymbol {E}}=-\boldsymbol {\nabla }\psi$. The composition-dependent permittivity is taken to be
 \begin{equation} \varepsilon(\phi)=\varepsilon_{cs}\phi_{cs}+\varepsilon_w(1-\phi_{cs}), \end{equation}
where  $\varepsilon _w$ and $\varepsilon _{cs}$ are the water and cosolvent permittivities, respectively.
The dependence of viscosity on composition is essential for electrolubrication. We assume that the ions’ contribution to the viscosity is the same as that of water, and use the following linear constitutive relation:
 \begin{equation} \eta(\phi)=\eta_{cs}\phi_{cs}+\eta_w(1-\phi_{cs}). \end{equation}
The assumption of an infinitely long channel means that the flow velocity is parallel to the channel axis:  ${\boldsymbol {v}}=v(x)\,\hat {y}$. In steady state, all time derivatives vanish. Since there is no flux of mixture or ions from the walls, we arrive at a remarkable simplification to (2.1)–(2.5) – both the composition profile $\phi (x)$ and ionic densities extremize the free energy: $\delta f/\delta \phi =0$ and $\delta f/\delta n^\pm =0$. As in equilibrium, they do not depend on $D_\phi$ and $D_i$.
Once  $\phi (x)$ and $n^\pm (x)$ are found, one needs to solve the Navier–Stokes equation
 \begin{equation} 0=-\partial_y p_0+\partial_x\left(\eta(\phi(x))\,\partial_xv(x)\right) \end{equation}
subject to the two boundary conditions  $v(x=\pm D/2)=0$.
2.1. Free energy
To be specific, we use below the free energy model
 \begin{equation} \left.\begin{gathered} \varOmega=\int_{-D/2}^{D/2}\left(\,f-\lambda^+n^+-\lambda^-n^--\mu\phi/v_0 \right){\rm d}\kern0.7pt x+f_s,\\ f=\tfrac{1}{2}c^2\left(\boldsymbol{\nabla} \phi\right)^2+f_{m}+f_{e}+f_{i}. \end{gathered}\right\} \end{equation}
The channel walls are taken to be symmetric, hence the surface energy  $f_s$ is taken as $f_s=\Delta \gamma (\phi (-D/2)+\phi (D/2))$, where $\Delta \gamma$ is the difference between the surface energies of water and cosolvent. The chemical potentials of the cations and anions are $\lambda ^\pm$, respectively, and that of the mixture is $\mu$. The square-gradient term accounts for the energetic cost of composition inhomogeneities, where $c$ is a constant.
The free energy density of mixing is
 \begin{equation} f_{m}=\frac{k_BT}{v_0}\left[ \phi\log(\phi)+\phi_{cs}\log(\phi_{cs})+\chi\phi \phi_{cs}\right], \end{equation}
where  $k_B$ is the Boltzmann constant, $T$ is the absolute temperature, and $\chi \sim 1/T$ is the Flory interaction parameter. Equation (2.11) leads to an upper critical solution temperature type phase diagram. In the $\phi \unicode{x2013} \chi$ plane, a homogeneous phase is stable above the binodal curve $\phi _b(\chi )$, whereas below it, the mixture separates to water-rich and water-poor phases, with compositions given by $\phi _b(\chi )$. The two phases become indistinguishable at the critical point $(\phi _c,\chi _c)=(1/2,2)$.
The electrostatic energy density  $f_{e}$ is given by
 \begin{equation} f_{e}=-\tfrac{1}{2}\varepsilon_0\,\varepsilon(\phi)\,(\boldsymbol{\nabla} \psi)^2+e(n^+-n^-)\psi. \end{equation}
The free energy density of the ions,  $f_{i}$, is modelled as
 \begin{equation} f_{i}=k_BT\left[n^+\left(\log (v_0n^+)-1\right)+n^-\left(\log (v_0n^-) -1\right) -\phi(\Delta u^+n^++ \Delta u^-n^-)\right]\!. \end{equation}
The logarithmic terms account for the ions’ entropy; the terms proportional to  $\phi$ model specific chemical short-range interactions between ions and solvents. The parameters $\Delta u^\pm$ measure the preference of ions towards a water environment and are of order ${\sim }1\unicode{x2013} 10$ (Marcus Reference Marcus1988; Samin & Tsori Reference Samin and Tsori2012, Reference Samin and Tsori2013). In the following, we deal with ions that are preferentially hydrophilic, and take them as equal: $\Delta u^\pm =\Delta u$.
2.2. Free energy minimization
We use the following dimensionless variables:  $\tilde {x}=x/\lambda _D$, $\lambda _D^2=\varepsilon _0\,\varepsilon (\phi _0)\,k_BT/(2n_0e^2)$, $\tilde {\psi }=e\psi /k_BT$, $\tilde {V}=eV/k_BT$, $\tilde {n}^\pm =v_0n^\pm$, $\tilde {n}_0=v_0n_0$, $\tilde {c}^2=c^2v_0/(\lambda _D^2k_BT)$, $\tilde {\mu }=\mu /k_BT$, $\tilde {f}_m=v_0f_m/k_BT$ and $\Delta \tilde {\gamma }=\Delta \gamma \,\lambda _D/c^2$. Here, $n_0$ and $\phi _0$ are the bulk ion density and mixture composition, respectively, $\lambda _D$ is the Debye length, and $V$ is the potential drop across the channel. Using these definitions, one can extremize the energy to find the profiles $\phi (x)$ and $\psi (x)$ as
 $$\begin{gather} -\tilde{c}^2\,\tilde{\nabla}^2\phi+\frac{\partial \tilde{f}_m}{\partial\phi}-\Delta u^+\,\tilde{n}^+-\Delta u^-\,\tilde{n}^--\frac12\,\frac{2\tilde{n}_0}{\varepsilon(\phi_0)}\,\frac{\partial\varepsilon} {\partial\phi}\,(\tilde{\boldsymbol{\nabla}} \tilde{\psi} )^2-\tilde{\mu}=0, \end{gather}$$
 $$\begin{gather}\tilde{\boldsymbol{\nabla}} \boldsymbol{\cdot} (\varepsilon(\phi)\,\tilde{\boldsymbol{\nabla}} \tilde{\psi})=\frac{\varepsilon(\phi_0)}{2\tilde{n}_0}\,(\tilde{n}^--\tilde{n}^+). \end{gather}$$
The first equation expresses the variation with respect to  $\phi$, i.e. $\delta f/\delta \phi =0$, and the second equation is Poisson's equation. The boundary conditions for $\phi$ and $\tilde {\psi }$ are
 \begin{equation} \left.\begin{gathered} \phi'(\tilde{x}={\pm} \tilde{D}/2)={\mp}\frac{\Delta\tilde{\gamma}}{\tilde{c}^2},\\ \tilde{\psi}(\tilde{x}={\pm} \tilde{D}/2)={\pm} \frac12\,\tilde{V}. \end{gathered}\right\} \end{equation}
The ions obey a modified Boltzmann distribution (Borukhov, Andelman & Orland Reference Borukhov, Andelman and Orland1997; Samin & Tsori Reference Samin and Tsori2016):
 \begin{equation} \left.\begin{gathered} \tilde{n}^\pm=\frac{P^\pm(1-\phi)}{1+P^++P^-},\\ P^\pm=\frac{\tilde{n}_0}{1-\phi_0-2\tilde{n}_0} \exp\left[(\phi-\phi_0)(\chi+\Delta u^\pm)\mp\tilde{\psi}\right]\!. \end{gathered}\right\} \end{equation}
In general, the electric double layer created at the walls leads to adsorption of the polar solvent due to the dielectrophoretic force and preferential solvation. The thickness of the resulting lubrication layer is determined by both the Debye length and the correlation length of the mixture  $\xi$, and thus can be large at temperatures close to the critical point (Tsori & Leibler Reference Tsori and Leibler2007; Samin & Tsori Reference Samin and Tsori2013).
2.3. Velocity profile
Once the the composition profile  $\phi (x)$ is known from (2.14), (2.15) and (2.17), $v(x)$ can be found in the following way from (2.9). We write the constant pressure drop along the channel as $-\partial _yp_0\equiv -\Delta p/L$, where $\Delta p$ is the pressure drop over a channel of length $L$. Using the symmetry of the problem with respect to the reflection $x\to -x$, one arrives at the solution for the flow profile $v(x)$ given by
 \begin{equation} v_{ef}(x)=\frac{\Delta p}{L}\int_{-D/2}^x\frac{x'}{\eta(\phi(x'))}\,{{\rm d}\kern0.7pt x}'. \end{equation}
The no-flow condition at the walls,  $v(x=\pm D/2)=0$, is satisfied. The total flux is given by the integral
 \begin{equation} Q_{ef}=\int_{-D/2}^{D/2} v(x)\,{{\rm d}\kern0.7pt x}. \end{equation}
 Recall that when the mixture is homogeneous with composition  $\phi _0$ and viscosity $\eta _0=\eta (\phi _0)$, $v(x)$ is the classical parabolic profile
 \begin{equation} v_{m}(x)=\frac12\,\frac{\Delta p}{\eta_0 L}\left(x^2-\left(\frac{D}{2}\right)^2\right)\!. \end{equation}
The flux of this mixed state is
 \begin{equation} Q_{m}=-\frac{1}{12}\,\frac{\Delta p}{\eta_0 L}\,D^3. \end{equation}
The ‘flow amplification factor’  $\alpha$ is defined as the ratio between the fluxes with and without electrostatic potential:
 \begin{equation} \alpha=\frac{Q_{ef}}{Q_m}, \end{equation}
with the integrated fluxes  $Q_{ef}$ and $Q_m$ taken from (2.19) and (2.21), respectively.
In the next section we solve numerically the profiles  $\phi (x)$ and $\psi (x)$, evaluate the velocity and flux from (2.18) and (2.19) for the state with an electric field, and compare them with the same quantities without the field.
3. Results
We solve (2.14) and (2.15) numerically as diffusion equations with pseudo-time until the solutions do not change within the desired error. Spatial derivatives were discretized using standard schemes, and the time integration was done using the Runge–Kutta algorithm. The results were substituted in the equations to verify their validity. For example, in (2.15), the right- and left-hand sides were verified to be equal within a relative error of  $10^{-3}$. We used channels with scaled width $D=8\lambda _D$ and several values of cross-channel potential $\tilde {V}$.
Figure 2(a) shows the water composition, and figure 2(b) the cosolvent composition, across the channel as a function of increasing potential. When  $\tilde {V}=0$, $\phi$ equals the bulk composition $\phi _0=0.25$. As $\tilde {V}$ increases, two boundary layers appear at the walls. The value of $\phi$ increases near the walls, while $\phi _{cs}$ decreases. Their sum is not exactly unity since the dissolved ions have finite volumes. Note that $\tilde {V}=40$ corresponds to a physical potential of 1 V. Clearly, at the walls, water is enriched, therefore the viscosity there is greatly reduced locally as compared to the centre of the channel ( $x=0$). The inset in figure 2(b) shows the width of the water layer near the walls, $w$, which depends on the electrostatic screening length and on the mixture's correlation length. The non-monotonic behaviour of $w$ versus $\tilde {V}$ is a result of the simultaneous nonlinear decrease of screening and the stronger adsorption of water with increasing $\tilde {V}$.

Figure 2. (a) Water ( $\phi$) profiles for varying values of scaled potential $\tilde {V}$ (see legend). The total channel width is $D=8\lambda _D$, and the walls are located at $x/\lambda _D=\pm 4$. The inset shows the surface value $\phi (x=D)$ versus $\tilde {V}$. (b) Cosolvent ( $\phi _{cs}$) profiles for the same potentials. The inset is the width of the wetting layer close to the wall $w$, defined as the distance from the walls, where $\phi$ is the average between $\phi _0$ and $\phi (x=D)$. In all figures, unless stated otherwise, we used $\phi _0=0.25$, $\chi =1$, $\varDelta u=2$, $\varepsilon _w=80$, $\varepsilon _{cs}=45$, $\tilde {c}=0.4$, $\eta _{cs}/\eta _w=1412$, $\Delta \tilde {\gamma }=0$ and $\tilde {n}_0=0.001$.
Figure 3(a) shows the resultant velocity profiles  $v_{ef}(x)$ calculated from (2.18) for the same values of $\tilde {V}$. The curves are characterized by a thin boundary layer at the walls, where the gradient of $v_{ef}(x)$ is large, and a large region, far from the walls, where the velocity is high and approximately constant. As $\tilde {V}$ increases, the maximal speed in the centre increases, and the gradient $v'_{ef}$ near the walls becomes even larger. Using the numerical values $\Delta p=1$ atm, $L=0.01$ m and $\lambda _D=10$ nm, we estimate $v_{ef}$ to be of the order of $1\ \mathrm {\mu }\textrm {m}\ \textrm {s}^{-1}$ for the largest potential, $\tilde {V}=40$. This is almost $80$ times larger than the velocity in the absence of potential.

Figure 3. (a) Velocity profile  $v(x)$ across the channel from (2.18) for varying values of scaled potential $\tilde {V}$ (see legend). When $\tilde {V}=0$, the mixture is homogeneous. The flow is then parabolic and given by (2.20). It is not visible because its amplitude is too small. Here, $v_{ef}$ is given in units of $\Delta p\,\lambda _D^2 /(L\eta _w)$. (b) The ratio of the mid-channel velocities with and without electric potential, $v_{ef}(0)/v_m(0)$, for varying potentials. The inset is a log–log plot indicating that $v_{ef}(0)/v_m(0)-1\sim \tilde {V}^2$ (slope of dashed line is $2$).
$2$).
In figure 3(b), we plot the ratio of the velocities with and without a field,  $v_{ef}/v_m$. Both are evaluated at their maximum, i.e. at $x=0$, and $v_m(x)$ is the parabolic profile in (2.20). When $\tilde {V}=0$, the two are equal. The ratio increases with $\tilde {V}$ to high values – at a physical potential of just $1$ V, $v_{ef}(0)/v_m(0)$ is near $80$.
$80$.
In the calculations thus far, the walls were neither hydrophilic nor hydrophobic,  $\Delta \tilde {\gamma }=0$. It is interesting to study how the flow is affected by the relative hydrophilicity of the surfaces by allowing $\Delta \tilde {\gamma }$ to vary. Figure 4 shows the ‘flow amplification factor’ $\alpha$ from (2.22). As expected, the general trend is that $\alpha (\tilde {V})$ increases with $\tilde {V}$. Each curve corresponds to a different value of $\Delta \tilde {\gamma }$. While all curves reach large flow amplification at $\tilde {V}=40$ ( $\alpha \sim 100$ for all curves), it is clear that $\alpha$ becomes larger monotonically as the surface hydrophilicity increases.

Figure 4. Flow amplification factor  $\alpha$ versus $\tilde {V}$ for different values of $\Delta \tilde {\gamma }$. Here, $\alpha$ in (2.22) is defined as the ratio of the total channel flux with and without electric potential, with $Q_{ef}$ and $Q_m$ taken from (2.19) and (2.21), and $Q_m$ is the flux of the classical parabolic profile, in the absence of potential. The curves differ by the value of $\Delta \tilde {\gamma }$ (see legend). As the walls become more hydrophilic (decreasing value of $\Delta \tilde {\gamma }$), the flux increases relative to $Q_m$. The inset is a log–log plot indicating that $\alpha -1\sim \tilde {V}^2$ (slope of dashed line is $2$).
$2$).
In figure 5, we look at the dependence of electrolubrication on the salt content. We calculated  $Q_{ef}$ versus $\tilde {V}$ with a given amount of salt $\tilde {n}_0$, and then repeated with more salt. While $\alpha$ increases with $\tilde {V}$ and reaches high values at $\tilde {V}=40$, it also increases monotonically as salt is added.

Figure 5. Flow amplification factor  $\alpha$ versus $\tilde {V}$ for different salt contents; the legend indicates the value of $\tilde {n}_0$. As salt is added, the walls adsorb more water, and the flux increases relative to $Q_m$, with $\Delta \tilde {\gamma }=0$. In all curves, $D=8\lambda _D$, with $\lambda _D$ depending on $\tilde {n}_0$. The inset is a log–log plot indicating that $\alpha -1\sim \tilde {V}^2$ (slope of dashed line is $2$).
$2$).
Until now, the polar liquid (water) was considered to be less viscous than the non-polar one (cosolvent), thereby facilitating the two lubrication layers when potential is applied across the walls. It is tempting to think of the opposite case, where the polar liquid is more viscous. If this liquid is very viscous, then could the two layers at the walls act as ‘pipe cloggers’, effectively reducing the channel width  $D$ (or pipe diameter in the case of a circular pipe)?
Figure 6 examines this situation. All parameter values are the same as in figures 2 and 3, except that the viscosities are interchanged:  $\eta _w/\eta _{cs}=1412$. In figure 6(a), $v_{ef}$ is shown for varying values of $\tilde {V}$. The flow velocity is slower at any point $x$, and, in particular, in the centre. Figure 6(b) quantifies the reduction of the flow velocity in the centre. At the maximum value, $\tilde {V}=40$, the velocity is reduced by a modest ${\sim }25\,\%$ from its no-field case. The inset shows that $1-v_{ef}(0)/v_m(0)\sim \tilde {V}^2$.

Figure 6. The same as in figure 3, but now the polar liquid is the more viscous one, i.e. assuming  $\eta _w/\eta _{cs}=1412$. The dashed line in panel (a) is the classical parabolic profile $v_m(x)$. The limit $\tilde {V}\to \infty$ describes complete separation between the liquids, where their velocities given by (3.1). When $\eta _w\gg \eta _{cs}$, and using $\phi _0=2w/D$, one finds that the curve in panel (b) tends to $v_{ef}(0)/v_m(0)\approx (1-\phi _0)^2=0.56$ in the large potential limit when $\phi _0=0.25$. The inset is a log–log plot of $1-v_{ef}(0)/v_m(0)$ versus $\tilde {V}$. The slope of the dashed line is $2$.
$2$.
The figures above show a dependence on  $\tilde {V}^2$ for small potentials. The small $\tilde {V}$ limit can be obtained as follows: (2.14) is linearized around the bulk composition $\phi _0$ using the Debye–Hückel solution of (2.15). The homogeneous solution includes exponents with the mixture correlation length, and the particular solution includes the Debye length. Next, the Navier–Stokes equation (2.9) is solved by assuming that $v(x)=v_0(x)+\delta v(x)$, where $v_0$ is the parabolic profile, and $\delta v$ is a small perturbation whose boundary values are $\delta v(x=\pm D/2)=0$. The dependence of $\delta v$ on $\phi$ is via (2.8). The perturbation $\delta v$ and the corresponding flux are proportional to $\tilde {V}^2$. As a result, $1-v_{ef}(0)/v_m(0)\sim \tilde {V}^2$.
How does  $\alpha$ scale with the channel width $D$? In figure 7, we varied $D$ at constant pressure gradient and potential. Figure 7(a) shows the profiles $\phi (x)$ versus $x$ for several values of $D$ (different colours; see legend). Note that each curve has a different $x$-range. All curves exhibit a wetting layer near the walls. These layers are similar to each other because the potential is the same. The calculations assume that far from the surfaces, the composition is fixed at $\phi _0=0.25$. Figure 7(b) shows $\alpha$ versus $D$. At small channel widths, $\alpha$ is large since the volume fraction of the less viscous solvent (water) is high. As $D$ increases, the volume fraction of the wetting layers becomes smaller, and $\alpha$ decreases monotonically. In the limit $D\to \infty$, $\alpha$ tends to unity.

Figure 7. (a) Composition profiles for different channel widths  $D$ (see legend) at constant potential $\tilde {V}=40$. Each curve has a different $x$-range: for example, the dark blue curve corresponds to $D=8\lambda _D$, therefore the $x$-range is $-4\leqslant x/\lambda _D\leqslant 4$. All curves have a wetting layer of the less viscous liquid at $x\lesssim D$. Calculations assume a bulk value $\phi _0=0.25$ far from the walls. (b) Flow amplification ratio $\alpha$ versus channel width $D$. Here, $\alpha$ decreases with $D$ since the relative volume fractions of the wetting layers decreases with $D$.
$D$.
We now estimate  $\alpha$ by using a simple analytical model, where two layers of pure water of thickness $w$ are at the walls, and pure cosolvent is in the centre. Hence $\phi _0=2w/D$ is the water volume fraction. From (2.18), one finds the velocity in the two regions to be
 \begin{equation} \left.\begin{gathered} v_{cs}(x)=\frac12\,\frac{\Delta p}{\eta_{cs}L}\,x^2+c_1,\quad |x|\leqslant D/2-w,\\ v_w(x)=\frac12\,\frac{\Delta p}{\eta_wL}\,x^2+c_2,\quad |x|>D/2-w. \end{gathered}\right\} \end{equation}
From the continuity of  $v$ at $x=\pm (D/2-w)$, and the no-flow boundary conditions, it follows that $c_2=(-1/8)\,\Delta p\,D^2/(\eta _w L)$ and $c_1=(\Delta p/2L)(1/\eta _w-1/\eta _{cs})(D/2-w)^2-(1/8)\,\Delta p\,D^2/(\eta _wL)$.
The flux integrated over the channel width is
 \begin{align} Q_{ef}&=2\int_0^{D/2-w}v_{cs}\,{{\rm d}\kern0.7pt x}+2\int_{D/2-w}^{D/2}v_w\,{\rm d}\kern0.7pt x\nonumber\\ & =-\frac{1}{12}\,\frac{\Delta p}{L}\,\frac{2w\left(3D^2-6Dw+4w^2\right)\eta_{ cs}+\left(D-2w\right)^3\eta_w}{\eta_{cs}\eta_w}. \end{align}
The flux of the mixed state can be obtained from (2.21), with the average viscosity given by  $\eta _0=(2w/D)\eta _w+(1-2w/D)\eta _{cs}$:
 \begin{equation} Q_m=-\frac{1}{12}\,\frac{\Delta p}{L}\,\dfrac{D^3}{\dfrac{2w}{D}\,\eta_w+\left(1-\dfrac{2w}{D}\right)\eta_{ cs}}. \end{equation}
The ratio  $\alpha =Q_{ef}/Q_m$ increases monotonically with the viscosity ratio $\eta _{cs}/\eta _w$ when $w/D$ is held constant. One can also hold the ratio $\eta _{cs}/\eta _w$ constant and inspect $\alpha$ as a function of $w/D$. The small $w/D$ values correspond to the large $D$ range in figure 7(b). Surprisingly, as can be seen in figure 8, $\alpha$ has a maximum at a finite lubrication layer thickness $w$. The blue curve shows $\alpha$ for the case where the less polar liquid is more viscous ( $\eta _{cs}/\eta _w=1412$). In the red curve, the viscosities are interchanged: the polar phase is more viscous, $\eta _w/\eta _{cs}=1412$. The existence of the maximum is due to the assumption of a closed system, where $\eta _0$ depends on $w$,
$w$,  $D$,
$D$,  $\eta _{cs}$ and $\eta _w$, which is different from a system coupled to a reservoir, where $\eta _0=\eta _{cs}$.

Figure 8. Flow amplification factor  $\alpha$ as a function of model layer thickness $w$. This layer comprises the more polar liquid, and its viscosity is $\eta _w$. The viscosity of the non-polar liquid in the centre of the channel is $\eta _{cs}$. The blue curve is where the polar layer is less viscous; the red curve is where the polar layer is more viscous.
4. Conclusion
We investigate the electrolubrication of liquid mixtures flowing between two parallel plates. An electrostatic potential applied across the surfaces causes partial demixing of the liquids. The more polar liquid is adsorbed to the walls, due to screening of dissolved ions. The thickness of the lubrication layer can be large at temperatures close to the critical point. A similar phenomenon could be achieved, in principle, without ionic screening, but the geometry would have to allow for field gradients (Tsori, Tournilhac & Leibler Reference Tsori, Tournilhac and Leibler2004). In addition, the potentials required are higher.
When the more polar liquid is less viscous than the non-polar one, shear stress falls mainly on the thin lubrication layers, and the flow profile is modified significantly from the classical parabolic one. The velocity and flux in the gap are then increased. The ‘flow amplification factor’  $\alpha$, measuring the relative increase in flux, is of order 10–100 or more for mixtures of water and glycerol. It increases monotonically with applied potential. Additionally, $\alpha$ depends on the viscosity ratio, ionic content, temperature and surface tension with the walls.
The flow profile in figure 1(b) is reminiscent of yield stress phenomena in Bingham fluids. Usually in yield stress phenomena, the fluid is homogeneous, and the yielding occurs when the pressure is larger than a critical value. Here, the fluid is made up from two liquids, and ‘yielding’ is due to the field acting transverse to the flow while the pressure is constant.
One possible application of ‘electrolubrication’ is in microfluidic devices, whereby the flow of liquid mixtures flowing in narrow channels could be manipulated by transverse potentials. Electrical contacts are already commonly used to control the location and movement of droplets transport in channels. As we show in this paper, precise temperature regulation or exact solution composition are not required. Another possible application is in microelectromechanical systems, where small, solid, moving elements slide past each other. If the liquid embedding the moving parts is a mixture, then control of the elements’ charge would allow us to modify the lubrication layer around the elements, and therefore the friction. In many cases, solid surfaces are charged (e.g. silica in aqueous water), and then it is important to asses the lubrication effect.
It would be interesting to lift the assumption of steady state and study, for example, a homogeneous mixture entering a constriction subject to strong electric field. The mixture's composition and velocity then evolve along the flow direction, and reach steady state only sufficiently far downstream. The understanding of such dynamical processes is not trivial and could be important for various applications of electrolubrication.
Funding
This work was supported by the Israel Science Foundation (ISF) grant no. 274/19.
Declaration of interests
The authors report no conflict of interest.


 Open access