Type 2 diabetes mellitus (T2DM) is a major public health problem characterised by impaired metabolism of carbohydrates, proteins and fats due to insulin resistance, impaired insulin secretion or both(Reference DeFronzo, Ferrannini and Groop1). Diabetes is now a global concern, with nearly 537 million people (10·5 %) diagnosed with diabetes worldwide in 2021, and the projection for 2045 is 783 million people(Reference Hossain, Al-Mamun and Islam2). T2DM accounts for about 98 % of all diabetes cases(Reference Green, Hede and Patterson3). The World Diabetes Federation ranked the Middle East and North Africa as the regions with the highest prevalence in the world (12·2 %)(Reference El-Kebbi, Bidikian and Hneiny4). Based on a systematic review and meta-analysis in Iran, the prevalence of T2DM is estimated at 10·8 % among adults(Reference Hazar, Jokar and Namavari5). Statistics also show that in 2023, about 5·4 million Iranian adults were diagnosed with diabetes (both types)(6), and this number is expected to reach 9·2 million in 2030(Reference Javanbakht, Mashayekhi and Baradaran7). People with diabetes are at increased risk of complications including diabetic retinopathy, nephropathy(Reference Forbes and Cooper8), CVD(Reference Wannamethee, Shaper and Whincup9) and mortality(Reference Nwaneri, Cooper and Bowen-Jones10).
Dietary carbohydrates have often been at the centre of studies focused on diabetes. The quality of carbohydrates consumed has a greater effect on blood sugar levels and the risk of T2DM than their quality(Reference de Munter, Hu and Spiegelman11). Glycaemic index (GI) measures how quickly a food raises blood sugar, while glycaemic load (GL) accounts for both the GI and the amount of carbohydrates in a serving, indicating its overall impact on blood sugar(Reference Foster-Powell, Holt and Brand-Miller12). The dietary GI and GL are well-known terms in this area. Despite several studies on the protective association of low dietary GI and GL foods with T2DM, there is no consensus about them(Reference Greenwood, Threapleton and Evans13,Reference Bhupathiraju, Tobias and Malik14) . Dietary GI and GL consider only carbohydrates, while other macronutrients can also have a significant effect on insulin secretion(Reference Rietman, Schwarz and Tomé15,Reference von Frankenberg, Marina and Song16) . Therefore, dietary insulin index (DII) and dietary insulin load (DIL) have recently been suggested as valuable tools in this area. The food insulin index is the difference between the area under the curve after ingestion of a 1000-kJ portion of the test food and the area under the curve after ingestion of a 1000-kJ portion of the reference food for 2 h(Reference Holt, Miller and Petocz17). The DII and DIL are calculated by summing up the product of the food insulin index, energy content and consumption frequency of food items(Reference Yari, Behrouz and Zand18). The relationships between DII and DIL with several health-related outcomes, including obesity(Reference Anjom-Shoae, Keshteli and Sadeghi19), CVD(Reference Teymoori, Farhadnejad and Mirmiran20), psychological disorders(Reference Anjom-Shoae, Hassanzadeh Keshteli and Afshar21) and some cancers(Reference Bao, Nimptsch and Meyerhardt22–Reference Anjom-Shoae, Shayanfar and Mohammad-Shirazi26) have been investigated.
We are aware of only one study investigating the relationship between DII and the risk of incident T2DM, in which 1149 participants over the age of 30 were followed for 8 years, and the results of this study showed that greater DII, DIL, GI and GL increase the risk of T2DM(Reference Teymoori, Farhadnejad and Moslehi27). Clarifying the relationship between DII and DIL with the risk of T2DM is of great importance, particularly in Middle Eastern nations, where people consume large amounts of carbohydrates, mostly refined sources(Reference Bahreynian and Esmaillzadeh28). Additionally, the increasing prevalence of T2DM and specific eating habits in this region (such as high consumption of sweets) are other reasons for the importance of the subject. Moreover, dietary fat intake in this region is mostly from hydrogenated vegetable oils, which contain high amounts of trans and saturated fats(Reference Mozaffarian, Abdollahi and Campos29), and high consumption of these types of fats can lead to T2DM by reducing insulin sensitivity(Reference von Frankenberg, Marina and Song16). Given the limited evidence on the association between dietary insulinemic potential and risk of T2DM, we decided to investigate the association between dietary GI and insulin index with T2DM prevalence and incidence in a large population of Iranian adults.
Participants and methods
Study design and population
The present study was carried out using data from Yazd Health Study (YaHS)-Taghzieh Mardom Yazd (TAMYZ), a prospective cohort study on 9962 adults aged 20–70 years living in Yazd Greater Area, Iran (www-yahs-ziba.com). This study has been initiated in 2014–2016 (baseline examination), and its data are collected prospectively at 5-year intervals and this is a repeating process that occurs every 5 years that in present investigation, only the data of the first five years (first phase) have been used. Details about YaHS-TAMYZ studies have already been published(Reference Mirzaei, Salehi-Abargouei and Mirzaei30). In the current analysis, during the screening process, participants were excluded if they had missed responding to more than seventy items of dietary intake data (n 850), were pregnant (n 115), reported inexplicably low or high energy intakes (< 800 kcal/d or > 6000 kcal/d) (n 1097), had cancer (n 75), adhered to a special diet (n 1091) and were diagnosed with diabetes (n 1060) or CVD (n 320). After additional removal of those with missing information for detection of diabetes incidence during follow-up (n 119), and participants who deceased during the follow-up period (n 132), prospective analyses were conducted on (n 5105) subjects.
Dietary intake assessment
Participants’ dietary information was collected by trained interviewers completing a semi-quantitative FFQ in the YaHS-TAMYZ study. Validity and reliability of this questionnaire were measured and confirmed in a previous study(Reference Zimorovat, Moghtaderi and Amiri31). The FFQ used in this study was a 178 item questionnaire that contained 168 food items commonly consumed in Iran and 10 questions related to foods traditionally consumed in Yazd city. For each food item, participants were asked to respond to a ten-choice frequency response section, ranging from ‘never or less than once a month’ to ‘10 or more times each day’. Five different portion sizes were asked for each food item, depending on the Iranian standard serving size. This questionnaire required participants to answer two questions: the frequency of food consumption and the amount of food consumed at each time of consumption. Using household measures, the quantity and frequency of daily intake of all food items were transformed to grams per day(Reference Ghafarpour, Houshiar-Rad and Kianfar32). The USA Department of Agriculture’s food composition database was used to calculate each subject’s energy and nutrient intakes(Reference Holt, Miller and Petocz17).
Glycemic indices
The total dietary GI was calculated using the following formula: ∑ (GIa × available carbohydrate)/total available carbohydrate. Total carbohydrate minus dietary fibre was used to compute available carbohydrates in food items(Reference Wolever, Yang and Zeng33). The GI of each food item was obtained using the international table of GI(Reference Foster-Powell, Holt and Brand-Miller12) and the list of the GI of Iranian food(Reference Taleban and Esmaeili34). The total carbohydrate and fibre content of food items was derived from the USA Department of Agriculture food-composition table(35). The GI values for the other food items, such as some traditional sweets and desserts, which were not available on Iranian or international tables, were calculated using the composition of their ingredients. For example the GI value of Qottab, a traditional sweet popular in Yazd that primarily consists of sugar with negligible amounts of flour and almonds, is considered to be same as sugar. Mixed meal GI were calculated using the GI values of each meal’s component(Reference Wolever, Yang and Zeng33). Glucose was utilised as the reference food for all GI calculations. Moreover, dietary GL was calculated by the following formula: [(dietary GI × total available carbohydrates)/100](Reference Wolever, Yang and Zeng33).
Insulin indices
The DII was computed using previously published estimations by Brand-Miller et al., which are based on the insulin index of dietary food items(Reference Holt, Miller and Petocz17,Reference Bao, de Jong and Atkinson36) . The difference between the area under the curve after ingestion of a 1000-kJ portion of the test food and the area under the curve after ingestion of a 1000-kJ portion of the reference food during 2 h is known as the food insulin index. Food items that were not available in the food list released by Brand-Miller et al. were considered equal to their similar foods (based on the similarity between their energy, carbohydrate, fibre, fat and protein content). To determine DIL, the insulin load of each item was first determined using the following formula:
Insulin load = Insulin index × energy content (kcal/d)
DIL was calculated for each subject by adding up the insulin load of consumed foods. After that, each participant’s DII was calculated by dividing DIL by total energy intake.
Outcome ascertainment
Follow-up length was computed from study baseline to the first date of an event (diagnosis of diabetes) or the last date of follow-up examination, whichever came first. According to the criteria of the American Diabetes Association, people with a fasting blood sugar of 126 mg/dl and above, or a 2-hour blood sugar above 200 mg/dl or those on diabetes medication are considered to have confirmed diabetes.
During the follow-up phase of the study, a physician confirmed the accuracy of the participant’s reports. The date of the diabetes diagnosis was the date on which the subject made the announcement.
Assessment of other variables
In the YaHS-TAMYZ study, physical activity was determined using the short form of the standard international physical activity questionnaire. The short form of the validated international questionnaire of physical activity included questions in four parts of intense activity, moderate activity, walking and sitting activities during the last 7 d, which were completed by individuals in terms of intensity, duration and repetition(Reference Karimzadeh Shirazi, Sh and Heydarnia37). In this study, anthropometric variables including height, weight, waist circumference and hip circumference were measured. Demographic information, history of chronic diseases such as CVD and hypertension, cancer, pregnancy status and following a special diet during the last year were obtained as primary information from all participants in the YaHS-TAMYZ study.
Statistical analysis
Using the above-mentioned methods, the score of GI, GL, DII and DIL was calculated, and individuals were classified based on the scores obtained in different tertiles. For categorical data, the percentage was used and for continuous variables, and mean (standard error (se)) was used. Using ANOVA and the χ 2, the difference in continuous and categorical variables between GI, GL, DII and DIL tertiles was examined, respectively. The analysis of covariance was performed to compare dietary nutrient intake across tertiles, in which adjustments were done for sex, age and energy intake. Logistic regression in crude and multivariable-adjusted models was done to assess the association between dietary GI, GL, DII and DIL and presence of diabetes. To examine the risk of incident diabetes, we computed hazard ratio (HR) and 95% CI using Cox proportional hazard regression (HR and 95 % CI) in crude and multivariable-adjusted models. The adjustments were done for age (categorical), gender (categorical) and total energy (continuous) in model 1 and BMI (categorical), marital status (categorical), physical activity (continuous, MET-h/wk), smoking status (categorical), education status (categorical), job status (categorical) and family history of diabetes (categorical). All analyses were done using SPSS software (Version 26·0; SPSS Inc, Chicago IL). Statistical significance was defined as a P value < 0·05.
Results
This study included a total of 6178 participants in the cross-sectional analysis and 5105 subjects in the prospective phase, ranging in age from 20 to 70 years old. Tables 1 and 2 show the overall characteristics of participants across dietary tertiles of GI and GL (Table 1) and DII and DIL (Table 2). Participants in the top tertile of GI were less likely to be educated compared with those in the bottom tertile (P < 0·05). Also, the distribution of participants in terms of age was significantly different across GI tertiles (P < 0·05). With regard to tertiles of GL, participants in the highest tertile were more likely to be male, educated, physically active and less likely to be married and with a family history of diabetes compared with those in the lowest tertile (P < 0·05 for all). In addition, the distribution of participants in terms of age categories and job status was significantly different across GL tertiles (P < 0·05).
General characteristics of participants across tertiles of dietary glycaemic index and dietary glycaemic load*
(Mean values with their standard errors)
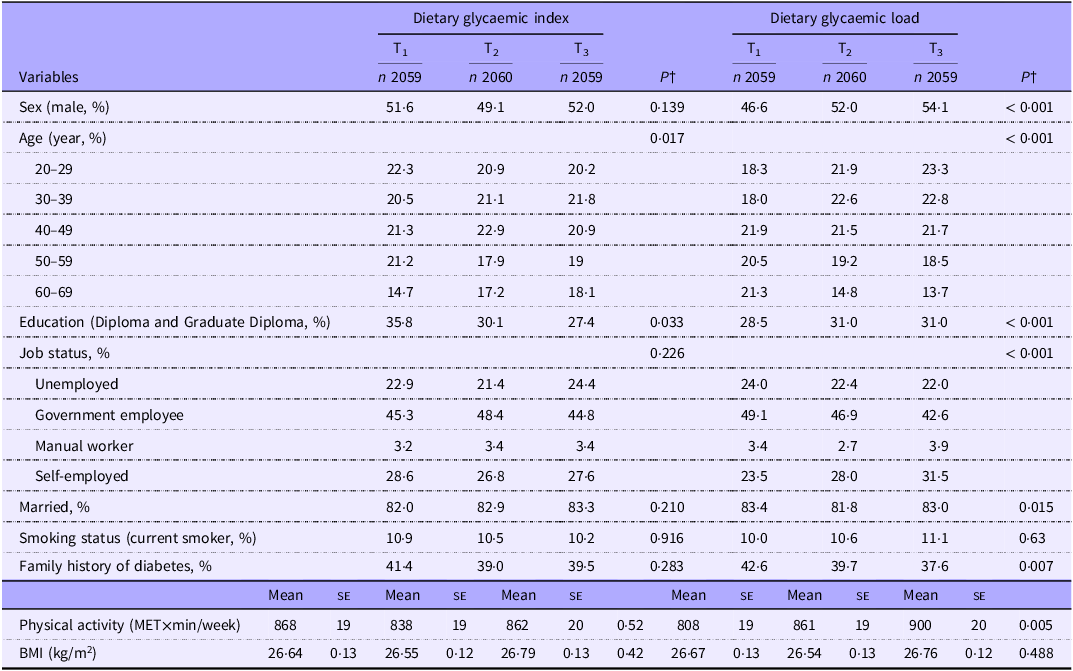
PA, physical activity; ME, metabolic equivalent.
* Values are mean (se) otherwise indicated.
† P are resulted from χ 2 for qualitative variables and from ANOVA for quantitative variables and from.
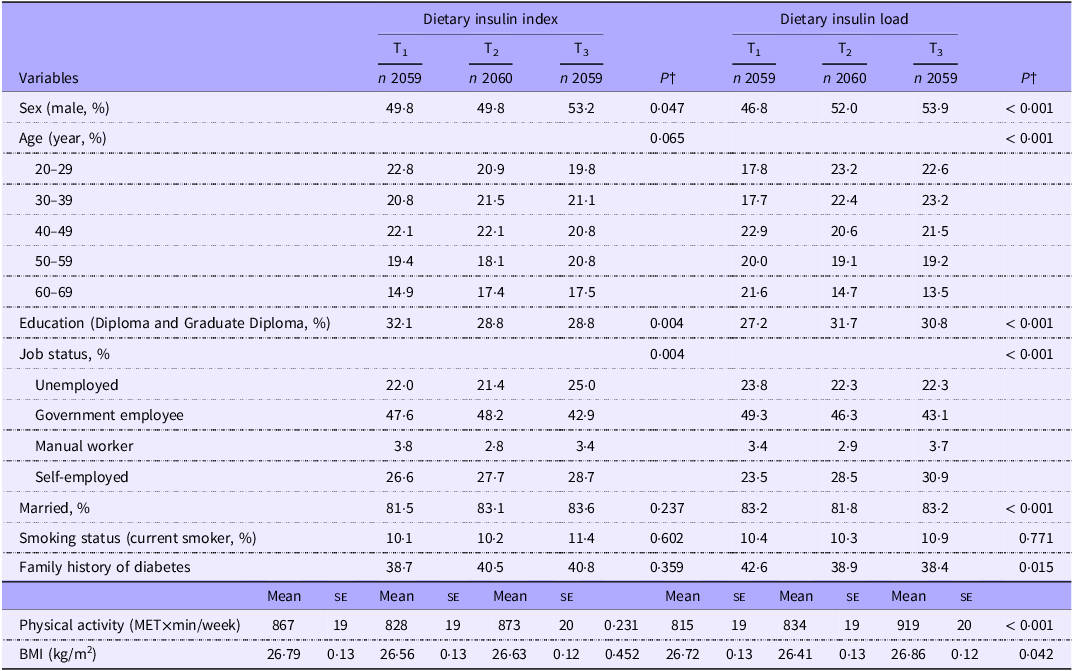
General characteristics of participants across tertiles of dietary insulin index and dietary insulin load*
(Mean values with their standard errors)

PA, physical activity; ME, metabolic equivalent.
* Values are mean (se) otherwise indicated.
† P resulted from χ 2 for qualitative variables and from ANOVA for quantitative variables and from.
Subjects in the top tertile of DII were more likely to be male and less likely to be educated than those in the bottom tertile (P < 0·05). The distribution of individuals in terms of job status was significantly different across DII tertiles (P < 0·05). Compared with those in the bottom tertile of DIL, people in the top tertile were more likely to be male, educated and physically active, have greater BMI and were less likely to have a family history of diabetes (P < 0·05 for all). There was also a significant difference across DIL tertiles in terms of distribution of participants with regard to age, job status and marital status (P < 0·05 for all).
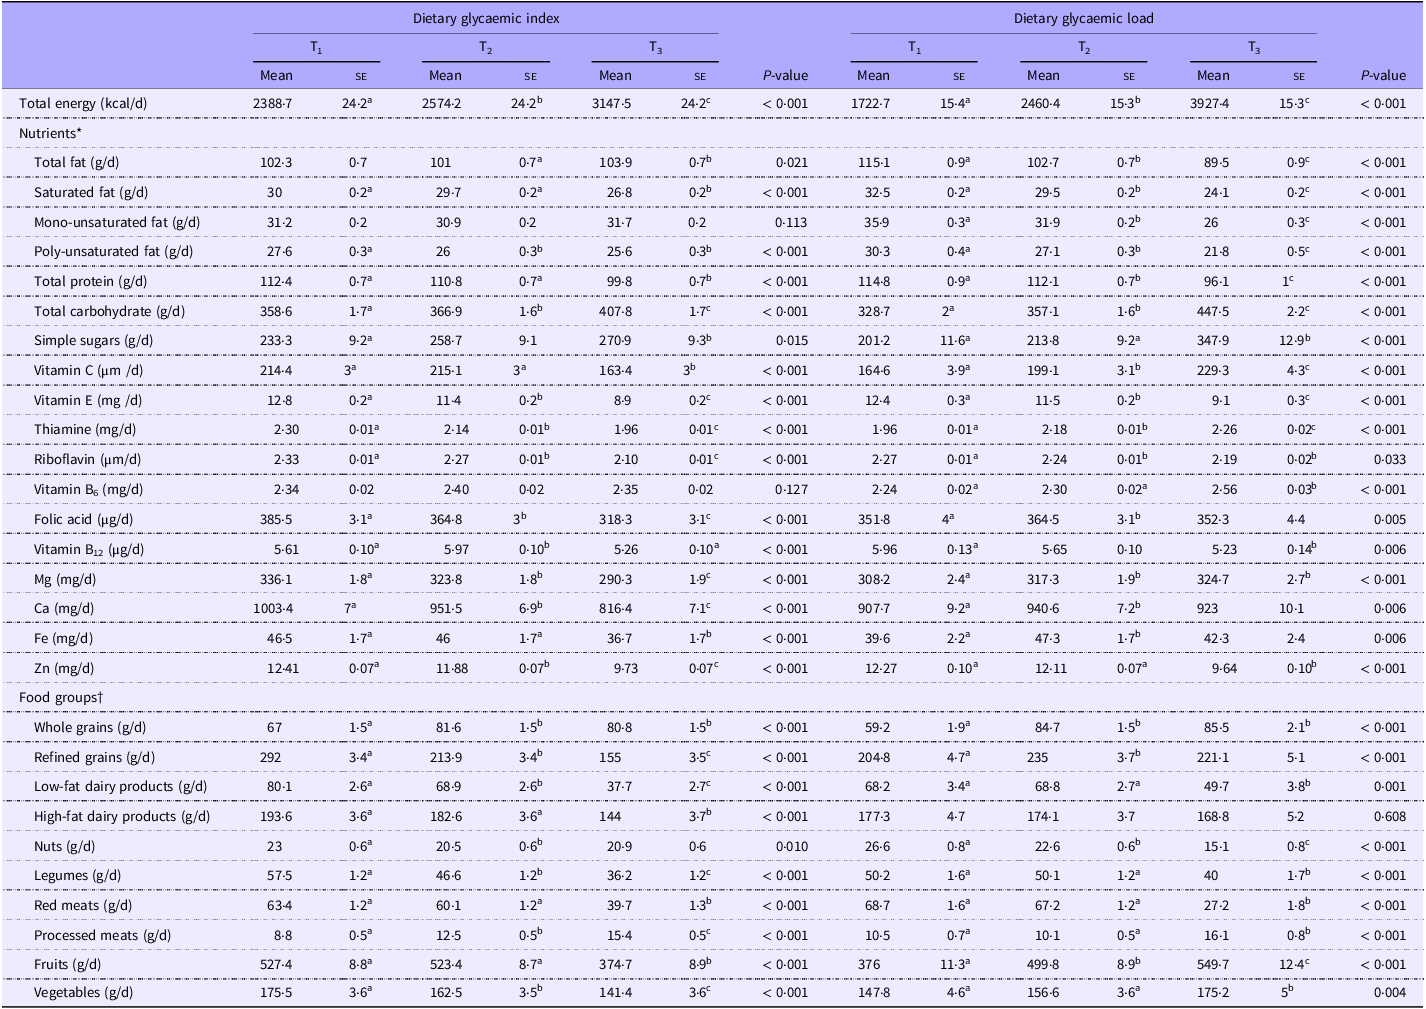
Dietary intakes of selected foods and nutrients across tertiles of independent variables are shown in Tables 3 and 4. Individuals in the highest tertile of GI had a higher intake of total energy, total fat, total carbohydrates, simple sugars, whole grains and processed meats and a lower intake of saturated fat, poly-unsaturated fat, total protein, vitamin C, vitamin E, thiamine, riboflavin, vitamin B12, folic acid, Mg, Ca, Fe, Zn, refined grains, high-fat dairy products, low-fat dairy products, red meats, nuts, legumes, fruits and vegetables compared with those in the lowest tertile (P < 0·05) (Table 3). Higher dietary GL was associated with greater intakes of total energy, total carbohydrate, simple sugars, vitamin C, thiamine, vitamin B6, folic acid, Mg, Ca, Fe, whole grains, refined grains, processed meats, fruits, vegetables and a lower intake of total protein, total fat, saturated fat, monounsaturated fat, poly-unsaturated fat, riboflavin, vitamin E, B12, Zn, low-fat dairies, legumes, red meats and nuts (P < 0·05).
Comparison of age, gender and energy adjusted dietary food groups and nutrients intake according to tertiles of dietary glycaemic index and dietary glycemic load
(Mean values with their standard errors)‡

* Values are adjusted for, sex, age and total energy.
† Values are reported as mean (standard error (se)).
‡ Values with different super scripts are significantly different.
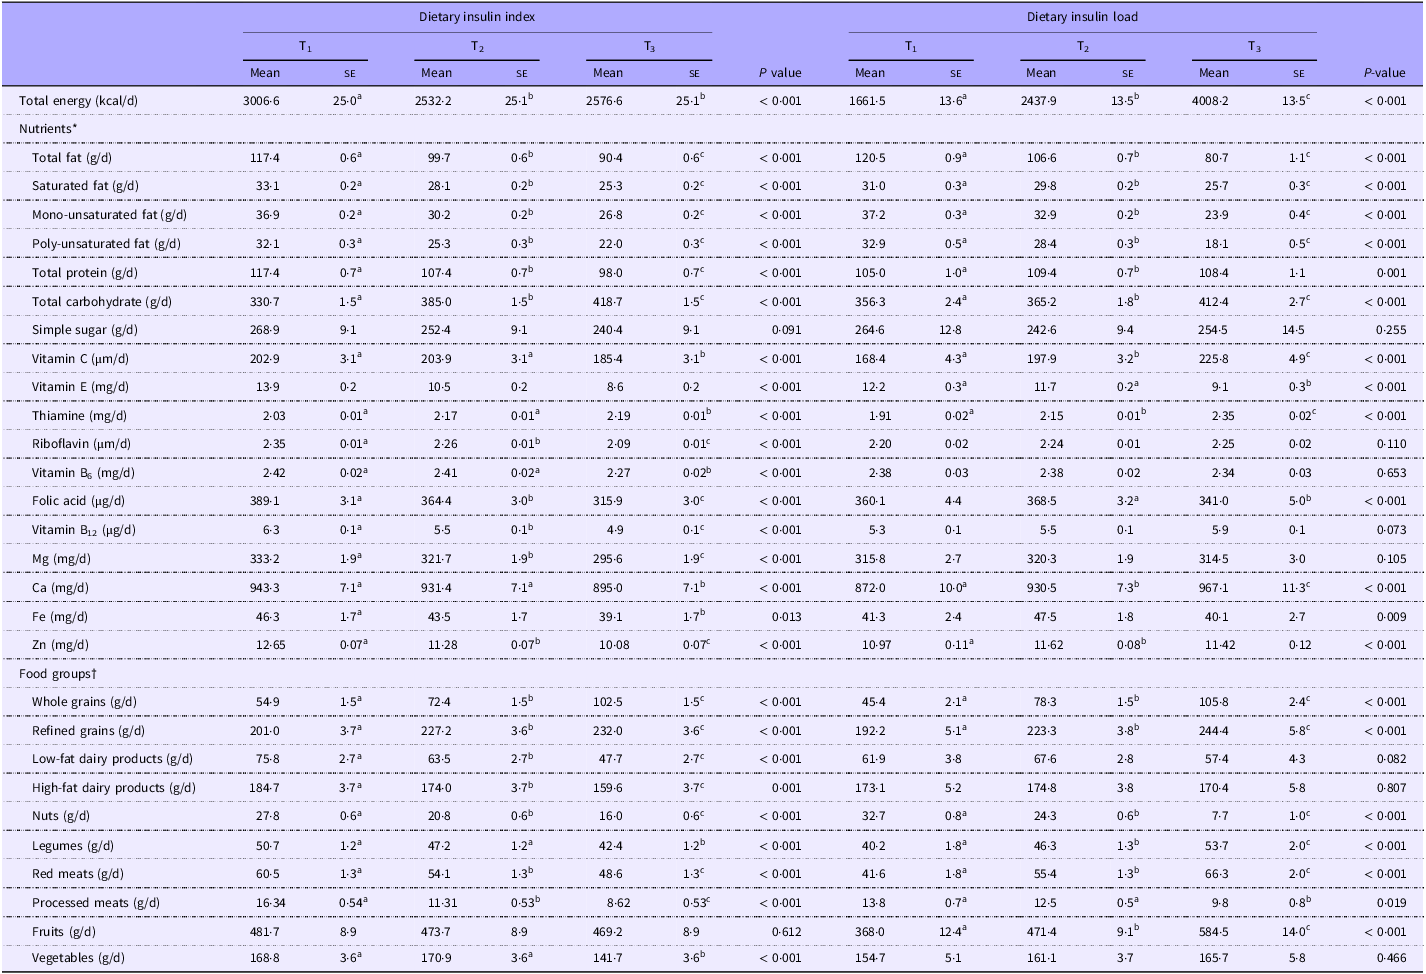
Comparison of age, gender and energy adjusted dietary food groups and nutrients intake according to tertiles of dietary insulin index and dietary insulin load
(Mean values with their standard errors)‡

* Values are adjusted for, sex, age and total energy.
† Values are reported as mean (standard error (se)).
‡ Values with different superscripts are significantly different.
Comparing extreme tertile of DII, we found that subjects in the highest tertile had a higher intake of total carbohydrates, thiamine, whole grains, refined grains and a lower intake of total energy, total fat, saturated fat, monounsaturated fat, poly-unsaturated fat, total protein, vitamin C, E, B6, B12, riboflavin, folic acid, Mg, Ca, Fe, Zn, high-fat dairy products, low-fat dairy products, red meats, processed meats, nuts, legumes and vegetables than those in the lowest tertile (P < 0·05). Higher DIL was associated with greater intakes of total energy, total carbohydrate, total protein, vitamin C, thiamine, Ca, Zn, whole grains, refined grains, legumes, red meats and fruits and a lower intake of total fat, saturated fat, monounsaturated fat, poly-unsaturated fat, vitamin E, folic acid, Fe, nuts and processed meats (P < 0·05, Table 4).
Examining in the cross-sectional phase, we failed to find any significant association between dietary GI and GL as well as DII or DIL and prevalence of diabetes in all participants (data not shown). This was also the case when we examined these associations in different subgroups including BMI status (BMI ≥ 25/BMI < 25) and gender (male/female).
Hazard ratios and the relevant 95 % CI for incident diabetes across tertiles of dietary GI and GL are provided in Table 5. In the crude model, we observed a non-significant association between greater dietary GI and risk of T2DM in the whole population (HR for T3 v. T1:1·14; 95 % CI: 0·72, 1·81, P = 0·58) as well as across all subgroups. After controlling for potential confounders, these associations did not change much either in the whole population (HR for T3 v. T1:1·11; 95 % CI: 0·69, 1·80, P = 0·66) or across subgroups. In terms of dietary GL, we found no significant relationship between dietary GL and risk of diabetes in the whole population before (HR for T3 v. T1:0·80; 95 % CI: 0·50, 1·27, P = 0·36) or after controlling for confounders (HR for T3 v. T1:0·76; 95 % CI: 0·35, 1·66, P = 0·79).
The likelihood for incidence of diabetes according to tertiles of glycaemic index and glycaemic load*
(Hazard ratio and 95 % confidence intervals)
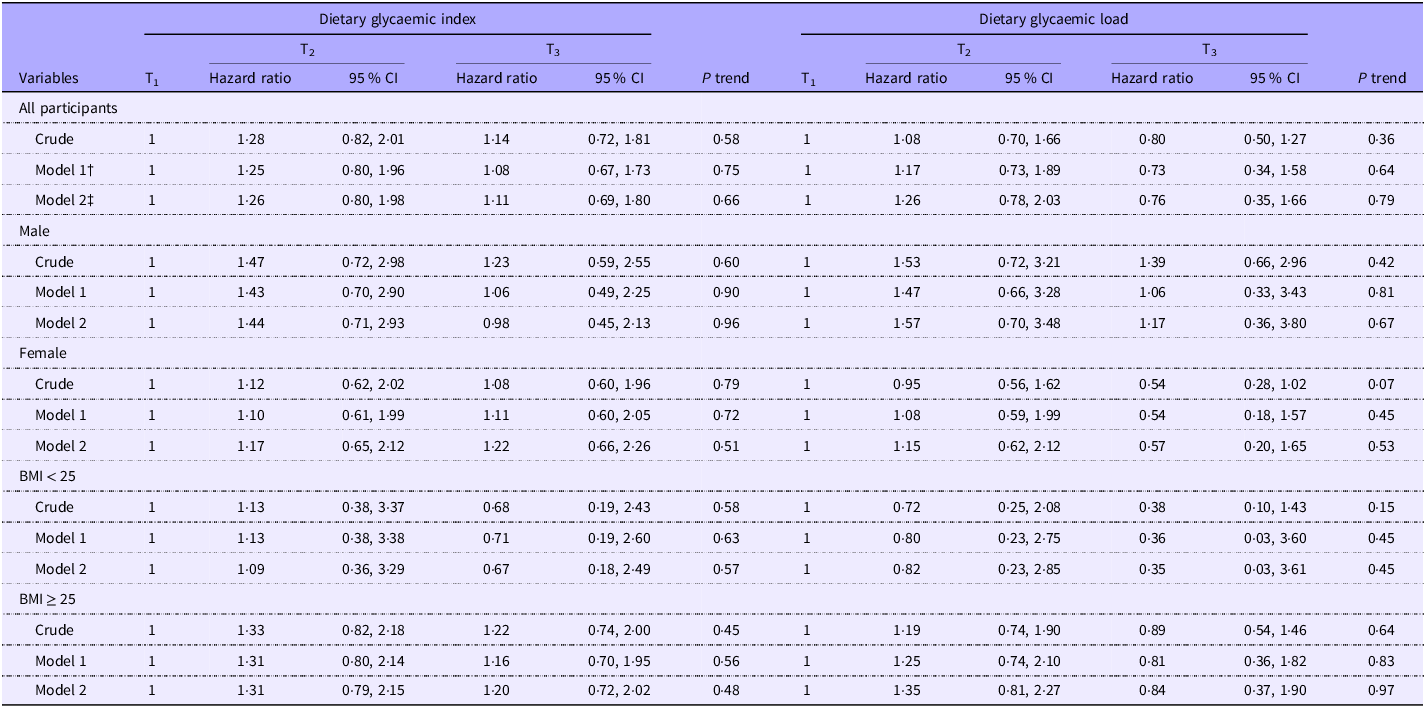
* Data are hazard ratio (95 % CI).
† Adjusted for age (category), sex and total energy.
‡ Adjusted for age (category), sex, total energy, BMI (category), marital status (category), physical activity (continuous), smoking status (category), education status (category), job status (category) and family history of diabetes (category).
In our stratified analysis by gender, a marginally significant (HR for T3 v. T1:0·54; 95 % CI: 0·28, 1·02, P = 0·07) inverse association between greater dietary GL and risk of T2DM before taking potential confounders into account among women; however, after considering covariates, this relationship weakened (HR for T3 v. T1:0·57; 95 % CI: 0·20, 1·65, P = 0·53).
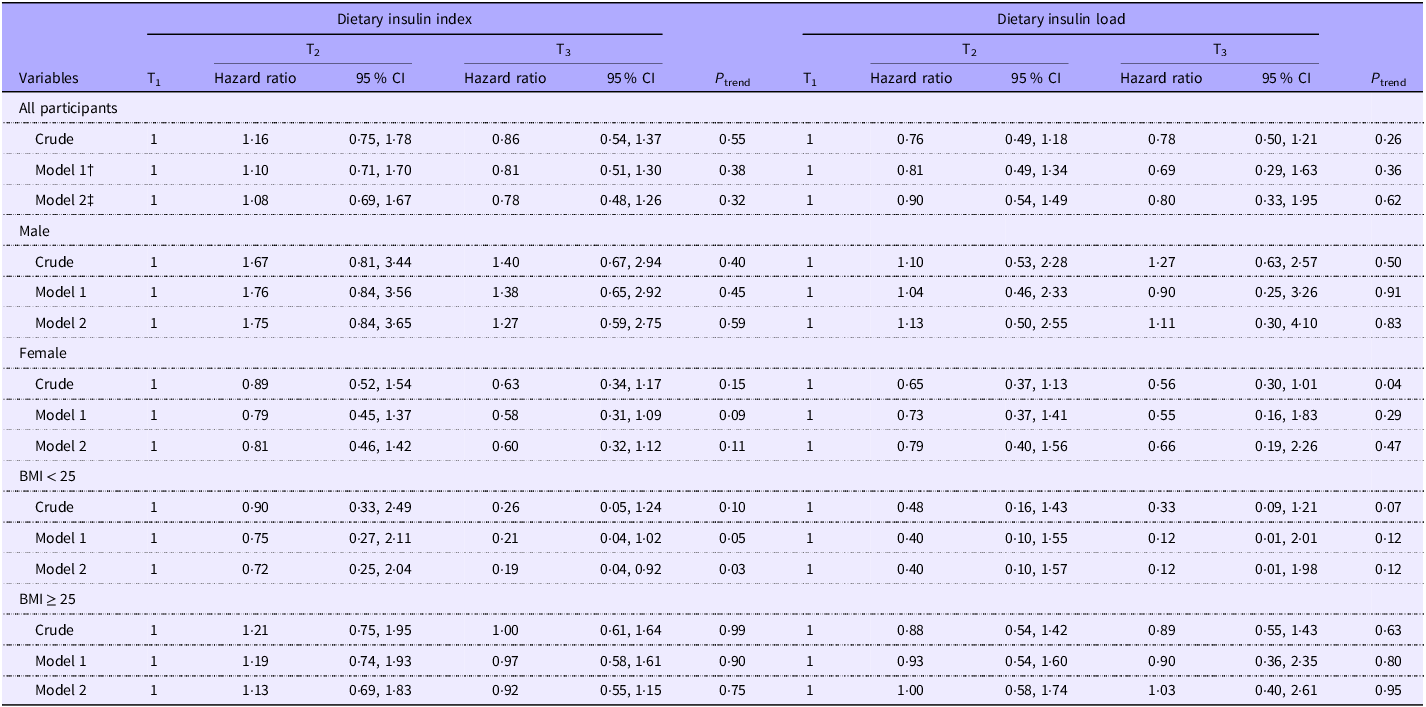
The association between DII and DIL and incidence of diabetes is indicated in Table 6. Examining across tertiles of DII, we observed a non-significant relationship between greater DII and risk of diabetes in the crude model (HR for T3 v. T1:0·86; 95 % CI: 0·54, 1·37, P = 0·55). When potential confounders were considered, this relationship remained non-significant as well (HR for T3 v. T1:0·78; 95 % CI: 0·48, 1·26, P = 0·32). This was also the case for DIL, such that no significant relationship was seen between greater DIL and risk of diabetes either before (HR for T3 v. T1:0·78; 95 % CI: 0·50, 1·21, P = 0·26) or after controlling for confounders (HR for T3 v. T1:0·80; 95 % CI: 0·33, 1·95, P = 0·62).
The likelihood for incidence of diabetes according to tertiles of insulin index and insulin load*
(Hazard ratio and 95 % confidence intervals)

* Data are hazard ratio (95 % CI).
† Adjusted for age (category), sex and total energy.
‡ Adjusted for age (category), sex, total energy, BMI (category), marital status (category), physical activity (continuous), smoking status (category), education status (category), job status (category) and family history of diabetes (category).
In our stratified analysis by gender, there was an inverse significant association between DIL and risk of diabetes comparing those in the top tertile v. individuals in the bottom tertile (HR for T3 v. T1 = 0·56; 95 % CI: 0·30, 1·01; P = 0·04) before taking potential confounders into account among women. However, this association disappeared in the fully adjusted model (HR for T3 v. T1:0·66; 95 % CI: 0·19, 2·26, P = 0·47). No such association was seen among men. Looking at subgroups of BMI status, we failed to find a significant relationship; however, a marginally significant inverse association was observed between DIL and risk of T2DM in the crude model (HR for T3 v. T1:0·33; 95 % CI: 0·09, 1·21, P = 0·07) that was disappeared after considering potential confounding factors (HR for T3 v. T1:0·12; 95 % CI: 0·01, 1·98 P = 0·12, Table 6).
Regarding subgroup analyses about DII, we failed to find any significant associations by subgroups of males or females. Examined across categories of BMI status, we observed that non-obese and overweight participants (BMI < 25 kg/m2) in the top tertile of DII had a lower risk of diabetes compared with those in the bottom tertile after considering potentially confounding factors (HR for T3 v. T1:0·19; 95 % CI: 0·04, 0·92; P = 0·03). There was no significant association between DII and risk of diabetes among overweight or obese individuals (Table 6).
Discussion
The present prospective study conducted in the Middle East region revealed no significant association between dietary GI/ dietary GL and risk of developing T2DM in a 5-year follow-up. No significant relationship was also seen between DII/DIL and risk of T2DM in this population; however, in the stratified analysis by BMI status, there was an inverse significant association between DII and risk of T2DM in non-obese and overweight participants (BMI < 25 kg/m2).
As we know, the rising global prevalence of diabetes has raised concerns about this problem(Reference Cho, Shaw and Karuranga38). Numerous studies have been performed on the effect of dietary components, especially carbohydrates, on diabetes(Reference Snorgaard, Poulsen and Andersen39). GI and GL as indices of carbohydrate quality have been at the centre of such studies. In the current study, we failed to find any significant association between dietary GI and GL and risk of developing T2D. This finding was in line with earlier studies. Sahyoun et al., in a 4-year follow-up of 1898 individuals, reached similar findings(Reference Sahyoun, Anderson and Tylavsky40). This was also reported by Simila et al. in a 12-year cohort study of 25 943 male smokers(Reference Similä, Valsta and Kontto41) and by Mosdøl et al. in a 13-year follow-up of 7321 subjects(Reference Mosdøl, Witte and Frost42). Additionally, Teymoori et al. found no significant association between dietary GI and the risk of T2DM in their prospective study(Reference Teymoori, Farhadnejad and Moslehi27). In contrast to our findings, some studies have shown that higher dietary GI and GL are associated with an increased risk of T2DM(Reference Bhupathiraju, Tobias and Malik14,Reference Livesey, Taylor and Livesey43,Reference Livesey, Taylor and Livesey44) . As several other cohort studies, we used the international table of GI developed by Foster-Powell et al.(Reference Foster-Powell, Holt and Brand-Miller12), while some studies used international tables developed by Atkinson et al.(Reference Atkinson, Foster-Powell and Brand-Miller45). This difference in the database might explain the discrepancies in study findings. In addition, for local foods, with different ingredients and processing methods than those available in the databases, researchers have to decide subjectively, which might be another reason for the different findings. Also, we noted variations in their methodology, particularly regarding how confounding variables were controlled. Some studies may have employed stringent controls that potentially led to over control of variables that could be mediators rather than confounders, potentially masking the true relationship between dietary GI/GL and T2DM risk. For example, studies utilising extensive adjustments for lifestyle factors – such as physical activity and socio-economic status – might inadvertently diminish the observed effects of dietary factors if these variables were indeed part of the causal pathway.
Due to the involvement of dietary insulinemic potential in the incidence of diabetes, we examined the association between DII and DIL and developing diabetes in this study and reached no significant findings. This finding was in accordance with the study of Teymoori et al.; however, when they considered these exposure variables as continuous, they reported a significant association between each sd increase in DII and DIL score and risk of T2DM(Reference Teymoori, Farhadnejad and Moslehi27). We are aware of no further study examining these indices with diabetes, but some investigations have been conducted on the association of these indices with insulin resistance(Reference Mirmiran, Esfandiari and Bahadoran46), obesity(Reference Anjom-Shoae, Keshteli and Sadeghi19), hyperglycaemia, dyslipidaemia and inflammatory markers(Reference Nimptsch, Brand-Miller and Franz47). Nimptsch et al. in a cross-sectional study failed to find any significant association between DII and DIL and fasting biomarkers of glycaemic control(Reference Nimptsch, Brand-Miller and Franz47). However, Mozaffari et al. observed higher FBS in older men with greater DIL in their cross-sectional study(Reference Mozaffari, Namazi and Larijani48). In a 3-year prospective study, participants with greater DII and DIL had a higher risk for insulin resistance(Reference Mirmiran, Esfandiari and Bahadoran46). The differences observed in these studies may be attributed to several factors. First, the methodological variations between the studies – such as sample size, demographic characteristics and data collection methods – could play a significant role. For instance, Nimptsch et al.’s study involved a broader population, which may have diluted the relationship between dietary insulin metrics and fasting biomarkers due to population heterogeneity. In contrast, Mozaffari et al. focused on older men, whose metabolic responses may differ significantly, thereby revealing a clearer association with fasting blood sugar levels. Additionally, the timing of dietary assessments in relation to biomarker measurement could differ across studies. Cross-sectional studies capture only a snapshot of data, making it challenging to infer causal relationships, whereas the prospective design used in the study that reported higher insulin resistance risk allows for tracking changes over time, potentially leading to more robust findings. Furthermore, individual variability in metabolism, activity levels and underlying health conditions may influence how different populations respond to dietary insulin, contributing to these conflicting results. Very limited studies have been conducted on the relationship between DII and DIL and the incidence of diabetes. Given the importance of insulin in the incidence of diabetes, it seems that the application of these indices to predict the risk of diabetes might open a new area in the research field to prevent diabetes.
Contrary to expectations, no significant relationship was observed between glycaemic and insulin indices and the incidence of diabetes, and the following possible mechanisms may explain these findings. The findings of the present study revealed that participants with higher dietary GI and DII had a significantly higher intake of diabetes-protecting food groups such as whole grains(Reference Aune, Norat and Romundstad49) and lower consumption of diabetes-threatening food groups such as red meat(Reference Zhang, Fu and Moore50). In addition, subjects with higher dietary GL and DIL consumed significantly higher anti-diabetic micronutrients such as Ca(Reference Hajhashemy, Rouhani and Saneei51), as well as diabetic protective food groups such as fruits(Reference Li, Miao and Huang52). Although mechanisms such as elevated blood glucose and blood insulin levels and the consequent exhaustion and failure of pancreatic beta cells(Reference Pawlak, Kushner and Ludwig53) after consuming diets with high glycaemic and insulin indices conflict with these mechanisms, this contradiction can explain that glycaemic and insulin indicators alone are not good predictors of diabetes, but should be considered along with the consumption of nutrients and food groups effective in the development of diabetes. Also, the significant inverse relationship observed between DII and the incidence of diabetes in the subgroup of individuals with normal BMI in the present study can be a misinterpretation that occurred due to the very limited number of diabetic cases in this subgroup or observed by chance, and we found no logical reasoning to support it.
Our finding revealed that people consuming higher GL foods were more commonly male, educated, physically active, and unmarried. It is plausible that individuals within these demographics consume higher GL foods such as sports drinks and energy bars as part of their athletic routines. As such, the context of consumption – namely, surrounding physical activity – may contribute to the higher GL intake observed in this population. While we made efforts to control for physical activity levels in our analysis, the specific nature and timing of food intake related to sports may indeed influence overall dietary patterns and health outcomes in ways we could not fully capture. This highlights a potential gap in our methodology, suggesting that future studies should consider the contexts of dietary consumption, particularly in relation to sports participation and exercise recovery.
The current study has several strengths like prospective setting, large sample size and considering several possible confounders. BMI and sex-stratified analysis was done. Using valid FFQ and physical activity questionnaires is other strength of this study. The attrition rate of participants during the follow-up period was about 17 %, which is much lower than the usual attrition rate in these studies(Reference Gustavson, von Soest and Karevold54). However, this investigation had several limitations. One of the main limitations of this study was its short follow-up period, which led to a low number of new cases of diabetes. Due to the incompleteness of Iranian data, we used international data to calculate glycaemic and insulinemic indices, which may have caused measurement errors. Moreover, although more important covariates have been controlled in the current study, some potential confounders might remain unadjusted because of unmeasured factors. In this study, we excluded participants with self-imposed dietary restrictions because these participants might have underlying diseases and including them in the analyses would bias the associations. Additionally, it would be better to use the haemoglubin A1c test for confirming T2DM; however, due to the high cost of this test and the limited financial resources, we were unable to conduct this test for all participants. In our analysis, we made adjustments for energy intake, physical activity and BMI; however, we acknowledge that this approach may not fully capture the complexity of how different foods interact with satiety, energy balance and physical activity levels, particularly concerning carbohydrate-rich foods. The research indicates that foods with varying glycaemic indices can influence appetite and overall energetic consumption differently(Reference Ludwig, Majzoub and Al-Zahrani55). Also, high-glycaemic foods, such as refined carbohydrates, have been shown to cause rapid fluctuations in blood sugar levels, which can lead to feelings of lethargy and decreased motivation for physical activity(Reference Breymeyer, Lampe and McGregor56). For instance, high-glycaemic foods, like white bread, can lead to rapid increases in blood sugar, which may encourage subsequent overeating. Conversely, lower-glycaemic foods such as berries are more satiating per calorie. This difference in satiety could naturally moderate energy intake, highlighting that controlling exclusively for total energy intake may obscure important relationships within our data. Moreover, the palatability and energy density of certain foods play significant roles in dietary behaviour. Foods that are more palatable tend to be consumed in larger quantities, which can inadvertently lead to higher energetic intake and subsequent weight gain – a concerning factor in the context of T2D.
In conclusion, we found no significant association between dietary GI, dietary GL, DII and DIL with the risk of T2DM. However, choosing these indicators to evaluate the quality of dietary carbohydrates and examine their relationship with chronic diseases in future studies can be useful. More research, particularly with longer follow-up duration, is needed to confirm these findings.
Acknowledgements
The authors would like to thank the participants of the YaHS-TAMYZ cohort study and the authorities of Tehran University of Medical Sciences and Shahid Sadoughi University of Medical Sciences for their excellent cooperation. The authors also thank the Research Development Center of Shahid Sadoughi Hospital, Shahid Sadoughi University of Medical Sciences, for their close collaboration and scientific input.
The present study was funded by Tehran University of Medical Sciences. YaHS was funded by Shahid Sadoughi University of Medical Sciences.
A. N. established TAMYZ, Ma. M. established YaHS, P. S., A. E. and A. S-A. conceived and designed the study, P. S. and A. S-A. performed the statistical analysis and data interpretation. P. S. drafted the manuscript. A. E., A. S-A. and Ma. M. critically reviewed the manuscript. All authors read and approved the final version of the manuscript.
The authors declared that they have no conflict of interest.
YaHS-TAMYZ study was approved by the research Council of Shahid Sadoughi University of Medical Sciences and the Ethics Committee of Shahid Sadoughi University of Medical Sciences No. 17/1/73941. All methods were performed in accordance with the relevant guidelines and regulations by research Council of Shahid Sadoughi University of Medical Sciences. The current study was also approved by the ethics committee of Tehran University of Medical Sciences’ ethics committee. All participants in the YaHS-TAMYZ study signed informed consent. Moreover, although the YaHS-TAMYZ study has an ethics code, for this study, an ethics code was obtained separately from the Tehran University of Medical Sciences ethics committee (approval code: IR.TUMS.MEDICINE.REC.1400.226).