

Introduction
Minimum wages (MW) are commonly framed as a tool to reduce inequality. Most cross-national evidence on its effects, however, focuses on individual wages, whereas well-being is ultimately achieved by pooling resources at the household. Furthermore, a narrow focus on wage earners may miss broader adjustments: it ignores workers who may lose their jobs, overlooks how resulting unemployment may activate tax-and-transfer compensation, and fails to capture how the cost shock to firms can reallocate income between labour and capital. Because these channels do not necessarily align, focusing solely on wages obscures the range of this policy’s impact. However, cross-national evidence on the effect of MW on household inequality remains scarce, even in high-income settings (Dantas Reference Dantas2025), and is largely absent for middle- and low-income economies.
This article addresses the gap through the lens of predistribution. Popularised by Hacker (Reference Hacker2011), predistribution encompasses policies that shape the distribution of market income before taxes and transfers. By shifting part of the equality task to the rules that govern wage setting and market income distribution, predistribution offers a potential path to lower inequality with lower fiscal costs and less political backlash, a key consideration for governments facing the constraints of austerity, limited fiscal space, and globalisation (Bogliaccini Reference Bogliaccini2024). However, because the term can easily sprawl into a ‘catch-all’ (Hacker 2011) that ranges from labour market regulations and social investment policies to tools of corporate governance (Chwalisz and Diamond Reference Chwalisz and Diamond2015), I focus on what Gregg (Reference Gregg, Chwalisz and Diamond2015) identifies as ‘the most obvious’ predistributive tool – MW increases.
The predistributive framework situates this article’s central question: whether higher MW are associated with lower household-income inequality across Latin America, and whether that association appears in market income, disposable income, or both. Its main contribution is to examine and understand whether the empirical pattern is consistent with a predistributive channel in the revealing setting of Latin America, a region plagued by high informality, entrenched inequality, uneven enforcement, and the pervasive indexation of social benefits to the MW. Furthermore, substantial MW variation in the region provides leverage to analyse the inequality-reducing effects of this policy lever.
I measure MW with three complementary indicators from two different sources. These distinctions explore whether inequality falls due to wage compression (a high relative floor) or a reallocation of factor shares (a high absolute floor). Empirically, I employ two-way fixed-effects (TWFE) models with lagged policy variables and standard macroeconomic controls. To ensure robustness, I triangulate results across three inequality databases and rely on several alternative specifications, alternative versions of key controls, and additional institutional controls. The core finding is consistent across specifications: a higher MW is associated with lower household income inequality at both the market- and disposable-income stages.
The article offers three contributions to the literature on labour-market policies. Conceptually, it introduces a predistribution framework to the debate on the relationship of labour market institutions to inequality, probing whether MW reduces inequality by reshaping income at the household level and in market income. Substantively, it provides systematic, region-wide evidence for Latin America, offering insights applicable to other developing regions grappling with informality and fiscal constraints. Methodologically, it suggests a strategy for measuring policy impact in contexts with imperfect data through source triangulation and complementary tools of inference.
However, this article does not claim to isolate a uniquely predistributive mechanism. Its empirical strategy relies on comparing the association between minimum-wage policy and inequality at two stages of the income distribution. That comparison is informative because a parallel association with lower market-income inequality indicates compression before taxes and transfers are applied, which is a necessary pattern for a predistributive interpretation. By the same logic, the predistributive interpretation would be substantially weakened if the association appeared only for disposable income and not for market income. At the same time, this evidence is not sufficient on its own to disentangle predistribution from redistribution, indexation, or other downstream channels that may also shape disposable-income outcomes. The contribution of the article is therefore to document a consistent household-level pattern consistent with a predistributive channel, while remaining agnostic about the precise combination of mechanisms through which minimum-wage policy shapes disposable-income inequality.
Minimum wages and inequality: distributional channels and expected relationships
Defined by the International Labour Organization (ILO) as the lowest remuneration an employer must pay to wage earners (Belser and Rani Reference Belser, Rani and Berg2015), the MW was first developed in Australia and New Zealand in the nineteenth century, and is a near-universal policy instrument today (Belser and Rani Reference Belser, Rani and Berg2015). The literature on the effects of MW is considerable, with most research directed at its effects on employment. Because job loss or reallocation is a key channel mediating the influence of MW and inequality, I will briefly summarise this literature. The traditional neoclassical perspective postulates that a binding MW raises labour costs and reduces employment through layoffs, the substitution of lower-skill workers, of labour for capital, or a combination (Belser and Rani Reference Belser, Rani and Berg2015). In developing countries, high informality can compound potentially adverse effects by pushing low-skill formal workers into self-employment or informal jobs (Gindling and Ronconi Reference Gindling and Ronconi2025).
This over-stylised framework was unsettled by Card and Krueger´s (Reference Card and Krueger1994) seminal study, which found no employment losses from an MW hike in the fast-food industry in the United States. Subsequent work continued questioning the assumptions of perfect competition and frictionless adjustment from the neoclassical model. In less-than-perfectly competitive labour markets, later research argued, where firms possess monopsony power or face recruitment frictions, MW hikes do not necessarily lead to layoffs as firms can adjust along other margins: profits, prices, or productivity. Moreover, the demand-side boost from raising pay at the bottom can offset part of the cost increase if higher earnings translate into greater local spending (Belser and Rani Reference Belser, Rani and Berg2015). These insights indicate that MW hikes yield a wider set of theoretically plausible outcomes depending on how binding the floor is, who is covered, and how firms and workers adjust.
Consensus on the relationship between MW and employment remains elusive. Some recent literature reviews have noted that negative employment effects are more likely and larger when the MW is clearly binding and well enforced, in the formal sector, and in samples centred on vulnerable, lower-wage workers (Neumark and Munguía Corella Reference Neumark and Munguía Corella2021). By contrast, Belser and Rani (Reference Belser, Rani and Berg2015) argue that, currently, the prevailing perspective among researchers is that MW have, at most, second-order impacts on unemployment. Such conflicting accounts suggest potential heterogeneous effects determined by coverage, enforcement, sector, and position in the wage distribution. Even where aggregate employment effects are limited, adjustment can occur along other margins: hours, transitions between formal and informal jobs, and changes in wage-setting. Importantly, these mechanisms suggest that findings focused on employment do not represent the full potential distributional consequences of MW.
Research concerning MW and inequality specifically is less extensive (Cámara et al Reference Cámara, Cárdenas and Rial2024). Two competing mechanisms dominate the discussion. On one hand, it is argued that a binding floor raises pay at the bottom and compresses dispersion; on the other, that if it functions as a price floor above the market-clearing wage, unemployment or reduced hours among low-wage workers can offset equalising gains (Berg Reference Berg2015; Cámara et al Reference Cámara, Cárdenas and Rial2024; Neumark and Munguía Corella Reference Neumark and Munguía Corella2021). Sectoral context and coverage plausibly shape which mechanism prevails. Among compliant formal employers, wage floors typically compress lower-tail wages; some of the apparent compression, however, may reflect censoring if the lowest-paid formal jobs disappear from the distribution. When all wage earners are considered, dispersion can widen initially if compliant firms raise pay while sub-MW in uncovered or weakly enforced segments do not, unless compliance improves or social norms generate ‘lighthouse’ spillovers that lift sub-minimum pay (Gindling and Ronconi Reference Gindling and Ronconi2025). In addition, higher statutory floors can raise the relative cost of employing low-skill workers, encouraging substitution toward more skilled workers or capital goods (Cámara et al Reference Cámara, Cárdenas and Rial2024). When the self-employed are included, a further reallocation margin opens between formal jobs, sub-minimum employment, and own-account work, making the net effect on wage dispersion empirically ambiguous (Gindling and Ronconi Reference Gindling and Ronconi2025).
In rich democracies, wage-inequality reducing effects have been found for Canada (Brochu et al Reference Brochu, Green, Lemieux and Townsend2025), the OECD (Koeniger et al Reference Koeniger, Leonardi and Nunziata2007) and the United Kingdom (Butcher et al Reference Butcher, Dickens and Manning2012). This evidence motivates the question of how MW increases might affect the distribution of household income, rather than individual wages. As mentioned, distribution is ultimately realised at the household, and household income inequality differs from earnings inequality in several ways. First, household resources pool across members so that an MW change that compresses individual wages does not necessarily translate proportionally at the household level (Gindling and Ronconi Reference Gindling and Ronconi2025). Compositional shifts in employment status within families (e.g. one worker exiting formality or moving to part-time while another gains hours) can similarly mute, offset, or even reverse individual-level compression.
Secondly, household income includes both labour and non-labour components. This wider level of income thus captures how minimum-wage policy can affect the functional distribution of income, shifting shares between labour and capital and thereby altering household totals (Gindling and Ronconi Reference Gindling and Ronconi2025). A binding floor can tilt the split toward labour if firms cannot fully pass through higher costs, compressing profits and capital income (which are more concentrated than labour income) and potentially lowering overall inequality. But firms may also adjust via prices, productivity, or margins, so the sign and size of this channel are ultimately undetermined empirically.
Thirdly, as mentioned before, constraints associated with globalisation, tax competition, and high public indebtedness limit the room for after-tax redistribution (Ochando Claramunt Reference Ochando Claramunt2020). MW policy operates primarily on market (pre-tax/public transfer) household income, making it a relevant predistributive lever (Cámara et al Reference Cámara, Cárdenas and Rial2024; Ochando Claramunt Reference Ochando Claramunt2020). Evaluating its consequences, therefore, requires analysing both market and disposable household income inequality – and asking whether any association appears before taxes and transfers, after them, or both. Lastly, the relation between MW changes and fiscal policy can push disposable income in directions that diverge from market income. If unemployment rises, benefit claims can increase, altering post-transfer resources (Checchi and García-Peñalosa Reference Checchi and García-Peñalosa2008). In addition, many taxes and transfers are directly or indirectly indexed to the minimum wage; this was the case in Mexico before 2016 and in Uruguay before 2004, to mention some regional examples. Indexation can amplify or offset market-side changes, so disposable inequality may move differently from market inequality. Finally, focusing on wage distributions alone omits workers with zero earnings, obscures non-labour income responses, and misses the capital-income margin. To capture a more thorough pathway (from wage compression and sectoral reallocation to fiscal indexation and transfer responses), household income inequality analysis is needed.
In high-income economies, only a handful of single-country studies have examined the relation of the MW and household-level inequality, including Wu et al (Reference Wu, Perloff and Golan2006) for the United States and Atkinson et al (Reference Atkinson, Leventi, Nolan, Sutherland and Tasseva2017) for the United Kingdom. These studies highlight that the sign and size of household-level effects can diverge from wage-distribution results, depending on labour-market adjustment and fiscal linkages. Cross-national evidence at the household level is even more sparse. Checchi and García-Peñalosa (Reference Checchi and García-Peñalosa2008) examine OECD countries and find no direct effect of the MW across different measures of inequality. In a follow-up from 1960 to 2000, Checchi and García-Peñalosa (Reference Checchi and García-Peñalosa2010) focus on personal/household Gini and report that a higher minimum-to-median ratio is associated with higher overall income inequality. However, Filauro et al (Reference Filauro, Grunberger and Narazani2023) estimate the impact on equivalised household inequality (primarily disposable-income Gini) and report the opposite: moving to 60% of the national average reduces the EU-level disposable-income Gini by roughly 0.75. Broadening to a larger, recent OECD panel (2001–2021), Dantas (Reference Dantas2025) finds a non-linear relationship with household income inequality and poverty: inequality falls at low levels of the MW, but the gains diminish – even reverse – beyond tipping points. Outside rich democracies, Nae et al (Reference Nae, Florescu and Bălășoiu2024) find that a higher MW is associated with lower household income inequality in post-communist Central and Eastern Europe.
In Latin America, segmented labour markets sharpen the ambiguous potential effects. MW hikes can compress individual wages within the formal sector yet widen gaps between formal and informal workers. If monopsonistic conditions prevail (a feature documented in several countries in the region), firms may absorb part of the cost increase, limiting employment losses and softening wage and employment trade-offs (Maurizio and Vázquez Reference Maurizio and Vázquez2016); Neumark and Munguía Corella Reference Neumark and Munguía Corella2021). If ‘lighthouse’ effects operate, spillovers to uncovered or informal workers can lift sub-minimum pay, reducing both within-formal and between-sector wage inequality (Neumark and Munguía Corella Reference Neumark and Munguía Corella2021). And because collective bargaining is unevenly developed, MW consultations can become the de facto forum for wage setting, turning the floor into a broader benchmark rather than a narrow legal minimum (Saget Reference Saget2008).
Country studies, which dominate the regional evidence, point to heterogeneous outcomes (Neumark et al Reference Neumark, Cunningham and Siga2006; Sotomayor Reference Sotomayor2021 for Brazil, Arango-Arango et al Reference Arango-Arango, Pachón and Carlos2004 and Maloney and Mendez Reference Maloney and Mendez2003 for Colombia, Borraz and González Reference Borraz and González2009 for Uruguay). Comparative evidence, however, is limited. The ILO’s Global Wage Report 2020–21 offers descriptive cross-country snapshots indicating that MW earners often sit in the middle–upper half of the household-income distribution in Guatemala, Ecuador, Bolivia, and Chile, but not in Uruguay; meanwhile, sub-minimum earners and the self-employed cluster toward the bottom (Gindling and Ronconi Reference Gindling and Ronconi2025). Two recent cross-national articles examining individual wage inequality conclude firstly, that MW hikes reduce wage inequality in Argentina, Brazil, and Uruguay, but not in Chile (Maurizio and Vázquez Reference Maurizio and Vázquez2016) and, secondly, that MW increases produce gains at the bottom of the formal employee distribution and have a net equalising effect in Argentina, Brazil, Chile, Colombia, Mexico and Peru (Lombardo et al Reference Lombardo, Ramírez Leira and Gasparini2024).
In sum, the Latin American evidence is heterogeneous: MW increases seem to raise formal-sector pay and compress the lower tail of individual wages, yet household-level inequality results vary across countries, while evidence at this level remains thin. To date, no region-wide study exists for Latin America to the best of my knowledge, and the region’s high informality, uneven enforcement, and frequent statutory adjustments provide unusually strong leverage to test whether MW affect market (pre-tax/ public transfer) and disposable (post-tax/public transfer) household-income inequality.
Data sources and variable construction
I measure market and disposable household income inequality primarily with the Gini coefficient, the paper’s main dependent variable. The Gini is widely reported and can be constructed in a comparatively harmonised way across the different sources, which makes it the most suitable common benchmark for the analysis. At the same time, the Gini coefficient does not identify where in the distribution compression occurs, and different distributional changes can generate similar movements in the coefficient. This limitation is relevant because the most direct incidence of minimum-wage increases should be concentrated toward the lower part of the income distribution, potentially with spillovers into the lower-middle, while adjustment margins – employment, hours, and shifts between formal and informal work – may offset or redistribute these gains. To probe this issue more directly, I also use a supplementary percentile-ratio measure for disposable-income inequality: the 90th to 10th income percentile ratio for equivalised household income, sourced from SEDLAC. This alternative indicator is more sensitive to distributional spread between the upper and lower parts of the disposable-income distribution. However, comparable percentile-ratio series are not available for market-income inequality. For that reason, the Gini remains the main outcome measure and the common benchmark across datasets, while the percentile ratio is used as a targeted robustness check for disposable-income inequality rather than as a full alternative measurement framework.
To keep the dependent variable comparable across the core analysis, the main results draw on the Standardised World Income Inequality Database (SWIID) for both disposable- and market-income inequality (Solt Reference Solt2020). I then triangulate outcomes with two survey-based sources that privilege internal consistency: the Socio-Economic Database for Latin America and the Caribbean (SEDLAC), produced by CEDLAS and the World Bank (WB) and the Luxembourg Income Study (LIS) data, which provides harmonised microdata that allow the construction of both disposable- and market-income inequality for a smaller set of Latin American country–years.
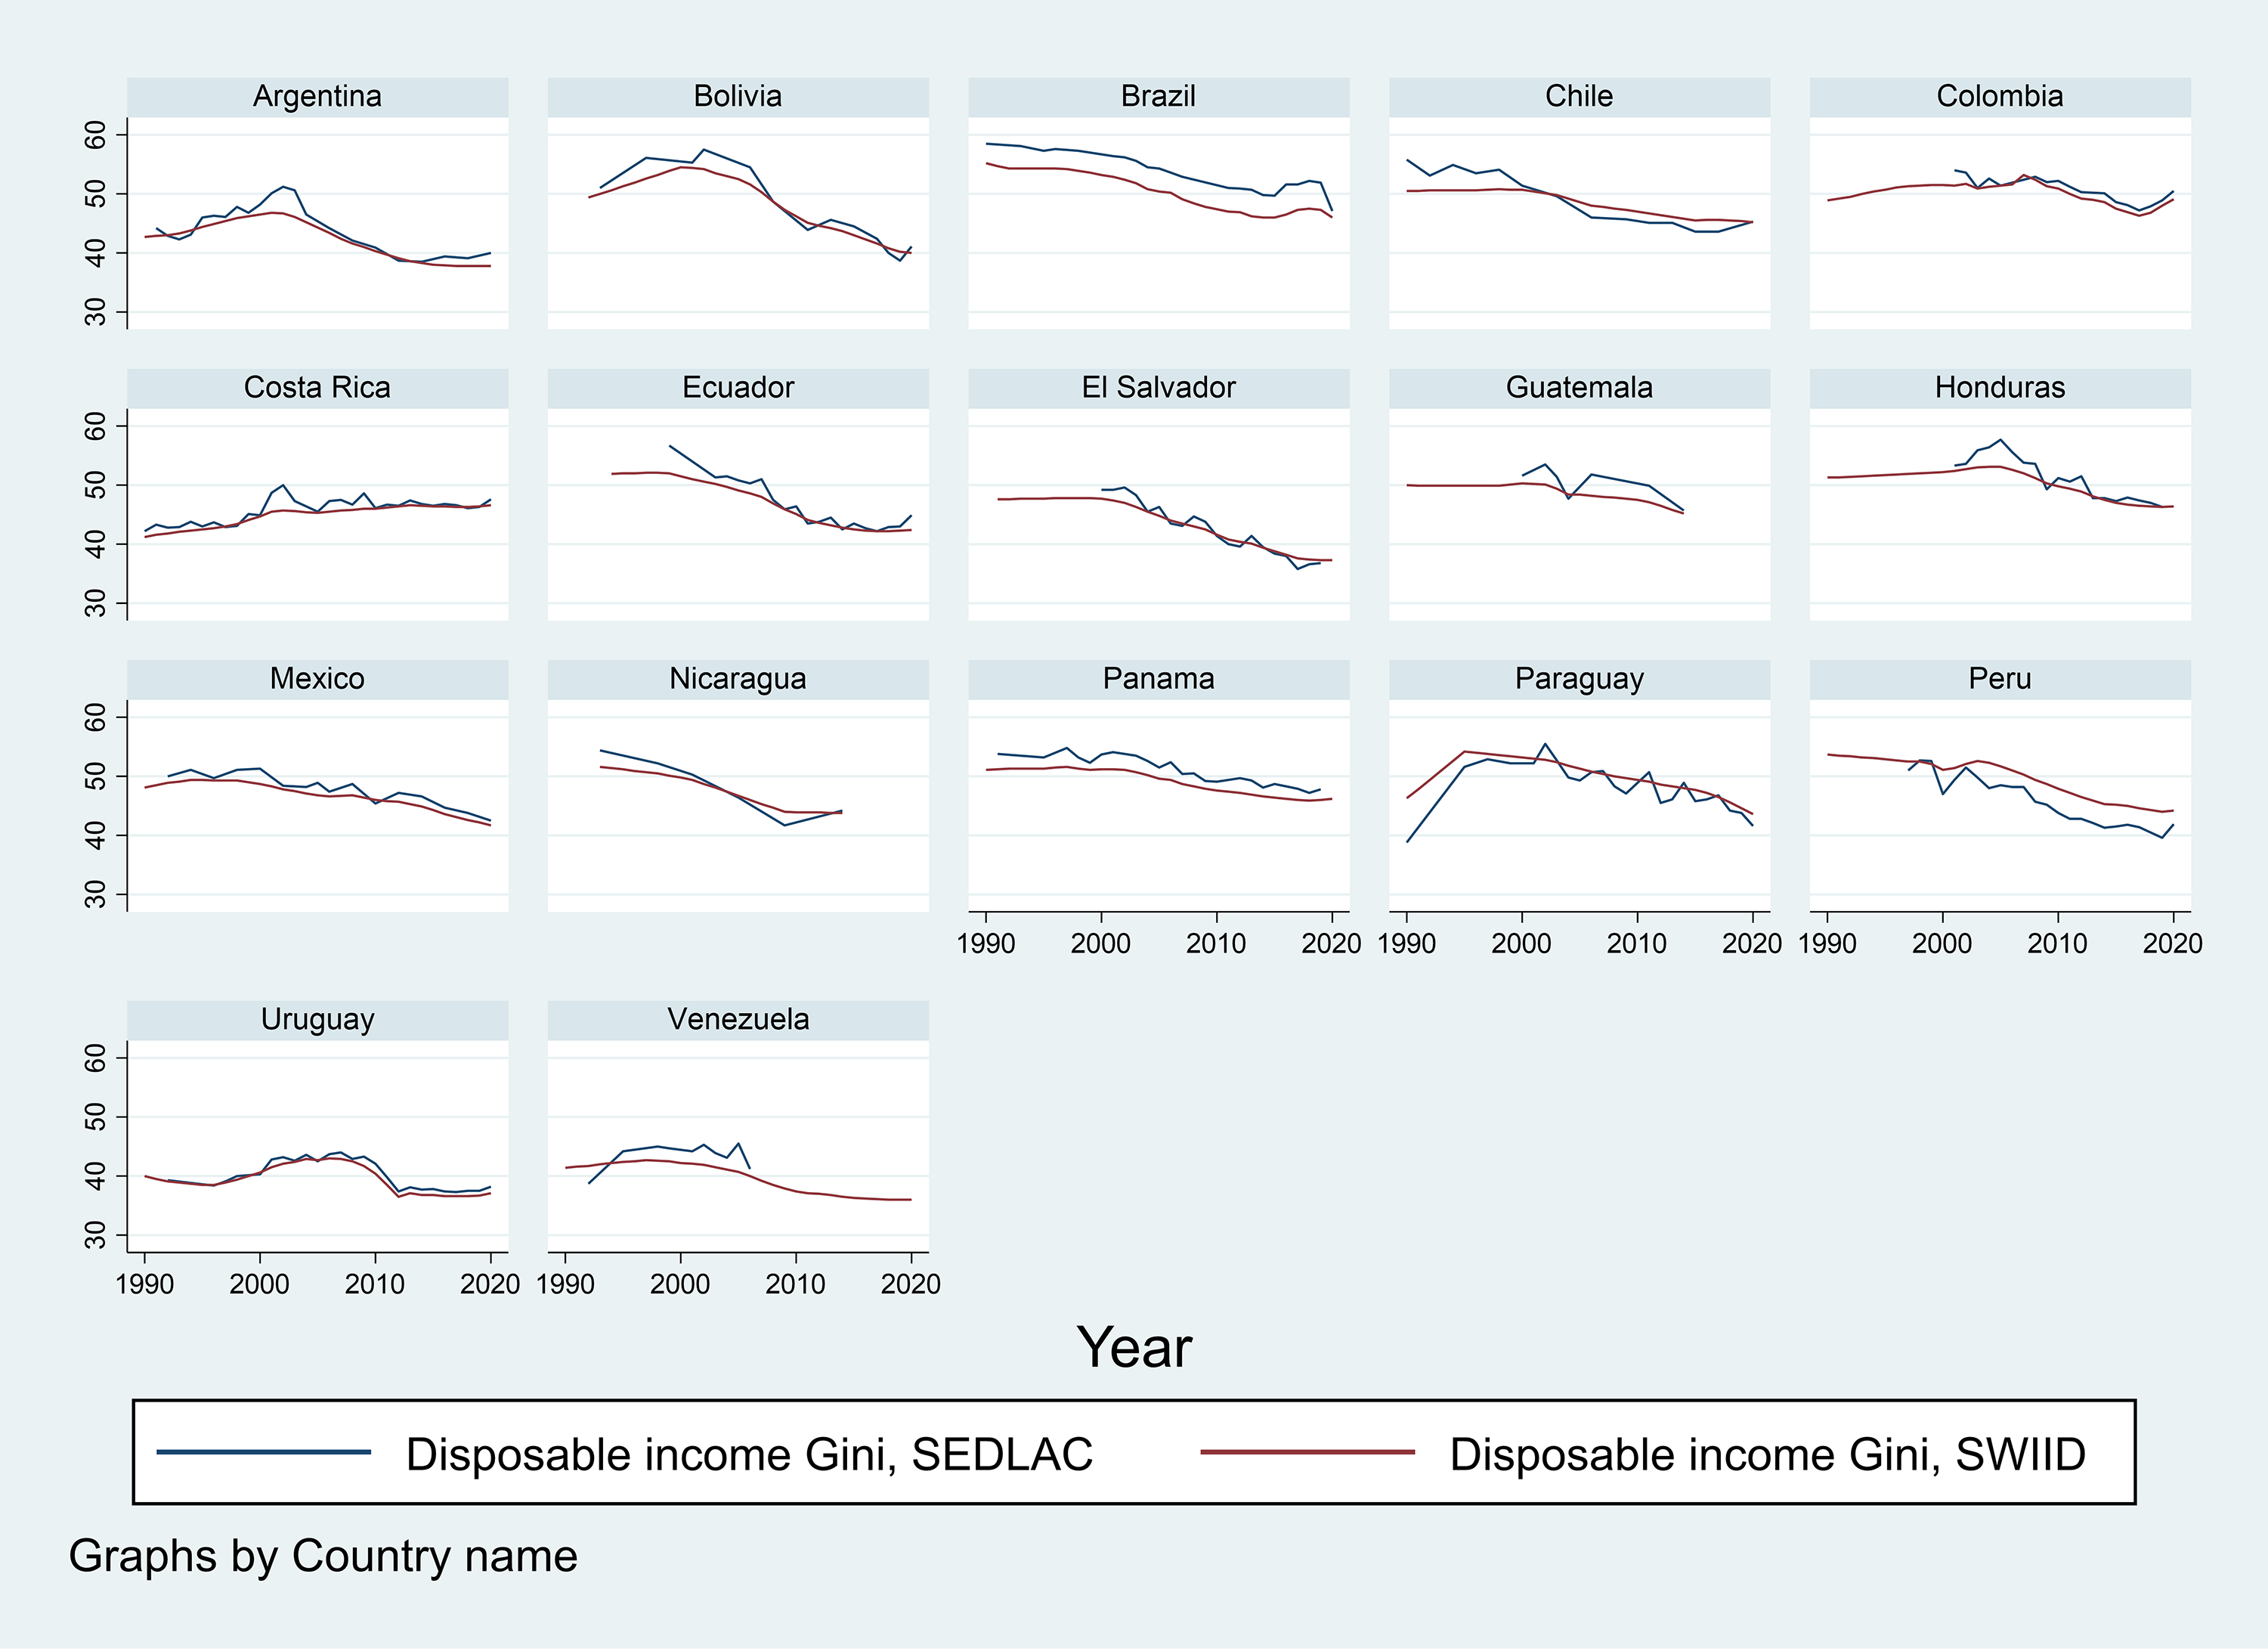
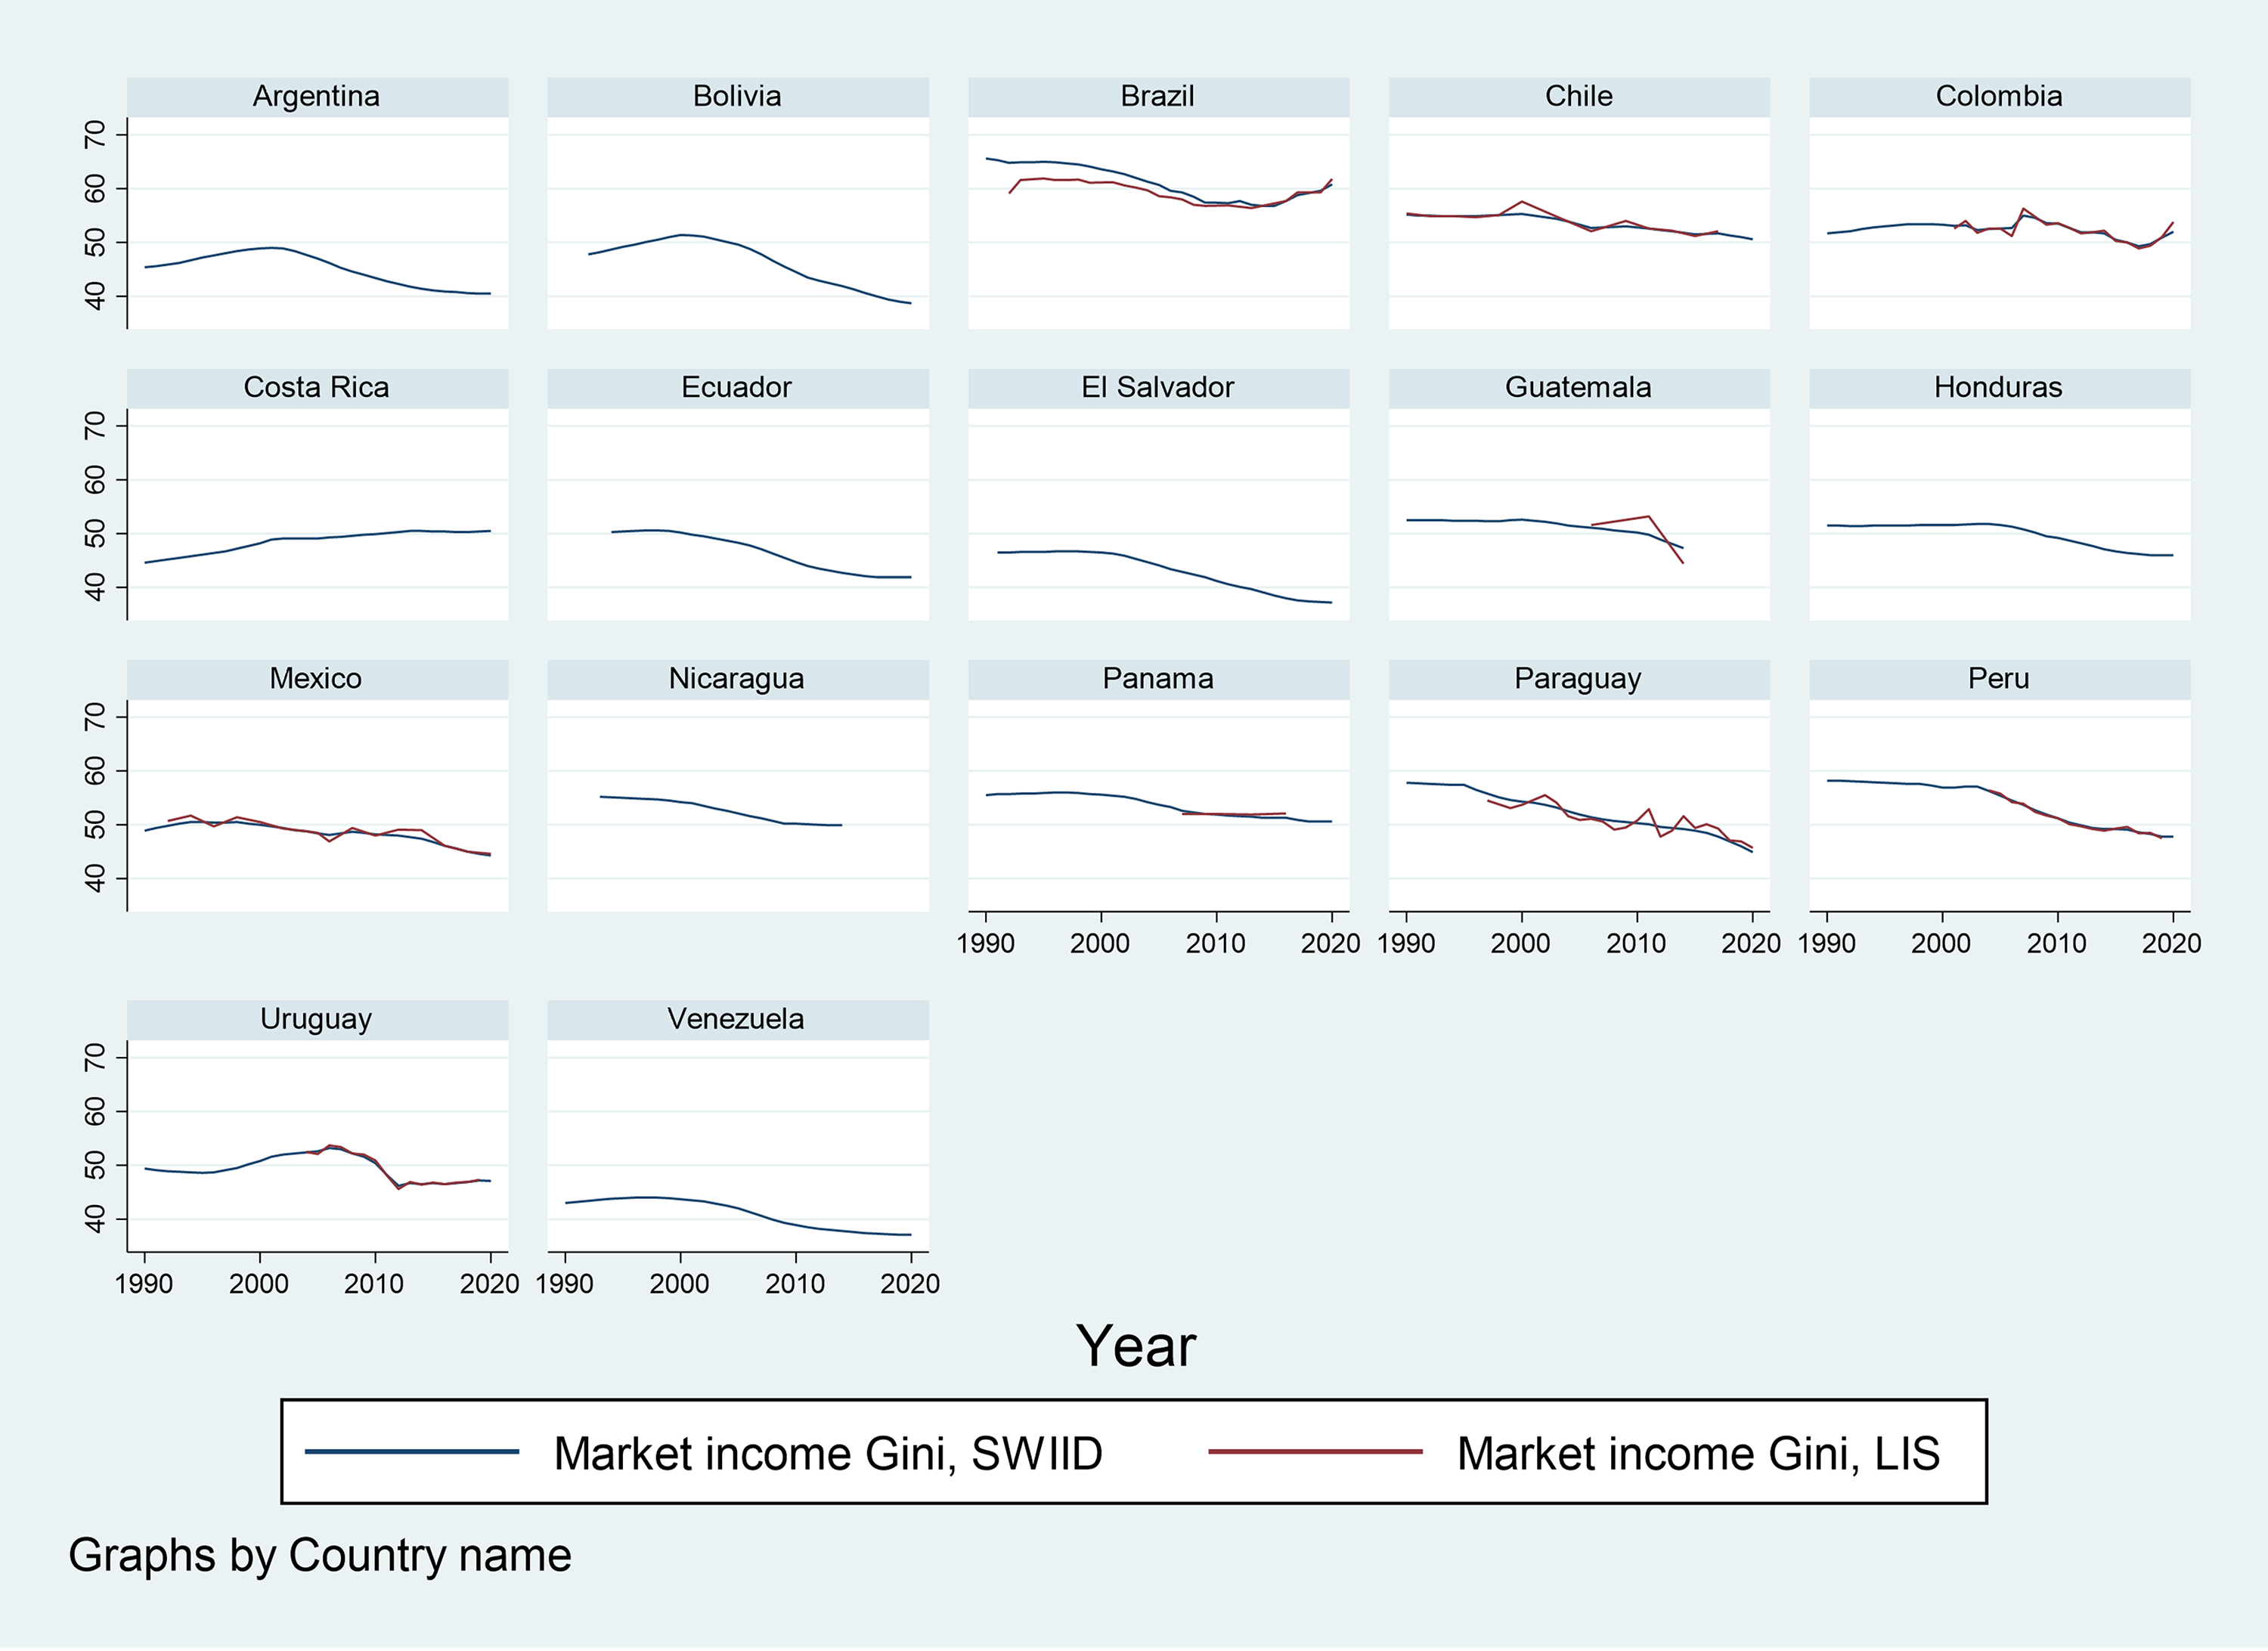
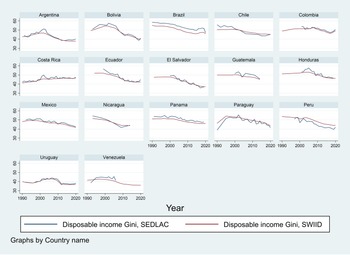
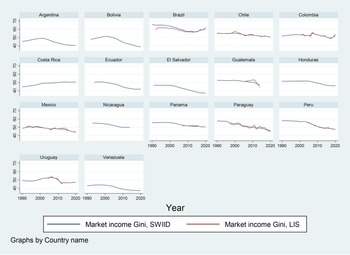
Despite their differences, SWIID and SEDLAC are closely aligned for disposable-income inequality, and SWIID and LIS track each other closely for market-income inequality in the overlapping country–years (Figures 1 and 2). Regardless, I maintain a multi-source strategy because underlying differences in survey design, coverage, and construction procedures can still affect comparability. Specifically, SWIID’s multiple-imputation procedure can smooth year-to-year movements where underlying surveys are sparse, and this smoothing would tend to attenuate coefficients toward zero relative to survey-based series that preserve more high-frequency variation. Second, survey-based sources are not free of comparability issues: cross-country survey instruments and sampling frames in the SEDLAC data can induce differences in measured inequality levels and volatility. Third, coverage differs substantially across sources; in particular, LIS covers fewer countries and years, so differences in coefficient magnitude may also reflect sample composition.
Disposable household income inequality (Gini) in Latin America 1990–2020.
Source: The author with data from SEDLAC and SWIID.
Market household income inequality (Gini) in Latin America 1990–2020.
Source: The author with data from LIS and SWIID.
Given these properties, different datasets are more informative for different components of the argument. SWIID is most informative for identification and precision in TWFE because it supports a near-balanced country–year grid for both disposable- and market-income inequality. SEDLAC is most informative for establishing that the core association for disposable-income inequality is visible in directly observed, regionally harmonised household survey data. LIS is most informative for the paper’s market-versus-disposable comparison because it allows both outcomes to be constructed from harmonised microdata using a common set of definitions, providing the clearest basis for assessing whether the association appears similarly across the two income concepts. For identification, I therefore use SWIID as the baseline – because its near-balanced panel allows fully populated TWFE models – while re-estimating the core specifications on SEDLAC (for disposable-income inequality) and on LIS (for market-income inequality, and for the market–disposable comparison) to assess whether the direction and broad magnitude of the MW association are robust to alternative, survey-based outcome measures. Disposable-income inequality from the preferred data source (SWIID) averages 46.83 Gini points and ranges from 36 (Venezuela 2020) to 55 (Brazil 1990). The median is 47.3 (Chile 2009). Market-income inequality averages 49.92 Gini points and ranges from 37.1 (Venezuela 2020) to 65.6 (Brazil 1990). Median value for market income inequality is 50.3 Gini points (Costa Rica 2018).
However, in addition to the results from separate samples, I also re-estimate the core models on common overlapping samples across datasets. Specifically, for disposable-income inequality, I restrict the analysis to the country-years jointly observed in SWIID and SEDLAC, and for market-income inequality to those jointly observed in SWIID and LIS. This allows a more systematic comparison of source differences by holding coverage constant, so that any remaining divergence in the estimated minimum-wage association is less likely to be an artefact of unequal country-year samples and more plausibly attributable to differences in source construction and measurement.
The key policy regressor is the wage ratio, defined as the statutory MW divided by the average wage, both expressed in purchasing-power-parity (PPP) terms using the ILO series. This measure is substantively useful because it captures the minimum wage relative to typical earnings and therefore approximates how binding the wage floor is within the broader wage structure. At the same time, because average wages enter the denominator, the regressor may also move with broader wage developments, including some that are themselves influenced by minimum-wage policy. If minimum-wage increases also raise average wages, that feedback would mechanically dampen growth in the ratio and therefore work against finding a large negative coefficient on the ratio measure. To assess whether the core pattern is driven only by this denominator construction, I also estimate models using the minimum wage in PPP levels, which removes the average-wage denominator entirely, as well as an alternative wage-ratio series from the United Nations´ Economic Commission for Latin America and the Caribbean (ECLAC). The wage-ratio from the main operationalisation of the independent variable ranges from 16% of the average (Uruguay in 2001) to 126% (Paraguay in 2007). The median stands around 58% of the average wage (Bolivia in 2015) with an interquartile range from 44% (Brazil in 2005) to 70% (Colombia in 2003). To contextualise cross-national heterogeneity in labour-market structure, Appendix Table B1 provides a brief comparative profile of baseline labour-market characteristics across the countries in the sample, sourced from the ECLAC.
The control vector is sourced from the WB. Unemployment refers to the share of the total labour force without work but seeking employment. GDP growth is the annual percentage change in real GDP at constant prices. Inflation is measured by the yearly change in the consumer price index. Government consumption refers to the general government final consumption expenditure as a share of GDP, a standard proxy for the size of the public sector and for broader fiscal–administrative effort. However, it is important to stress that government consumption is included only to reduce omitted-variable bias, not to support substantive claims about redistributive policy. Its role is simply to capture broad shifts in fiscal stance and public-sector scale that may correlate with both minimum-wage policy and inequality. Accordingly, I treat this variable as a background control. Lastly, education refers to the skill composition of the labour force and is proxied by the share of the total working-age population with advanced education, which captures gradual shifts in tertiary-educated labour that can reshape the wage structure.
Substantively, these variables are included because they could otherwise confound the relationship. Unemployment can raise inequality through job loss and hours cuts among low-wage workers and may also influence when governments are willing to raise the wage floor. Real GDP growth separates policy movement from broader economic phases that may compress or widen inequality. Inflation is closely tied to MW politics – indexation rules and political pressure often respond to rising prices and might also be related to inequality. Government consumption absorbs variation in the fiscal and administrative heterogeneity that can affect inequality through public-sector wages, procurement chains, and enforcement capacity, while also potentially moving with wage-floor policy. The tertiary-educated labour-force share captures slow-moving changes in skill supply that shape the wage structure and might otherwise be misattributed to minimum-wage policy.
Empirical strategy and identification
Pooled OLS treats observations as independent and identically distributed and conflates between- and within-country variation, inviting bias from omitted, time-invariant factors (Bailey Reference Bailey2016; Beck and Katz Reference Beck and Katz1995). In consequence, I adopt a time-series cross-section strategy that exploits over-time policy movement while differentiating out stable country traits. The main specifications are TWFE models to absorb unit-specific, time-invariant heterogeneity and net out common regional and global shocks. This approach addresses a central source of endogeneity by sweeping unit-level omitted variables into the fixed effect (Wooldridge Reference Wooldridge2012). The temporal dimension further strengthens identification: all policy and macro covariates enter lagged one year to respect causal ordering and reduce the risk of reverse causality, allowing for the modelling of delayed effects explicitly (Plümper and Troeger Reference Plümper and Troeger2017).
In Latin America, statutory MW are typically adjusted on an annual basis, and household surveys measure income over a recent annual reference period. Additionally, several adjustment processes can register within that horizon, even if some dynamics continue beyond it. Wage compression can emerge quickly because MW changes usually have immediate legal effects, and complying employers adjust wage floors within the first pay cycles; as earnings accrue over the year, these changes can affect measured household incomes. Employment responses may also operate within a year, as firms adjust hours, hiring, or formal–informal margins relatively quickly when the wage floor becomes more binding, with corresponding implications for annual labour income at the household level. Where benefit indexation exists, its effects can likewise appear within a year because indexation rules are often updated on an annual cycle. Finally, household income pooling is inherently short-run: changes in an individual earner’s labour income enter the household budget immediately and can alter measured household income within the same year. One-year lags therefore, provide a plausible baseline for capturing the earliest period in which multiple channels may register in annual household income measures. At the same time, it is also plausible that some mechanisms discussed in the paper may unfold more gradually. To reduce reliance on a single lag choice, I also estimate a distributed-lag specification that includes the contemporaneous minimum-wage ratio and its first two lags. Because MW in Latin America are adjusted repeatedly, often on an annual basis, this approach is more appropriate than an adoption-style event framework. To preserve parsimony in a short panel, the timing flexibility is introduced for the minimum-wage variable while the macroeconomic controls remain lagged one year. The resulting coefficients are afterwards interpreted as a descriptive temporal profile of the association rather than as cleanly separated causal effects at each temporal horizon.
In the main models, standard errors are clustered by country to accommodate serial correlation and heteroskedasticity within panels (Arellano Reference Arellano1987). The main tables report standard errors clustered by country, the conventional approach in FE panel models, where disturbances may be correlated within countries over time. Formally, the baseline two-way fixed effect specification is: $Ineqct = \beta MWc,t - 1 + \gamma 'Xc,t - 1 + \mu c + \tau t + \varepsilon ct$
where Ineqct denotes either SWIID, SEDLAC or LIS disposable-income or market-income Gini in country c and year t; MWc,t−1 is the one-year-lagged minimum to average wage ratio; Xc,t−1 is the vector of lagged controls; μc are country fixed effects; and τt are year effects.
Although the TWFE models are useful for summarising within-country associations over time, they can still mask heterogeneous underlying relationships and place uneven weight on different country-year comparisons. I therefore treat the TWFE estimates as descriptive summaries of within-country co-movement, rather than as evidence of a single homogeneous association. To identify possible sources of variation more transparently, however, I complement the baseline models with leave-one-country-out diagnostics and a comparison across periods of relatively small and relatively large annual changes in the minimum-wage ratio. These checks do not fully resolve the broader concern about heterogeneous underlying relationships, but they help clarify whether the baseline estimate is being driven by one influential country or by a narrow set of larger year-to-year minimum-wage adjustments.
To assess sensitivity to inference with few clusters and to broader error dependence, I also re-estimate the TWFE models using Driscoll–Kraay standard errors and a wild cluster bootstrap procedure. Additional robustness tests are further introduced and include random-effects specifications, alternative clustering choices and lag structures, an alternative measure of government spending, and the inclusion of several potentially confounding institutional variables: ideology of the government and of labour market institutions: union density, centralised collective bargaining and coverage of bargaining procedures. The preferred specification covers fifteen countries and 217 observations between 2003 and 2020. Given the observational nature of the data, I do not claim a fully exogenous source of variation; rather, I treat the estimates as strong conditional associations that are informative about the distributional consequences of MW and place particular weight on their robustness across specifications and datasets.
Main results
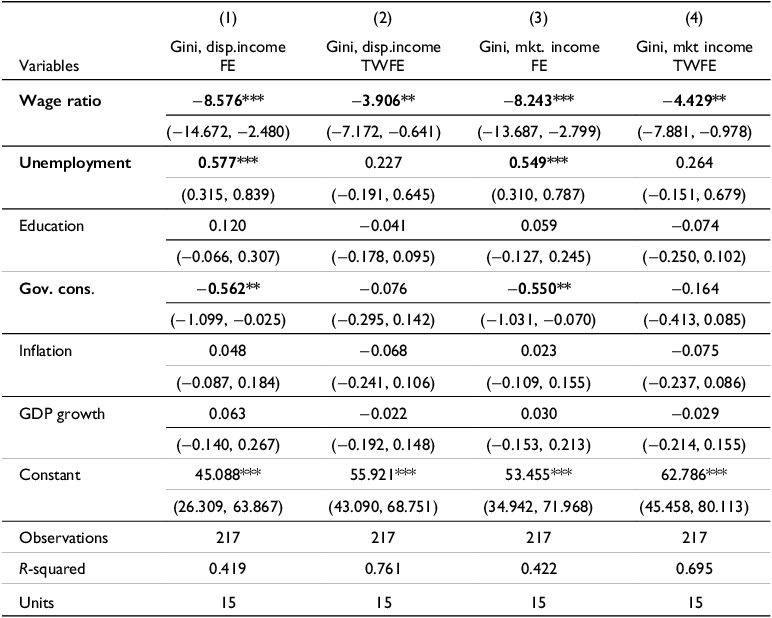
Using SWIID as a common source for measuring disposable- and market-income inequality, Table 1 shows a consistent negative association between MW and both outcomes. A higher wage-ratio is associated with lower inequality in both market and disposable income. For disposable-income inequality (Column 1), the country FE estimate on the lagged wage-ratio is −8.576. The controls behave largely as expected in the country FE models, while their attenuation under two-way FE is unsurprising given that year effects absorb common macro movements.
Minimum-to-average wage ratio and household income inequality (SWIID)
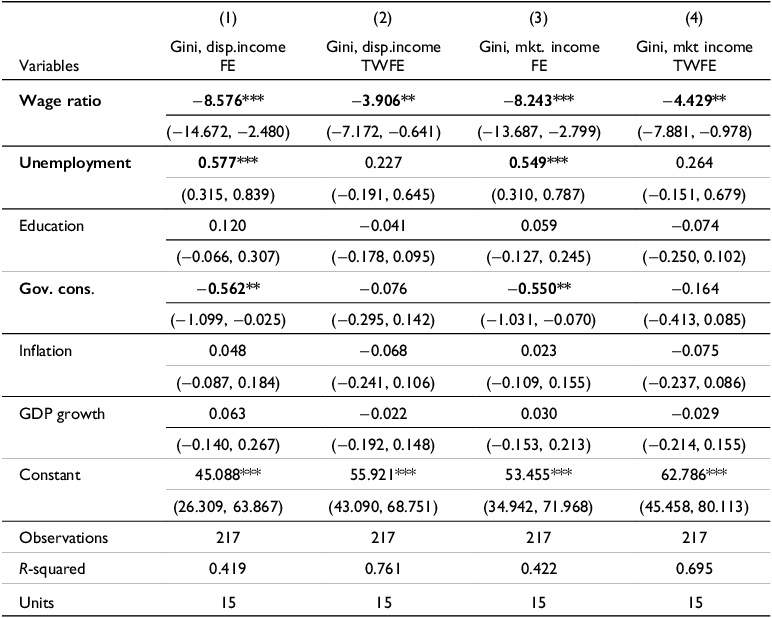
All regressors lagged one year (t−1). Standard errors clustered by country.
*** p < .01, ** p < .05, * p < .1.
Given that the wage-ratio is bounded and a one-unit change mostly lies outside the plausible range of observed data (it implies MW larger than average wages), I express these effects in more substantively meaningful terms. In the country FE models (Columns 1 and 2), moving from the 25th percentile of the wage ratio to the median (or a 14 percentage point increase in the ratio, roughly from a MW of 44% of the average in Brazil in 2005 to 58% in Bolivia in 2015) is associated with a decline of roughly 1.23 Gini points in disposable-income inequality.
Importantly, a 25th-to-median shift is also empirically plausible within observed shifts in the region: within-country increases in the ratio of this magnitude are observed over medium-run horizons in the panel, and several cases exhibit substantially larger increases (e.g., of 24 percentage points in Bolivia from 2001 to 2015; 15 points in Brazil from 2001 to 2009; 18 points in Mexico from 2006 to 2020; and 22 points in Uruguay from 2004 to 2014). Furthermore, these within-sample ratio movements also correspond to the sustained MW expansion pattern across much of Latin America – particularly during the 2000s – reported in other sources (Lombardo et al 2022).
When year FE are added, the implied change from the −3.9 coefficient is about 0.56 Gini points. A similar pattern holds for market-income inequality: in the country FE model (Column 3), the wage ratio coefficient is −8.243, implying a 1.18-point reduction in the market-income Gini for a move from the first quartile to the median, while under TWFE (Column 4), the implied change from the −4.4 coefficient is about 0.64 Gini points.
The observed association between the minimum-wage ratio and lower market-income inequality, together with a comparably sized association for disposable-income inequality, is consistent with a predistributive interpretation. However, because the empirical strategy ultimately relies on parallel movements between market- and disposable-income Gini coefficients, this pattern cannot by itself disentangle predistribution from redistribution, indexation, or other downstream channels. The market-income result is important because it indicates compression before taxes and transfers are applied, but the disposable-income association may still reflect benefit indexation, tax non-compliance, or other unobserved policy responses. I therefore interpret the evidence as consistent with a predistributive channel, while remaining cautious about the precise mix of mechanisms linking minimum-wage policy to household disposable-income inequality.
Robustness tests
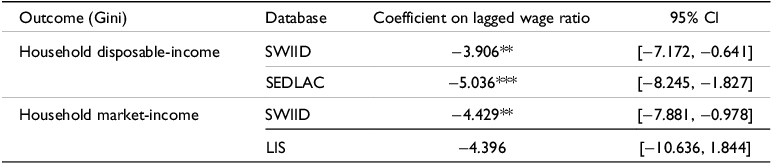
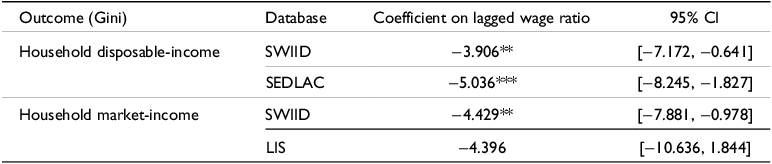
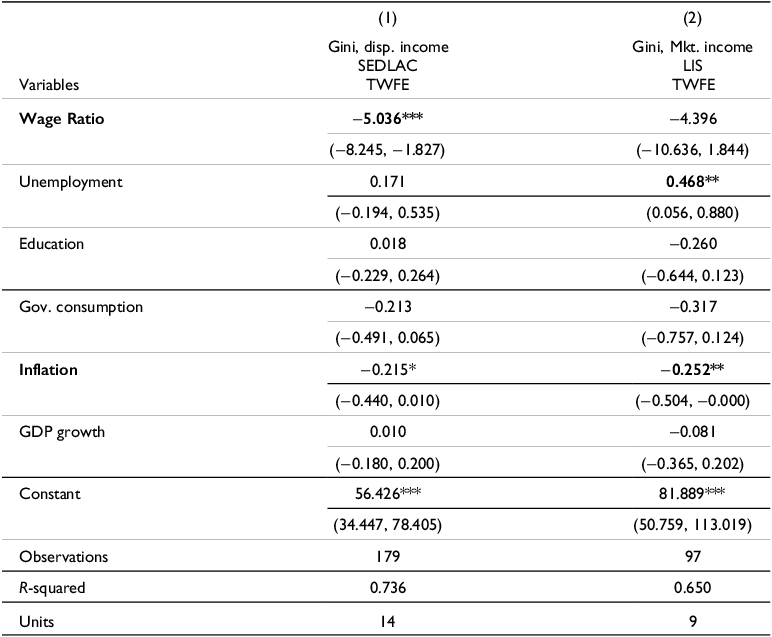
To minimise the concern that the main results are an artefact of SWIID’s imputation methods, Table 2 summarises the coefficients for the wage ratio across the alternative datasets, while Table 3 fully spells out the coefficients for the main variable and controls.
Minimum-to-average wage ratio and household inequality across databases (baseline TWFE)
Minimum-to-average wage ratio and household income inequality (SEDLAC and LIS)
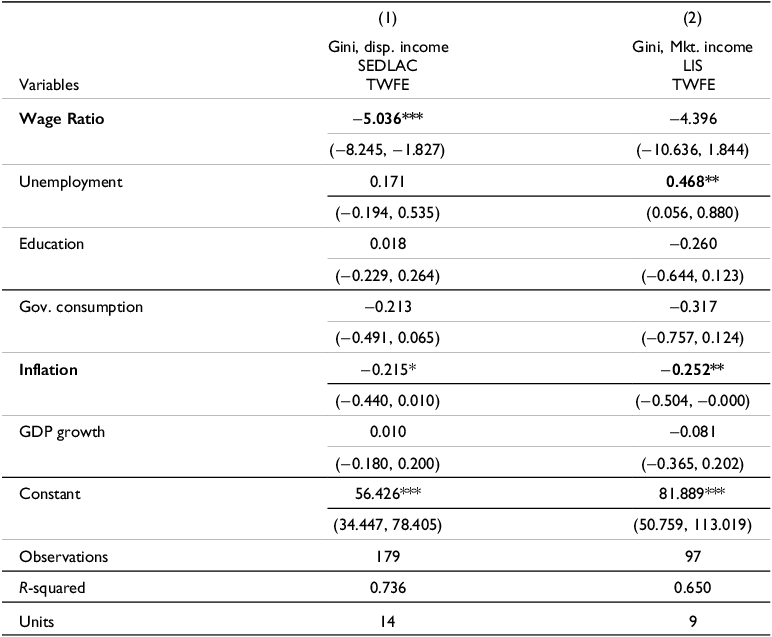
All regressors lagged one year (t−1). Standard errors clustered by country. Year effects omitted for brevity.
*** p < .01, ** p < .05, * p < .1.
Results support the central conclusion that a higher wage ratio compresses household income inequality. The SEDLAC data suggests a stronger relation. The coefficient on the wage ratio is similarly negative, significant at the 1% level, and larger in magnitude (−5.036 vs. −3.906 in the baseline TWFE specification). This difference is consistent with the possibility that SWIID’s imputation process, while necessary for broad coverage, attenuates the estimated relationship by smoothing year-to-year variation. The SEDLAC results, derived from a more direct measurement, likely provide a more precise estimate of the MW equalising effect. Translating this into substantive terms, the SEDLAC estimate implies that a shift from the 25th to the 50th percentile is associated with a decline of approximately 0.72 Gini points.
The analysis using the LIS microdata for market income inequality tells a similar story. The estimated coefficient on the wage ratio in the TWFE replication is negative (−4.396), and its magnitude is strikingly similar to the estimate from the primary SWIID model (−4.429 or a 0.63 Gini point reduction moving from the first quartile to the median). While the smaller sample size of country-years available in LIS (N = 97) reduces statistical precision below conventional significance levels, the result is highly informative, as the point estimate is virtually identical.
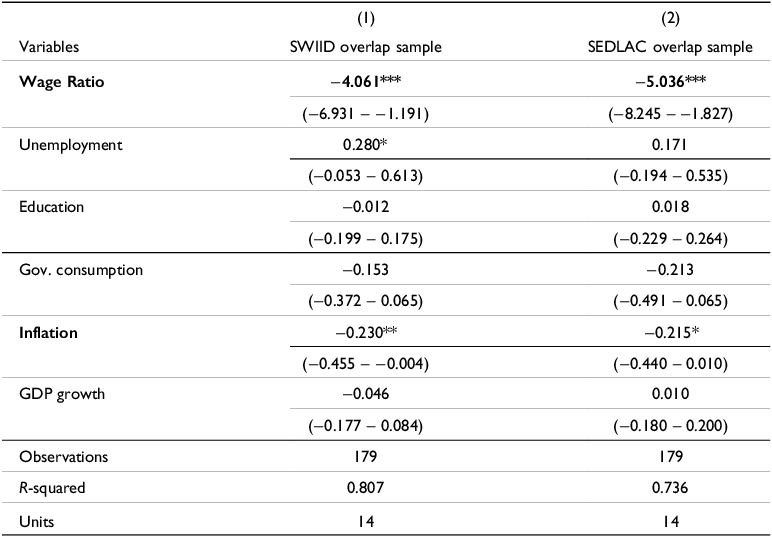
To distinguish source differences from differences in sample composition, I also re-estimate the disposable-income models on the common overlapping country-year sample shared by SWIID and SEDLAC (Table 4). The negative association remains visible in both sources when the estimation is restricted to identical country-years. On this overlap sample, the coefficient on the lagged minimum-wage ratio is −4.06 in SWIID and −5.04 in SEDLAC. This indicates that the difference between the two sources does not disappear once coverage is held constant, suggesting that the remaining divergence is more likely to reflect source construction and measurement than underlying differences because of sample composition. At the same time, the two estimates remain substantively close and support the same overall conclusion: a higher minimum-wage ratio is associated with lower disposable-income inequality.
Minimum-to-average wage ratio and household income inequality (SEDLAC and SWIID overlap)
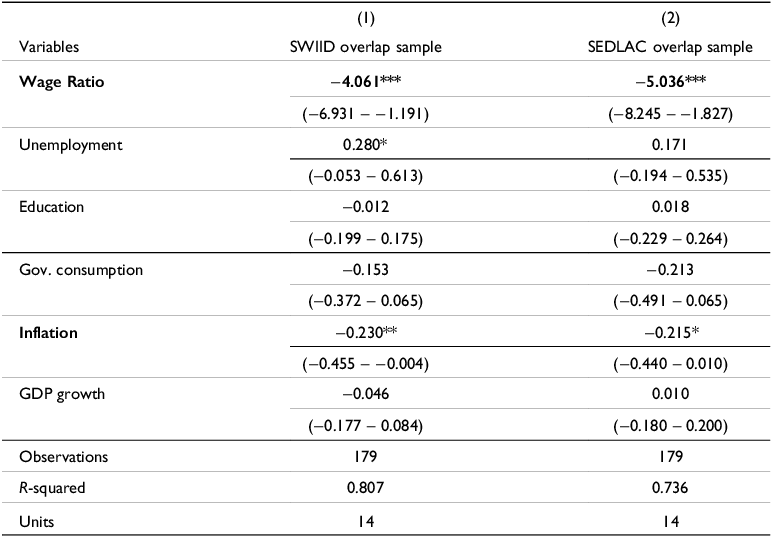
All regressors lagged one year (t−1). Standard errors clustered by country. Year effects omitted for brevity.
*** p < .01, ** p < .05, * p < .1.
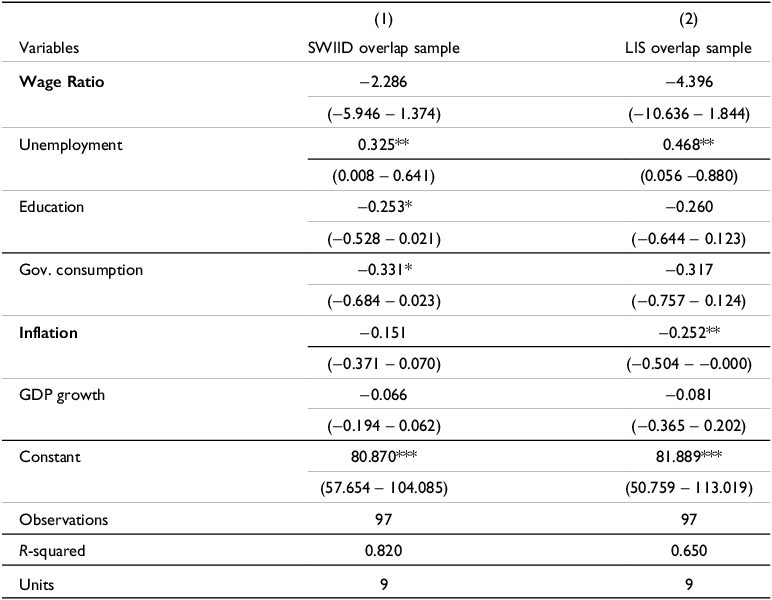
I conduct the same exercise for market-income inequality by restricting the comparison to the common overlapping country-year sample shared by SWIID and LIS (Table 5). Here, too, the coefficient on the lagged minimum-wage ratio remains negative in both sources, at −2.29 in SWIID and −4.40 in LIS. Because these estimates are obtained on identical country-years, the remaining difference is less likely to reflect sample composition and more plausibly reflects source-specific construction and measurement choices. At the same time, the market-income overlap sample is smaller and based on only nine country clusters, so these estimates are considerably less precise. I therefore interpret this result more cautiously, but the directional consistency across both sources still supports the broader conclusion that the negative minimum-wage association is not likely an artefact of unequal database coverage.
Minimum-to-average wage ratio and household income inequality (LIS and SWIID overlap)
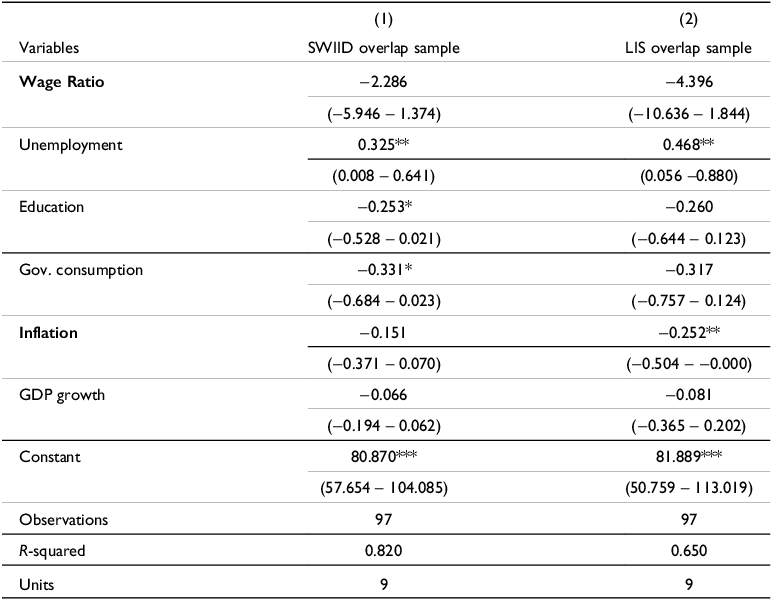
All regressors lagged one year (t−1). Standard errors clustered by country. Year effects omitted for brevity.
*** p < .01, ** p < .05, * p < .1.
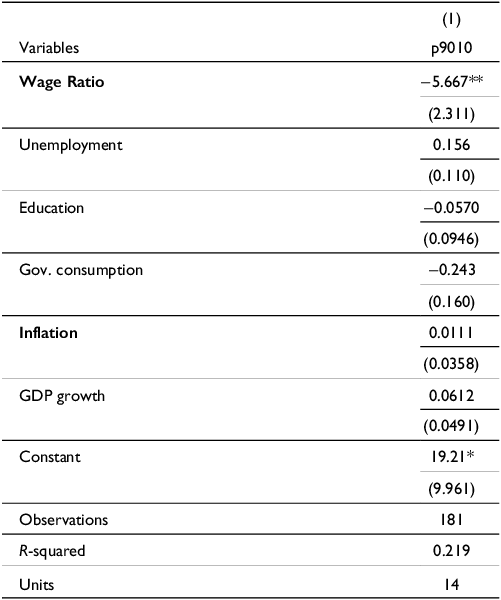
Because the Gini coefficient cannot show where in the distribution compression occurs, I also estimate the baseline specification using the 90/10 percentile ratio (Table 6). The results are consistent with the main findings. A higher lagged minimum-wage ratio is associated with a lower 90/10 ratio, and the coefficient is statistically distinguishable from zero (−5.67, p = .029). In substantive terms, this suggests that the income gap separating households toward the top of the disposable-income distribution from those toward the bottom becomes narrower as the minimum wage rises relative to average wages. This makes the result easier to interpret in substantive terms: the association is not only with a lower overall summary index, but with a smaller distance between better-off and worse-off households. This exercise is performed only for disposable-income inequality, since comparable percentile-ratio series are not available for the market-income outcomes across the sources used in the paper. I therefore treat it as a targeted robustness check that complements, rather than replaces, the Gini-based analysis.
Minimum-to-average wage ratio and household income inequality (90/10 income ratio)
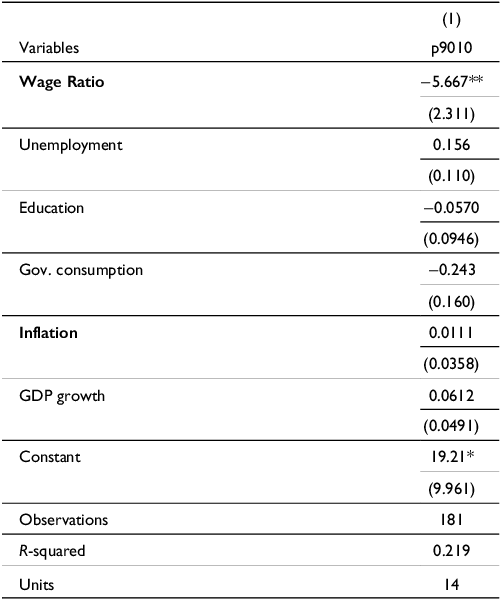
All regressors lagged one year (t−1). Standard errors clustered by country. Year effects omitted for brevity.
*** p < .01, ** p < .05, * p < .1.
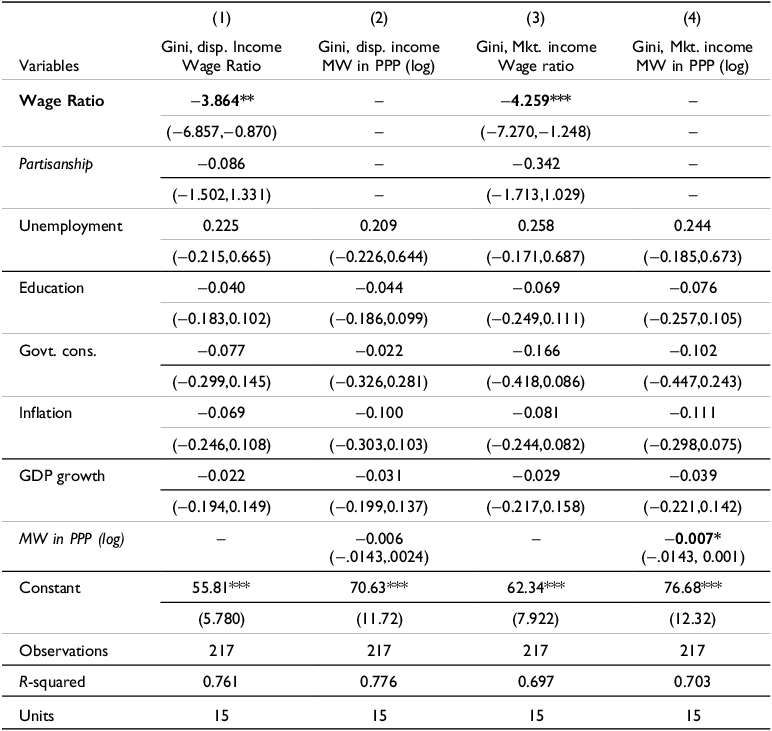
Table 7 addresses two additional challenges to the proposed identification strategy. First, I confront the possibility that left-leaning governments simultaneously raise the MW and enact other distributive policies. Column 1 (disposable) and Column 3 (market) of this specification test this by controlling for a left executive. The results are consistent: the coefficient on the wage ratio remains negative and statistically significant, with virtually no change in magnitude. The coefficient on left partisanship itself is negative but insignificant, indicating that while left governments may be associated with lower inequality, this channel is distinct from the minimum wage mechanism I identify.
Minimum wage and household income inequality: alternative specifications. (TWFE, SWIID)
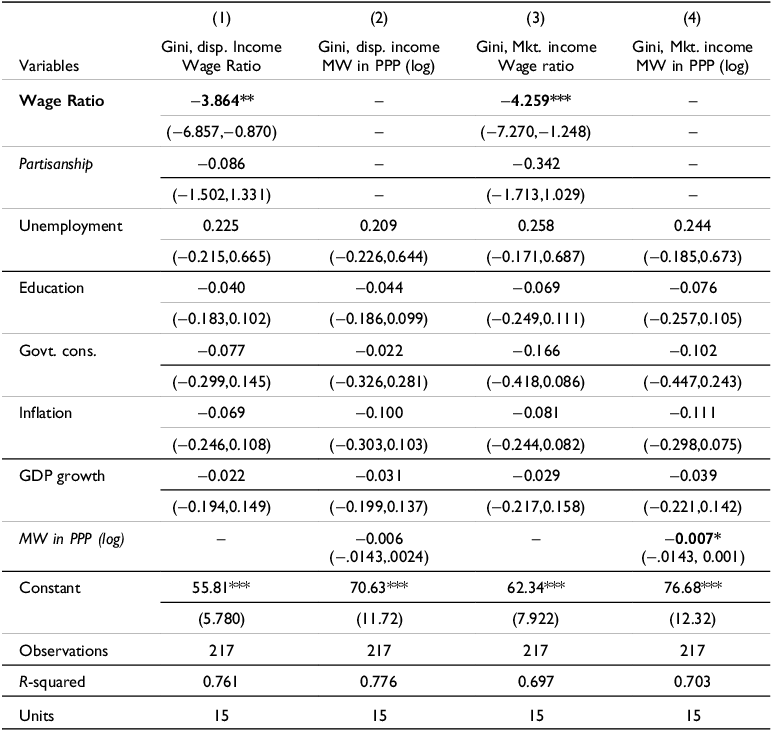
All regressors lagged one year (t−1). Standard errors clustered by country. Year effects omitted for brevity.
*** p < .01, ** p < .05, * p < .1.
I also examine whether the results depend on using a ratio that embeds the average wage in the denominator. Columns 2 and 4 of Table 7 replace the wage ratio with the logged value of the minimum wage in PPP terms. This alternative normalisation removes the average-wage denominator and allows a cleaner comparison between the relative and absolute versions of the policy variable. The coefficient on the log minimum wage remains negative, although the magnitude and precision weaken relative to the wage-ratio specification. I interpret the consistency in this pattern with caution. It suggests that the negative association is more consistently visible when the minimum wage is measured relative to typical earnings than when it is measured in absolute PPP terms. This is consistent with the idea that the distributive relevance of minimum-wage policy depends on its position within the wage structure, while also underscoring that the baseline wage-ratio measure should be read as an indicator of relative bite rather than an exogenous policy shock.
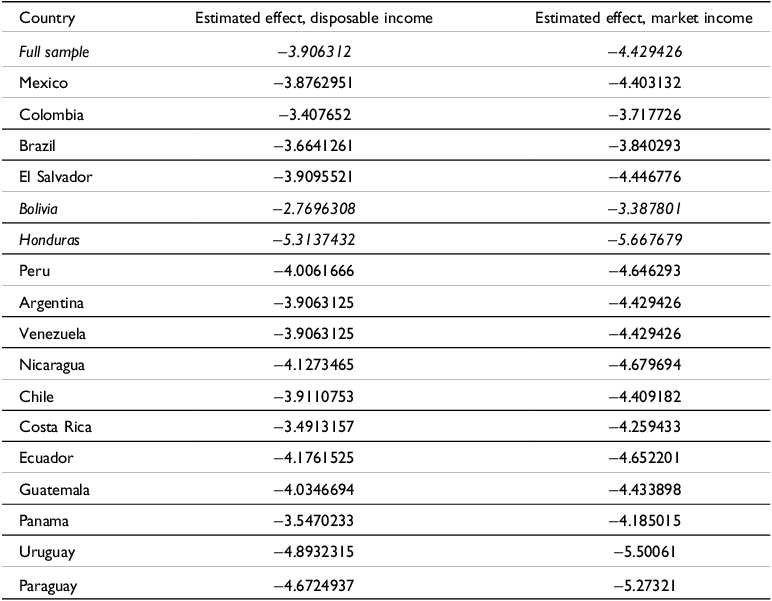
Because TWFE coefficients can be difficult to interpret when treatment effects vary across countries and over time – potentially yielding a weighted average that is disproportionately influenced by specific units – I first assess whether the baseline association is being driven by influential country cases by replicating the preferred TWFE specification, leaving one country out at a time. The estimates do not appear to be dominated by any single country (Table 8). Most coefficients cluster closely around the full-sample TWFE benchmarks (−3.91 for disposable-income inequality; −4.43 for market-income inequality). The magnitude varies at the extremes (excluding Bolivia yields a smaller association, whereas excluding Honduras yields a larger association), but these diagnostics jointly suggest that the negative association is not an artefact of one influential case.
Heterogeneous effects driven by influential cases. Leaving one country at a time
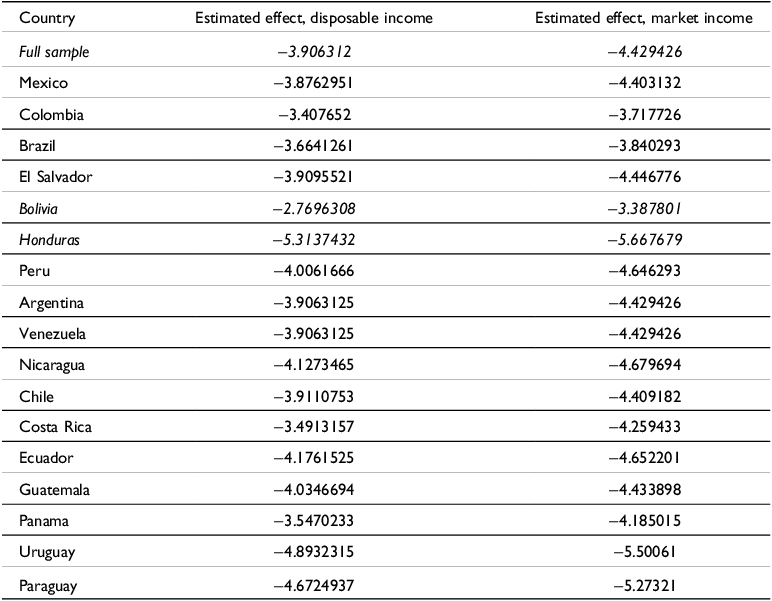
Each estimate is obtained by re-estimating the baseline TWFE specification for disposable- or market-income inequality after excluding one country at a time from the sample. Entries report the coefficient on the lagged minimum-wage ratio. All models include the same lagged controls and year fixed effects as the baseline specification. Standard errors are clustered by country. *** p < .01, ** p < .05, * p < .1.
Beyond sensitivity to individual country cases, I also examine whether the association differs across periods of relatively small and relatively large annual changes in the minimum-wage ratio (Table 9). I classify country-years according to whether the preceding annual change in the wage ratio falls below or above the sample median, and interact that indicator with the lagged minimum-wage ratio. The negative association is visible in both small-change and large-change periods for both disposable- and market-income inequality. For disposable income, the marginal effect of the lagged minimum-wage ratio is −6.05 (p = .009) in small-change periods and −3.21 (p = .008) in large-change periods. For market income, the corresponding effects are −6.65 (p = .003) and −3.56 (p = .006). In both models, the interaction term is positive, indicating that the association is somewhat less steep in periods of larger annual wage-ratio changes, although this difference should be interpreted cautiously. I therefore read this exercise descriptively: it does not resolve the broader concern about heterogeneous underlying relationships, but it shows that the baseline estimate is not driven exclusively by a subset of larger annual minimum-wage adjustments.
Minimum-wage association across periods of small and large annual wage-ratio changes

Entries are marginal effects of the lagged minimum-wage ratio from TWFE models interacting L1. minimum-wage ratio with an indicator for whether the preceding annual absolute change in the wage ratio is below or above the sample median. The interaction term reports the difference in slopes between large- and small-change periods. *** p < .01, ** p < .05, * p < .1.
The resilience of the core finding is further subjected to additional inference tests appropriate for the panel structure. The models account for complex error structures by estimating Driscoll-Kraay standard errors (Appendix Table A1), which are robust to cross-sectional dependence, serial correlation, and heteroskedasticity. This test addresses the concern that common regional shocks, such as synchronised commodity booms or financial crises, might artificially inflate the precision of the estimates. The results are again consistent: the negative relationship between the wage ratio and inequality is unchanged in terms of magnitude (−3.9 for disposable income Gini and −4.42 for market income Gini in these specifications, the same as the TWFE baseline models) and significance, further supporting that the main finding is not an artefact of correlated economic cycles across Latin America. Secondly, I confront the limitation that, with only 15 country clusters, conventional clustered standard errors may overstate significance (Appendix Table A2). I therefore use a wild cluster bootstrap-t (9,999 replications). The coefficient remains unchanged (−3.9 disposable; −4.4 market, the same as the baseline TWFE models), the bootstrap p-values remain below 0.05 (0.0167 and 0.0139 respectively), and the 95% confidence sets exclude zero ([−12.65, −1.20] and [−13.27, −1.512], Appendix Tables A2.1 and A2.2).
To address concerns about shared structural shocks across countries, I also re-estimate the workhorse specification using standard errors clustered by year (Appendix Table A3). The results remain nearly unchanged once again (−3.91 for disposable-income inequality relative to 3.906 in the baseline model; and −4.429 for market-income inequality, the same as the baseline model), indicating that the main inference is not sensitive to assuming correlation in the errors within years across countries.
As a further diagnostic check, I estimate random-effects versions of the baseline panel models and compare them to the unit fixed-effects estimates using Hausman tests (Appendix Tables A4 and A5), For both disposable- and market-income, the coefficient on the lagged wage ratio remains very similar to the one-way FE baseline specification (−7.6 in the disposable-income RE relative to −8.57 in the baseline FE and −8.02 in the market-income RE relative to −8.243 in the baseline FE) the Hausman statistics do not reject equality of the coefficients (p ≈ .12 and p ≈ .66 respectively; Tables A4.1 and A5.1). To probe further whether the correlation between country effects and the regressors biases the estimates, I also estimate Mundlak random-effects models that add country means of all time-varying covariates. In these models, the within-country coefficient on the lagged minimum wage ratio is essentially identical to the one-way FE baseline estimate for both disposable and market-income inequality (Appendix Table A6).
To examine the timing of the relationship more directly, I estimate a distributed-lag specification including the contemporaneous minimum-wage ratio and its first two lags (Appendix Table A7). The results point to a clear short-run pattern in both disposable- and market-income inequality: the negative association is concentrated in the contemporaneous and, especially, the one-year-lagged terms, while the two-year lag is small and statistically indistinguishable from zero. Because the minimum-wage ratio is highly persistent over time, the contemporaneous and lagged terms are closely correlated, making it difficult to estimate each horizon with high precision in isolation. For that reason, I also report joint and cumulative tests. These show that the minimum-wage terms are jointly significant in both models, and that the cumulative association over the contemporaneous-to-two-year window is negative and statistically distinguishable from zero (−4.94 Gini points, p = .028, for disposable-income inequality; −5.68 Gini points, p = .021, for market-income inequality). Taken together, these results reduce the concern that the relationship might be an artefact of imposing a one-year lag: it begins within the same annual window, becomes most visible after one year, and shows little evidence of additional accumulation beyond that horizon.
To address concerns that government consumption might be a coarse control of the government´s fiscal effort, I replace it with central-government social expenditure as a share of GDP, a measure more specifically related to the size of government social spending, sourced from the WB (Appendix Table A8, columns 1 and 2). The coefficient of the wage ratio remains negative and statistically significant for both disposable- and market-income inequality, though somewhat smaller than in the baseline specifications (about −3.1 for disposable income versus −3.9 Gini points in the baseline TWFE and −3.2 for market income versus −4.4 in the baseline TWFE). This exercise, however, is not intended to estimate the effect of redistribution; it simply shows that the MW association is robust to conditioning on a more conventional social-spending control.
Wage-setting institutions are important possible confounders. Where unions are denser and more capable of enforcement and coordination, statutory increases are more likely to bind, spill over beyond the covered sector, and translate into broader wage compression. If minimum-wage increases occur alongside shifts in wage coordination, bargaining coverage, or union density – or if left governments raise MW precisely where labour is strengthening – omitting these features risks attributing to the MW effects resulting from broader changes in the wage-setting regime. I therefore add indicators of union density, wage coordination, and collective bargaining coverage, one at a time, as conservative robustness checks. Trade union density is measured as the share of union members, for a reduced subset of thirteen countries and 140 country–years where ILO data are available. Wage coordination and collective bargaining coverage are sourced from the OECD/AIAS ICTWSS dataset, one of the few comparative sources for wage-bargaining institutions that reports harmonised measures for Latin America.
The MW association remains negative when conditioning on these institutional measures. In the subset where union density is available, the wage ratio remains negatively associated with disposable- and market-income inequality, with somewhat larger coefficients than in the baseline TWFE models (−5.3 versus −3.9 for disposable-income inequality; −6.2 versus −4.4 for market-income inequality) and with p-values just above conventional thresholds (p = .054 and p = .061, respectively), while union density itself is small and statistically indistinguishable from zero (Appendix Table A8, Columns 3–4). This pattern indicates that the core association is not eliminated once union strength is accounted for in the subset of observations where the measure is available.
Results using ICTWSS are similarly consistent with the main findings, but they illustrate a clear trade-off between institutional richness and external validity. On the one hand, these data allow the inclusion of wage coordination and bargaining coverage, which are theoretically relevant controls. On the other hand, they are available only for a sharply reduced and selective subset of country-years, so the resulting estimates should be interpreted cautiously. In the restricted overlap that includes wage coordination (Table A9, Columns 1 and 2), the lagged minimum-wage ratio coefficient remains negative for disposable-income inequality (−5.965), closely aligned with the baseline magnitude. For market-income inequality in the same overlap, the coefficient remains negative (−14.075) but is imprecisely estimated (p = .129), consistent with the small number of clusters. In the overlap that instead includes adjusted bargaining coverage (Table A9, Columns 3–4), the association remains negative and statistically distinguishable from zero for disposable-income inequality (−6.184) and remains negative for market-income inequality at a higher threshold (−10.621, p = .090). The adjusted coverage term is small and imprecise in both outcomes, again consistent with uneven overlap and measurement noise in the restricted panel. Taken together, these exercises suggest that the core association is not obviously reversed once these institutional controls are introduced, where data permit, but they do not provide strong reassurance about the full-sample results. Although ICTWSS is the best available comparative source for these institutions, it covers only a subset of seven countries in the region, reducing the estimable samples to 53 observations (four countries) in the coordination overlap and 66 observations (six countries) in the adjusted-coverage overlap. In addition, wage coordination exhibits very limited within-country movement in Latin America: countries are concentrated at the low end of the coordination scale, and changes are rare, so after conditioning on country and year fixed effects, the residual variation available to identify an independent coordination effect is thin. Bargaining coverage displays somewhat more dispersion, but still with uneven coverage across countries and years, so estimates in these restricted samples can reflect sample composition – i.e., which policy episodes are observed – as much as institutional conditioning. For these reasons, these specifications should be interpreted as directional robustness exercises rather than precise estimators of the independent effects of coordination or bargaining coverage in Latin America.
The literature suggests that the MW-inequality relationship may be non-linear and display a tipping point beyond which further increases cease to compress inequality and to raise it instead (Dantas Reference Dantas2025). To probe this possibility, I re-estimate the preferred TWFE models, adding a squared term for the lagged minimum-to-average wage ratio. In both specifications (disposable-income and market-income Ginis), the linear term remains negative (−7.7 and −6.0, respectively; Appendix Table A10) but becomes imprecisely estimated, and the quadratic term is not statistically distinguishable from zero (F-tests yield p-values of about 0.69 for disposable income and 0.87 for market income; Appendix Tables A10.1 and A10.2).
I therefore do not find evidence of a systematic non-linear reversal over the range of minimum-wage ratios observed in this sample. At the same time, this should not be interpreted as evidence that such tipping points are absent. With only fifteen country clusters and a demanding specification that includes year effects and multiple lagged controls, the squared term is estimated with considerable uncertainty. To assess whether low power is a plausible explanation for the null, I compute a ‘minimum detectable effect’ diagnostic for the squared term by multiplying its cluster-robust standard error by the relevant two-sided critical value for 15 clusters (df = 14). This calculation implies that the model would only detect non-linearity if the quadratic coefficient was on the order of about 14 or larger in magnitude. Over the interquartile range of the wage ratio in the sample (0.44–0.70), this implies that a non-linear relationship would be detectable only if the quadratic component alone shifted inequality by roughly 4 Gini points. Put differently, over the empirically relevant range of the wage ratio in this panel, the data are well suited to detecting large, systematic tipping-point reversals, but are underpowered to detect subtler or episodic threshold dynamics concentrated in a small number of extreme reforms. In that sense, the absence of detectable non-linearity here is better understood as a limit on what the data can rule out than as a definitive rejection of threshold dynamics. I therefore remain agnostic about whether more pronounced non-linearities might emerge under much higher wage ratios or in settings with more support at the extremes of the distribution.
I also confront the possibility of anticipatory effects confounding the association. MW increases are often announced and contested in advance, so households and firms may begin adjusting wages, employment, or consumption before changes are fully implemented or captured in annual data. If such anticipation is systematic, inequality could begin to move ahead of recorded MW changes, complicating the interpretation of lagged fixed-effects estimates. To probe this possibility, I estimate a placebo specification that adds one- and two-year leads of the wage-ratio (Appendix Table A11). Under anticipatory adjustment, future minimum-wage changes should be associated with current inequality. The lead terms are not jointly significant (p = .226), providing no clear evidence that inequality systematically shifts in advance of recorded minimum-wage changes. Moreover, when the baseline model is re-estimated on the same reduced sample used by the placebo specification, the lagged MW coefficient remains negative, of similar magnitude (about –3.1 Gini points), and statistically significant. Substantively, the absence of systematic lead effects is consistent with the interpretation that the estimated association reflects post-reform adjustment rather than pre-trends that would have unfolded even without policy change. This, however, does not imply that anticipation is impossible in specific settings – particularly where reforms are pre-announced or indexed – but it suggests that anticipatory dynamics are not a dominant feature in the average cross-country pattern captured by the panel. Furthermore, because MW ratios are highly persistent over time, including multiple leads and lags necessarily reduces precision; I therefore treat the lead specification as a diagnostic pre-trend check rather than an alternative baseline.
I address the possibility that the wage ratio inherits measurement error from the ILO average-wage denominator. Because the key regressor is constructed as a ratio, error in the denominator induces a nonlinear form of measurement error in the resulting series, and in principle could generate bias in either direction depending on how the denominator error is correlated with true wages and with minimum-wage policy. The most immediate implication, however, is that additional noise in the denominator can reduce precision and attenuate estimates toward zero. To partially guard against this possibility, I replicate the TWFE models using an alternative series constructed from ECLAC (minimum wage divided by average wages, Appendix Table A12). Although this alternative series has more limited country–year coverage than the main panel, the association remains negative and statistically significant for both household disposable-income inequality and household market-income inequality as measured by SWIID: a one-year lag in the ECLAC wage ratio is associated with a 6.02-point lower disposable-income Gini (p = .010) and a 4.23-point lower market-income Gini (p = 024) relative to −3.9 and −4.4 in the baseline TWFE specifications. These results suggest that the core finding is not an artefact of the specific ILO wage series used to build the main ratio measure.
Lastly, to explore whether the minimum-wage association varies with labour-market segmentation, I re-estimate the baseline TWFE specification, including an interaction between the wage ratio and the lagged share of informal employment and summarise the results using average marginal effects evaluated at the 25th, 50th, and 75th percentiles of informality (Appendix Figure A1). The estimated association becomes more negative at higher levels of informality, but this pattern should be interpreted cautiously. The confidence intervals are wide, especially at the lower percentiles, and the interaction is identified only from within-country changes in informality after conditioning on fixed effects. In practice, residual variation in informality is modest for several countries in the sample, so the interaction is informed disproportionately by a smaller subset of cases in which informality moved more substantially over time. I therefore treat this exercise as exploratory and descriptive rather than as evidence of a robust heterogeneous effect. At most, it suggests that the negative minimum-wage association is not obviously weaker in more informal settings in this sample, but it does not support strong claims about how informality conditions the relationship.
Discussion and conclusion
This article has examined MW as a potential instrument of predistribution in Latin America by analysing its relationship to household market- and disposable-income inequality. By shifting the focus to household outcomes, the analysis provides region-wide evidence that a more binding wage floor is associated with lower household-income inequality. This pattern is replicated across alternative specifications and series, offering policy-relevant insight for middle-income economies where the scope for redistribution through taxes and transfers is often politically or fiscally constrained.
The similarity in the estimated associations for market- and disposable-income inequality is consistent with a predistributive interpretation, in the sense that minimum-wage policy is associated with compression in market outcomes that also appears in disposable-income outcomes. At the same time, these parallel movements do not uniquely identify a mechanism, and redistribution, indexation, or other behavioural responses may still shape how market-income changes translate into disposable-income inequality.
Substantively, the preferred TWFE estimates imply that moving from the 25th percentile of the minimum-to-average wage ratio to the median – an empirical pattern well observed in the region – is associated with reductions of roughly 0.56 Gini points in disposable-income inequality and 0.64 points in market-income inequality. The finding that the relative ‘bite’ of the minimum wage is a stronger predictor of inequality outcomes than its absolute level further suggests that effective wage-floor policy depends on its position within the broader wage structure.
Several limitations temper causal interpretation and point to a future research agenda. The panel spans periods of large macroeconomic shocks, including commodity booms and the global financial crisis. While year FE absorb region-wide or global shocks common to all countries, they cannot fully address heterogeneous exposure – differences between commodity exporters and importers, variation in the severity of domestic recessions and recoveries, etc. Baseline models also condition on time-varying macro indicators (unemployment, inflation, and GDP growth), but uneven exposure to major shocks remains a general limitation of observational cross-country panels; the estimates are therefore best interpreted as conditional associations, not effects insulated from all country-specific macroeconomic dynamics. Likewise, the analysis relies primarily on Gini coefficients, which cannot show where in the distribution compression occurs. While I also examine one alternative measure – the 90/10 income ratio – it is available only for disposable income. Future work should use decomposable indices and percentile ratios, particularly for market income inequality, to identify whether changes are concentrated in the lower tail, in spillovers into the lower-middle, or elsewhere. Although informality is probed through interaction models, confidence intervals are wide, so these results are presented as suggestive heterogeneity rather than a definitive test of differential effects. Finally, although the similarity in the estimated associations for market- and disposable-income inequality is consistent with a predistributive interpretation, it does not uniquely identify a mechanism, and fiscal, behavioural, or indexation responses may still mediate the relationship between market and disposable incomes. While the predistribution framework highlights potential firm-side and capital-income channels, those mechanisms are not directly observed here; linking distributional outcomes to data on profits, margins, markups, or returns to capital, as well as to indexation practices that condition wage and price propagation, would help adjudicate these pathways.
Even so, the stability of the association across alternative specifications, clustering choices, inference procedures, and inequality sources increases confidence that the core relationship is not an artefact of a single modelling assumption, measurement series, or error structure. The evidence supports a cautious conclusion: strengthening MW bite can plausibly form part of an equality-oriented policy mix that shapes market outcomes, complementing redistribution rather than substituting it. For policymakers and development practitioners confronting high inequality and limited fiscal space, wage-floor policy – especially when it increases the MW relative to average wages – appears to be one plausible component of a broader inequality-reducing policy mix, even as the precise mechanisms and distributional incidence remain important targets for future research.
Supplementary material
The supplementary material for this article can be found at https://doi.org/10.1017/elr.2026.10075.
Funding statement
This research received no specific grant from any funding agency in the public, commercial, or not-for-profit sectors.
Conflicts of interest
The author declares no potential conflicts of interest with respect to the research, authorship, and/ or publication of this article.
Oswaldo Mena (M.Sc. University College London; M.A., The Graduate Center, CUNY) is a Ph.D. candidate in Political Science at The Graduate Center, CUNY. He is a 2026 Graduate Center Dissertation Fellow, a 2025 Latino Data Fellow at the Center for Latin American, Caribbean, and Latino Studies, and a 2024 Junior Scholar at The Stone Center on Socio-Economic Inequality. His research centres on comparative politics and political economy, with a focus on the political determinants of inequality, poverty, and redistributive policies – including social policy, taxation, and labour market policies – in Latin America. Prior to beginning his doctoral studies, he worked for nearly a decade in Mexico’s public sector.



 Open access

