


Introduction
The interaction between stress and vulnerability has long been identified as a potential contributor to the development of psychotic illness (C. Corcoran et al., Reference Corcoran, Walker, Huot, Mittal, Tessner, Kestler and Malaspina2003; Gispen-de Wied, Reference Gispen-de Wied2000; Zubin & Spring, Reference Zubin and Spring1977). Evidence for this diathesis has accumulated from a range of approaches (Paquin, Lapierre, et al., Reference Paquin, Lapierre, Veru and King2021), including general epidemiology and prospective cohort studies (Arseneault et al., Reference Arseneault, Cannon, Fisher, Polanczyk, Moffitt and Caspi2011; Cullen et al., Reference Cullen, Fisher, Gullet, Fraser, Roberts, Zahid, To, Yap, Zunszain, Pariante, Wood, McGuire, Murray, Mondelli and Laurens2022; J. Shah et al., Reference Shah, Eack, Montrose, Tandon, Miewald, Prasad and Keshavan2012), adverse childhood experiences (Cullen et al., Reference Cullen, Fisher, Roberts, Pariante and Laurens2014; Varese et al., Reference Varese, Smeets, Drukker, Lieverse, Lataster, Viechtbauer, Read, van Os and Bentall2012), clinical assessments documenting sensitivity to stress (Devylder et al., Reference Devylder, Ben-David, Schobel, Kimhy, Malaspina and Corcoran2013; Myin-Germeys & van Os, Reference Myin-Germeys and van Os2007), analyses of perceived (subjective) stress in patients (Millman et al., Reference Millman, Pitts, Thompson, Kline, Demro, Weintraub, DeVylder, Mittal, Reeves and Schiffman2018; M. Pruessner et al., Reference Pruessner, Iyer, Faridi, Joober and Malla2011), and studies of dopamine or the hypothalamic–pituitary–adrenal axis (HPA) dysregulation (C. M. Corcoran et al., Reference Corcoran, Smith, McLaughlin, Auther, Malaspina and Cornblatt2012; Cullen et al., Reference Cullen, Addington, Bearden, Stone, Seidman, Cadenhead, Cannon, Cornblatt, Mathalon, McGlashan, Perkins, Tsuang, Woods and Walker2020; Mizrahi et al., Reference Mizrahi, Addington, Rusjan, Suridjan, Ng, Boileau, Pruessner, Remington, Houle and Wilson2012). In this way, it is believed that exposure to early-life adversity and stress can interface with innate and acquired neurobiological factors to contribute to distress and, ultimately, psychotic syndromes (M. Pruessner, Cullen, et al., Reference Pruessner, Cullen, Aas and Walker2017; E. Walker et al., Reference Walker, Mittal and Tessner2008).
Stress is a multidimensional phenomenon that includes both objective and subjective components (L. J. Phillips et al., Reference Phillips, Francey, Edwards and McMurray2007). Patients with psychosis report high levels of subjective stress and emotional reactivity in response to life events, which are then both intrusive and challenging to cope with (Horan et al., Reference Horan, Ventura, Nuechterlein, Subotnik, Hwang and Mintz2005, Reference Horan, Brown and Blanchard2007; Marks et al., Reference Marks, Steel and Peters2012; Mondelli et al., Reference Mondelli, Dazzan, Hepgul, Di Forti, Aas, D'Albenzio, Di Nicola, Fisher, Handley, Marques, Morgan, Navari, Taylor, Papadopoulos, Aitchison, Murray and Pariante2010; Palmier-Claus et al., Reference Palmier-Claus, Dunn and Lewis2012; L. J. Phillips et al., Reference Phillips, Edwards, McMurray and Francey2012; M. Pruessner, Béchard-Evans, et al., Reference Pruessner, Béchard-Evans, Boekestyn, Iyer, Pruessner and Malla2013; M. Pruessner et al., Reference Pruessner, Iyer, Faridi, Joober and Malla2011). There is likely to be a bidirectional relationship between symptoms and perceived stress (Renwick et al., Reference Renwick, Jackson, Turner, Sutton, Foley, McWilliams, Kinsella and O'Callaghan2009), while difficulty tolerating stress in early psychosis has been associated with a range of clinical (positive and negative psychotic symptoms, depression, and anxiety) outcomes and functional impairment (Belvederi Murri et al., Reference Belvederi Murri, Pariante, Dazzan, Hepgul, Papadopoulos, Zunszain, Di Forti, Murray and Mondelli2012; Devylder et al., Reference Devylder, Ben-David, Schobel, Kimhy, Malaspina and Corcoran2013).
The experience of stress – whether psychosocial, biological, or both in nature – then implicates neurobiology via a range of pathways including the HPA axis. Dynamic changes in the structural and functional features of the HPA axis occur in response to adaptive or pathologic forces, both internal and external (Myin-Germeys & van Os, Reference Myin-Germeys and van Os2007). For example, as children enter adolescence the frequency and significance of stressful life events increases (M. Gunnar & Quevedo, Reference Gunnar and Quevedo2007; M. R. Gunnar & Talge, Reference Gunnar, Talge and Schmidt2008). Such events are associated with HPA alterations such as elevated basal cortisol and a more robust acute response to stress (Lupien et al., Reference Lupien, McEwen, Gunnar and Heim2009; E. F. Walker et al., Reference Walker, Trotman, Pearce, Addington, Cadenhead, Cornblatt, Heinssen, Mathalon, Perkins, Seidman, Tsuang, Cannon, McGlashan and Woods2013), which typically peaks (in cortisol) approximately 20 min after the exposure itself (Kudielka et al., Reference Kudielka, Schommer, Hellhammer and Kirschbaum2004). Together, this suggests that adolescence is a period of sensitization during which the long-term set-point of HPA activity can be altered or dysregulated (E. F. Walker et al., Reference Walker, Sabuwalla and Huot2004). Factors known to influence the HPA axis include sex, diet, sleep, exercise, and medications (including antipsychotics) as well as substances (Mann et al., Reference Mann, Rossbach, Müller, Müller-Siecheneder, Pott, Linde, Dittmann and Hiemke2006; Steiner & Wotjak, Reference Steiner and Wotjak2008; E. Walker et al., Reference Walker, Mittal and Tessner2008). HPA axis dysregulation has been seen in a range of conditions beyond psychosis, including both mental and physical disorders (Mück-Seler et al., Reference Mück-Seler, Pivac, Jakovljević and Brzović1999; Phassouliotis et al., Reference Phassouliotis, Garner, Phillips, Bendall, Yun, Markulev, Kerr and McGorry2013; L. J. Phillips et al., Reference Phillips, McGorry, Garner, Thompson, Pantelis, Wood and Berger2006; Yeap & Thakore, Reference Yeap and Thakore2005).
A readily accessible (and therefore easily collected) measure of the HPA axis is that of salivary cortisol. A recent meta-analysis found substantial heterogeneity and no overall evidence for alterations of unstimulated salivary cortisol in early psychosis (Misiak et al., Reference Misiak, Pruessner, Samochowiec, Wiśniewski, Reginia and Stańczykiewicz2021), but others have highlighted the complementary importance of laboratory-based stress-response paradigms (Dickerson & Kemeny, Reference Dickerson and Kemeny2004; Jones & Fernyhough, Reference Jones and Fernyhough2006): although only a proxy for psychosocial stress in the flow of daily life, these tasks allow for experimental standardization of stressful scenarios across affected and control groups. The cortisol response to one such task – the Trier Social Stress Test (TSST) (Allen et al., Reference Allen, Kennedy, Dockray, Cryan, Dinan and Clarke2017; Kirschbaum et al., Reference Kirschbaum, Pirke and Hellhammer1993) – is consistently blunted during chronic stages of schizophrenia (Brenner et al., Reference Brenner, Liu, Laplante, Lupien, Pruessner, Ciampi, Joober and King2009; Ciufolini et al., Reference Ciufolini, Dazzan, Kempton, Pariante and Mondelli2014; Dauvermann & Donohoe, Reference Dauvermann and Donohoe2019; Jansen et al., Reference Jansen, Gispen-de Wied, Gademan, De Jonge, van der Linden and Kahn1998; Lange et al., Reference Lange, Deutschenbaur, Borgwardt, Lang, Walter and Huber2017; Zorn et al., Reference Zorn, Schür, Boks, Kahn, Joëls and Vinkers2017). Two studies have reported varying forms of cortisol blunting at the point of a FEP (Borges et al., Reference Borges, Gayer-Anderson and Mondelli2013; Seitz et al., Reference Seitz, Vracotas, Bechard-Evans, King, Abadi, Joober, Shah, Malla and Pruessner2019; van Venrooij et al., Reference van Venrooij, Fluitman, Lijmer, Kavelaars, Heijnen, Westenberg, Kahn and Gispen-de Wied2012), while during the CHR phase cortisol levels are lower than controls in some but not all studies (Appiah-Kusi et al., Reference Appiah-Kusi, Petros, Wilson, Colizzi, Bossong, Valmaggia, Mondelli, McGuire and Bhattacharyya2020; Carol et al., Reference Carol, Spencer and Mittal2021; M. Pruessner, Béchard-Evans, et al., Reference Pruessner, Béchard-Evans, Boekestyn, Iyer, Pruessner and Malla2013). In addition to cortisol, measures of heart rate and blood pressure have also been taken during the TSST: systolic blood pressure was found to be blunted in CHR subjects (M. Pruessner, Béchard-Evans, et al., Reference Pruessner, Béchard-Evans, Boekestyn, Iyer, Pruessner and Malla2013), but in FEP systolic blood pressure was only lower during the anticipation period just before the TSST and comparatively elevated after it (Seitz et al., Reference Seitz, Vracotas, Bechard-Evans, King, Abadi, Joober, Shah, Malla and Pruessner2019).
Notable in these literatures is that nearly all analyses to date have been between a single clinical versus a nonclinical population; there are few comparisons of psychobiological response to stress across multiple clinical stages of early psychosis. The outlier to this, a positron emission tomography study, found that dopamine release in response to an imaging-based stress task was lowest in healthy controls and successively higher in CHR and FEP subjects, with cortisol response conversely lowest in controls and successively higher in CHR followed by schizophrenia (Mizrahi et al., Reference Mizrahi, Addington, Rusjan, Suridjan, Ng, Boileau, Pruessner, Remington, Houle and Wilson2012). Despite demonstrating a progressive increase rather than blunting of cortisol, this nonetheless indicates a stage-based dysregulation of HPA stress response: beginning in CHR and escalating into threshold-level psychosis.
The knowledge limitations in this area are particularly consequential given recent attention to clinical staging models (P. D. McGorry & Hickie, Reference McGorry and Hickie2019; J. L. Shah, Reference Shah2019) and the continuum of stage-specific services from CHR to FEP and eventually persistent psychoses (J. L. Shah et al., Reference Shah, Jones, van Os, McGorry and Gülöksüz2022). Such models have embraced the idea that promising biomarkers (or combinations of them) may demarcate the contours of neurobiological dysregulation, via variation or cut-points between specific clinical stages (P. McGorry et al., Reference McGorry, Keshavan, Goldstone, Amminger, Allott, Berk, Lavoie, Pantelis, Yung, Wood and Hickie2014; J. L. Shah et al., Reference Shah, Chakravarty, Joober and Lepage2016; J. L. Shah et al., Reference Shah, Scott, McGorry, Cross, Keshavan, Nelson, Wood, Marwaha, Yung, Scott, Öngür, Conus, Henry and Hickie2020). Stage-based analyses could then provide insight regarding which biomarkers track alongside stage progression, if and when they diverge from clinical presentation, and how to optimally link staging with treatment selection. In part due to the difficulty of coordinating studies across multistage clinical infrastructures, however, data on such analyses are also relatively sparse – with some exceptions (Lin et al., Reference Lin, Reniers and Wood2013; Mizrahi et al., Reference Mizrahi, Addington, Rusjan, Suridjan, Ng, Boileau, Pruessner, Remington, Houle and Wilson2012; D. Velakoulis, Wood, & Wong, Reference Velakoulis, Wood and Wong2006; Wood et al., Reference Wood, Yung, McGorry and Pantelis2011; Zhao et al., Reference Zhao, Zhang, Shah, Li, Sweeney, Li and Gong2022). In early psychosis, it would be especially valuable to harness existing samples across clinical stages to examine whether cortisol blunting in the face of psychosocial stress is stable or progresses from CHR to FEP.
A related question is whether the cortisol response to acute stress differs not just between clinical stages but also across symptom trajectories within the early psychosis continuum. For example, emerging evidence suggests that most CHR individuals do not develop threshold-level symptoms (and therefore have only sub-threshold psychotic syndromes that do not progress to a threshold-level stage) (Salazar de Pablo et al., Reference Salazar de Pablo, Radua, Pereira, Bonoldi, Arienti, Besana, Soardo, Cabras, Fortea, Catalan, Vaquerizo-Serrano, Coronelli, Kaur, Da Silva, Shin, Solmi, Brondino, Politi, McGuire and Fusar-Poli2021), while a majority of FEP patients experience an initial sub-threshold psychotic syndrome (consistent with a prior CHR state) that then progresses to threshold-level stages (Schultze-Lutter et al., Reference Schultze-Lutter, Rahman, Ruhrmann, Michel, Schimmelmann, Maier and Klosterkötter2015; J. L. Shah et al., Reference Shah, Crawford, Mustafa, Iyer, Joober and Malla2017). These trajectories may be associated with a range of longitudinal clinical and functional outcomes (Daneault et al., Reference Daneault, Maraj, Lepage, Malla, Schmitz, Iyer, Joober and Shah2019; Rosengard et al., Reference Rosengard, Malla, Mustafa, Iyer, Joober, Bodnar, Lepage and Shah2019), with implications for the shape and form of next-generation early intervention infrastructures (J. L. Shah et al., Reference Shah, Jones, van Os, McGorry and Gülöksüz2022).
To examine these concepts, we harnessed an existing dataset in which both CHR and FEP groups were exposed to the TSST. This data set has previously revealed attenuated cortisol levels in each group as compared to nonpsychiatric controls (M. Pruessner, Béchard-Evans, et al., Reference Pruessner, Béchard-Evans, Boekestyn, Iyer, Pruessner and Malla2013; Seitz et al., Reference Seitz, Vracotas, Bechard-Evans, King, Abadi, Joober, Shah, Malla and Pruessner2019) in addition to observations regarding subjective stress, cortisol awakening response, trauma and symptoms, and neurobiology (Azar et al., Reference Azar, Pruessner, Baer, Iyer, Malla and Lepage2018; M. Pruessner, Béchard-Evans, et al., Reference Pruessner, Béchard-Evans, Boekestyn, Iyer, Pruessner and Malla2013; M. Pruessner et al., Reference Pruessner, Boekestyn, Béchard-Evans, Abadi, Vracotas, Joober, Pruessner and Malla2008, Reference Pruessner, Iyer, Faridi, Joober and Malla2011, Reference Pruessner, Lepage, Collins, Pruessner, Joober and Malla2015, Reference Pruessner, King, Vracotas, Abadi, Iyer, Malla, Shah and Joober2019, Reference Pruessner, King, Veru, Schalinski, Vracotas, Abadi, Jordan, Lepage, Iyer, Malla, Shah and Joober2021; M. Pruessner, Vracotas, et al., Reference Pruessner, Vracotas, Joober, Pruessner and Malla2013; M. Pruessner, Bechard-Evans, et al., Reference Pruessner, Bechard-Evans, Pira, Joober, Collins, Pruessner and Malla2017). Recognizing that the same data set could also permit direct comparison between CHR and FEP response to a stress task as an exploratory analysis, we investigated whether the psychobiological response to acute social stress differs in these subgroups – potentially shedding light on the stage at which changes occur (prior to CHR versus between CHR and FEP). We hypothesized that unlike heart rate and blood pressure, cortisol blunting would be more pronounced with ascending stage and with severity/progression of psychotic symptoms across stages.
Method
Participants
The current study includes data collected on 134 subjects (45 healthy controls, 28 individuals at CHR, and 61 FEP), all aged 14-35 years, who participated in a project on the neurobiology of stress in early psychosis (M. Pruessner, Béchard-Evans, et al., Reference Pruessner, Béchard-Evans, Boekestyn, Iyer, Pruessner and Malla2013; Seitz et al., Reference Seitz, Vracotas, Bechard-Evans, King, Abadi, Joober, Shah, Malla and Pruessner2019). CHR and FEP subjects were all patients at the Prevention and Early Intervention Program for Psychosis (PEPP) in the Douglas Mental Health University Institute in Montreal, Canada, where they received phase-specific medical and psychosocial treatment and follow-up for up to two years (S. Iyer et al., Reference Iyer, Jordan, MacDonald, Joober and Malla2015; McIlwaine et al., Reference McIlwaine, Jordan, Pruessner, Malla, Faridi, Iyer, Joober and Shah2019; M. Pruessner, Faridi, et al., Reference Pruessner, Faridi, Shah, Rabinovitch, Iyer, Abadi, Pawliuk, Joober and Malla2017).
Exclusion criteria for the FEP service were prior exposure to antipsychotic medications for >30 days, organic brain injury represented by epilepsy or previous loss of consciousness >5 min, pervasive developmental disorder, IQ < 70, or a forensic history. For the CHR service, patients had presented with an at-risk mental state based on the Comprehensive Assessment of At-Risk Mental States (Yung et al., Reference Yung, Yung, Pan Yuen, Mcgorry, Phillips, Kelly, Dell'olio, Francey, Cosgrave, Killackey, Stanford, Godfrey and Buckby2005); they were excluded if there was prior use of antipsychotic medications for 7 or more days. In both CHR and FEP groups, individuals were excluded from the study if they had a history of neuroendocrine disorder or exposure to steroid-based medications.
Nonpsychiatric controls were recruited through fliers and advertisements in local newspapers and were confirmed by telephone interviews and the SCID-non patient (SCID-NP) to have an absence of mental illness, no prior psychosis in a first-degree relative, and no exposure to antipsychotic or antidepressant medications (First et al., Reference First, Spitzer, Gibbon and Williams2002). The study was approved by the Research Ethics Board of McGill University. All subjects signed a consent form outlining study procedures before the stress task began, and participants were compensated for their time.
Sub-threshold and threshold-level psychotic symptoms
Transdiagnostic staging models of psychosis development suggest four broad groups: patients with CHR who do not go on to develop FEP (subthreshold symptom group), those with CHR who convert to FEP (converters), those with who had an identifiable period of subthreshold psychotic symptoms then developed FEP (progressive symptom group), and those with FEP who had no identifiable period of preonset subthreshold psychotic symptoms (acute onset) (J. L. Shah et al., Reference Shah, Crawford, Mustafa, Iyer, Joober and Malla2017).
Of 28 individuals experiencing a CHR state in our sample, 23 had only subthreshold psychotic symptoms (without conversion to FEP) while 5 were later determined to have converted to FEP up to 10 years after the cortisol assays (M. Pruessner, Faridi, et al., Reference Pruessner, Faridi, Shah, Rabinovitch, Iyer, Abadi, Pawliuk, Joober and Malla2017). Forty-seven of the 61 FEP subjects were identified as having experienced progressive subthreshold followed by threshold-level psychotic symptoms, (i.e., with symptoms that progressed from CHR to FEP), while the remaining 14 had an acute onset of psychosis without an identifiable period of preonset subthreshold symptoms. Measurement of preonset symptoms before a diagnosis of FEP was conducted through the Circumstances of Onset and Relapse Schedule (S. N. Iyer et al., Reference Iyer, Boekestyn, Cassidy, King, Joober and Malla2008; Norman et al., Reference Norman, Scholten, Malla and Ballageer2005), which compiles semi-structured interviews, a review of medical records, and interviews with relatives into a timeline that includes when and which of 27 early signs and symptoms were experienced by subjects before the onset of psychosis (S. N. Iyer et al., Reference Iyer, Boekestyn, Cassidy, King, Joober and Malla2008; Norman et al., Reference Norman, Scholten, Malla and Ballageer2005). Of the 27 signs/symptoms, nine (suspiciousness, odd ideas of reference, odd behavior, unusual perceptual experiences, disorganized speech, inappropriate affect, hallucinations, delusions, and passivity) had been previously identified by experts as constituting “attenuated positive symptoms/sub-threshold psychotic symptoms, if they appeared at a time when an individual would not have met criteria for a syndromal-level psychotic episode,” while the remaining eighteen represented a wide range of nonpsychotic signs/symptoms (Shah et al., Reference Shah, Crawford, Mustafa, Iyer, Joober and Malla2017). There was no overlap between the 5 CHR converters and the separate sample of 61 individuals experiencing a FEP.
To test whether there are observed differences in stress response markers between putatively divergent trajectories in early psychosis, we compared the 23 CHR participants who did not convert to FEP (subthreshold symptom group) with the 47 FEP subjects who had prior subthreshold psychotic symptoms (progressive symptom group).
Clinical variables
As noted, the control group was by definition not exposed to psychotropic medications, while the CHR and FEP groups were recruited from within a clinical service in which they were offered stage-appropriate treatment. For FEP this included antipsychotic medications as well as antidepressants or anxiolytics when required, while the CHR group was prescribed antidepressants and anxiolytics as needed but was not exposed to antipsychotics (Raballo et al., Reference Raballo, Poletti and Preti2021, Reference Raballo, Poletti and Preti2022). Medication exposure for each grouping is described in Table 1. Regarding the effect of antipsychotic medications on the HPA axis, previous work comparing FEP subjects with healthy controls has been mixed, with some findings (including our own) demonstrating no relationship between chlorpromazine equivalent medication doses and cortisol levels (Nedic Erjavec et al., Reference Nedic Erjavec, Uzun, Nikolac Perkovic, Kozumplik, Svob Strac, Mimica, Hirasawa-Fujita, Domino and Pivac2017; Seitz et al., Reference Seitz, Vracotas, Bechard-Evans, King, Abadi, Joober, Shah, Malla and Pruessner2019), while other findings (including meta-analyses) suggest that most antipsychotic medications reduce cortisol levels (Meier et al., Reference Meier, Neumann, Jordan, Huether, Rodenbeck, Rüther and Cohrs2005; Subramaniam et al., Reference Subramaniam, LoPilato and Walker2019; E. Walker et al., Reference Walker, Mittal and Tessner2008).
Medications used by participants according to comparison groups
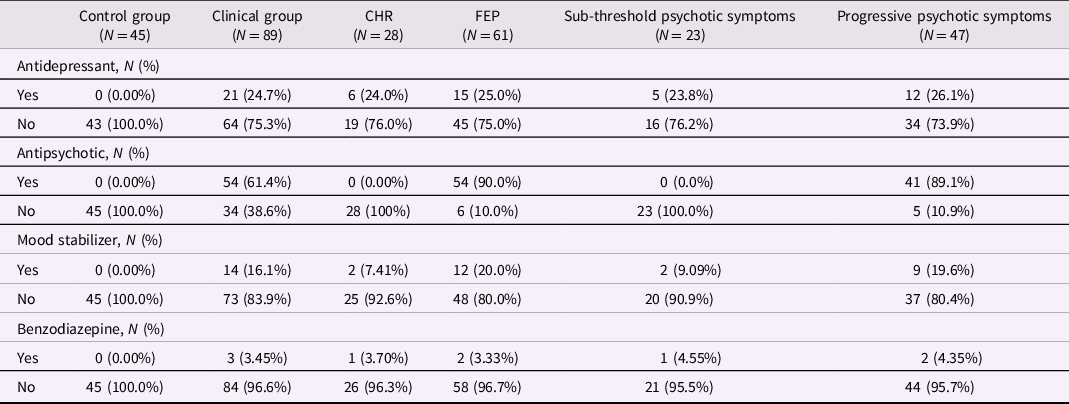
Mood stabilizers include lithium, sodium valproate, and propranolol. The clinical group includes CHR and FEP participants. Participants in the sub-threshold symptom group were CHR participants who did not prospectively convert to FEP; participants in the progressive symptom group were FEP participants whose subthreshold psychotic symptoms developed into threshold-level psychotic symptoms. CHR: Clinical High Risk for psychosis. FEP: first-episode psychosis.
With respect to symptoms, since the two clinical groups differed based on stage of illness, it was expected that at least some of their baseline clinical outcomes would vary as well. We have previously compared their baseline symptoms via the Brief Psychiatric Rating Scale (M. Pruessner et al., Reference Pruessner, Iyer, Faridi, Joober and Malla2011): there were no differences between FEP and CHR groups in total or positive BPRS symptoms, potentially because of the use of antipsychotic medications in the former group. However, BPRS-negative symptoms were higher in the FEP group and BPRS depressive symptoms higher in the CHR group.
Stress measures
Subjective stress was captured in three ways. First, participants rated their subjective level of stress on a 10-point Likert scale during the public speaking and arithmetic tasks of the TSST (described below). Second, perceived stress in the past year was assessed with a 10-point Likert scale response to the single item question “How stressed did you feel in the past year?” Third, the Trier Inventory for Assessment of Chronic Stress included 30 items that measure (via self-report) multiple aspects of long-term psychosocial stress (Schulz & Schlotz, Reference Schulz and Schlotz1999); it has been validated in concordance with other stress measures and with cortisol secretion (J. C. Pruessner et al., Reference Pruessner, Hellhammer and Kirschbaum1999; Schulz et al., Reference Schulz, Kirschbaum, Prüßner and Hellhammer1998; Wust et al., Reference Wust, Wolf, Hellhammer and Federenko2000).
Trier Social Stress Test
First described in 1993, the TSST consists of three distinct periods – anticipation (10 min), test (10 min total), and recovery (60 min) (Kirschbaum et al., Reference Kirschbaum, Pirke and Hellhammer1993). It is characterized by uncontrollability and threat of social evaluation and is widely recognized as a validated experimental stress exposure (Allen et al., Reference Allen, Kennedy, Dockray, Cryan, Dinan and Clarke2017; Dickerson & Kemeny, Reference Dickerson and Kemeny2004; Seddon et al., Reference Seddon, Rodriguez, Provencher, Raftery-Helmer, Hersh, Labelle and Thomassin2020) across a range of measures (subjective stress, salivary cortisol, blood pressure, and heart rate), including in psychosis (Jones & Fernyhough, Reference Jones and Fernyhough2006).
In the current application of the TSST, the public speaking and arithmetic tasks were carried out in front of a committee (sitting behind a one-way mirror, but with two-way auditory contact) and a camera (Figure 1). After arrival at the testing unit, there was a 30-min resting period, during which participants were asked to read and sign the consent form and to complete emotionally neutral questionnaires. In the anticipation period, the committee was introduced and the task explained followed by 10 min of preparation time. During the 10 min test period, the first 5 min was reserved for the speech task and the second 5 min for mental arithmetic. Immediately following the test, a debriefing occurred in which subjects were told about the nature of the task and its goal of increasing levels of stress to measure neuroendocrine responses.
Physiological assessment times before, during and after the Trier Social Stress Test (from Seitz et al., Reference Seitz, Vracotas, Bechard-Evans, King, Abadi, Joober, Shah, Malla and Pruessner2019). Time: relative to the simulated job interview.

While salivary cortisol was measured at eight timepoints over the three test periods (Figure 1) using Salivette cotton swabs (Sarstedt, Germany), the first sample (at −30 min) was not included as it might be reflective of external influences on cortisol. The samples were frozen at −20°C until the time of analysis and assayed using time-resolved immunofluorescence (Dressendörfer et al., Reference Dressendörfer, Kirschbaum, Rohde, Stahl and Strasburger1992). Heart rate and blood pressure were also captured (as autonomic correlates of stress response) during the same time periods as cortisol sampling, using an automated blood pressure monitor (Omron IntelliSense HEM-711, Japan).
As cortisol levels vary throughout the day, variability due to diurnal rhythm was minimized by starting the TSST between 1 and 2PM for all participants (ending between 3 and 4PM); salivary cortisol during that time is relatively low, stable, and most susceptible to stressful stimulation (Kudielka et al., Reference Kudielka, Hellhammer and Wüst2009). In order to further standardize HPA activation, subjects were asked to not drink coffee or smoke cigarettes for at least 1 hr prior to the visit. They arrived approximately 30 min before the TSST began, to ensure a consistent period of rest/inactivity prior to the stress paradigm.
Statistical Analyses
Analyses were conducted in R version 4.1.2 (R Foundation for Statistical Computing). We performed three types of comparisons: (1) clinical (CHR or FEP) vs. control group; (2) CHR vs. FEP; and (3) subthreshold vs. progressive psychotic symptoms. We report sociodemographic characteristics of each group descriptively, but in keeping with STROBE guidelines (Vandenbroucke et al., Reference Vandenbroucke, von Elm, Altman, Gøtzsche, Mulrow, Pocock, Poole, Schlesselman and Egger2007), we did not compute inferential statistics (i.e., p-values) for descriptive analyses. Data were log-transformed when assumptions of normality were violated, as indicated in results. Missing data were replaced by multiple imputations using the mice package version 3.14.0 (van Buuren & Groothuis-Oudshoorn, Reference van Buuren and Groothuis-Oudshoorn2011). All available descriptive, predictor, and outcome variables in the dataset were used to generate 20 multiply imputed data sets by chained equations, which were subsequently pooled in the regression models to account for uncertainty of the imputations.
To compare perceived stress levels, we regressed them on the group variables (either (1) clinical vs. control, (2) CHR vs. FEP, or (3) subthreshold vs. progressive psychotic symptoms) in linear models. To compare psychobiological outcomes over time between groups, we applied linear mixed models. These models allowed us to account for the nested structure of the data (i.e., repeated measures of outcomes within individuals) while examining differences between participant groups across time points. Outcomes were regressed on group (either (1) clinical vs. control, (2) CHR vs. FEP, or (3) subthreshold vs. progressive psychotic symptoms) and time in minutes. We applied unstructured covariance matrices and random intercepts.
We further compared psychobiological responses between groups according to the area under the curve with respect to ground (AUCg) and increase (AUCi) (J. C. Pruessner et al., Reference Pruessner, Kirschbaum, Meinlschmid and Hellhammer2003).
We defined statistical significance as p < .05 or 95% confidence intervals not overlapping the null. For all models, we calculated standardized mean differences (SMD) between groups using the emmeans package version 1.7.2. SMD in linear mixed models were estimated by combining random-effect variances.
Results
Sample characteristics
Characteristics of participants are presented in Table 2. Participants in the overall clinical group (CHR plus FEP) were less likely to have college-level education and were more likely to use cannabis compared with participants in the control group. Participants in the FEP group were older and more likely to use cigarettes than participants in the CHR group. FEP subjects with progressive psychotic symptoms were older and more likely to smoke cigarettes than CHR participants with only sub-threshold symptoms.
Characteristics of participants according to comparison groups
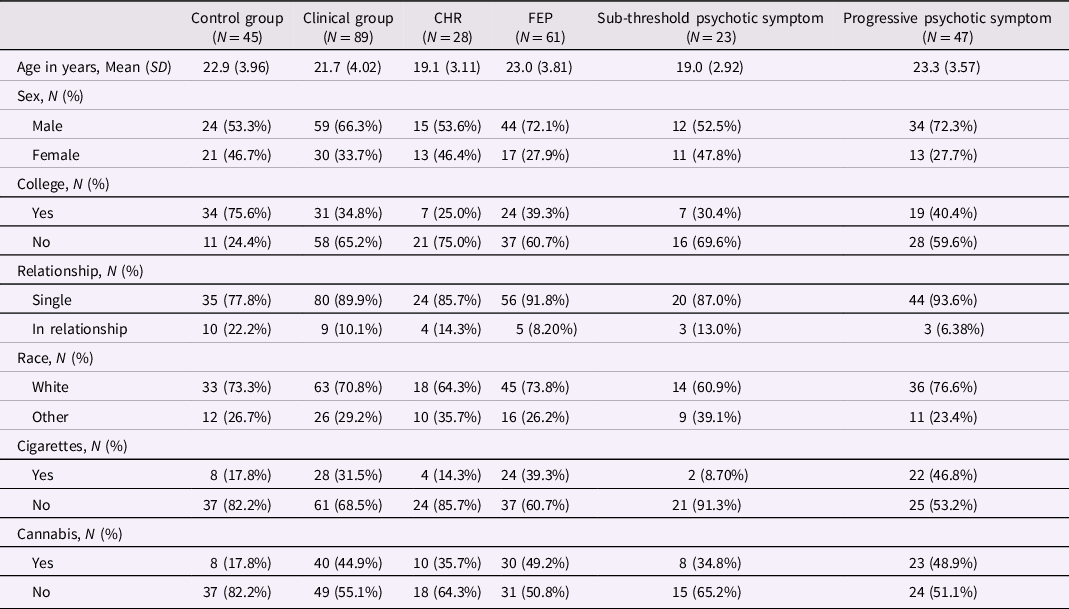
The clinical group includes CHR and FEP participants. Participants in the sub-threshold symptom group were CHR participants who did not prospectively convert to FEP; participants in the progressive symptom group were FEP participants whose subthreshold psychotic symptoms developed into threshold-level psychotic symptoms. Cigarette smoking was defined as 5 cigarettes or more daily. Cannabis use was defined as any use in the past 3 months. CHR: Clinical High Risk for psychosis. FEP: first-episode psychosis.
In the total sample, the proportion of missing data ranged from 2% for cortisol to 23% for blood pressure and heart rate measures. There was no missing data on the sociodemographic characteristics presented in Table 2. The associations of age and sex with primary outcome measures are presented in Supplementary Material 1.
Stress measures
Perceived stress
Stress scores during the arithmetic task did not differ between the clinical and control groups (SMD = 0.05; 95% CI: −0.31, 0.41), between the FEP and CHR groups (SMD = −0.25; 95% CI: −0.70, 0.20), and between the progressive and stable sub-threshold psychotic symptom groups (SMD = −0.31; 95% CI: −0.81, 0.20). Mean differences in stress scores during the public speaking task were of similar magnitude and not significant (data not shown). Relative to participants in the control group, participants in the clinical group had higher levels of perceived stress in the past year: SMD = 0.42 (95% CI: 0.05, 0.80). There were no differences in past-year stress scores between FEP and CHR groups (SMD = −0.24; 95% CI: −0.71, 0.22), or in the subthreshold versus progressive psychotic symptom trajectory groups (SMD = −0.21; 95% CI: −0.72, 0.30).
Trier Inventory of Chronic Stress
Differences in chronic stress levels were not statistically significant between the clinical and control groups (SMD = −0.02; 95% CI: −0.39, 0.34), between the FEP and CHR groups (SMD = −0.41; 95% CI: −0.87, 0.05), or between the subthreshold and progressive psychotic symptom groups (SMD = −0.36; 95% CI: −0.87, 0.15).
Psychobiological measures during the Trier Social Stress Test
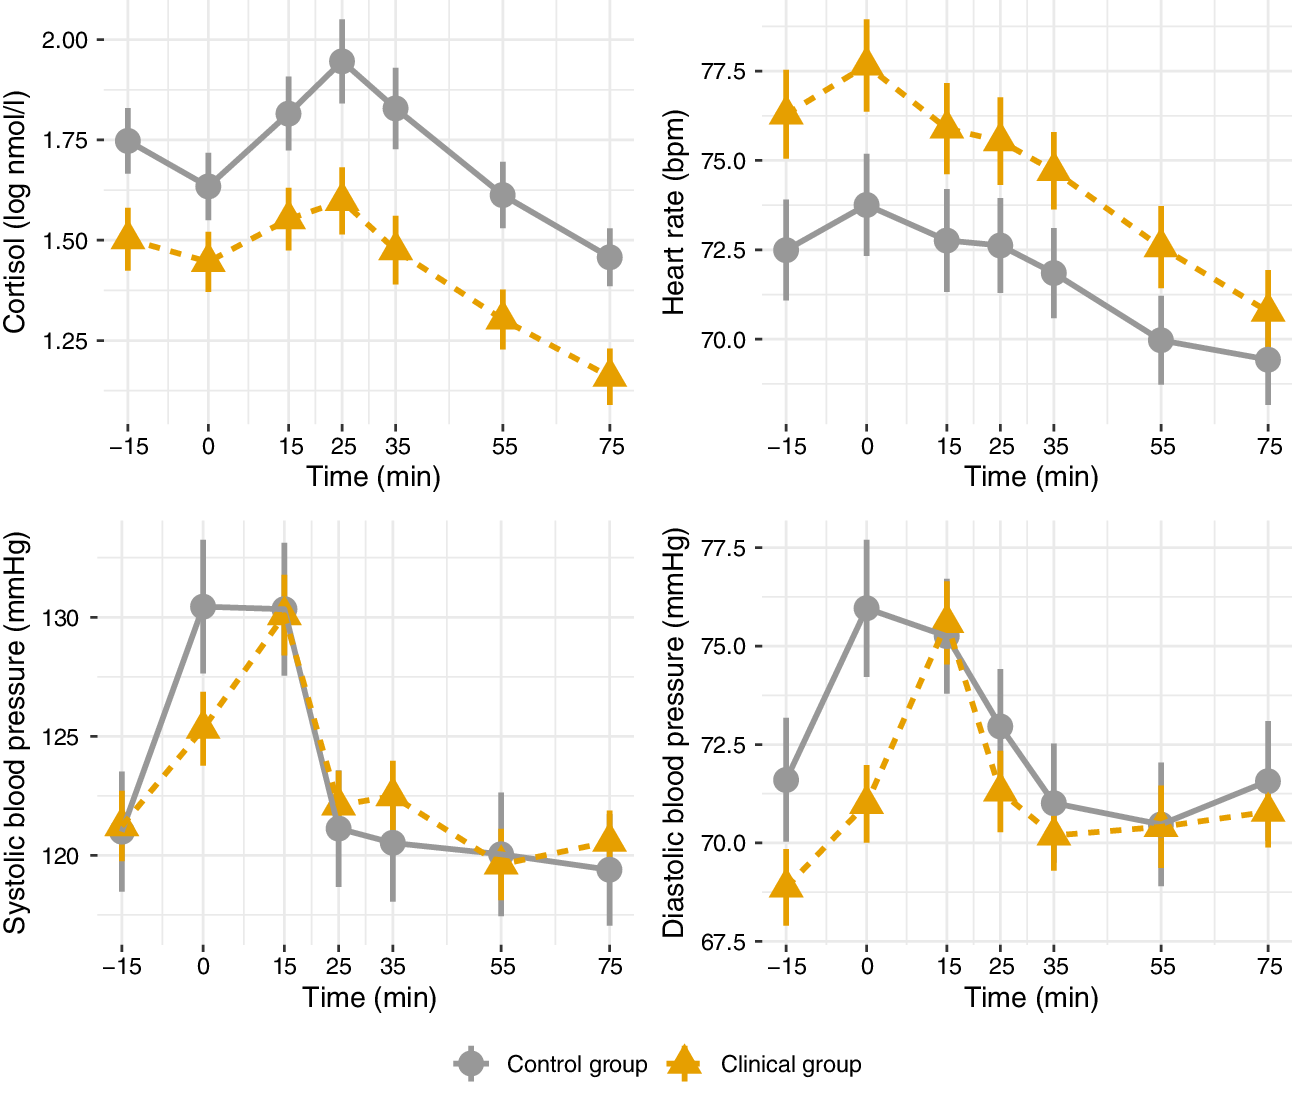
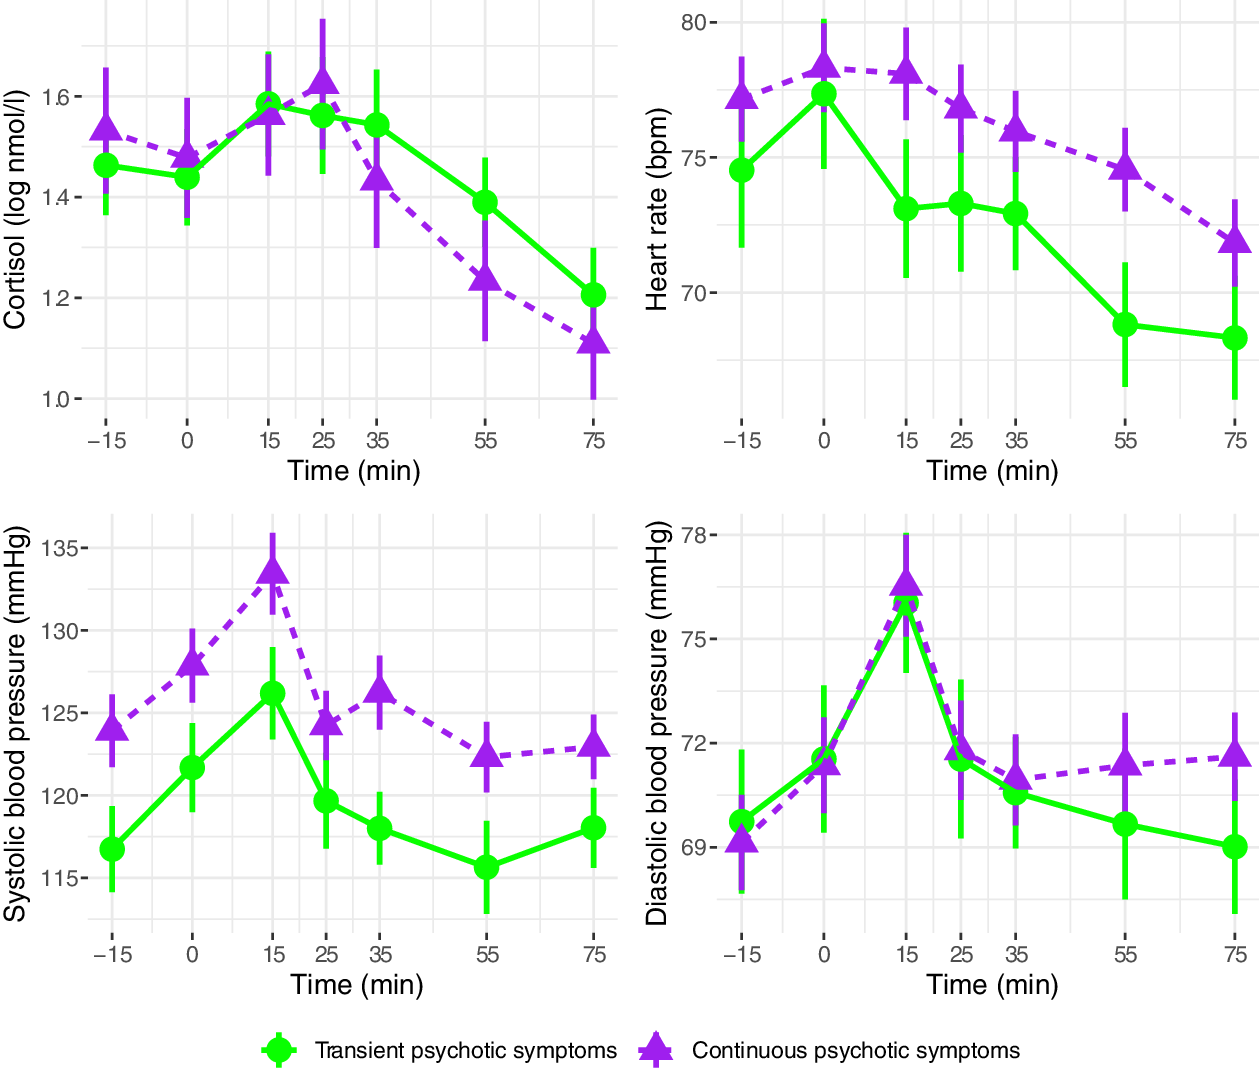
Cortisol, heart rate, and blood pressure during the Trier Social Stress Test are presented in Figure 2 (clinical vs. control groups), Figure 3 (FEP vs. CHR), and Figure 4 (stable versus progressive psychotic symptoms). The between-group SMDs for log cortisol, heart rate, and blood pressure are presented in Table 3a and detailed below.
Mean physiological parameters during the Trier Social Stress Test (control vs. clinical groups). Mean physiological measures and their standard errors, pooled over 20 multiply imputed datasets. Time: relative to the simulated job interview.
Mean physiological parameters during the Trier Social Stress Test (Clinical High Risk vs. First-Episode Psychosis). Mean physiological measures and their standard errors, pooled over 20 multiply imputed datasets. Time: relative to the simulated job interview.

Mean physiological parameters during the Trier Social Stress Test (sub-threshold vs. progressive psychotic symptoms). Mean physiological measures and their standard errors, pooled over 20 multiply imputed datasets. Time: relative to the simulated job interview. Participants in the sub-threshold symptom group were CHR participants who did not prospectively convert to FEP; participants in the progressive psychotic symptom group were FEP participants with prior subthreshold psychotic symptoms.
Group differences in overall cortisol and hemodynamic measures during the Trier Social Stress Test
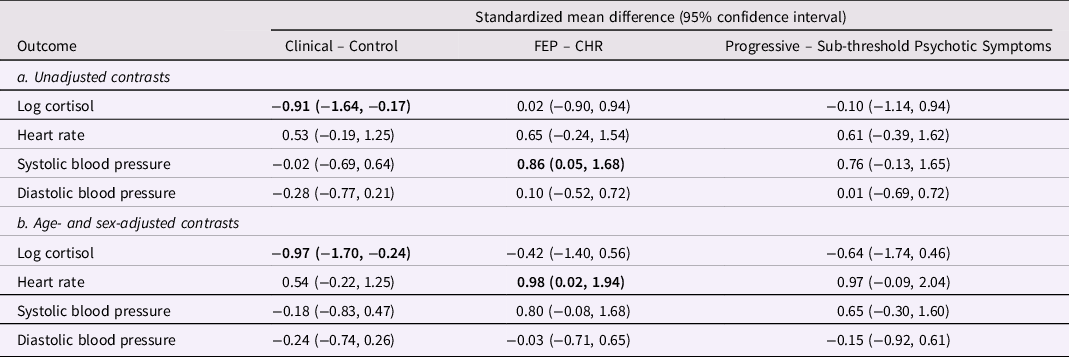
From linear mixed models pooled over 20 multiply imputed datasets, adjusted for age and sex in 3b. The clinical group includes CHR and FEP participants. Participants in the sub-threshold symptom group were CHR participants who did not prospectively convert to FEP; participants in the progressive symptom group were FEP participants whose subthreshold psychotic symptoms developed into threshold-level psychotic symptoms. In bold: statistically significant estimates. CHR: Clinical High Risk for psychosis. FEP: first-episode psychosis.
On average across the entire observation period, participants in the clinical group had lower levels of cortisol than participants in the control group; the two groups did not differ on heart rate or systolic/diastolic blood pressure. There were no significant differences in cortisol, heart rate, or blood pressure between participants in the CHR and FEP groups, with the exception of higher systolic blood pressure in FEP compared with CHR. There were no differences between the subthreshold and progressive psychotic symptom trajectory groups in terms of cortisol, heart rate, and systolic and diastolic blood pressure.
In adjusted analyses with age and sex as covariates, significant differences in cortisol between the control and clinical group remained, while heart rate was significantly elevated in FEP compared to CHR (Table 3b). The observed difference in systolic blood pressure in FEP was no longer significant in the adjusted analysis.
Between-group SMD for area under the curve of cortisol, heart rate, and blood pressure are presented in Supplementary Material 2: cortisol log AUCg was significantly lower among the clinical group compared with the control group, indicating overall lower baseline cortisol and response during the TSST, and systolic blood pressure AUCg was significantly higher among FEP participants compared with CHR participants.
Discussion
Despite the desire to link biomarkers with clinical staging models in psychiatry, relatively few studies have examined the neurobiology of stress response across multiple stages of schizophrenia or psychosis. To address this gap, we observed subjective and psychobiological responses to a controlled experimental stressor, the Trier Social Stress Test, in patients across early stages and symptom trajectories of psychosis. Using standard outcome and area under the curve analyses, we noted increased background subjective stress and relative cortisol blunting in the overall clinical group (including CHR and FEP), but with select autonomic measures being higher in FEP compared to CHR patients.
The notion that biomarkers may vary across stages has been articulated elsewhere (P. McGorry et al., Reference McGorry, Keshavan, Goldstone, Amminger, Allott, Berk, Lavoie, Pantelis, Yung, Wood and Hickie2014; J. L. Shah et al., Reference Shah, Chakravarty, Joober and Lepage2016) but only initially studied in psychosis (Lin et al., Reference Lin, Reniers and Wood2013; Mizrahi et al., Reference Mizrahi, Addington, Rusjan, Suridjan, Ng, Boileau, Pruessner, Remington, Houle and Wilson2012; D. Velakoulis, Wood, Wong, et al., Reference Velakoulis, Wood, Wong, McGorry, Yung, Phillips, Smith, Brewer, Proffitt, Desmond and Pantelis2006; Wood et al., Reference Wood, Yung, McGorry and Pantelis2011; Zhao et al., Reference Zhao, Zhang, Shah, Li, Sweeney, Li and Gong2022). Our findings are consistent with previous efforts demonstrating a dysregulated HPA axis and autonomic nervous system in early psychosis, but augment them by indicating that individual biomarker changes may differentially emerge at particular stages en route to psychotic illness. Specifically, they suggest that cortisol blunting in response to acute psychosocial stress emerges either before or during the CHR phase, but without further progression prior to a FEP. In contrast, it may be that systolic blood pressure or heart rate dysregulation progresses from CHR to FEP.
It is worth noting that while findings of cortisol blunting in stress response have been reported at various stages of psychosis, they may appear at first glance to contradict the idea of a hyperactive HPA axis in the context of stress vulnerability. However, it may be possible to reconcile these phenomena: we have previously speculated that a chronically overactivated HPA axis (with elevated basal cortisol) may eventually become overwhelmed, resulting in exhaustion and minimal capacity for the otherwise normal phasic response to acute stress (ultimately manifesting as blunted cortisol) (M. Pruessner, Cullen, et al., Reference Pruessner, Cullen, Aas and Walker2017; J. L. Shah & Malla, Reference Shah and Malla2015). The current results suggest that any exhaustion of the potential for acute cortisol response occurs at a relatively early stage (before or during CHR) and may remain in place (rather than progressing further) during FEP. In so doing, they demonstrate the potential utility of examining biomarkers for understanding and optimizing stage-based frameworks over time.
The mixed results regarding cortisol blunting seen in the current findings are not unique (Ciufolini et al., Reference Ciufolini, Dazzan, Kempton, Pariante and Mondelli2014; Dauvermann & Donohoe, Reference Dauvermann and Donohoe2019; Lange et al., Reference Lange, Deutschenbaur, Borgwardt, Lang, Walter and Huber2017; Zorn et al., Reference Zorn, Schür, Boks, Kahn, Joëls and Vinkers2017). They may be due to differential settings and contexts (for instance, medication exposure differs across clinical groups) or the samples themselves (we included both affective and nonaffective FEP, whereas many analyses include only the former). In this way, symptom or other trajectories (Paquin, Cupo, et al., Reference Paquin, Cupo, Malla, Iyer, Joober and Shah2021) could complement clinical stage alone for understandings of biomarker evolution.
Although the vast majority of studies compare a single at-risk or later clinical stage to healthy controls, our approach demonstrates one of the first applications of stage- and trajectory-based analyses of neurobiological data. This ability to directly examine both multiple clinical stages and symptom trajectories in a single research infrastructure is unusual as well as a strength of our study. The TSST was also conducted rigorously – with consistent timing and a short period of inactivity prior to starting, in order to standardize baseline cortisol due to diurnal rhythm.
Nonetheless, stress and the psychobiological response to it is a multilayered phenomenon. Given this complexity, our modest sample sizes constrain our capacity to detect smaller between-group differences while also preventing the ability to adjust for multiple comparisons. Our initial findings should therefore be seen as suggestive (rather than conclusive), requiring further replication in independent and larger samples. Furthermore, the controls themselves were healthy (nonpsychiatric), with minimal psychopathology or evidence of help seeking. Ideally, the extent to which these and other differences between groups covary with other factors would be further illustrated with more detailed data on ethnicity, income, and additional demographic and clinical variables. They make it difficult to ascertain whether the differences found between clinical and control groups are due to psychosis specifically, or whether they would also exist in a psychiatric (but nonpsychotic) population, and more generally how representative the sample is in comparison to the general population.
Additional factors relevant to cortisol levels (such as the request to avoid caffeine and cigarettes for at least 1 hr before the TSST) could only be assessed by self-report, while others such as activity levels (some individuals bicycled to the appointment while others drove or took public transit) were difficult to control for. Finally, while we compared groups with different symptom trajectories – i.e., those with subthreshold versus progressive psychotic symptoms – we were unable to examine within-subject change in psychobiological markers over time. Resolving these issues and the aforementioned conflicting findings will require larger studies that enroll individuals at multiple stages of illness and then follow them longitudinally across a range of symptom trajectories. Unlike the current exploratory analyses, which were undertaken with a pre-existing data set that was compiled for different purposes, future studies aiming to replicate or confirm our findings must therefore be explicitly designed and sufficiently powered for stage-based comparisons, and in comparison with psychiatric controls.
Conclusion
Our analyses demonstrate that some psychobiological differences in stress response may emerge prior to or at the point of CHR, while others may emerge between the CHR and FEP stages. In doing so, they demonstrate how stage- and trajectory-based comparisons can contribute to understandings of where and at what cut-points neurobiological changes emerge. Future work could build on this using larger sample sizes, across a range of additional biomarkers (e.g. neuroinflammatory, imaging, chronobiological, and otherwise), and with advanced statistical techniques such as cluster or latent class analyses and regression discontinuity designs.
Supplementary material
The supplementary material for this article can be found at https://doi.org/10.1017/S0954579423000056
Funding statement
This research was supported by a NARSAD Young Investigator Award and Support by the Golden Family Foundation to Marita Pruessner. JLS and RJ were supported by a clinician-scientist salary award from the Fonds de Recherche du Québec–Santé; AKM was supported by the Canada Research Chairs Program.
Conflicts of interest
The authors have no conflicts of interest to declare.


 Open access