


INTRODUCTION
The distribution of relict periglacial landforms such as blockstreams, screes, and solifluction slopes has been used widely as an indicator of periglacial processes in mountain landscapes during the Pleistocene (e.g., Galloway, Reference Galloway1965; Karte, Reference Karte1983; Clarke and Ciolkosz, Reference Clark and Ciolkosz1988; Harris, Reference Harris1994; Park Nelson et al., Reference Park Nelson, Nelson and Walgur2007; Șerban et al., Reference Șerban, Onaca, Șerban and Urdea2019; Deline et al., Reference Deline, Ravanel, Delannoy, Le Roy, Molodin, Cheremisim, Zotkina, Cretin, Geneste and Plisson2020). The most investigated blockstreams are those on the Falkland Islands (André et al., Reference André, Hall, Bertran and Arocena2008; Hansom et al., Reference Hansom, Evans, Sanderson, Bingham and Bentley2008; Wilson et al., Reference Wilson, Bentley, Schnabel, Clark and Xu2008), Pennsylvania (Denn et al., Reference Denn, Bierman, Zimmerman, Caffee, Corbett and Kirby2017), and Tasmania (Caine, Reference Caine1983; Barrows et al., Reference Barrows, Stone and Fifield2004), which have a long and complex evolutionary history. However, there have been very few studies linking climate interpretations from blockstreams with direct dating. A major issue with dating blockstreams is that there are limited targets for radiocarbon and luminescence dating and the environment is challenging for the use of surface exposure dating using cosmogenic nuclides (Barrows et al., Reference Barrows, Stone and Fifield2004). Pilot dating studies have been carried out in Korea (Seong and Kim, Reference Seong and Kim2003; Wilson et al., Reference Wilson, Bentley, Schnabel, Clark and Xu2008; Rhee et al., Reference Rhee, Seong, Jeon and Yu2017), North America (e.g., Cremeens et al., Reference Cremeens, Darmody and George2005), and using a Schmidt Hammer in Norway (Wilson et al., Reference Wilson, Matthews and Mourne2017). In Australia, there has been some research on the distribution and climatic significance of periglacial block deposits (e.g., Caine, Reference Caine1983; Colhoun, Reference Colhoun2002; Slee and Shulmeister Reference Slee and Shulmeister2015), but, like elsewhere in the world, age control is limited. The most comprehensive study to date is that by Barrows et al. (Reference Barrows, Stone and Fifield2004) who determined the age of block deposits in southeast Australia and Tasmania using surface exposure dating. They found a range of ages from the mid-Pleistocene with a concentration of activity around the last glacial maximum.
The distribution of periglacial landforms in Australia with respect to latitude is poorly known. Galloway (Reference Galloway1965) predicted that solifluction slopes extended up eastern Australia to near the Queensland border. Mapping using satellite imagery and aerial photograph interpretation indicates that block deposits are present on the New England Tablelands (Fig. 1), generally within 30 km of the Great Dividing Range (Slee and Shulmeister, Reference Slee and Shulmeister2015). The northernmost block deposits are observed at ~29°50′S near the town of Glen Innes (Fig. 1). However, the age and morphology of these low-latitude block deposits are not known nor how they compare to the higher-latitude deposits of south-eastern Australia.
Generalized relief map of the New England Tablelands in northern New South Wales and the location of the block deposits described in this paper. The red circles are sites from Slee and Shulmeister (Reference Slee and Shulmeister2015).

This paper presents a study of the best developed block deposits in the New England Tablelands. We provide the first age constraints on their formation by exposure dating with the cosmogenic nuclide 36Cl. Instrumental monitoring is used to determine modern variability and magnitude of temperature changes at a block deposit site near Guyra. These data place some constraints on the degree of climate change that occurred to form the deposits.
REGIONAL SETTING
The New England Tablelands are an extensive plateau in north-eastern New South Wales, forming a section of the Great Dividing Range (Fig. 1). Most of the plateau lies between 1000–1500 m in elevation and comprises the largest contiguous area of highlands in Australia with ~32,000 km2 above 1000 m. The central regions of the New England Tablelands form a landscape with high rolling hills with local relief generally <300 m. The Tablelands are bordered to the east by the Great Escarpment, which drops >1000 m to the coastal plains and merges westward into the slopes of the Murray-Darling Basin. The bedrock geology of the study area is composed of Miocene–Oligocene basalt flows associated with the New England Central Volcanic Province (Pecover, Reference Pecover, Flood and Aitchison1993; Sutherland et al., Reference Sutherland, Pogson, Hollis, Flood and Aitchison1993). The basalt cap unconformably overlies Carboniferous folded sedimentary Sandon Beds (Voisey, Reference Voisey and Warner1963). It is apparent that the flood basalts of the area have infilled the pre-Paleogene topography and topographic inversion has formed the high elevation plateaus of the area dissected by Paleogene and Neogene river incision. Basalt and dolerite form many of the block deposits in south-eastern Australia (Barrows et al., Reference Barrows, Stone and Fifield2004; Slee and Shulmeister, Reference Slee and Shulmeister2015). The robust fine crystalline nature of basalt and dolerite limits granular disintegration and spallation; whereas joints in these lithologies are susceptible to weathering, especially frost cracking.
The climate on the New England Tablelands is classified as cool temperate (Stern et al., Reference Stern, de Hoedt and Ernst2000). The station of Guyra at 1275 m (Fig. 1) has a mean annual temperature of 11.6°C, a mean summer temperature of 17.2°C, a mean winter temperature of 5.5°C, and annual precipitation of 878 mm (Bureau of Meteorology [BoM], 2022). Modern night-time temperatures on the New England Tablelands drop to <0°C regularly in winter (BoM, 2022) causing extensive frosts. These frosts are locally amplified by cold air drainage (described by Trewin, Reference Trewin2005), resulting in temperatures well below −5°C occurring in frost hollows and valley floors, particularly in the higher parts of the New England Tablelands. Local cooling in open-network block deposits can be further enhanced by thermal advection during air ventilation related to diurnal or seasonal cooling (e.g., Hoelzle et al., Reference Hoelzle, Wegmann and Krummenacher1999; Heggem et al., Reference Heggem, Juliussen and Etzelmüller2005) or by enhanced conduction through the clasts (Juliussen and Humlum, Reference Juliussen and Humlum2008).
To date, no periglacial deposits in the New England Tablelands have been described. Galloway (Reference Galloway1965) predicted that the periglacial solifluction limit was at ~1400 m (conservative estimate) to ~1100 m (extreme estimate). Galloway (Reference Galloway1965) estimated summer temperature was colder by 9–11°C in southern New South Wales. The nearest described blockstreams are in the Snowy Mountains, ~700 km to the south (Caine and Jennings, Reference Caine and Jennings1968; Barrows et al., Reference Barrows, Stone and Fifield2004). The nearest described periglacial deposits are on the Southern Tablelands, ~500 km to the south, where marginal periglacial landforms occur at 680 ± 10 m (Barrows et al., Reference Barrows, Mills, Fitzsimmons, Wasson and Galloway2022). Slee and Shulmeister (Reference Slee and Shulmeister2015) presented a map of block deposits based on an aerial image survey and found numerous sites both around Barrington Tops and in the New England area.
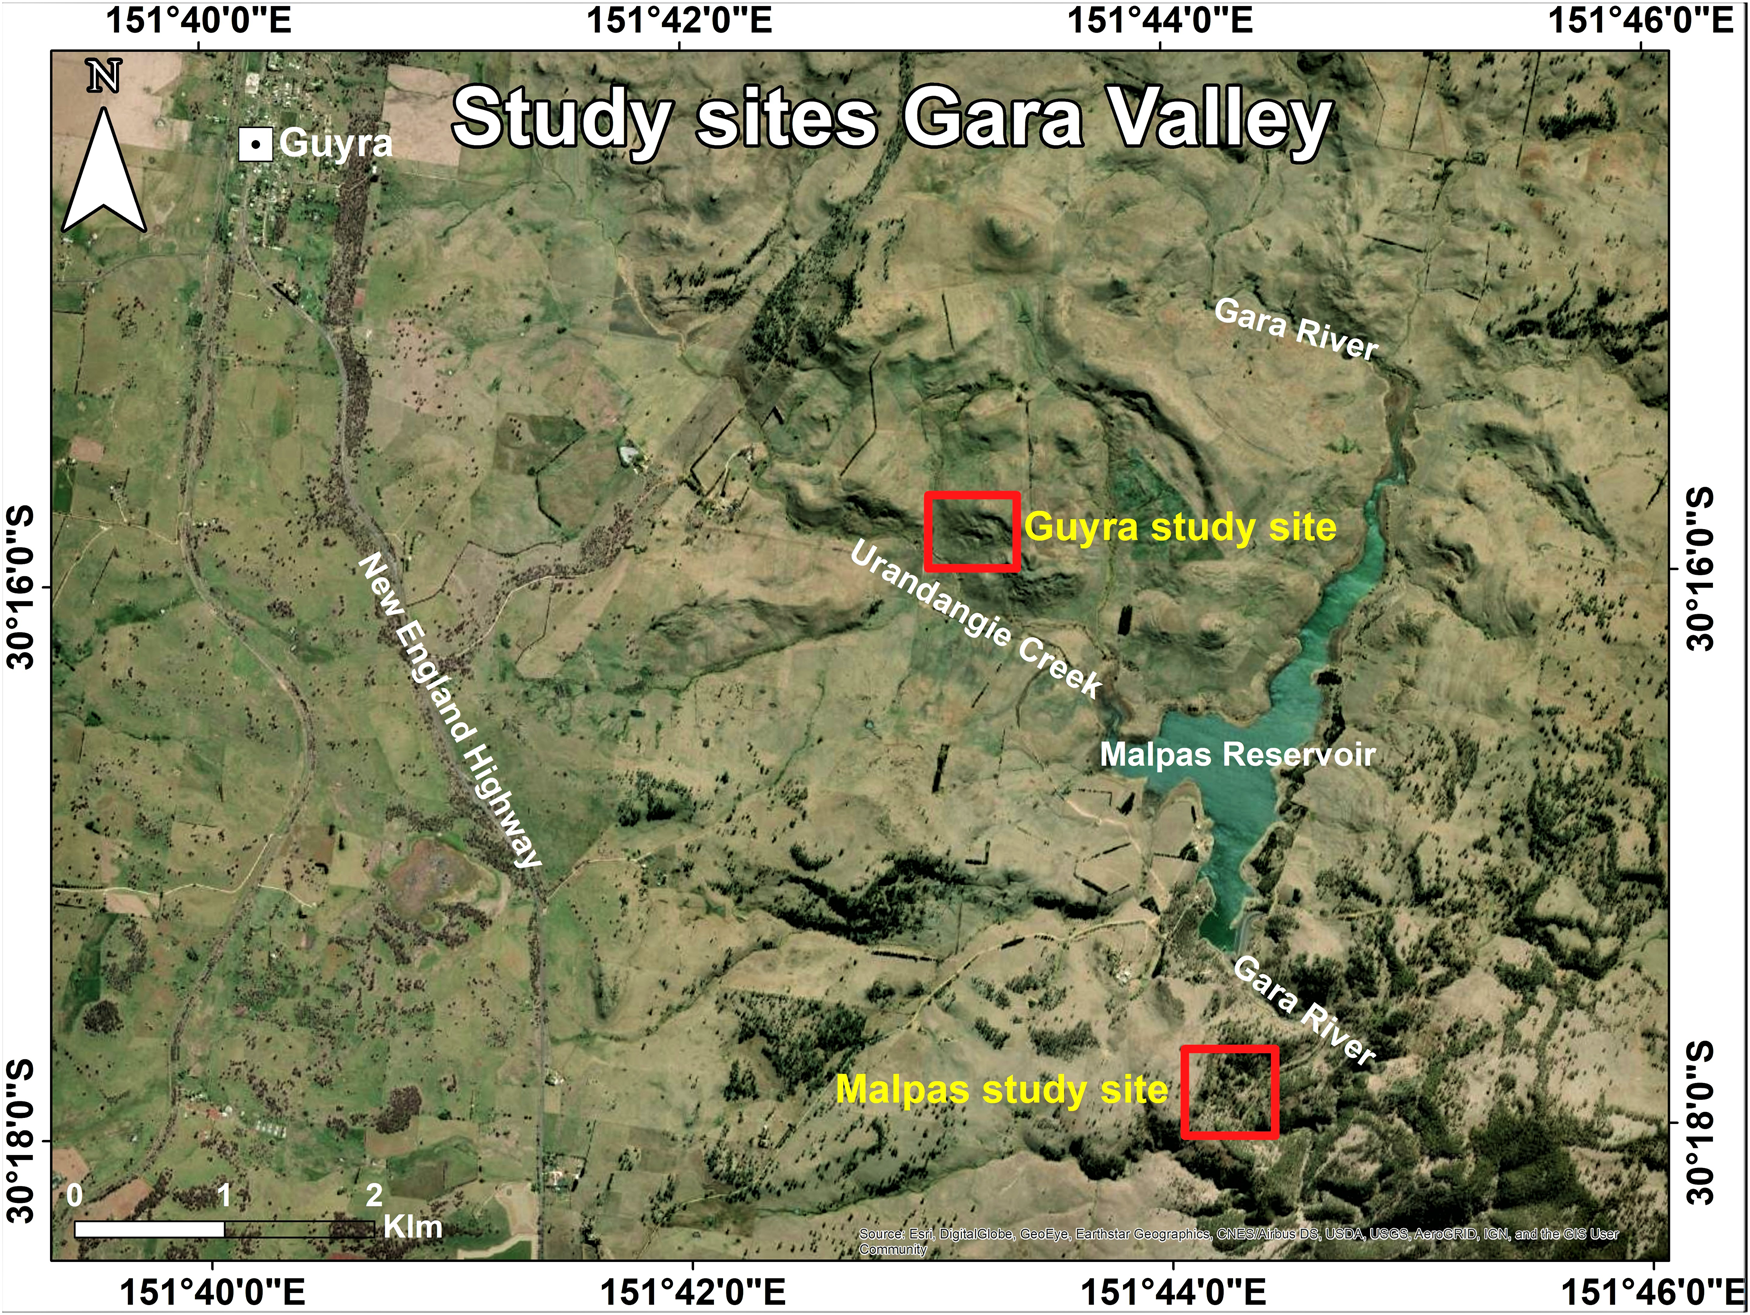
Block deposits are common in the New England Tablelands, such as in the Gara Valley (Fig. 2), and the Hunter River Valley adjacent to the upper slopes of the eastern Liverpool Range, and western slopes of the Barrington Tops (Fig. 1). Notable block deposits are found around the Malpas reservoir, at Tamarang Mtn, Mt Temi, and below the summit of Crawney Mtn down to altitudes of ~700 m asl. Mt Bin Ben is one of several isolated basaltic peaks and rounded plateaus that rise to >1000 m asl in the southern Hunter Valley. These summits feature block deposits mainly located on south and south-eastern slopes. Four locations were chosen for study at Guyra, Malpas, Mt Temi, and Mt Bin Ben.
Study sites in the vicinity of the Malpas Reservoir, Gara Valley.
METHODS
Geomorphology
Sites were individually mapped using satellite and aerial imagery and altitude, area and aspect were recorded. Depth (where possible) and surface features such as lobes and pits were measured in the field. Slope angle and distance measurements were made along a longitudinal transect on the Malpas blockstream to provide a comparison with similar deposits. Adjacent to the transect, clast orientation and a, b, and c axes of 50 randomly selected blocks were measured in the upper and middle sections. Clast orientation of 50 blocks was also measured on the Guyra 1 blockstream.
Temperature monitoring
Air and ground temperature measurements were made at the Guyra site. Maxim DS1922 miniature temperature loggers were installed at ground level and 60 cm above the surface on stakes at Guyra 2 blockstream at the top of the hill (~1270 m asl), and at the valley floor (~1210 m asl). The 60 cm loggers were not shielded from direct solar radiation or from the wind. The focus was on minimum temperatures and unshielded loggers reflect the potential temperatures of rock at the study site. The loggers were bagged to make them waterproof and installed in pairs to provide some redundancy against failure or damage from animals. Temperatures were recorded hourly from April 2012 to October 2013, giving two full winter seasons of records for the top of hill and valley floor loggers. At the Guyra 1 blockstream, loggers were lowered 40 cm into voids between boulders of the blockstream with the aim of observing the temperature regime at shallow depths. A period of seven months from April to October 2013 was recorded for the Guyra 1 blockstream. The temperatures were recorded at instantaneous hourly intervals to conserve memory because each logger could store only 2.5 months’ worth of data.
Exposure dating
Site selection
Samples were collected for exposure dating at each of the four studied locations. The sites presented several challenges. Periglacial settings can produce both significant inheritance where there is limited physical erosion prior to block production, and the possibility of minimum exposure ages if the deposit moves after formation (Barrows et al., Reference Barrows, Stone and Fifield2004). We attempted to minimize the chance of sampling blocks with inheritance or those that may have moved after emplacement at each of the sites. Samples were collected from the tops of the largest (preferably >1 m diameter), most stable basalt boulders within the block deposits. Boulders that showed evidence of spalling or unusual weathering were avoided. Coordinates and altitude were determined using a GPS in the field. Horizons and topographic shielding were measured using a compass and clinometer. Site data are presented in Table 1.
Site data for exposure ages

1 Basalt; ρ = 3.0 g/cm3; Λ = 160 g/cm2
Malpas blockstream
The Malpas blockstream was the most suitable setting of all the sites for exposure dating because the steep, 25 m slope at the top of the main blockstream provided a potential source for production of shielded blocks. Only blocks derived from the top of the scarp or from the initially exposed side of the scarp are likely to contain an inherited signal. To detect possible inheritance and to try to determine the likely period of formation, we sampled nine blocks (MAL-01 to MAL-09) down the full length of the deposit (Fig. 6).
Guyra blockstream
Blocks comprising this deposit appear to have been derived from a small landslide in the lower face of a much larger block slide. Without any evidence of blocks being generated at an existing rock face, the potential for inheritance is high. We sampled two blocks (GUY-03, GUY-04) on either side of the matrix-free center of the deposit and one block (GUY-05) in the middle. The blocks on the side likely record an inherited signal, whereas the middle block is likely to have experienced a partially shielded exposure history during transport because of likely partial (or complete) burial during transport (cf., Barrows et al., Reference Barrows, Stone and Fifield2004).
Mt Temi blockstream
The blocks in this deposit originated from the steep bedrock slope and a scarp at the south-western upper edge of the deposit. Weathering rinds and an absence of fresh spalling on the free face indicate that block production has ceased for a substantial period. To determine the timing of last block production, we collected two samples (TEM-01, TEM-02) at a depth of 4.1 m and 2.5 m respectively, below the top of the outcrop. These samples have high shielding corrections because of the cliff face. Four additional samples (TEM-03 to TEM-06) were collected from the largest blocks in the blockstream. Block selection here was problematic due to the steep nature of the slope (15–30°). There was evidence that blocks <0.5 m in diameter were moved by gravity or animal disturbance because blocks were positioned with their lichen-free faces exposed at the surface and were observed ramping up onto a fallen log.
Mt Bin Ben blockslope
Despite the large size of the Bin Ben deposit, there was no free face at the head of the deposit, suggesting the blocks have been generated by in situ shattering of bedrock high on the slope. Additionally, the small block size and steep slope meant that there were few areas to sample that had a low probability of recent remobilization. We sampled two of the largest blocks (BIN-01, BIN-02) from near the outer edge of a lower lobate bench at the northern end of the deposit.
Procedures
All of the deposits were developed on basalt, so 36Cl was chosen as the cosmogenic nuclide for dating. Whole rock 36Cl was measured because the fine-grained nature of the basalts prevented effective mineral separation. Samples were prepared following previously established procedures (e.g., Barrows et al., Reference Barrows, Almond, Rose, Fifield, Mills and Tims2013). The concentrations of major target elements for 36Cl production were determined using X-ray fluorescence (XRF). The concentrations of trace elements with large neutron capture cross sections (Gd and Sm) and neutron-producing elements (U and Th) were measured by inductively coupled plasma mass spectrometry (ICPMS). Chlorine content was determined by isotope dilution. The isotopic ratios 36Cl/Cl were measured by accelerator mass spectrometry on the 14UD accelerator at the Australian National University (Fifield et al., Reference Fifield, Tims, Fujioka, Hoo and Everett2010). Exposure ages are calculated using the scheme of Stone (Reference Stone2000). All analytical errors are fully propagated on individual ages. All ages in the text are reported at one standard deviation.
RESULTS AND INTERPRETATION
Geomorphology
Nineteen significant block deposits varying from 40 m to almost 400 m in length and covering areas of up to 3.6 ha were mapped at the sites. Individual features are described in the following sections.
Malpas blockstream
The 340 m long Malpas blockstream (30°17′9″S, 151°44′17″E) is located to the south of Malpas Reservoir on the western slopes of the Gara River Valley (Fig. 2). The blockstream is fed from two steep upper slopes, both at a starting elevation of ~1270 m asl. The northern bedrock source has no cliff line and blocks appear to have been generated at the surface. The southern source has a more pronounced arcuate form and the deposit below this slope is topographically pronounced and mostly unvegetated. The blockstreams merge about halfway down and narrow into a single line of blocks within a broad gully. The blockstream covers 1.24 ha on an E- to SE-facing slope (orientation 87° above the confluence of the blockstreams and 140° below the confluence). The blockstream drops 85 m in altitude over its length from ~1255–1170 m asl. This is a minimum extent, because prior to track construction at the base of the deposit, it is possible the deposit extended to the valley floor at an altitude of 1145 m asl. The blockstream thickness is 2 m in the lower section (as measured at the track cut), but unknown in the upper parts. The blockstream source cliffs are basalt, but most of the deposit overlies weathered Sandon Beds.
The transect on the Malpas blockstream reveals three distinct sections (Fig. 3A). The upper 72 m long section starts at the foot of the head wall, which has a slope of 38°. Within 30 m, the slope angle decreases to 17°, and this upper section ends in a lobate topographic step that has a slope of 19° over a distance of 18 m. The deposit comprises openwork blocks, indicating vertical sorting and a post-Pleistocene lack of fine-grained sediment infilling at the site. Average a- and b-axis lengths are 41 cm and 28 cm, respectively; maximum a- and b-axis lengths are 65 cm and 42 cm, respectively (Fig. 3B). The a-axis trend and plunge direction reveal no strong clast orientation and a wide range of dips averaging 24.7° (0–65°) downslope. The middle section of the deposit lies on a slope averaging 11°. There are a number of steps and lobate forms that have slopes varying from flat benches to 22°. The blocks are sub-angular, with average a- and b-axis lengths of 39 cm and 24 cm and maximum lengths of 75 cm and 45 cm, respectively (Fig. 3C). Dip directions showed a bi-modal imbrication with a strong downslope alignment of 130°SE and a secondary trend of 73°NE. Gradients below the confluence the lower section of the blockstream are <11°. Clast orientation diagrams indicate down-slope transport by sliding and rolling.
(A) Transect of the Malpas blockstream separated into three distinct topographic sections associated with changes in slope and blockstream morphology. (B) View of the upper deposit with stereonet of clast orientation. (C) View of the middle section of the deposit with stereonet of clast orientation; note the bimodal 130°SE and 73°NE shallow-dipping A-axis orientations. The upper deposit is circled in the background. The upper deposit displays randomly oriented clasts some with steep dips. This section of the deposit appears to have no dominant fabric. Larger boulders in (B, C) are ~40–50 cm long (a-axis).
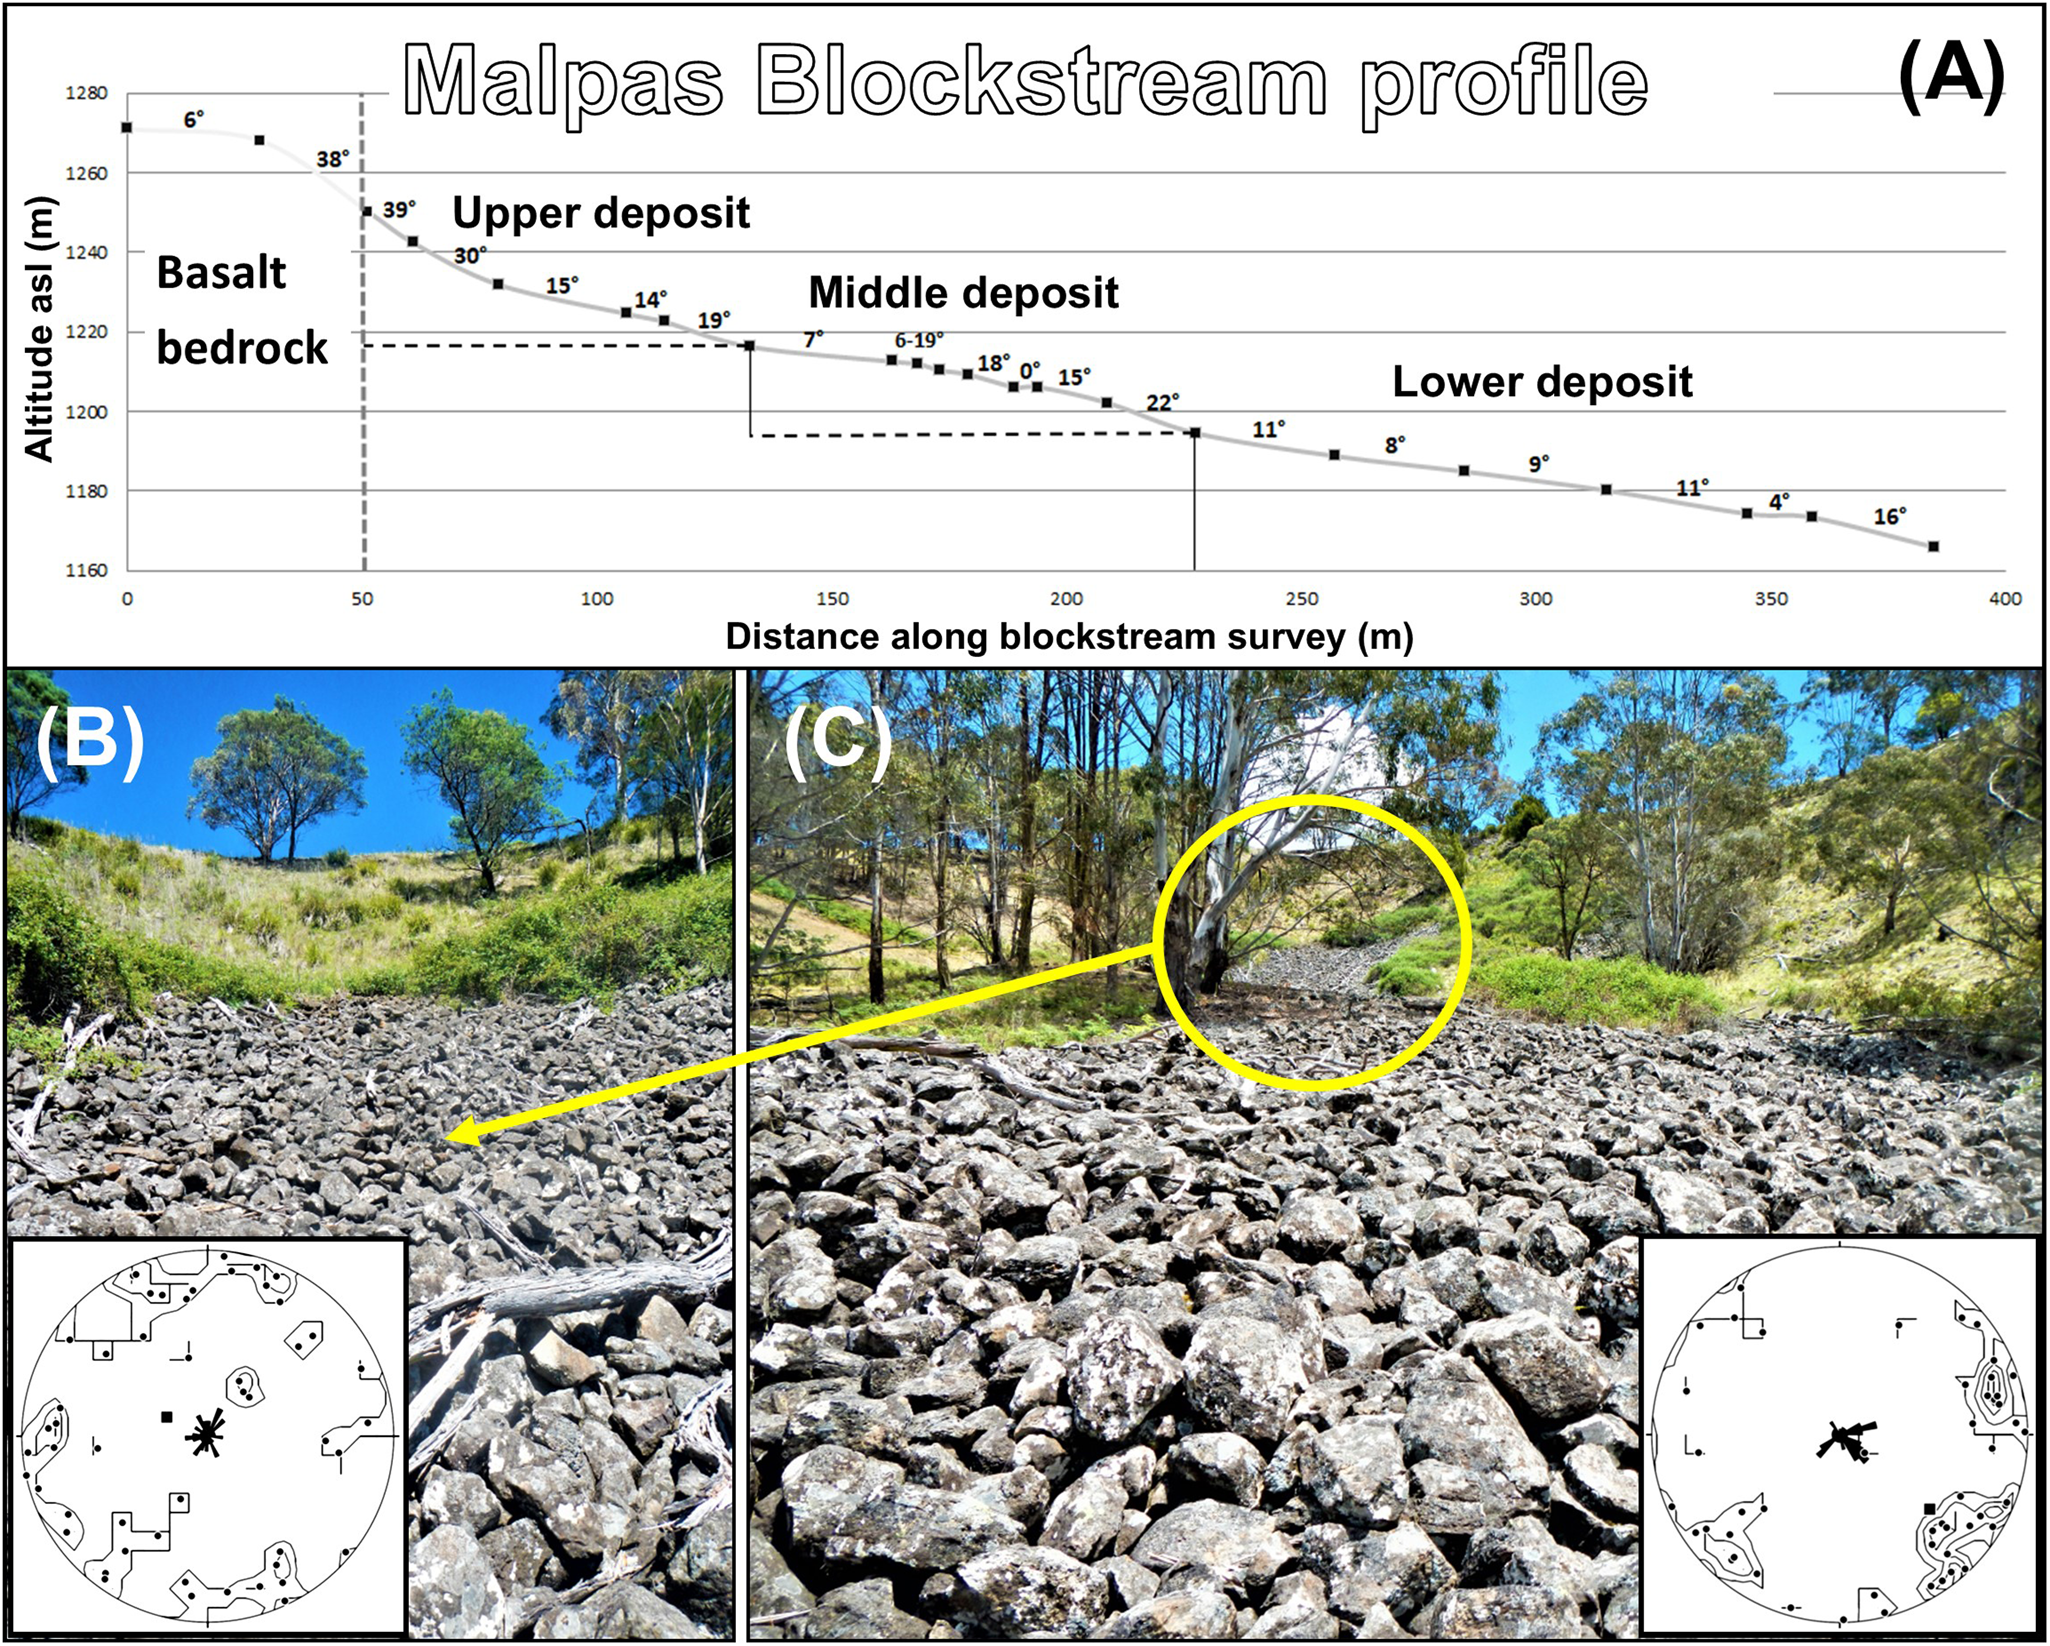
Pits up to 1.5 m wide and 1 m deep pockmark the surface of the upper part of the deposit. They are directly associated with lobes and steps that include transverse ridges and furrows of 0.5–1 m amplitude. The pits (~1 m diameter) are unlikely to be tree throws (e.g., Clinton and Baker, Reference Clinton and Baker2000). The depressions are circular in form and do not have the common hump associated with root ball rotation and uplift of the soil associated with tree fall (Beatty and Stone, Reference Beatty and Stone1986). Also, trees are not currently growing within the blocks under current climate conditions. Therefore, it is likely that the pits formed at the same time as the blockstream and are associated with ground ice melt. The exact nature of pit formation is unknown.
Adjacent to the Malpas blockstream is an angular matrix-supported colluvial deposit that appears to have formed by frost cracking of the Sandon Beds and downslope movement by solifluction. This deposit is similar to colluvial deposits described by Lynn et al. (Reference Lynn, Manderson, Page, Harmsworth, Eyles, Douglas, Mackay and Newsome2009), McIntosh et al. (Reference McIntosh, Eberhard, Slee, Moss, Price, Donaldson, Doyle and Martins2012), and Longhitano et al. (Reference Longhitano, Sabato, Tropeano, Murru, Carannante, Simone, Cilona and Vigorito2015).
Guyra blockstreams
Located 100 m below a landslide back wall, the Guyra 1 blockstream originates from a rotational blockslide. The upper slopes are largely vegetated and the blockstream is inactive at present. One key feature of this blockstream is that the local headwall is not part of the main slope but part of a detached landslide block. It is possible that the boulders in the blockstream were originally generated when this area was still part of the main hill slope. Formation of the blockstream itself post-dates formation of the landslide as it is flows across the surface of the slump block with no evidence of displacement by recent landslide movement.
The blockstream initiates at 1240 m asl, and extends over an elevation difference of 29 m and a length of ~90 m. It is located on a WSW- (236°) facing hill slope and has a headwall source at the top of the hill that is disconnected from the current blockstream by many tens of meters. The upper 15 m section of the deposit has a slope of ~30°, below a slope of 35° from which the blocks were derived, before slopes decline to 9–15° in the middle 50 m. Slopes steepen again to 18–25° over the lower 25 m of the deposit. The toe of the deposit lies immediately above a spring seep. The deposit is composed of basalt boulders and the blocks have typical a-axis lengths in the range of 30–60 cm. The deposit is at least 1 m thick and is reverse graded with small boulders and cobbles (a-axes of 10–20 cm) underlying the larger surface boulders. A-axis orientations from the center and lower reaches of the blockstream are directed to 220° (downslope) (Fig. 4). A shallow concavity lies near the head of the blockstream. A linear depression extends along the middle of the blockstream in the lower 40 m.
View of the Guyra 1 blockstream with sample GUY-05 circled. The stereonet shows the downslope orientation of 50 blocks from the lower part of the deposit.

The Guyra 2 blockstream to the north of the Guyra 1 blockstream was not studied in detail. It consisted of a short blockstream extending from the top of the scarp to a flat-lying block deposit adjacent to a blockslide. The formation of the flat-lying deposit must post-date the landslide.
Mt Temi blockstream
The site lies immediately below the western face of Mt Temi (1254 m) at an altitude of 1225–1090 m asl (Fig. 8A). The deposit has a basalt headwall up to 4 m high. The deposit is largely inactive but, as noted above, there is small-scale re-activation of blocks on the steeper parts. The largest blockstream has an aspect of 292°, covers ~1.6 ha, and is 300 m long. The gradient declines downslope from ~30° at the top to 15° near the base. In the lower two-thirds of the deposit there are topographic steps in the form of small (<30 cm) terraces and a <1 m tall frontal lobe at the base. The deposit consists of sub-rounded to sub-angular cobbles and small boulders having an a-axis length of 15–30 cm (90%) and sub-rounded boulders having an a-axis length up to 2 m (10%). The deposit is connected to the source headwall by a scree of sub-angular to angular clasts (a-axis length <10 cm). There are both steps (Fig. 8B) and localized levees on the deposit.
Mt Bin Ben block deposits
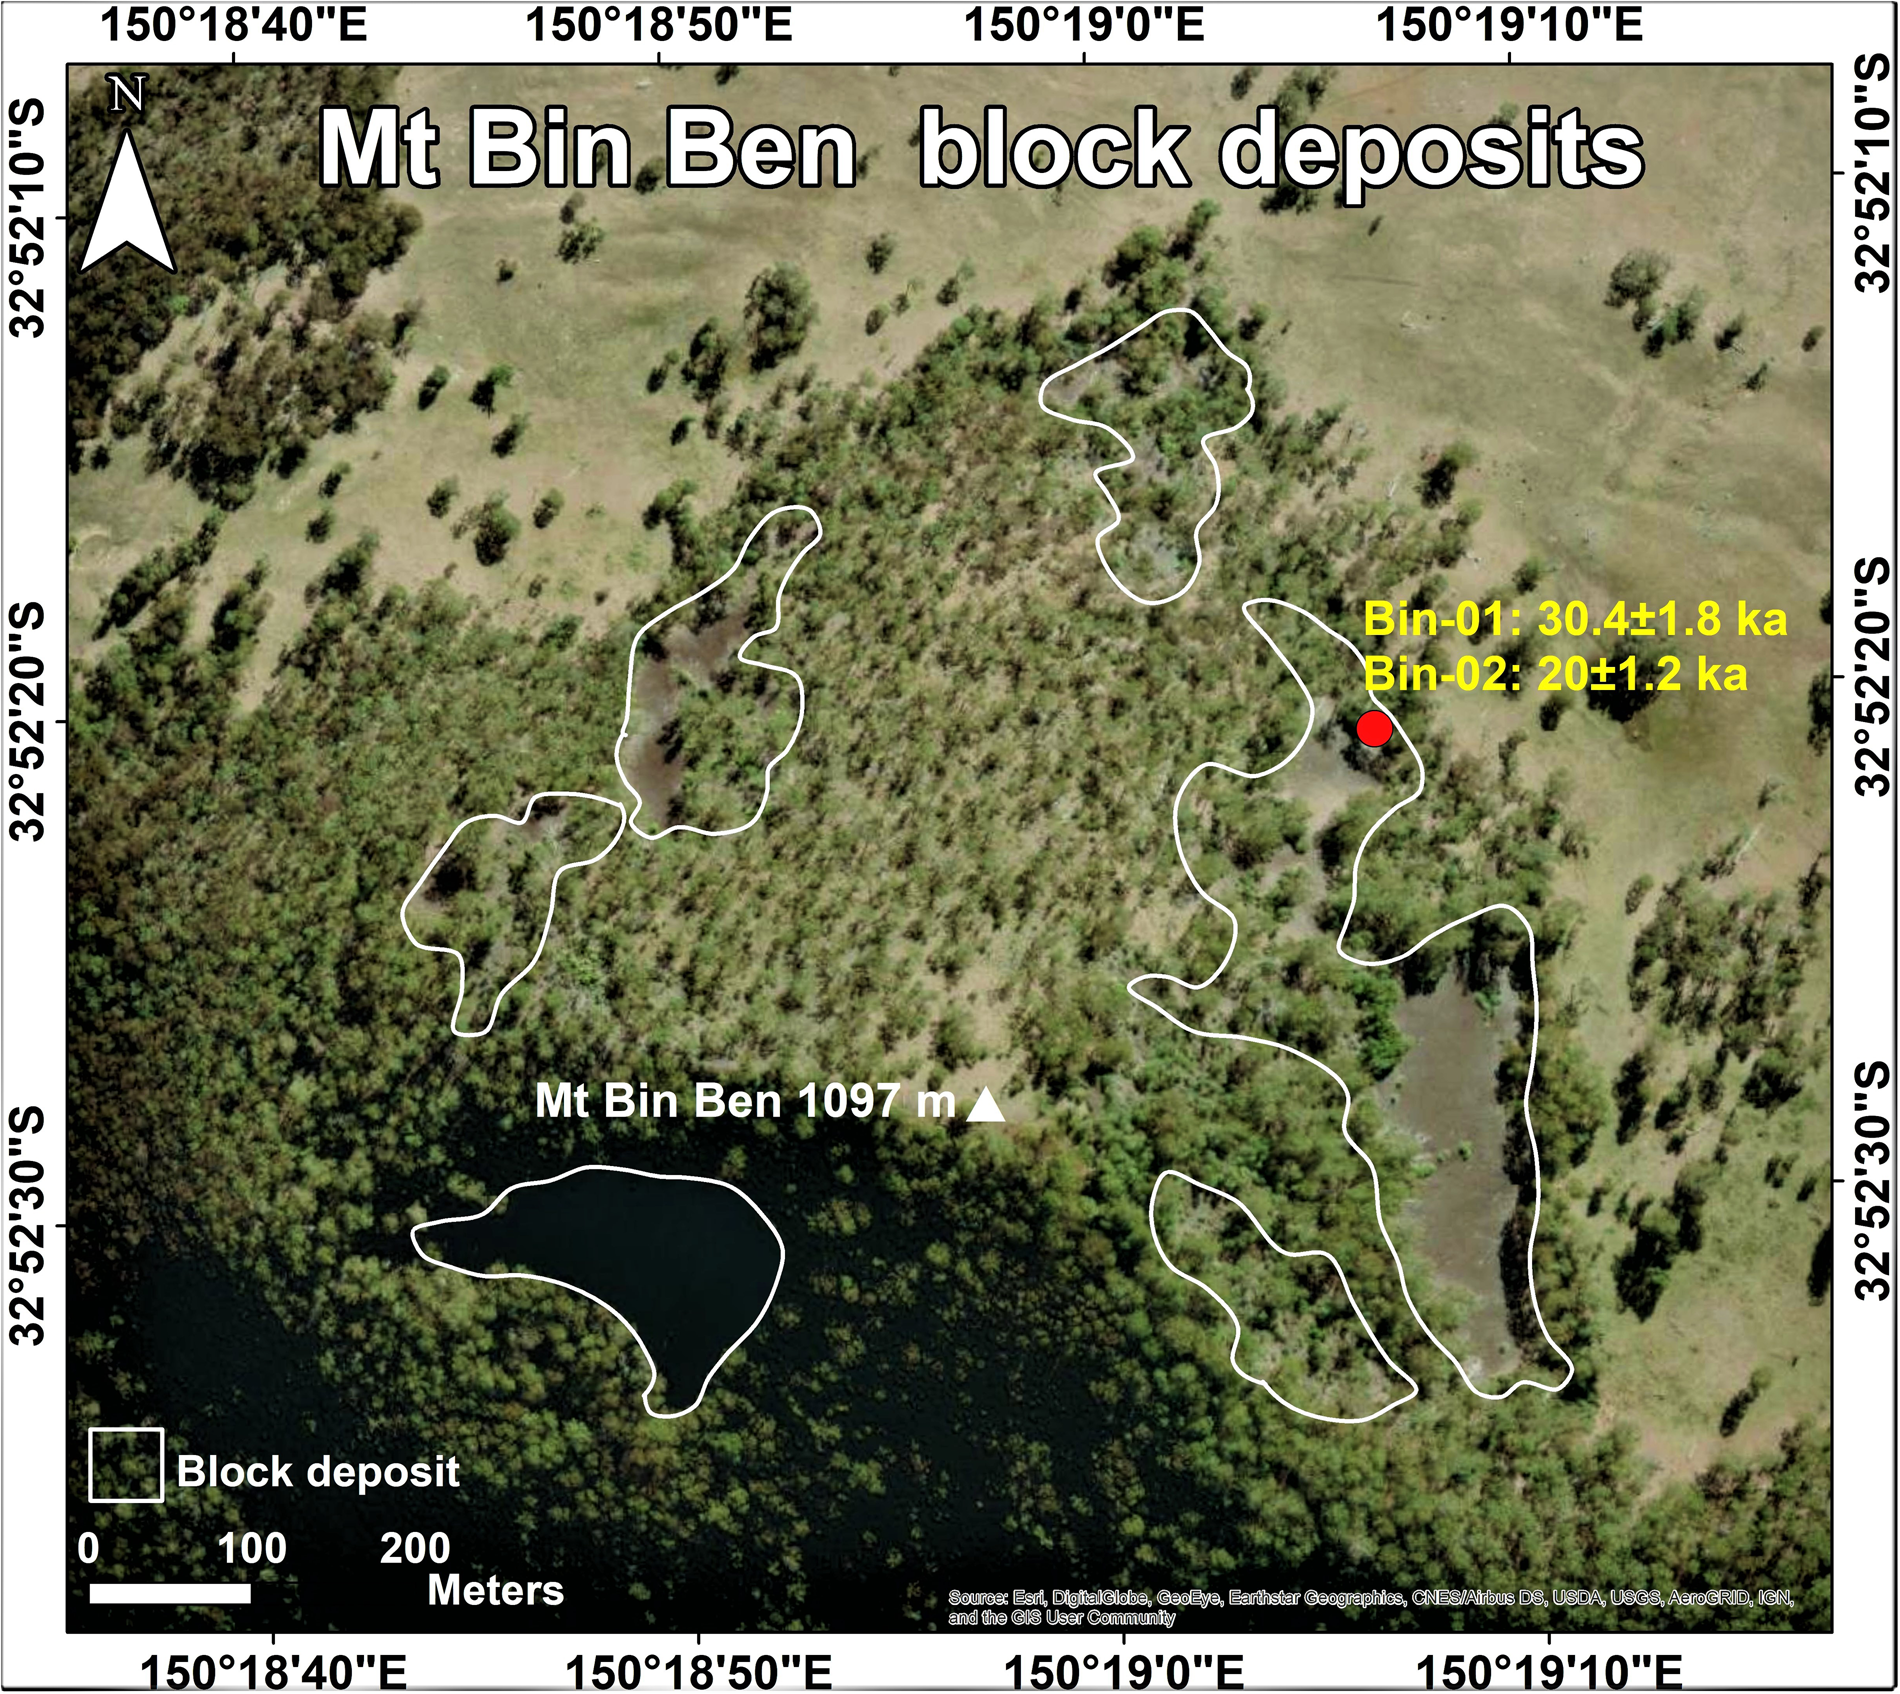
Block deposits occur on all sides of Mt Bin Ben to a minimum altitude of ~915 m. The largest deposit is 3.2 ha on the northeast slopes. This blockslope consists of an extensive accumulation of large cobbles to small sub-rounded boulders, generally 20–60 cm in a-axis length. The deposits at this site are different from the blockstreams and blockslopes described here in that they are finer and do not possess a distinct source area (Fig. 9). Hence, while the upper section of the blockslopes are near the angle of repose (25–35°) and could be defined as coarse screes, there are no cliffs from which the boulders comprising the deposits could be sourced. The lower sections of both deposits feature low-angle benches and lobate outer risers and a concave plan form profile. These deposits form steep slopes giving way to flatter apron areas at their foot. They are strongly concave in cross section.
Temperature monitoring
No significant difference was found between the 60 cm height and 0 cm height temperature records at each recording site. Figure 5 presents the air temperature for the top and base of the slope at the Gara locality: Figure 5 (top) is the log from the 60 cm logger; Figure 5 (bottom) represents the 0 cm log, with some missing data patched with data from the 60 cm record. Two factors are apparent comparing these graphs. The first is that there is difference in the variation in the magnitude and frequency of sub-zero temperatures recorded. The top of the slope recorded 109 days <0°C (Fig. 5). At the base of the slope, there were 129 nights with temperatures <0°C (Fig. 5). This demonstrates temperature inversions and strong effects from cold air drainage down a slope of only 60 m. Mean annual temperature (April 2012 to April 2013) shows the same trend, with the valley floor site on average ~1°C cooler (11.9°C) than at the top (12.8°C). Mean winter temperature for 2012 and 2013 (June to August) at the top was 4.9°C and 6.0°C compared to 4.4°C and 5.7°C at the base, respectively.
Temperature records for the hill top and valley floor at the Guyra study site from April 2012 to October 2013. Blue lines are temperatures recorded by the loggers at each location, red lines are the 30-day moving average temperatures. Note the variation in temperature and diurnal oscillation from the top to bottom of slope with cold air drainage affecting the lower site.

The second factor is the large diurnal variation. Diurnal temperature oscillations of between 25–32°C are common throughout the year at the base of the slope and during summer at the top of the hill. Reduced temperature oscillations of 10–15°C during the winter months at the top of the hill may be related to the exposure of this face to westerly winds during this season, reducing the effect of radiative cooling. Evidence of modern frost heave was observed at the toe of the Guyra 2 deposit in the form of overturned blocks and a buried sheep skull. No modern downslope block movement was observed.
The nearest weather station is Guyra Hospital weather station (BoM, 2022), which is located on a plateau at an elevation of 1330 m asl in the Guyra township 8 km to the NW of the field area. Observations here do not show nearly as much temperature fluctuation as at the field site. This is likely to be a cumulative effect of the location of the Guyra Hospital weather station on a flat high-elevation site not conducive to cold air drainage and the use of a Stevenson screen for recording temperature. Guyra Hospital recorded 51 and 25 days with temperature minima below 0°C during 2012 and 2013, respectively, and relatively warm absolute minimum temperatures of −4.7°C and −4.5°C. This is 1.5°C warmer than the hill top site at Guyra and much warmer (8–9°C) than the Guyra valley floor. Temperatures more comparable to the Guyra field site are recorded from weather stations located in nearby valleys. For example, Woolbrook (910 m asl, 88 km southwest of Guyra) has a record minimum of −14.5°C (BoM, 2022). Comparison of records from the Guyra study site and the Woolbrook weather station confirms that diurnal temperature oscillations on the Northern Tablelands are greater in valley floor settings as a result of significant cold air drainage and pooling.
Temperatures recorded from the logger installed within the Guyra 1 blockstream (Fig. 10) revealed low diurnal oscillations associated with thermal buffering in accordance with similar, more detailed thermal studies of block deposits in Alberta (Harris and Pedersen Reference Harris and Pedersen1998, Japan (Sawada et al., Reference Sawada, Ishikawa and Ono2003), and Austria (Wagner et al., Reference Wagner, Pauritsch, Mayaud, Kellerer-Pirklbauer, Thalheim and Winkler2019). The data also revealed temperatures at or below freezing for ~2 months during winter. These results clearly show the effects that shielding and air piping into sub surface voids can have on reducing diurnal oscillation and maintaining mild temperatures.
Exposure Dating
The seven exposure ages from Malpas range from 14–55 ka (Fig. 6, Table 2). One group of ages (14.2 ± 0.9 ka [MAL-07], 15.4 ± 0.9 ka [MAL-08], and 15.9 ± 1.4 ka [MAL-09]) centers on the last deglaciation. The lower section of the blockstream has ages of 18.6 ± 1.1 ka (MAL-02), 26.2 ± 1.5 ka (MAL-01), and 38.8 ± 2.3 ka (MAL-04). The oldest age of 55.4 ± 3.1 ka (MAL-03) was sampled from the northern arm of the deposit. The Guyra site (Figure 7) was the most difficult site to attempt to date, because there is no clear resetting mechanism. We attempted to constrain the age of the deposit by exploring shielding on a block within the blockstream (GUY-05). However, this block has a greater apparent age (73 ka) than either of the blocks set in the adjacent slope (51.8 ± 3.8 [GUY-03]; 56.0 ± 4.2 [GUY-04]). Therefore, the 36Cl content of these rocks is more representative of the age of the landslide at the site than erosion from it. Additional samples from the top of the landslide have a similar age (unpublished data).
Map of the block deposits at the Malpas site, showing the location of the blockstream and exposure ages. The lower map shows the simplified geomorphology of the site.

Map of the block deposits at the Guyra site. The locations of blockstreams are marked with solid white lines. The main landslide scarp and detached block scarp are marked. Exposure dating was performed on Guyra 1 blockstream. The figure also shows the locations of the base of slope and top of slope temperature loggers as well as the location of the temperature logger installed within the Guyra 1 blockstream.

Exposure age data
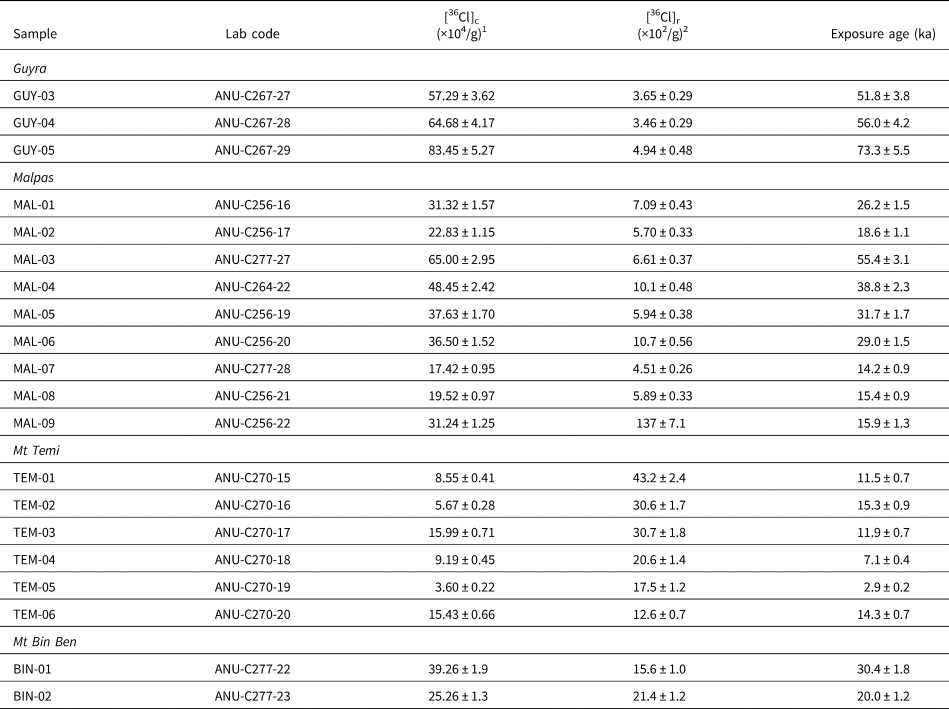
1 C = cosmogenic component
2 R = background nucleogenic component
Data are normalized to the GEC standard (36Cl/Cl = 444 × 10−15).
Carrier 36Cl/Cl = 1 × 10⁻¹⁵
36Cl decay constant (2.3 × 10⁻⁶)/yr
The two samples taken from the free face near the summit of Mt Temi (Fig. 8) had exposure ages of 11.4 ± 0.7 (TEM-01) and 15.3 ± 0.9 ka (TEM-02). The other four samples ranged in age from 2.9 ± 0.2 ka (TEM-05) to 14.3 ± 0.7 ka (TEM-06). The two exposure ages from Mt Bin Ben were 30.4 ± 1.8 ka (BIN-01) and 20 ± 1.2 ka (BIN-02) (Fig. 9).
Map of the block deposits at Mt Temi (white outlines) showing exposure ages. (A) View of Mt Temi summit with blockstream. (B) Shallow steps located on the middle section of the block deposit; larger boulders are ~50 cm long (a-axis). (C) View of the middle Mt Temi blockstream towards the backwall; the large boulder is ~1.5 m long (a-axis).

Map of the block deposits (white outlines) at Mt Bin Ben showing exposure ages.
DISCUSSION
Chronology
The exposure ages from the New England block deposits fall almost entirely within the last glacial cycle. Two potential issues affect exposure ages in block deposits: inheritance and post-depositional movement (Barrows et al., Reference Barrows, Stone and Fifield2004). Inheritance is very likely at the Guyra site where there is no clear source of block production. At Mt Bin Ben and Malpas there is extensive block production, and inheritance is minimized at these sites. However, it is likely that MAL-03, and probably MAL-04, MAL-05, and MAL-06, contain some inheritance, so caution is needed in interpreting these ages as block production before the height of the last glacial maximum (LGM) at ca. 21 ka (Barrows et al., Reference Barrows, Stone, Fifield and Cresswell2002). Inheritance at Mt Temi is least likely because of the presence of vertical faces. Post-depositional movement can be ruled out at Guyra and Malpas because of the low-angle slope where the blocks are fixed within a matrix. The slope is steeper at Mt Bin Ben, but there was no obvious movement at this site where the surface architecture of the deposit appeared intact. Post-depositional movement is most likely at Mt Temi (there was obvious mobilization of small blocks at the edges and in thinner parts of the block stream). Although we attempted to avoid unstable areas, TEM-04 and TEM-05 have moved within the Holocene and TEM-01 and TEM-03 must be considered minimum ages.
In summary, the exposure ages from the Malpas site group within late MIS 3 and extend into early MIS 2. The grouping of ages of MAL-07, 08, and 09 between 14.2–15.9 ka likely represents the time when the deposit became inactive. The Mt Temi and Mt Bin Ben data suggest block production at or shortly after the LGM. These late LGM ages are consistent with ages of 17–24 ka from the Ravine blockstream in the Snowy Mountains and similar ages near Mt Hotham in Victoria (Barrows et al., Reference Barrows, Stone and Fifield2004).
There is no dating evidence of block deposit formation on the New England Tablelands during the penultimate or earlier glaciations. There is no evidence for recycling or burial of deposits and preservational bias. In Tasmania, block deposits are widespread (Caine Reference Caine1983; Slee and Shulmeister Reference Slee and Shulmeister2015) and the largest block deposits, such as those on Ben Lomond and Mt Wellington, are up to 2 km long, tens of meters deep, and hectares in aerial extent (Davies, Reference Davies1958; Caine, Reference Caine1983). The size and complexity of the Tasmanian block deposits indicate a long developmental history, and dating on Ben Lomond and Mt Wellington suggests these deposits have a history spanning several glacial cycles (Barrows et al., Reference Barrows, Stone and Fifield2004). The altitudes of these sites at higher latitudes mean that the highlands of Tasmania have experienced long and more-frequent periglacial activity compared to the New England Tablelands. In contrast, the extent of block production in the New England Tablelands indicates that conditions have been much more marginal through time and that periglacial conditions were likely brief and only during maximum cooling.
Mechanisms of block deposit formation
Openwork deposits are common in mountainous areas and can be produced by debris flows, occasionally on alluvial fans, as talus accumulations (Sanders and Ostermann, Reference Sanders and Ostermann2011; Boelhouwers et al., Reference Boelhouwers, Fager and De Joode2012), and through the action of ice. Debris flows can be associated with lobate patterns, but generate levees, which are absent in all but the Mt Temi deposit, which shares no other morphological features. Alluvial fans can be openwork where there are sieve deposits. Our deposits are inversely graded and do not have the catchments of alluvial fans. There is no evidence of repeated flow, as is found in sheetwash winnowing (Blikra and Nemec, Reference Blikra and Nemec1998; Sanders and Ostermann, Reference Sanders and Ostermann2011). The most common openwork block deposits in mountainous areas are talus slopes. Talus usually takes the form of cone-shaped deposits formed by rock spalling and simple downslope movement by gravity (e.g., Hales and Roering, Reference Hales and Roering2005; Reference Hales and Roering2009). The New England block deposits are well below the angle of repose and do not share any other morphological features with talus. Despite this, there is a close association of our deposits with screes. At Mt Temi, the blockstream is separated from the headwall by a scree. The gradient and length of the Malpas deposit, the ridging and pitting evident on its surface, the lack of any noticeable downslope size sorting of the deposit, and the change in orientation of the lower section of the deposit clearly indicate that this deposit once flowed. While the other sites are not as well developed, they all display similar characteristics. Morphologically, the deposits are blockstreams similar to those described elsewhere in the world (e.g., Boelhouwers et al., Reference Boelhouwers, Holness, Meiklejohn and Sumner2002; Seong and Kim, Reference Seong and Kim2003; Firpo et al., Reference Firpo, Guglielmin and Queirolo2006; Gutiérrez and Gutiérrez, Reference Gutiérrez, Gutiérrez, Gutiérrez and Gutiérrez2014; Oliva et al., Reference Oliva, Serrano, Gómez-Ortiz, González-Amuchastegui, Nieuwendam, Palacios and Pérez-Alberti2016; Rhee et al., Reference Rhee, Seong, Jeon and Yu2017) and to those that have been described and mapped from sites in the Australian Alps and Tasmania (Caine, Reference Caine1983; Barrows et al., Reference Barrows, Stone and Fifield2004).
The mode of formation of blockstreams is a controversial topic (Wilson, Reference Wilson, Elias and Mock2013). Harris (Reference Harris2016) suggested two main major modes of formation: (1) dynamic blockstreams promoted primarily by interstitial ice and snow that transport blocks downslope (Rhee et al., Reference Rhee, Seong, Jeon and Yu2017), and (2) lag blockstreams that are associated with a pre-existing deep weathering profile being washed out by meltwater under periglacial conditions (Davies, Reference Davies1958; Caine, Reference Caine1983; Harris, Reference Harris2016). Relict blockstreams attributable to both the dynamic and lag modes of formation have been documented in Australia. Notable large lag or polygenetic blockstreams have been described from Tasmania (Davies, Reference Davies1958; Caine, Reference Caine1983; Slee and Kiernan, Reference Slee and Kiernan2014). These deposits contrast to blockstreams that developed during the last glacial maximum at locations in the Australian Alps, including the Toolong Range (Caine and Jennings Reference Caine and Jennings1968; Jennings, Reference Jennings1969) and Ravine (Barrows et al., Reference Barrows, Stone and Fifield2004), which display indications of limited but dynamic blockstream formation and are sourced from bedrock headwalls.
Both forms of blockstreams are represented in the Gara Valley. The Malpas deposit appears to be a good example of a dynamic blockstream. The production of blocks, their transport at low angles, the presence of pits, and lobes and steps that include transverse ridges and furrows strongly suggest ice-mediated flow of the boulders and the former presence of ice. In contrast, the Guyra 1 blockstream formed on an older landslide. It is detached from its probable source area by 100 m. The blockstream has no transverse ridges or lobes and no evidence of pitting. All these factors suggest limited movement and that the blockstream is mostly of a lag origin. The presence of a central depression in the lower part of the deposit may be the only evidence of interstitial ice.
Farther north, not all block deposits are likely to have a periglacial origin. Small block fields in basalt have been observed by the authors in the central Queensland highlands. Although past temperatures may have been cold enough to produce minor frost action in inland regions of Queensland, spallation by thermal expansion may best explain these block deposits. Granite blockfields in Queensland are clearly linked to deep chemically weathered profiles under tropical climates. These landforms are likely examples of equifinality and formed under different temporal and climatic contexts. However, the deposits described from the New England Tablelands are both significantly larger and show signs of flow that cannot be attributed to gravity or in situ weathering and indicate the presence of periglacial processes.
Climate
The sites described above provide evidence for both frost cracking and transport by periglacial processes in northern NSW. The relatively low elevation of the deposits supports significant cooling during cold periods of the Late Pleistocene, as previously predicted by Galloway (Reference Galloway1965). The modern temperature measurements and turnover of blocks at Guyra demonstrate that diurnal frost heave occurs under present-day conditions. However, there is no seasonal ice segregation or frost cracking. Frost heave requires temperature regimes that oscillate frequently above and below freezing (Matsuoka et al., Reference Matsuoka, Hirakawa, Watanabe, Haeberli and Keller1998), which is most pronounced in areas of strong diurnal temperature oscillation (e.g., Marshall et al., Reference Marshall, Roering, Bartlein, Gavin, Granger, Rempel, Praskievicz and Hales2015). The mean annual temperature of a region is important, in that frost cracking is most effective in environments that have mean annual air temperatures above 0°C, but which regularly drops below freezing (Boelhouwers, Reference Boelhouwers2004). Permanently frozen ground impedes frost cracking by reducing the availability of free moisture in the bedrock surface (Hales and Roering, Reference Hales and Roering2007). In contrast, while ground ice (including needle ice) and minor periglacial forms can be promoted by temperatures barely below freezing, observations and experiments have shown that a temperature of 0°C is generally not cold enough for frost cracking processes to be important (Hallet et al., Reference Hallet, Walder and Stubbs1991, Reference Hallet, Putkonen, Sletten, Potter, Gillespie, Porter and Atwater2004). Sustained periods with air temperature minima below about −3°C are needed for migration of ice within rock crevices to initiate frost cracking (Hallett et al., Reference Hallet, Walder and Stubbs1991, Reference Hallet, Putkonen, Sletten, Potter, Gillespie, Porter and Atwater2004). At the other extreme, once temperatures drop below −8°C (Walder and Hallet, Reference Walder and Hallet1986; Anderson, Reference Anderson1998; Hales and Roering, Reference Hales and Roering2005) expansion slows due to the lack of moisture movement in the rock, leading to reduced segregation ice (Matsuoka, Reference Matsuoka1991). Although laboratory studies (e.g., Draebing and Krautblatter, Reference Draebing and Krautblatter2019) indicate that the frost cracking window varies with rock type, generally effective frost cracking occurs where minimum temperatures fall between −3°C and −8°C (Andersen et al., Reference Andersen, Egholm, Knudsen, Jansen and Nielsen2015).
The temperature monitoring (Fig. 10) reveals that at a depth of 40 cm in the Guyra 1 blockstream, the diurnal oscillation is reduced to <5°C and the overall temperature of the blockstream closely follows the average winter air temperature on the surface. A temperature depression of 8°C would decrease temperatures below 0°C for ca. 2 months a year. This would increase to ca. 4 months with a temperature depression of 11°C (Fig. 10). At least 2–4 months below 0°C would be needed to reactivate these deposits by allowing segregation ice to form seasonally. However, the presence of persistent snow would complicate this model because of insulation of the ground surface, but conversely would provide additional moisture to the block deposit upon melting on warm days in winter. Although this temperature relates to ground temperatures, it also is likely to relate to a similar difference in air temperature, given the close relationship between the two.
Temperature record for the winter of 2013 from −40 cm within the Guyra 1 block deposit. Note the suppressed diurnal oscillation compared to the surface temperatures shown in Figure 5. The red line is the polynomial mean for the period. The two lines below show 8°C and 11°C reductions to account for possible LGM conditions on the site.

Enhanced breakdown of bedrock exposures by frost cracking is partly controlled by the moisture availability in rocks (Matsuoka, Reference Matsuoka1991; Sass, Reference Sass2004). There is evidence that eastern Australian climates were wetter ca. 30 ka (Reeves et al., Reference Reeves, Barrows, Cohen, Kiem, Bostock, Fitzsimmons and Jansen2013; Petherick et al., Reference Petherick, Moss and McGowan2017; Hesse et al., Reference Hesse, Williams, Ralph, Fryirs, Larkin, Westaway and Farebrother2018a, Reference Hesse, Williams, Ralphy, Larkin, Fryirs, Westaway and Yongeb) and colder (Barrows et al., Reference Barrows, Stone, Fifield and Cresswell2001, Reference Barrows, Stone, Fifield and Cresswell2002). The winters in New England are relatively dry, which may limit significant frost cracking more than temperature constraints. Enhanced moisture balance does not necessarily imply high precipitation. Decreased evapotranspiration, under cooler conditions, possibly combined with enhanced run-off generated by snowbanks and consequent snowmelt (e.g., Reinfelds et al., Reference Reinfelds, Swanson, Cohen, Larsen and Nolan2014) and loss of forest cover (Woodward et al., Reference Woodward, Shulmeister, Larsen, Jacobsen and Zawadzki2014) would increase moisture availability, especially in spring. This in turn could aid frost cracking of bedrock, and reduced vegetation would promote enhanced downslope sediment movement. This process connects periglacial processes with stream bank sediment aggregation events, as evinced by Fu et al. (Reference Fu, Cohen and Fryirs2019) in the upper Hunter Valley catchment draining the southern slopes of the New England Tablelands and neighboring Barrington Tops.
CONCLUSIONS
Block deposits of the New England Tablelands have morphological and sedimentological characteristics indicating that they formed under periglacial conditions. Exposure ages from four block deposits indicate that these landforms were active in the latter part of the last glaciation. This pattern is consistent with, and extends the work of, Barrows et al. (Reference Barrows, Stone and Fifield2004), which provides evidence of periglacial activity in the Australian Alps during the LGM. The modern climate only produces diurnal frost formation. A temperature difference of at least 8°C (Barrows et al., Reference Barrows, Mills, Fitzsimmons, Wasson and Galloway2022) would likely produce the seasonal ground ice conditions that are necessary to form the deposits. These deposits provide the best insight into the extent of Pleistocene cold climate processes in the central part of eastern Australia.
Acknowledgments
We acknowledge the various landowners who granted access to the study sites throughout the New England region, during both the exploration and research stages of this study. We thank Dr. Peter McIntosh of the Forest Practices Authority for proofreading an early draft and providing feedback. We are grateful to Peter Wilson, Martin Brook, Stefan Winkler, and an anonymous reviewer for comments that improved the manuscript.
Financial Support
The work was funded from ARC Discovery grant DP110103081 “The last glaciation maximum climate conundrum and environmental responses of the Australian continent to altered climate states.”


 Open access