
Introduction
This article describes the development of rural migration in northern Sweden (1850–1950). During this time, Sweden developed rapidly, becoming increasingly industrialised and urbanised. However, the process and progression of urban/industrial development can vary widely between and within countries, depending on factors such as socio-economic structures and geography. In northern Sweden, the rate of urbanisation was substantially lower than elsewhere in the country during industrialisation.
Northern Sweden was largely a sparsely populated periphery dominated by smallholder agriculture until extensive industrial development began in the late nineteenth century. The industrial expansion mainly occurred in the primary sector, especially in the timber industry. Therefore, a large and dispersed rural-industrial workforce developed during the late nineteenth to mid-twentieth centuries to supply the northern industries with raw materials. For example, in the case of the timber industry, this meant logging and transporting timber to the saw (and later pulp) mills along the coast. This economic structure will henceforth be called decentralised industrialisation in this article, and the concept will be further discussed in the next section.
This article proposes that the decentralised industrialisation of northern Sweden introduced inertia to the regional urbanisation process during the first half of the twentieth century. The main argument for this is that the rising labour demand in rural areas counterbalanced the rising urban labour demand, lowering the rural-to-urban migration rate. If decentralised industrialisation did introduce inertia to the urbanisation process, we would also expect the following to be true: Firstly, men are expected to have been more affected by the inertia, as the rural industrial labour market was mainly male-oriented. Secondly, the rural-to-urban inertia is expected to have dissipated as rationalisation in agriculture and the primary industries (mainly timber) decreased the need and availability of rural-industrial labour during the course of the twentieth century.
The study aims to investigate the development of migration rates and migrant characteristics in rural northern Sweden (1850–1950), and to assess if the development fits with the expectations derived from the decentralised industrialisation model. The analysis is based on descriptive statistics using data from the northern Swedish county of Västerbotten (1850–1950). Firstly, the short-term impact of migration on the population structure of rural areas over time is addressed. Then, the development of the rural migration patterns regarding destination and distance, both by sex and economic sector. The results are subsequently discussed to evaluate to what extent the concept of decentralised industrialisation can be used to understand urban-rural migration patterns in northern Sweden in 1850–50.
Decentralised industrialisation in northern Sweden
The term ‘decentralised industrialisation’ is used in this study to describe the characteristics of the industrial development and expansion in rural northern Sweden during the late nineteenth century and up until the middle of the twentieth century. Heavily focused on raw material production, the industrialisation of northern Sweden did not exclusively incentivise the workforce to agglomerate into a few select urban-industrial areas, as was often the case in the mostly factory-driven industrialisation in the more densely populated southern parts of Sweden (Nyström, Reference Nyström2002; Rydén, Reference Rydén2002). Industrial sectors such as mining, hydroelectricity, and timber production necessitated a spatial dispersion of the workforce. This led to the emergence of non-agricultural wage labour in many northern rural areas, often supplementing but sometimes replacing the local agrarian economies during the early to mid-twentieth century (see, e.g., Ager, Reference Ager2014, chs 3, 4, 11; Söderberg and Lundgren, Reference Söderberg and Lundgren1982).
The idea that urbanisation and industrialisation were intrinsically linked is hardly a contentious standpoint in historical research. In the economic, or macro-historical, grand narrative, industrialisation incentivised rural-to-urban migration due to the rising labour demand in or around the growing, industrialising cities. This development subsequently resulted in an asymmetry in the rural and urban labour market opportunities regarding work availability and wages (see, e.g., Ekberg, Reference Ekberg1978; Malmberg, Reference Malmberg2011; Morell, Reference Morell2011; Thomas, Reference Thomas1941; Åberg, 1980). The urban demand (pull) and the growing, relative disadvantage of the rural (push) worked in tandem to reinforce urbanisation. This study proposes that the decentralised industrial economic structure of northern Sweden influenced the rate of urbanisation by counterbalancing the urban labour demand; as such, the relative advantage of the urban areas would not develop as rapidly, in turn leading to less rural-to-urban movement.
The presumed effect of decentralised industrialisation on population movement would be more apparent among men, as the decentralised industry sector was predominantly male-oriented. While the industrial development in towns was also largely male-oriented, the female urban labour market was more varied and extensive, compared to the rural, due to economic expansion and commercialisation (Vikström, Reference Vikström2003: 80–115). In some settings, new industries, such as textile, attracted a predominantly female industrial labour force (Horgby, 1986: 39).
Around the middle of the twentieth century, rationalisation and labour market developments led to more labour opportunities and better wages in the urban labour market and the opposite in rural areas (see, e.g., Ager, Reference Ager2014: 19–33; Ekberg, Reference Ekberg1978; Söderberg and Lundgren, Reference Söderberg and Lundgren1982). Therefore, the rural-to-urban inertia, predicted by the decentralised industrialisation model, is expected to have dissipated as the twentieth century progressed.
Decentralised industrialisation is not a uniquely Swedish phenomenon. Samuel Ho coined the term to describe the economic development of postwar Taiwan. Ho argued that a spatially dispersed industry is linked to the share of non-farm income in agricultural households, leading to less rural-to-urban migration than in countries with heavy industrial concentration near principal cities (Ho, Reference Ho1979). Consequently, the availability of industrial (non-farm) income sources in rural areas can significantly impact the rural demographic development in industrialised (or industrialising) countries. Other studies have shown that strong spatial divides in labour market development during industrialisation almost inevitably lead to spatial economic differences, which most often negatively affect peripheral areas outside urban-industrial centres (e.g., Krugman, Reference Krugman1995). If no compensating advantages are to be found in these rural areas, depopulation (via out-migration) and subsequent social and economic problems often follow. The rural areas most adversely affected by rural out-migration during industrialisation often remained wholly agrarian and lacked good communication with the growing urban-industrial areas. This general trend seems to hold for the UK (Saville, Reference Saville1957), Germany (Hochstadt, Reference Hochstadt1999), Spain (Collantes & Pinilla, Reference Collantes and Pinilla2004), the US (Atack, Margo, and Rhode, Reference Atack, Margo and Rhode2022; Black and Henderson, Reference Black and Henderson1999; Johnson and Lichter, Reference Johnson and Lichter2019; Warner, Reference Warner1972), Canada (Goheen, Reference Goheen1980; Watson, Reference Watson1947), among other countries.
Unlike Taiwan, northern Sweden did not experience industrial establishment in the form of factories in rural areas; instead, the nature of the urban-industrial growth of the region necessitated a geographically dispersed rural-industrial workforce.Footnote 1 This requirement primarily applied to northern Sweden’s most dominant industrial sector, the timber industry. As timber production rapidly increased during the second half of the 1800s, sawmills near urban areas along Sweden’s coastline grew in number and size (Östlund, Reference Östlund1995). The sawmill boom of northern Sweden also led to an increased stream of rural-urban migration incentivised by the opportunity of stable wage labour (Josefsson and Östlund, Reference Josefsson and Östlund2011; Vikström, Reference Vikström2003: 73–7). However, as the sawmills expanded, so did the need for rural workers engaged in logging and transporting the timber to the mills,Footnote 2 thus providing the northern rural population (composed almost entirely of smallholders) an opportunity to work part-time (often seasonally) as wage labourers without needing to move (Gaunitz, Reference Gaunitz1977; Lundgren, Reference Lundgren1977). In time, the northern Swedish system of decentralised industrialisation led to an amalgamation of agrarian and wage-labour work that would become the economic foundation in many northern rural areas. This system would gradually deteriorate around the mid-1900s when rationalisation in agriculture and the decentralised industrial sectors (primarily the timber industry) severely decreased demand for labour in rural areas (see, e.g., Ager, Reference Ager2014, chs 4, 5; Eliasson, Reference Eliasson2011; Hjelm, Reference Hjelm1991, chs 3, 4, 5; Josefsson and Östlund, Reference Josefsson and Östlund2011; Larsson and Olsson, Reference Larsson and Olsson1992; Lundell, Reference Lundell2011; Lundgren, Reference Lundgren2011; Norborg, Reference Norborg1968: 130; Nyström, Reference Nyström2002; Söderberg and Lundgren, Reference Söderberg and Lundgren1982: 35–57).
In essence, the development of northern rural Sweden from the late nineteenth century until the mid-twentieth century can be described as industrialisation without factories. However, the decentralised industrialisation of northern Sweden did not lead to an absence of economic agglomeration, which indeed did occur in the urban centres along the Gulf of Bothnia, but rather the dispersion of industry-related work over a large geographical area, stretching far away from the urban-industrial centres.
During the first half of the twentieth century, the urban share of the Swedish population grew rapidly. However, the northern parts of the country experienced little urban growth compared to the more densely populated south. The urban growth, as percentage points, in different areas of Sweden (1911–50), is outlined in Figure 1. The eastern parts (the region around the capital of Stockholm) experienced the largest growth, with the southern parts experiencing a little less. Northern Sweden is the outlier, as urban growth increased the least here. The urban growth in the investigated county of Västerbotten was around 10 percentage points, less than half of the national average of 21 percentage points. To ascertain if decentralised industrialisation was associated with this development, the period-specific migration needs to be analysed further.
Percentage point growth of the urban population in Sweden (1911–50).
Note: The regional division is made following the Nomenclature of Territorial Units for Statistics (NUTS) established by the European Union in 2003. It follows Sweden’s administrative county borders but geographically groups Sweden’s counties into three larger regions.
Complete list of counties (län) in each category in the figure:
East Sweden: Stockholms, Södermanlands, Uppsala, Västmanlands, Örebro, and Östergötlands.
Southern Sweden: Blekinge, Gotlands, Göteborg och Bohus, Hallands, Jönköpings, Kalmar, Kristianstads, Kronobergs, Malmöhus, Skaraborgs, and Älvsborgs.
Northern Sweden: Gävleborgs, Jämtlands, Kopparbergs, Norrbottens, Värmlands, Västerbottens, and Västernorrlands.
Source: SCB [Statistics Sweden], Befolkningsrörelsen (1911–50).
Regional context
Västerbotten is the second-most northern county in Sweden and stretches the entire width of the country, from the Scandinavian mountains in the west to the Gulf of Bothnia in the east (Figure 2). Västerbotten began to industrialise in the late 1800s, and large-scale timber and mining operations were established in the first half of the twentieth century. The county characteristics are advantageous for this study, encompassing the urban and old agrarian areas along the coast and the heavily forested, more sparsely populated inland. Furthermore, the existence of both timber and mining industries mirrors the industrial development in the rest of the northern Swedish region, both to the north and south of Västerbotten. This county is, therefore, a good proxy for northern Sweden during the investigated period.
POPLINK parishes by region.
A geographically large but sparsely populated county, Västerbotten had seen little urban development by 1900. The county was dotted with small towns and villages, but the only larger towns were Umeå and Skellefteå, situated along the Gulf of Bothnia. The total population of these two towns was initially modest at the start of the century, but they would increase six-fold over the next fifty years.Footnote 3 Västerbotten had a population of 67,000 in 1850, 143,000 by 1900, and 231,000 by 1950. The population density per km2 was 1.3, 2.6, and 4.1 in the respective years (Statistics Sweden [SCB], 1969: 50–1, 60).
The town of Umeå acquired its privileges in 1622 and was initially a regional centre for trade with an early shipyard industry. The town burned to the ground in 1888 and was subsequently rebuilt in accordance with the latest innovations in sanitation, water, and (earlier than many other Swedish towns) electricity (Olofsson and Eriksson, Reference Olofsson and Eriksson1972: 116–46). By the turn of the century, Umeå was a modern town with good communications, with the advantages of being situated near the coast and by a newly built railroad. Umeå was chosen to garrison two army regiments in 1901 and 1909, leading to economic and population growth (Olofsson and Eriksson, Reference Olofsson and Eriksson1972: 66–88). As a town, Skellefteå is younger than Umeå, receiving its town privileges by the middle of the nineteenth century, but it would not experience a sharp rise in population until the discovery of gold and copper ore in the area. This discovery led to a rapid development whereby large-scale mining industries emerged around Skellefteå in the late 1920s and onwards. The largest was the Boliden mine to the west of Skellefteå (mining started 1925) and the Rönnskärsverken blast furnace plant to the east (construction started 1928) (see, e.g., Andersson, Reference Andersson1987: 126–44; Westin, Reference Westin1953: 376–80).
Other than Umeå and Skellefteå, Västerbotten was a predominantly agrarian county at the turn of the twentieth century. The Swedish state advocated a policy of establishing new smallholder farmsteads that could support a single family in the middle of the 1800s. Beginning in 1904, the government also started issuing loans for the establishment of new smallholder farms. The subsequent expansion of farmsteads happened primarily in the northernmost parts of Sweden, where uncultivated land was most readily available. These policies, in combination with the growing pressure of an increasing population, resulted in a sharp increase in subsistence-based family farm households in the north of Sweden during the late nineteenth and early twentieth centuries (see, e.g., Bäcklund, Reference Bäcklund1988; Morell, Reference Morell2001: 127–33; Morell, Reference Morell2011; Prawitz, Reference Prawitz1951). It is among these small towns and rural areas that decentralised industrialisation would emerge, subsequently restructuring the socio-economic foundations of the region.
Data
The study draws on data from the POPLINK database obtained from the Demographic Database (DDB) in Umeå <DOI 10.17197/U20006>. The data consist of digitalised parish registers from 14 parishes in the county of Västerbotten between 1850 and 1950. Administered by the Church of Sweden, the parish registers were a form of extended civil registration of all Swedish inhabitants that were managed on the local level by the priest of each parish (Nilsdotter Jeub, Reference Nilsdotter Jeub1993). The registers contain a wide array of high-quality information about individuals for every year (including geographical information on both residence and place of origin/destination in case of migration), which makes longitudinal studies possible regarding aggregated structural changes as in this study (Edvinsson and Engberg, Reference Edvinsson and Engberg2020; Westberg, Engberg, and Edvinsson, Reference Westberg, Engberg and Edvinsson2016).
The data includes all individuals who were registered residents of the 14 studied parishes on the first day of each year, starting in 1850 through 1950, as well as any registered residents that were born or died during the year. Migration is defined as a move into or out of a parish, the smallest administrative unit in the data. The short-term migrations by individuals who temporarily moved to one of the parishes during any given year (but did not stay until the first day of the following year) were omitted from any calculations. Likewise, individuals who moved out of one parish but returned before the start of the following year are also omitted. The reason for omitting these short-term migrations is that they did not affect the population structure of the parishes for any extended period. No limits were set on the total number of moves per individual. It is, therefore, possible for a single individual to contribute more than one instance of migration in the data as long as the length of stay/absence criteria is met. With these restrictions in place, 346,331 individuals are available in the data between 1850 and 1950. Roughly 57 per cent, or 197,428, had at least one recorded migration, while the total number of recorded migrations amounted to 422,749.
Methods
Rural and urban classification in this study is based on the Swedish census of 1950 (SCB, 1952), in which a parish was classified as being urban if it was defined as being part of a town in the census or rural if it was not defined as part of a town. All Swedish parishes were classified in accordance with this census, both in and outside the investigated 14, to allow for a detailed analysis of the destination of out-migrants. Of the 14 studied parishes, only Umeå and Skellefteå town parishes are categorised as urban, with the rest being rural (Figure 2). Using the 1950 census for the entire investigated period might lead to a slightly higher estimation of the number of out-migrants moving to urban areas in the earlier years of the study period, as previous rural parishes could have been later reclassified as part of towns. However, these administrative changes were small for all intents and purposes. More importantly, the classification entails no potential bias towards underestimating rural-to-urban migration. While complete overage exists for the entire investigated period, the two towns of Umeå and Skellefteå only contribute data from the 1900s onward.
The POPLINK data provides both the ad verbum occupational labels and HISCO codes. The HISCO scheme is a historical version of the ISCO scheme for economic sector classification of occupations and allows historical occupations to be classified into one of nine major categories, which in turn contain extensive subcategories (Leeuwen, Maas, and Miles, Reference Leeuwen, Maas and Miles2002; Leeuwen, Maas, and Miles, Reference Leeuwen, Maas and Miles2004).Footnote 4 To analyse the development of the economic sectors of the investigated parishes, a three-level sector categorisation was adopted. Firstly, an agricultural sector comprising all farmers and farmworkers. Secondly, a manual/industrial sector including, but not limited to, forestry workers and other occupations related to the decentralised industry. Thirdly, a service sector comprised of professionals, sales, and other service workers.Footnote 5
To measure net migration rates over time, the number of migrations per 1,000 inhabitants is used according to the formula found in (1).
 $${{{\rm{I}}{{\rm{M}}_{\rm{r}}}Y - {\rm{O}}{{\rm{M}}_{\rm{r}}}Y} \over {{{\rm{P}}_{\rm{r}}}Y}}{\rm{*}}1000$$
IM is the number of in-migrants, OM is the number of out-migrants, and P is the population of interest in region r in year Y.
To measure distance, the register data was linked to the map data of all territorial parishes in Sweden in 1950 (SCB, 1952). Migration was thereafter calculated as the minimum distance between the parish of origin and destination in metres. Distance between adjacent parishes is, therefore, 0. The year 1950 was chosen to not exclude any parish established during the investigated period. Therefore, administrative changes to the parish boundaries are not accounted for over time. However, because distance is only calculated as a rough estimate at the parish level, the impact of this on the analysis is insignificant. Only internal migration, 98 per cent of all migrations, are analysed relating to distance. In total, distance could be calculated for around 160,000 out of roughly 180,000 instances of rural-out migration (roughly 88 per cent of all instances).
Patterns in migration destinations were explored using hexagonal maps. To visually explore geographical patterns across a country like Sweden, with heterogeneous parish sizes, small parishes were aggregated into larger clusters represented within a hexagonal geographical pattern, representing the Swedish national boundaries. The process entailed geographically splitting Sweden into hexagons. For every investigated year, each hexagon was assigned to either all parishes within that hexagon or one parish that did not share any other hexagon with any other parish. Thus, the hexagon aggregation retains the spatial positioning of areas while aggregating smaller units to areas of a size that is visible in a geographical visualisation.
Results
Differences between rural and urban
This section covers the population development in the rural and urban regions of Västerbotten during the investigated period. Figure 3 displays the total population change per 1,000 inhabitants in the rural region (1850–1950), and in the urban region from 1900 onwards. The figure contains net migration, natural growth, and total population growth. Two entirely different demographic mechanics drove the respective population developments between the regions. In the rural region, high natural growth (N births, N deaths) was the main driving factor. High (but fluctuating) positive net migration was the main contributor in the urban region.
Population development per 1,000 inhabitants in the rural and urban regions of POPLINK (1850–1950).
Note: Migration between parishes within each region does not influence net migration (one in, one out).
Source: POPLINK.
The natural growth in the rural region was initially quite stable at around 20 per 1,000 inhabitants until the turn of the century, whereafter a slow and steady decline occurred. Net migration levels were relatively stable throughout most of the investigated period, ranging from -1 to -5 per 1,000 until the 1940s, whereafter a drastic drop to -15 per 1,000 occurred. This drop led to a negative net value in total growth. The urban region experienced an even more drastic decline in net migrants per 1,000 inhabitants, from 35 in the 1920s to 7 per 1,000 in the 1940s. However, the net migration was still positive throughout the investigated period.
The natural growth in the two regions developed in similar fashions during the twentieth century. Although mortality in towns had been markedly higher during most of the previous century (Edvinsson, Reference Edvinsson1992), this urban penalty had become entirely a thing of the past come the twentieth century. Furthermore, the levels and development of mortality per 1,000 inhabitants were similar in both regions during the twentieth century. In the rural region, mortality decreased from 15 (per 1,000) in 1850 to 14 in 1900 and 9 in 1950. In the urban region, mortality per 1,000 was 13 in 1900 and 7 in 1950. While the rural region initially had a higher birth rate than the urban region, both would level out at around the same birth and mortality levels in the 1940s.Footnote 6
Generally, Västerbotten followed the same demographic development as the rest of Sweden but at a slower pace (Bocquier and Costa, Reference Bocquier and Costa2015; Sundin and Willner, Reference Sundin and Willner2007: 115–46, 151–72). Västerbotten (and rural areas, in general) have previously been shown to have had a lagged demographic transition compared to the rest of Sweden (and urban areas, respectively) (Dribe, Oris, and Pozzi, Reference Dribe, Oris and Pozzi2014; Sandström and Marklund, Reference Sandström and Marklund2019: 156–8). However, by the middle of the century, the differences had all but disappeared as the demographic development of the county was generally on par with the rest of the country.
Overall mobility was substantially higher in the urban region compared to the rural in terms of all in- and out-migrations, regardless of destination or origin (Figure 4). Although net migration fluctuated significantly, the urban region always experienced a net positive. Around 50 per cent of the urban in-migrants were from rural parts of Västerbotten (including parishes outside POPLINK) in 1900. By 1950, this had increased to 63 per cent. While most urban in-migrants were from Västerbotten, both Umeå and Skellefteå attracted movers from all over Sweden.
Net migration rates per 1,000 inhabitants in the urban and rural regions of POPLINK (1850–1950).
Note: Migration between parishes within each region does not influence net migration (one in, one out) but contributes to the rates of in-migration and out-migration.
Source: POPLINK.
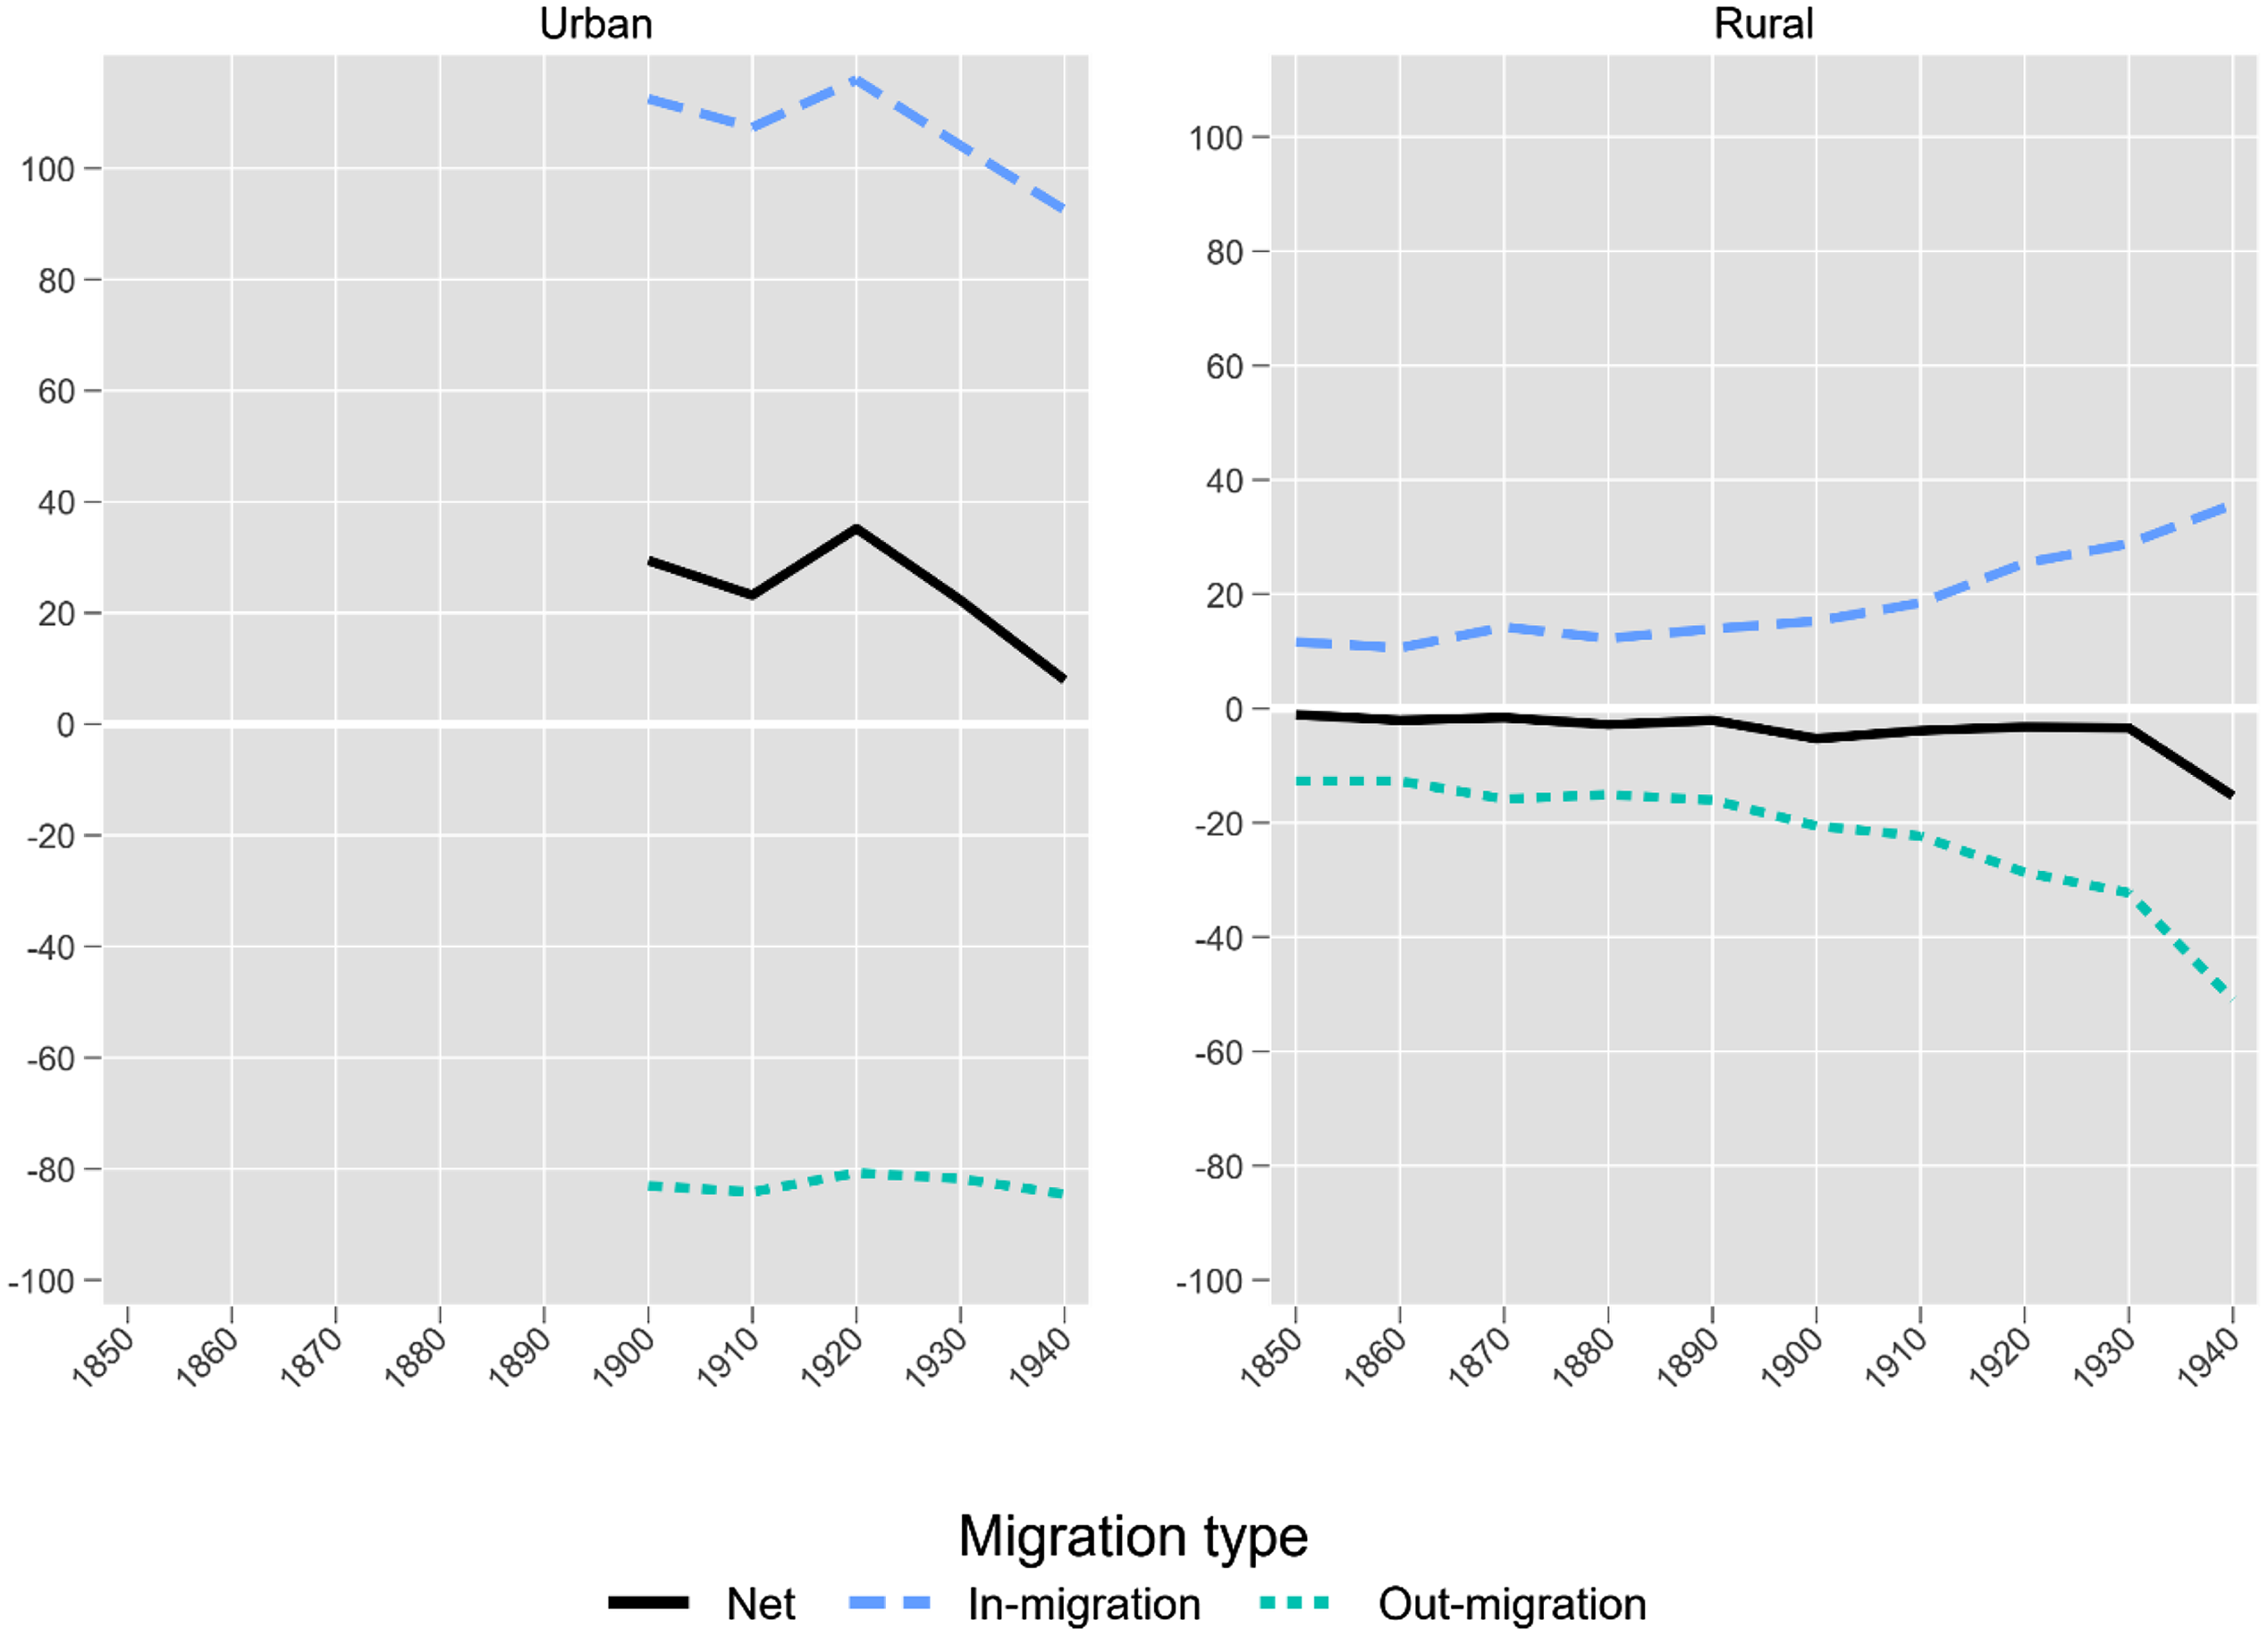
Migration in the rural region was initially modest but would increase considerably after the turn of the century. While it was consistently negative, the net deficit was minimal until the 1930s. Furthermore, the high natural growth compensated for this small negative net migration. By the late 1940s, out-migration began to overshoot in-migration more consistently in the rural region, leading to an increased net deficit and negative total population growth.
The development of the migration rate (per 1,000 individuals) in the rural region indicates that cross-parish movement increased after the turn of the century. However, this does not necessarily mean that overall movement increased, as intra-parish movements are unaccounted for. However, the high number of in- and out-migrants in the urban region indicates that the urban population was generally more mobile, regarding cross-parish movement, than the rural population. It is, however, important to note that the total population of the rural region was significantly higher than the urban region. The gross number of in- and out-migrants was, therefore, consistently higher in the rural region, but the migration had a lesser impact at the population level.
Apart from population development, massive socio-economic restructuring occurred from 1850–1950. In the rural region, the occupational composition changed radically from being overwhelmingly dominated by agriculture to having around equal shares of agricultural and manual/industrial workers by 1950 (Figure 5). The service sector was dominant throughout the first half of the twentieth century in the urban region.
Sectors of employment in the rural and urban regions of POPLINK (1850–1950).
Note: Only individuals with a registered occupation are accounted for.
Agricultural: HISCO minor groups 61, 62 (farmers; agricultural and animal husbandry workers), and for women in a rural context HISCO minor group 54 (maids). Manual/Industrial: HISCO major groups 7, 8, 9 (production and related workers; transport equipment operators; shoemakers and leather goods makers; rubber and plastics product makers) and HISCO minor groups 63, 64 (forestry workers; fishermen, hunters and related workers). Service: HISCO major groups 0/1, 2, 3, 4, 5 (professionals, technical and related workers; administrative and managerial workers; clerical and related workers; sales workers; service workers except minor group 54 for women in a rural context).
Source: POPLINK.
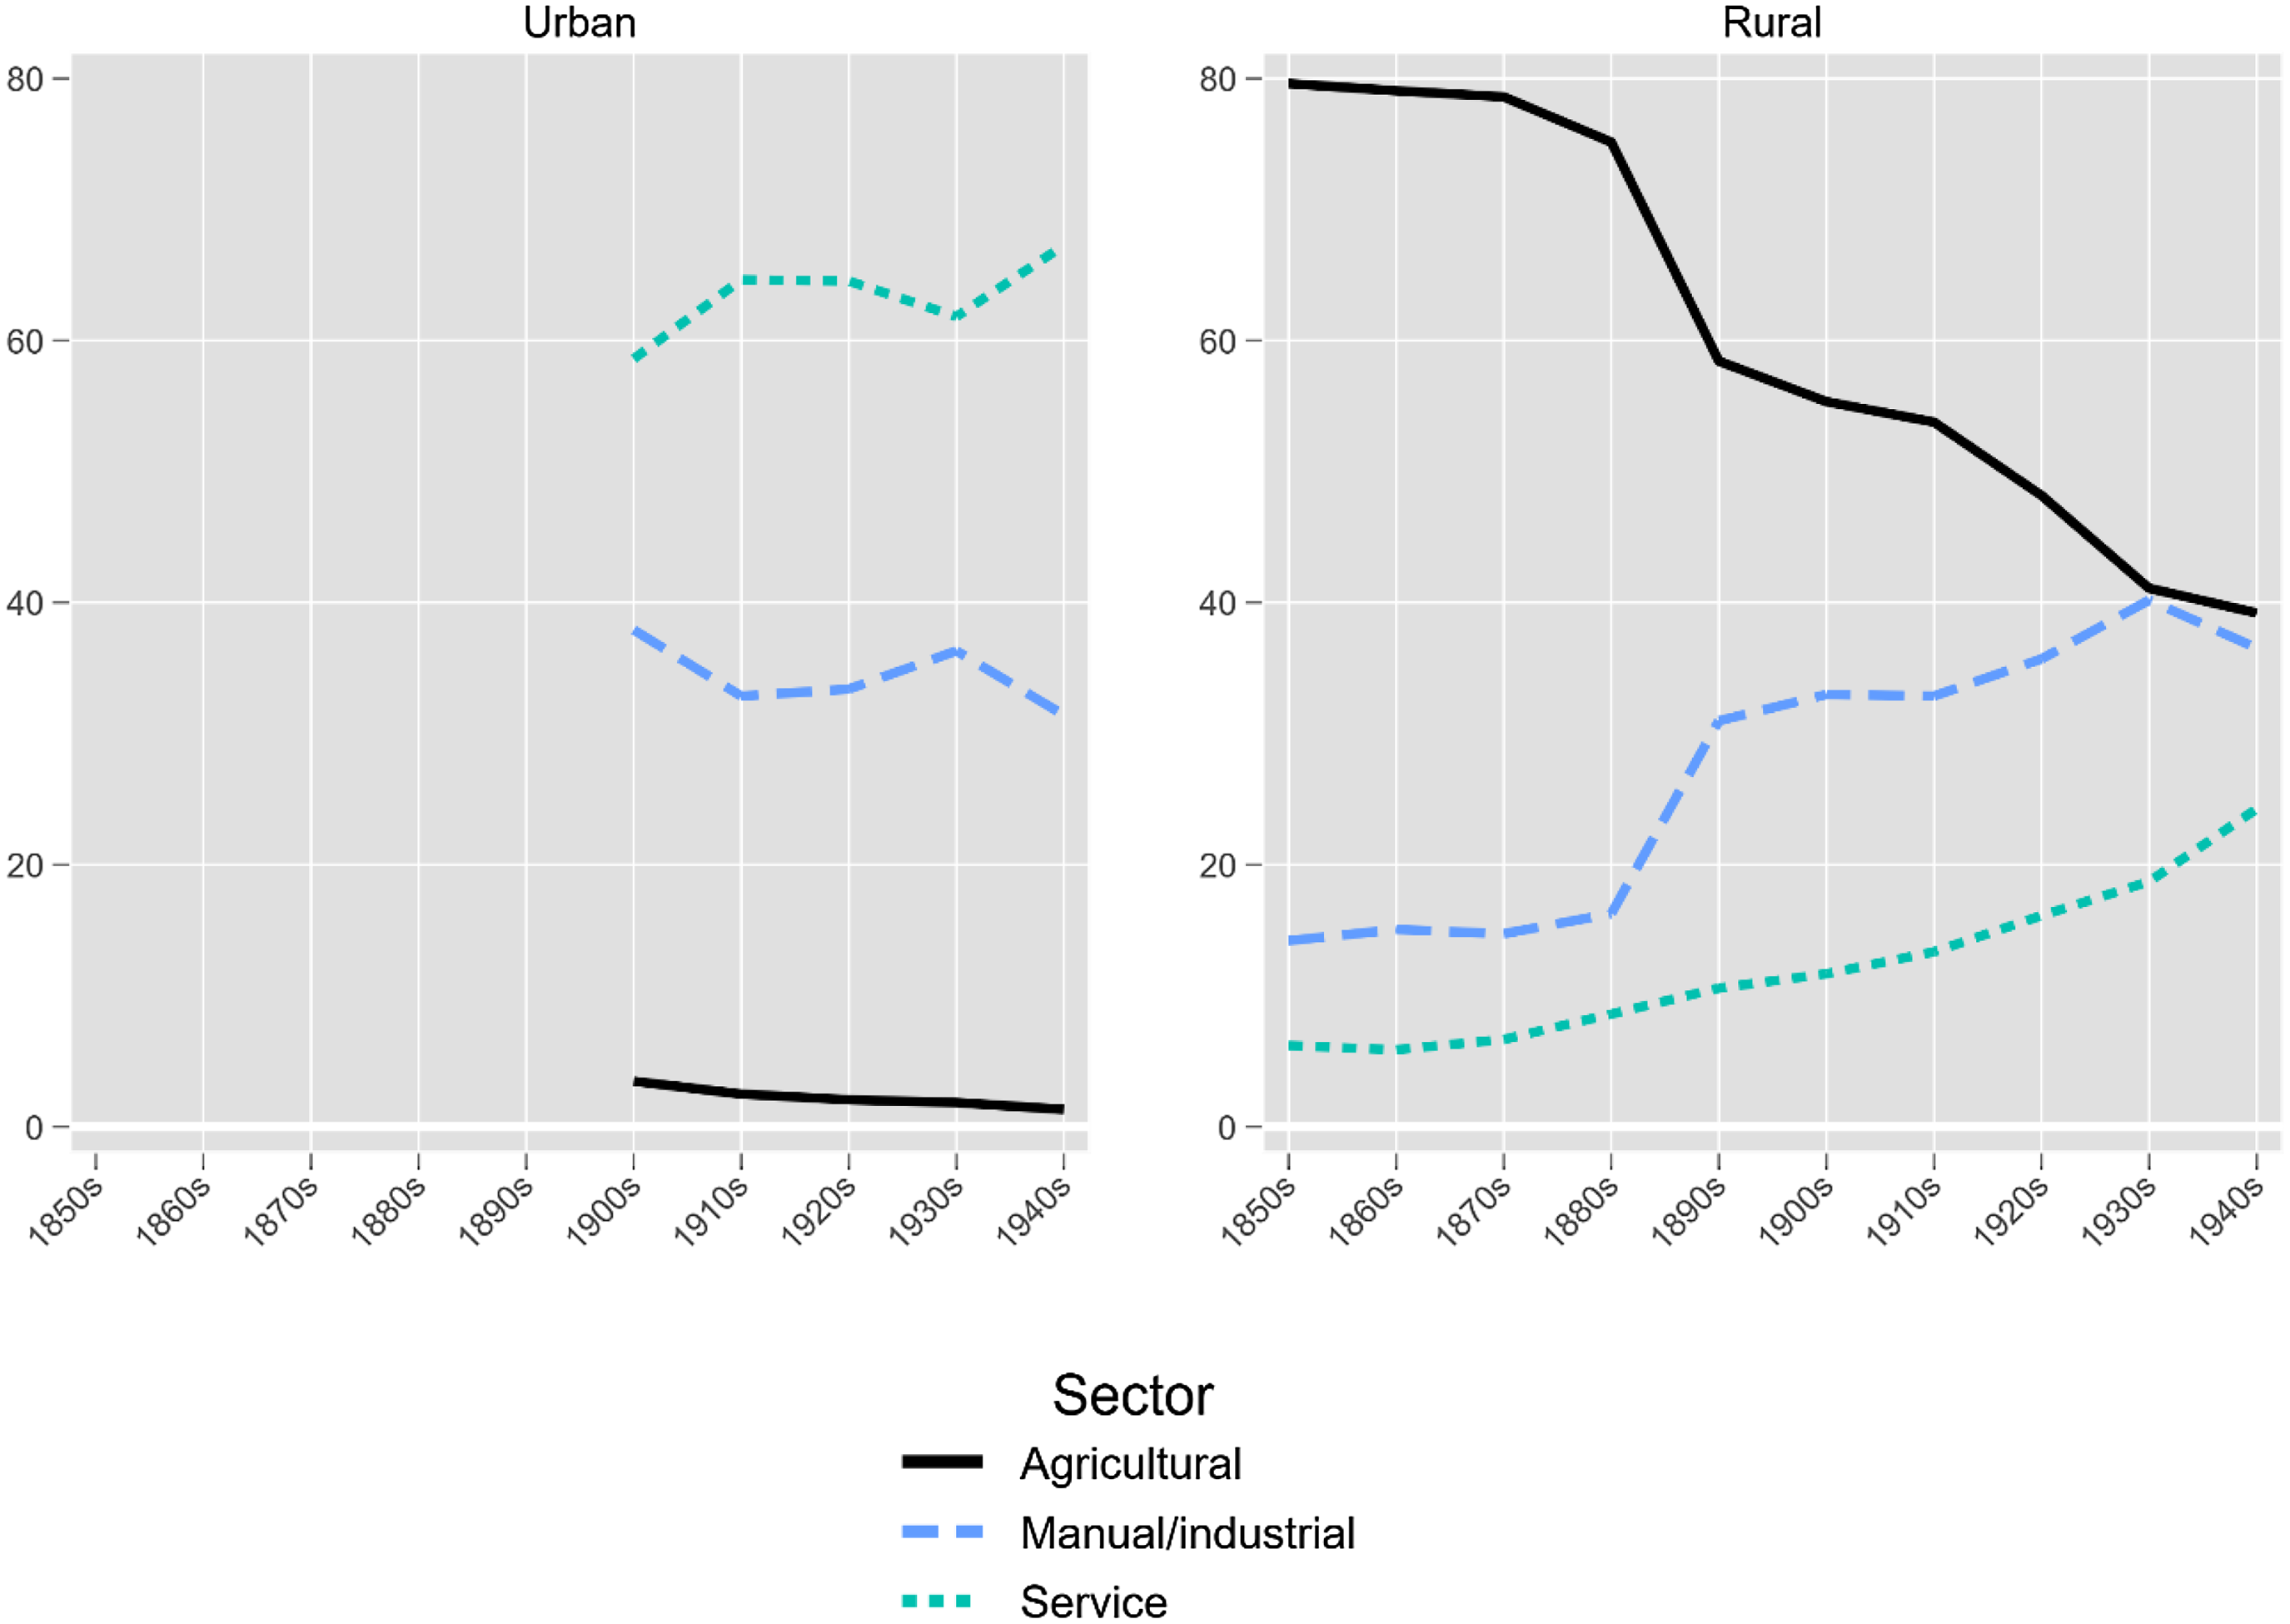
In this descriptive comparison of the urban and rural regions in Västerbotten, two things stand out regarding population development. Firstly, migration did not significantly affect the rural region’s population development until the 1940s but was the dominant factor contributing to population growth in the towns for most of the early twentieth century. Secondly, the rural population became increasingly mobile (regarding cross-parish movement) during the early twentieth century. However, the urban population was significantly more mobile than the rural. Thirdly, the rural region experienced a dramatic shift in the sector composition of the working population during industrialisation, with a sharp decrease in the share of agricultural workers and an increase in manual/industrial workers.
The rural out-migrants
Who left the rural areas, and where did they go? In this section, the sex and sector distribution of the rural out-migrants will be presented, as well as their destinations. The destination of all rural out-migrants per 1,000 inhabitants is presented in Figure 6. The out-migrants were grouped into one of three categories depending on their destination. Firstly, migrants moving to nearby rural parishes, either in POPLINK or an adjacent rural parish. Secondly, migrants moving to a rural parish further away (not in POPLINK or an adjacent rural parish). Thirdly, migrants moving to an urban parish, inside or outside POPLINK.
Out-migration rates per 1,000 inhabitants among the rural population of POPLINK by destination (1850–1950).
Note: Destination definition: Rural local includes all out-migrants moving to a rural parish in POPLINK or a rural parish adjacent to the parishes in POPLINK.
Rural distant includes all out-migrants moving to a rural parish not in or adjacent to POPLINK.
Urban includes all out-migrants moving to an urban parish, in or outside POPLINK.
Source: POPLINK.
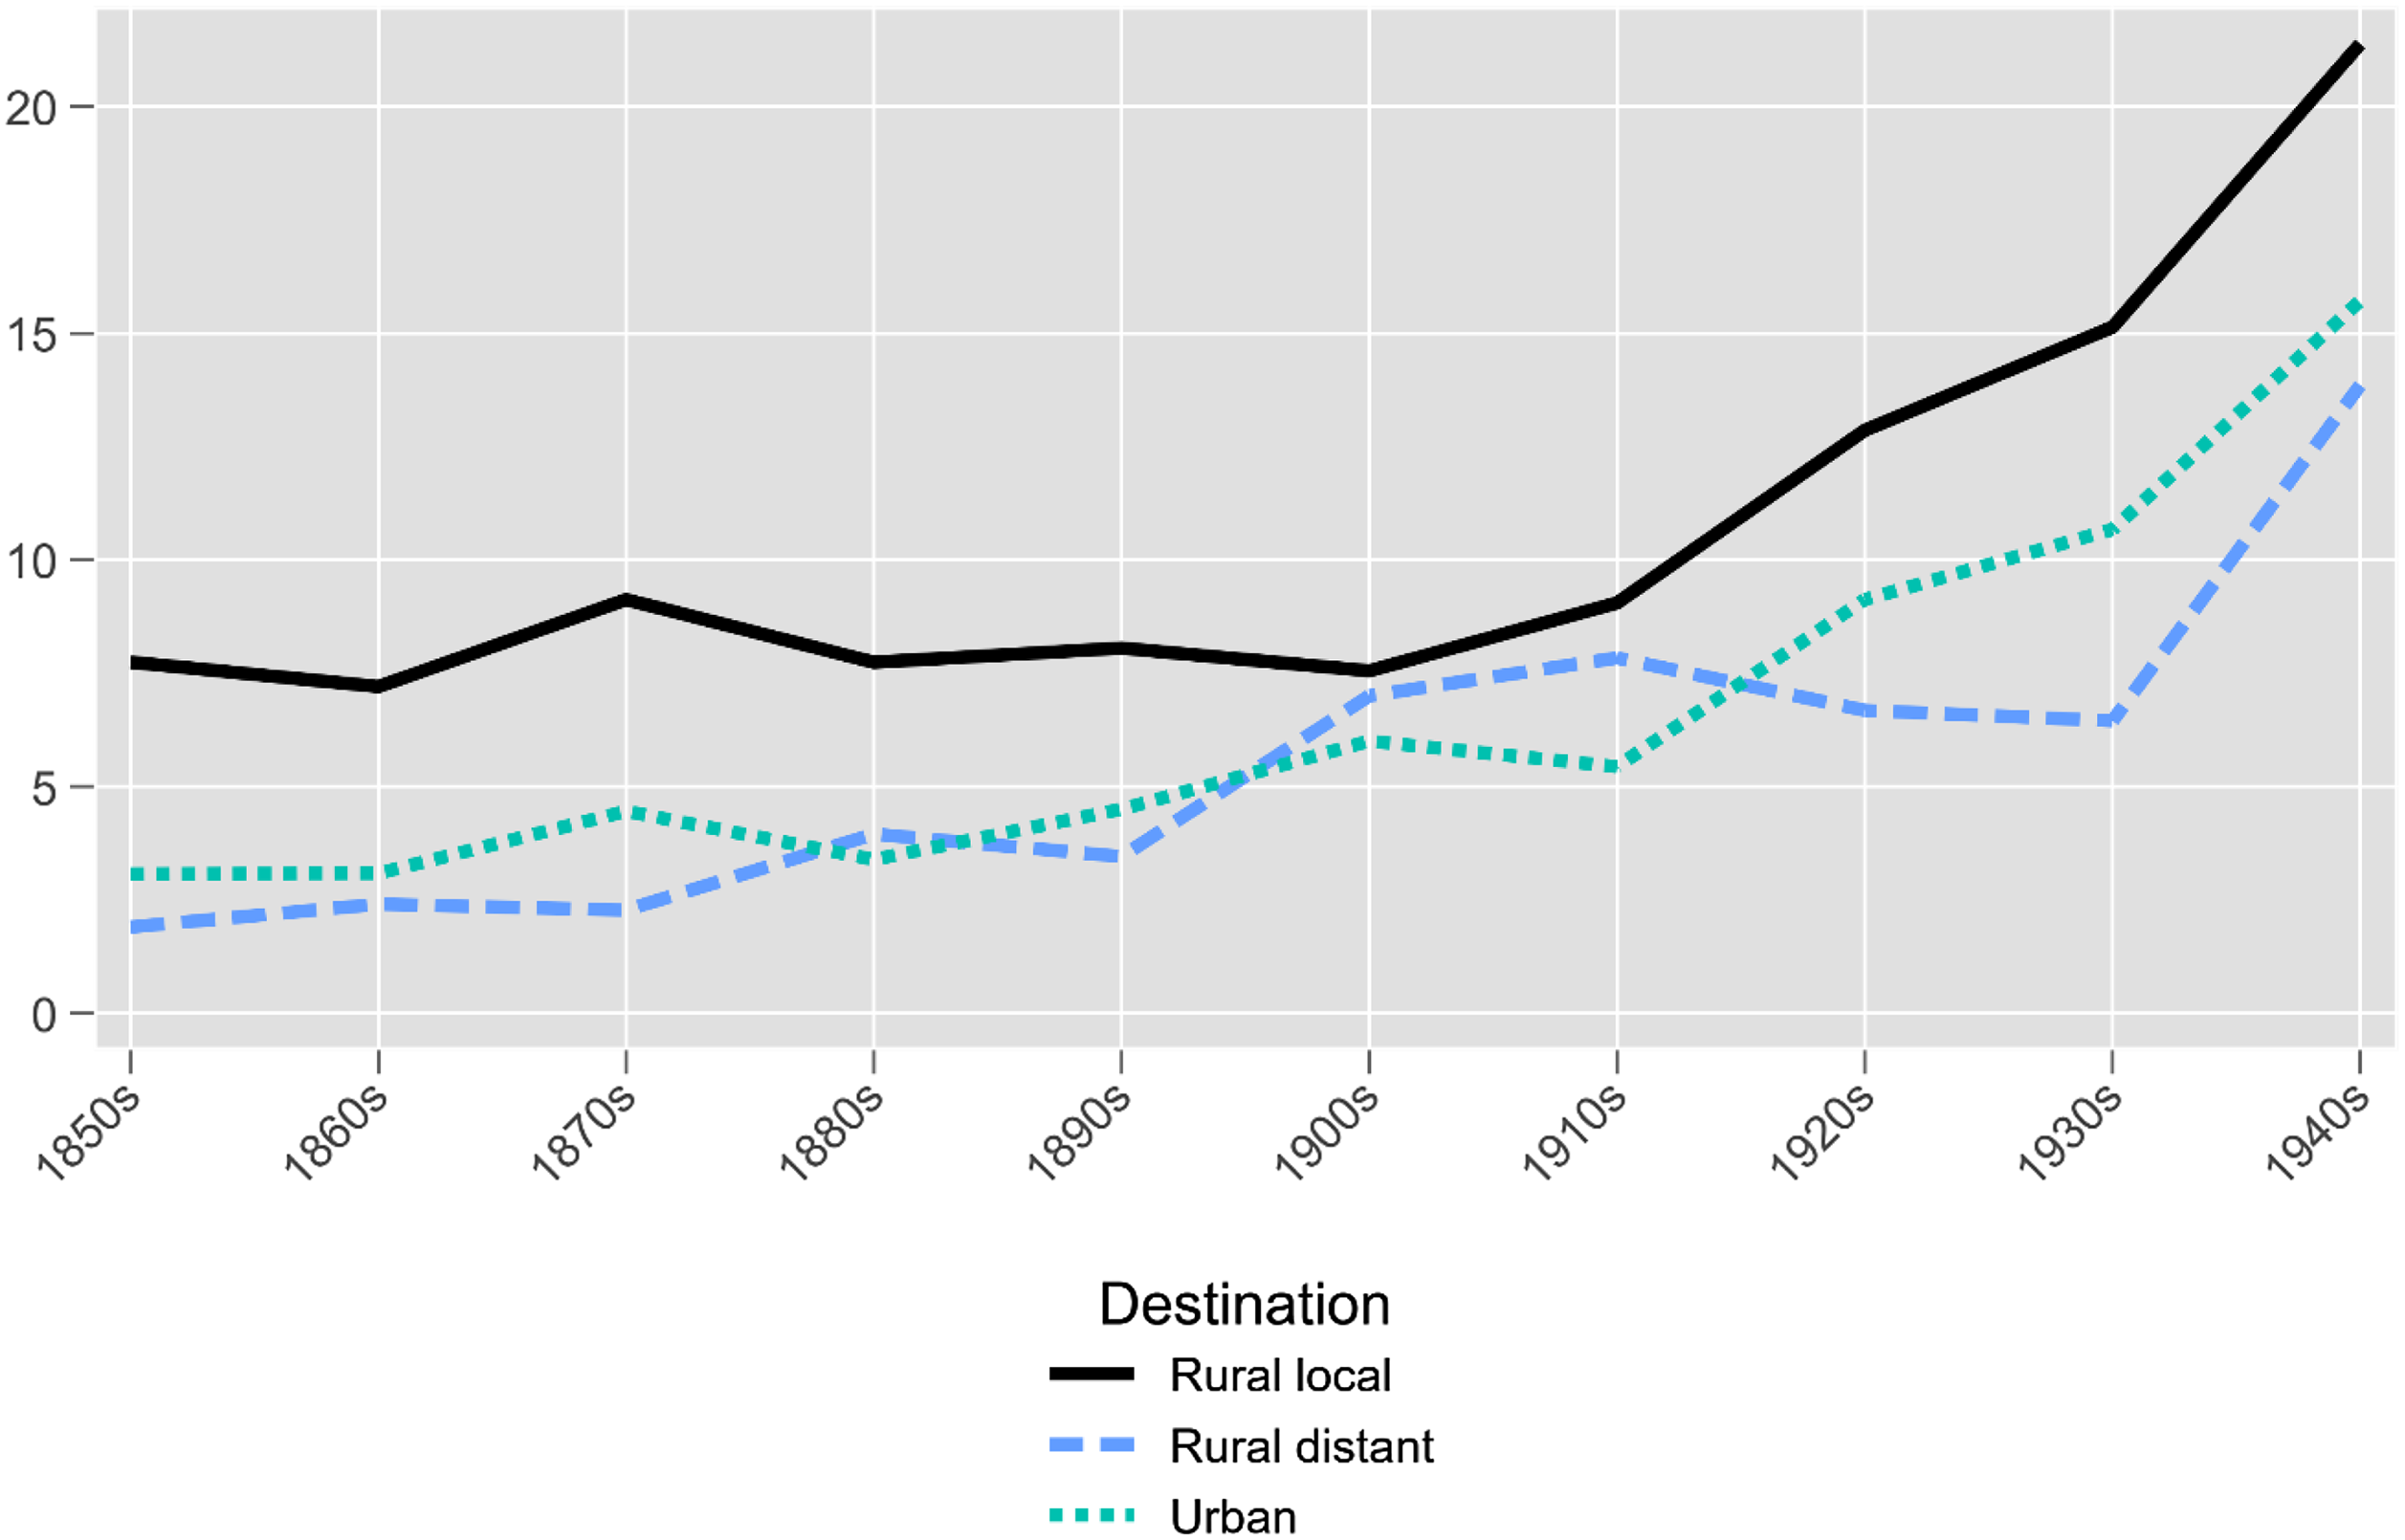
Throughout the investigated period, most rural out-migrants moved to other rural parishes adjacent to or near their parish. However, the number of out-migrants moving to urban areas increased noticeably after 1900. The percentage of out-migrants moving to urban areas also increased. In 1850, around 24 per cent of all out-migrants moved to urban areas, and in 1950 around 30 per cent.
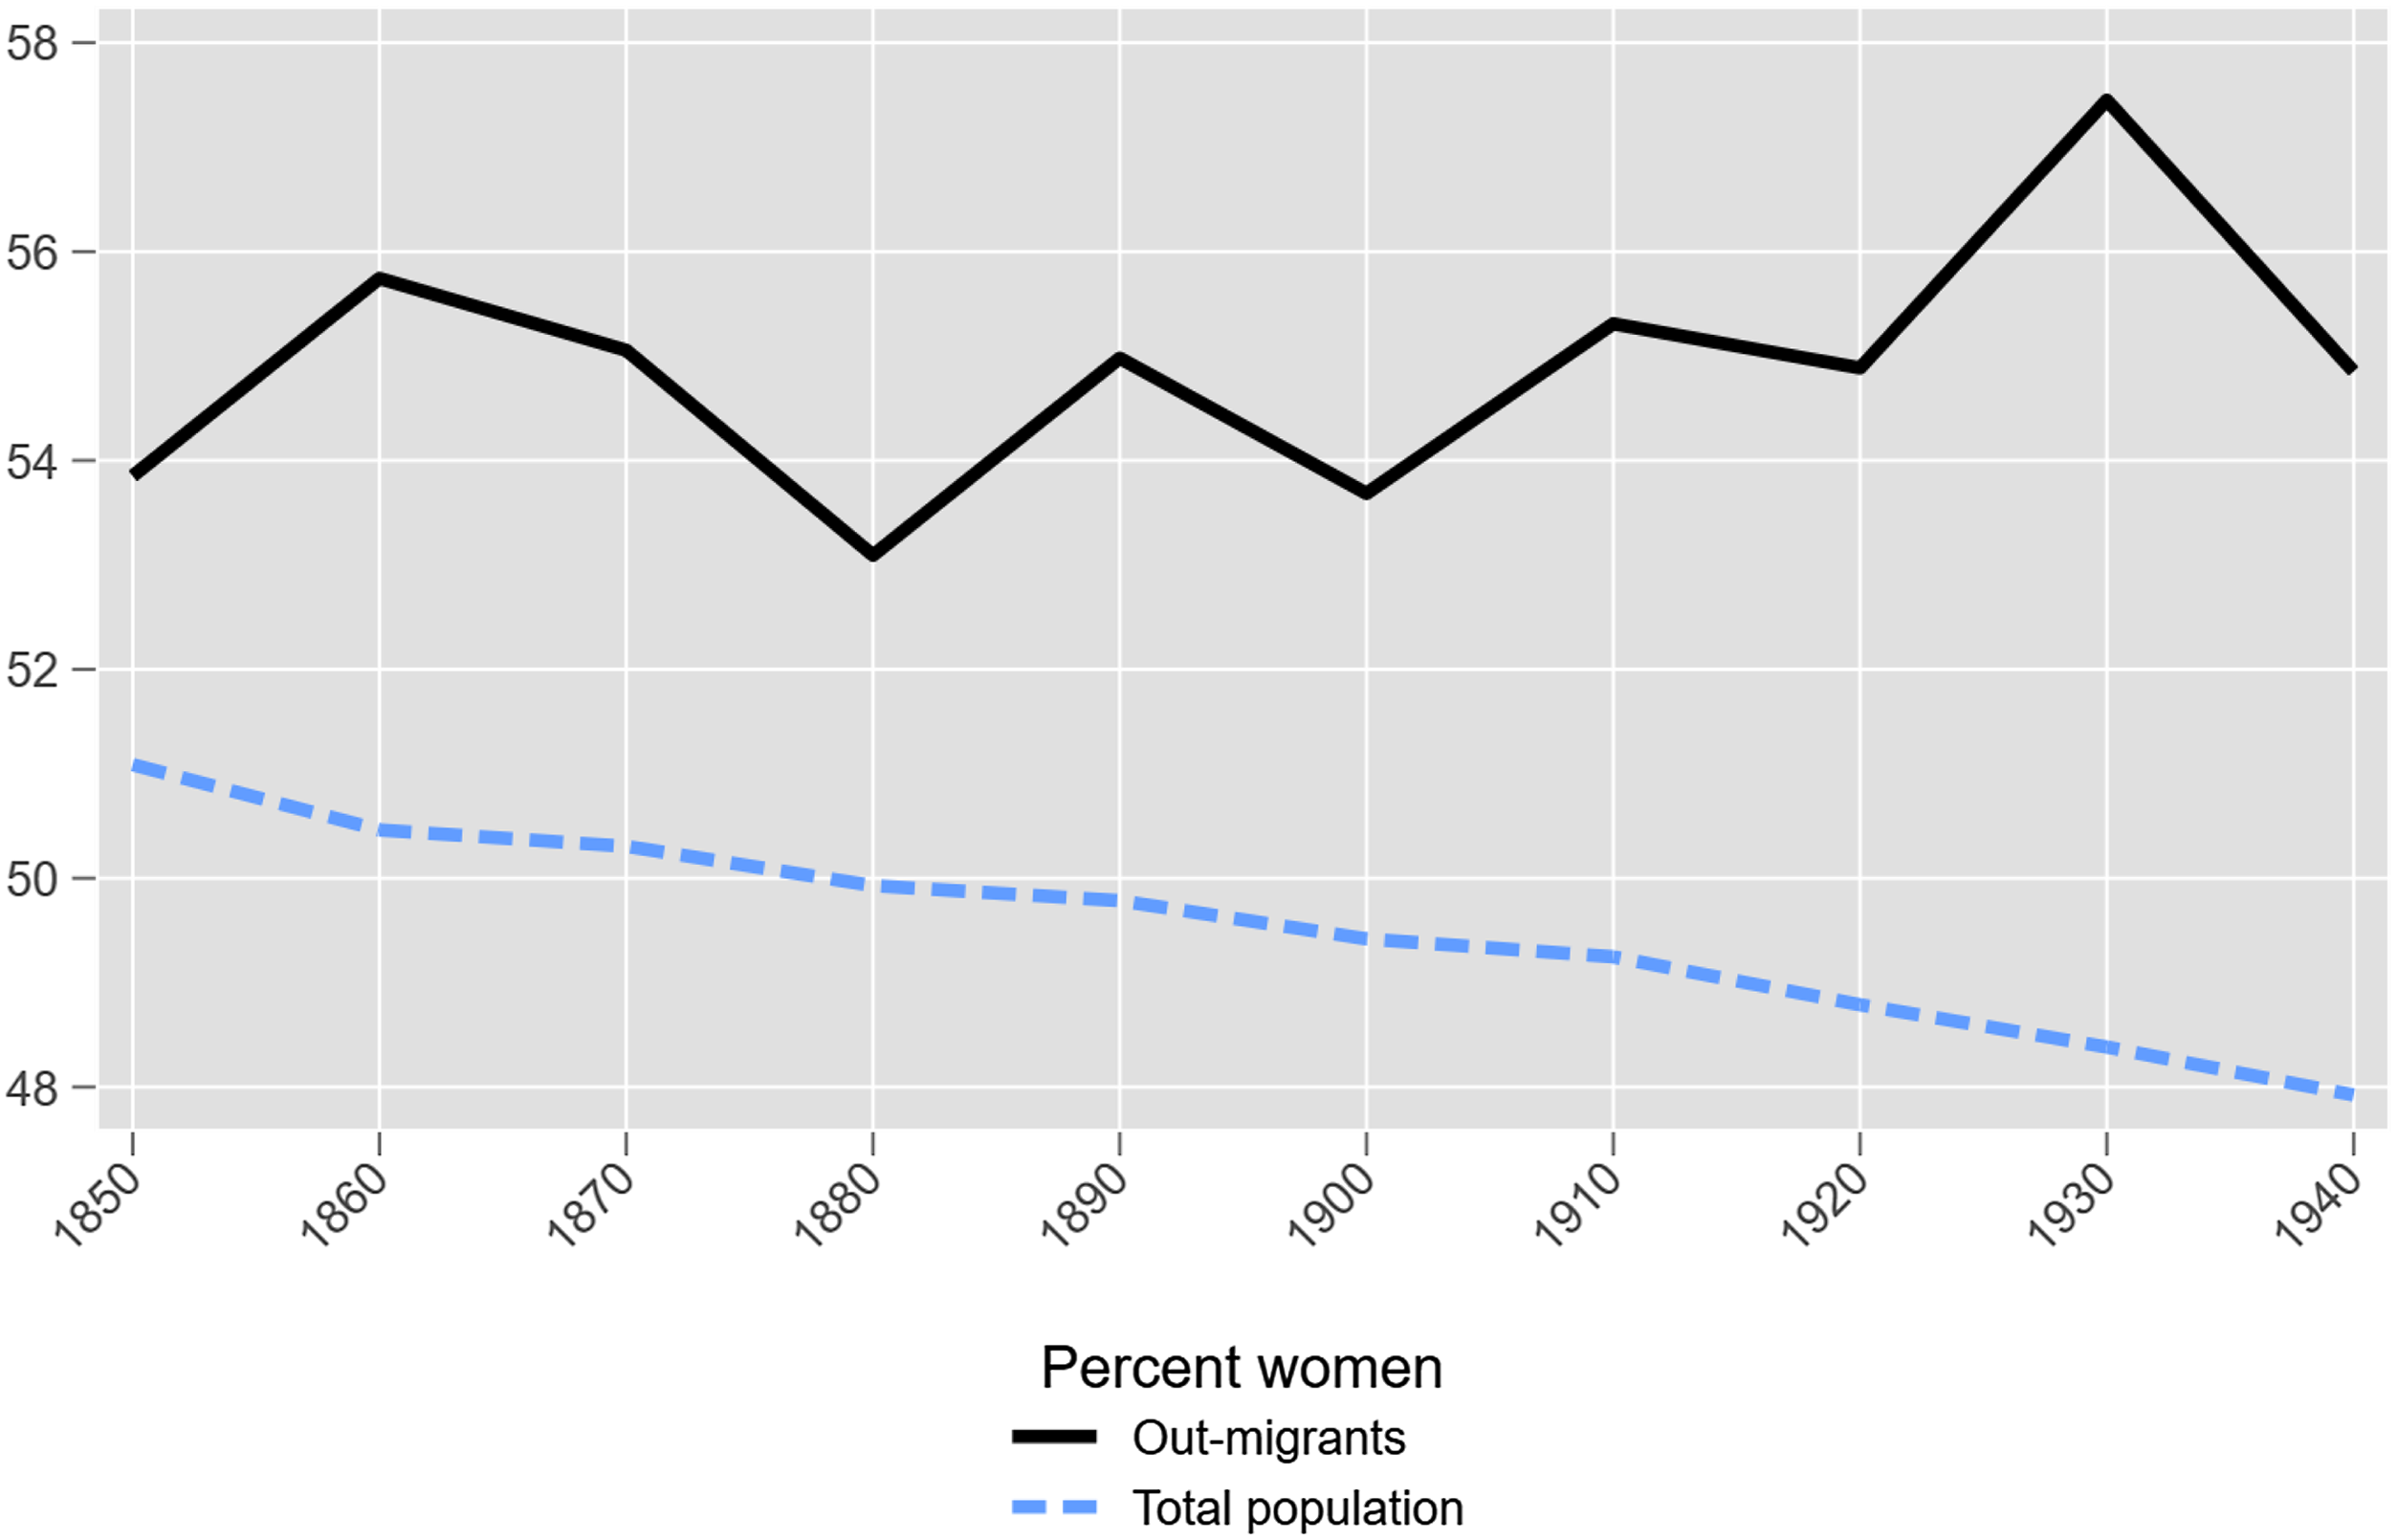
Women are more migratory than men, as stated by Ravenstein already in 1885; this was true among the rural out-migrants in Västerbotten as well (Ravenstein, Reference Ravenstein1885). Figure 7 displays the development of the female share of all rural out-migrants and in the total rural population. The general trends for the two go in opposite directions. As industrialisation progressed, the rural parishes went from having a female surplus to a female deficit, from 51 per cent in 1850 to 48 per cent in 1950. The female percentage of the out-migrants fluctuates between just below 54 per cent and 58 per cent, increasing slightly with time. However, women generally moved more than men in Sweden during the investigated period (Thomas, Reference Thomas1941: 26ff). The rural male excess also mirrors the general national development, but at a bit higher level (rural areas in the entire country were 49.5 per cent men in 1900 and 51.5 per cent in 1950) (SCB, 1969: 46 ff.).
Percentage of women among all rural out-migrants and in the total rural population in POPLINK (1850–1950).
Source: POPLINK.
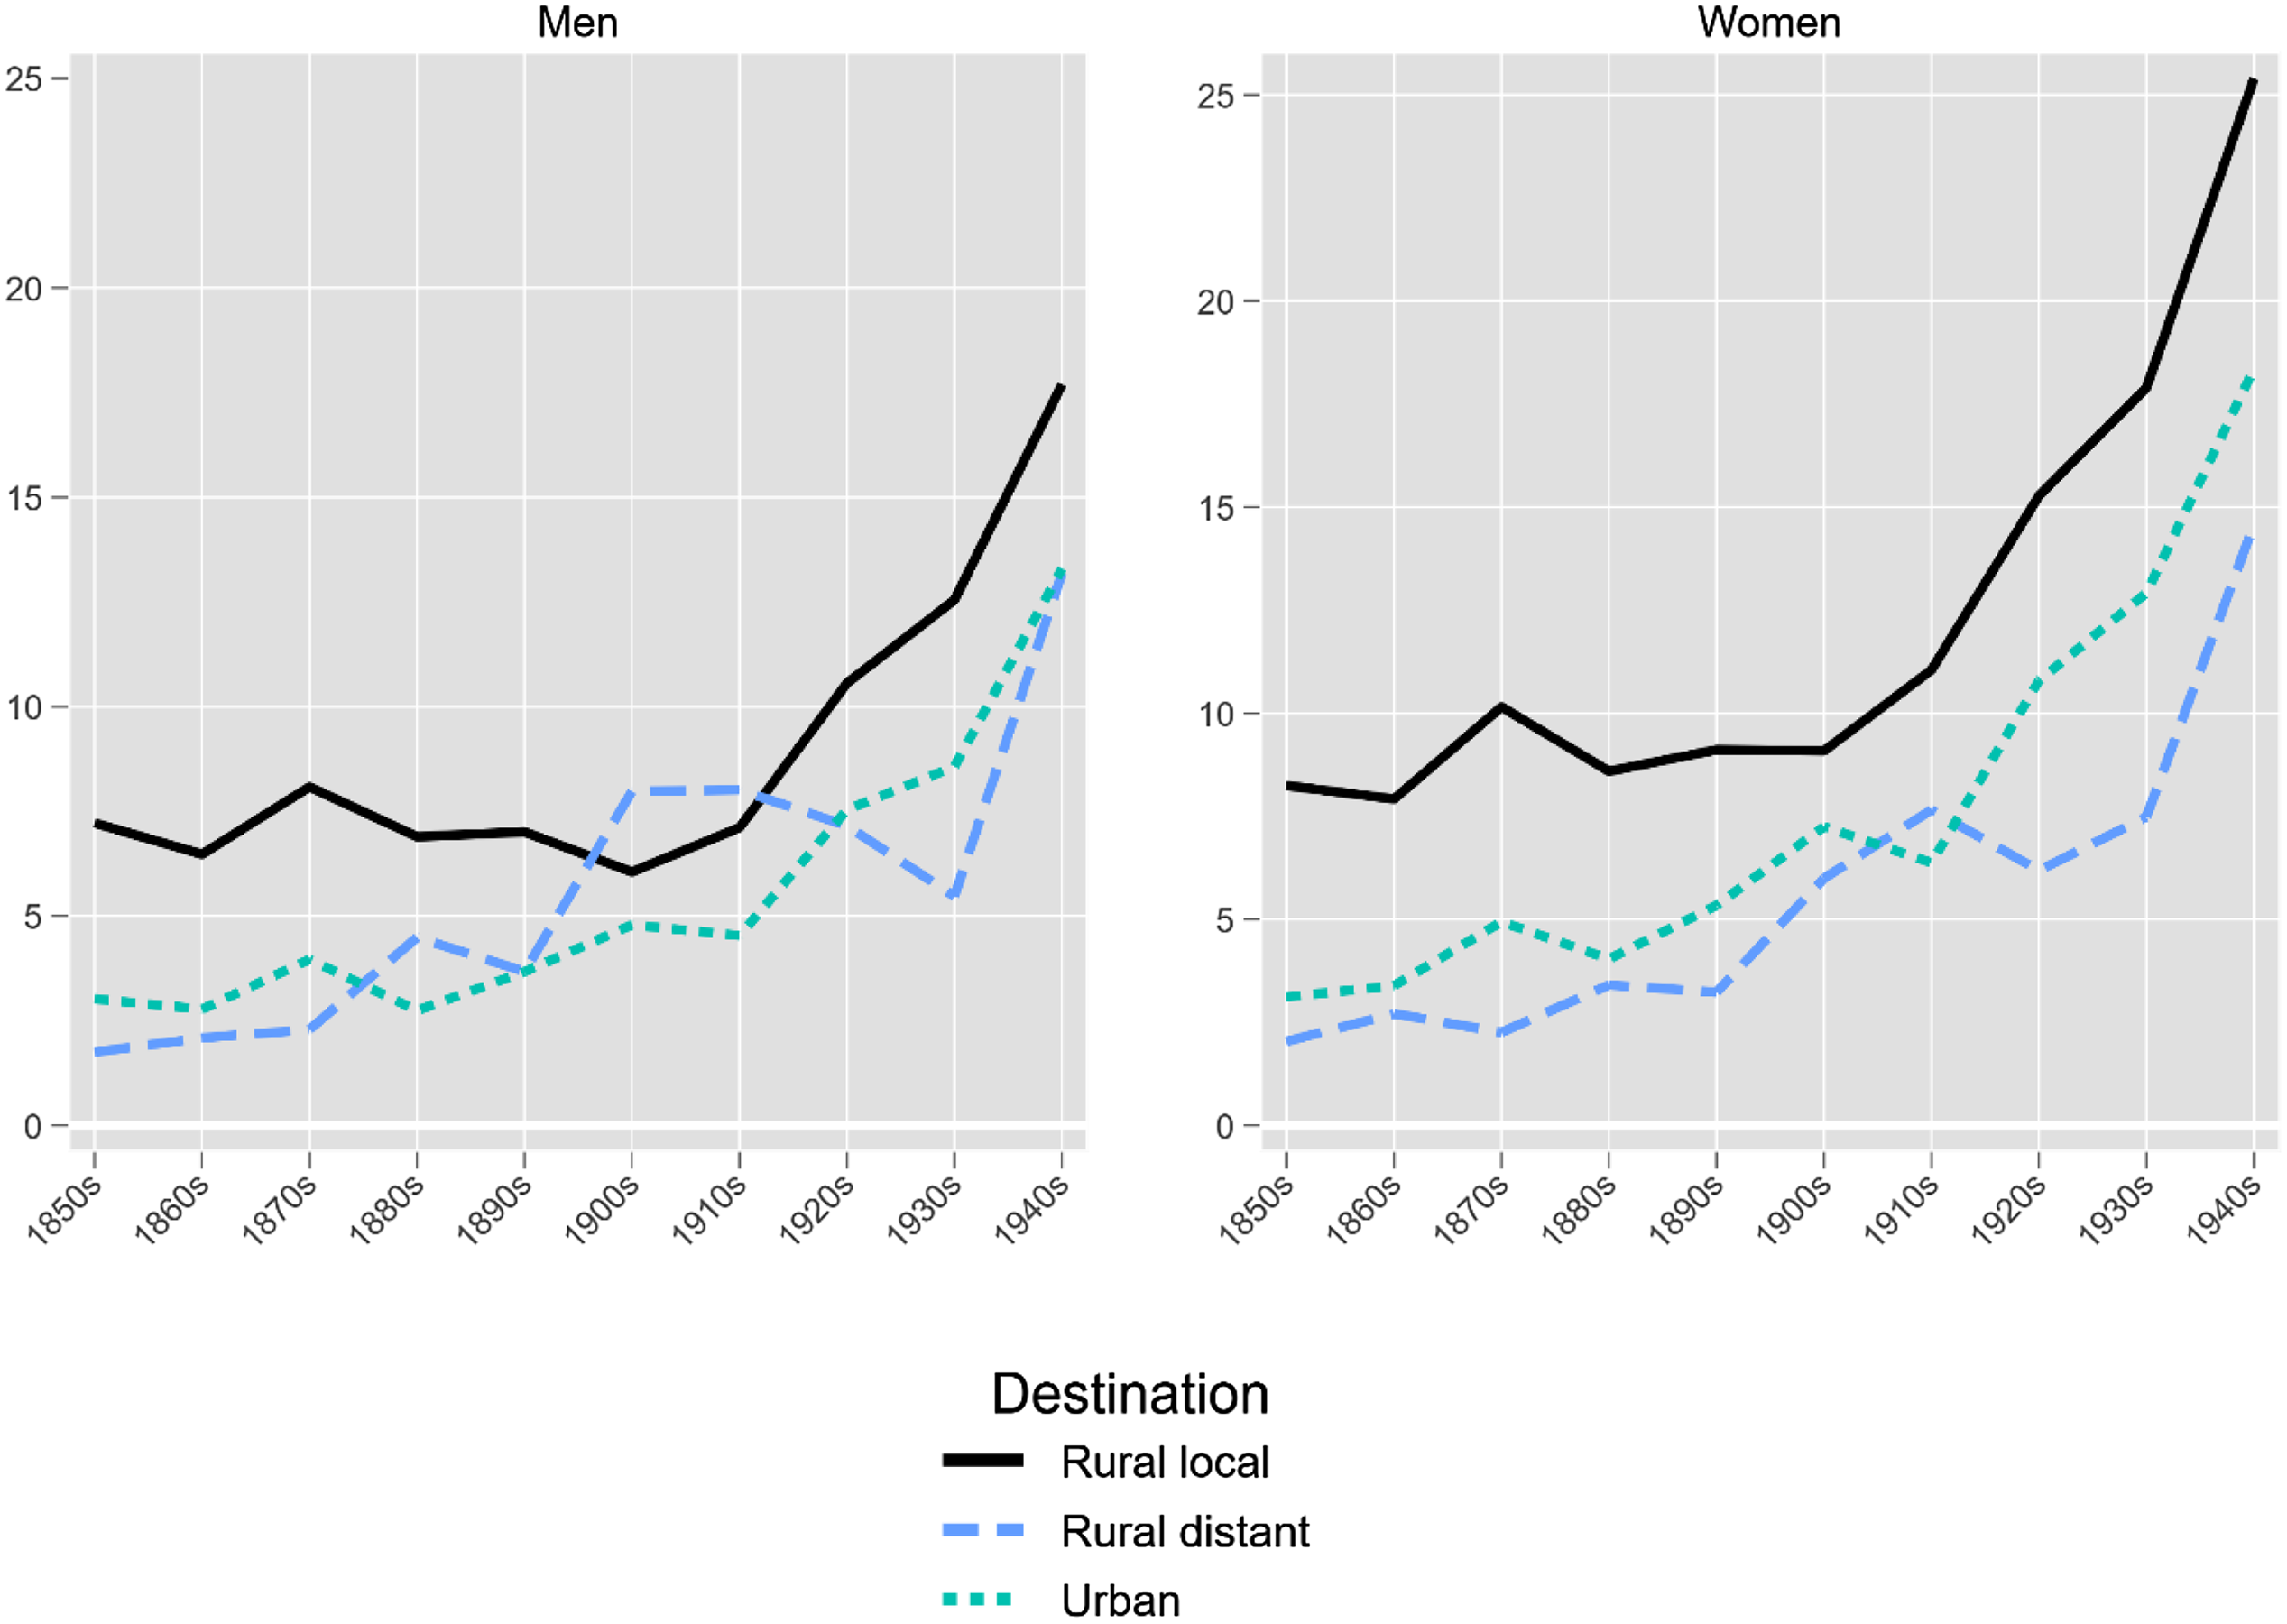
As most out-migrants were women, there was also a higher sex-specific out-migration for every 1,000 women than for every 1,000 men. However, the destination of the out-migrants was quite similar regardless of sex (Figure 8). The same trend outlined in Figure 6 holds for both genders throughout the investigated period. The development regarding the percentage of out-migrants moving to urban areas was similar, 25 per cent in 1850 and 30 per cent in 1950 for men and 23 per cent and 33 per cent for women. While the differences between the sexes regarding destination are small, the trend indicates that apart from being more migratory than men, women also chose to move to urban areas to a slightly larger extent during the industrialisation of the twentieth century.
Sex-specific out-migration rates per 1,000 men/women among the rural population of OPLINK by destination (1850–1950).
Note: Destination definition: Rural local includes all out-migrants moving to a rural parish in POPLINK or a rural parish adjacent to the parishes in POPLINK.
Rural distant includes all out-migrants moving to a rural parish not in or adjacent to POPLINK.
Urban includes all out-migrants moving to an urban parish, in or outside POPLINK.
Source: POPLINK.
The sector-specific migration did not develop similarly (Figure 9). While rural service and manual/industrial workers became more migratory as time progressed, the opposite was true for agricultural workers. The percentage of all outmigrants moving to urban areas increased in the service and agricultural sectors between 1850 and 1950 (26 to 35 per cent in the service sector, 24 to 31 per cent in the agricultural sector). The opposite was true in the manual/industrial sector, starting at 34 per cent in 1850 and 29 per cent in 1950. However, while local rural-to-rural migration was most common among agricultural and manual/industrial workers during the entire period, rural-to-urban migration sometimes was the most common among service workers.
Sector-specific out-migration rates per 1,000 sector-specific workers among the rural population of POPLINK by destination (1850–1950).
Note: Only individuals with a registered occupation are accounted for.
Agricultural: HISCO minor groups 61, 62 (farmers; agricultural and animal husbandry workers), and for women in a rural context HISCO minor group 54 (maids). Manual/Industrial: HISCO major groups 7, 8, 9 (production and related workers; transport equipment operators; shoemakers and leather goods makers; rubber and plastics product makers) and HISCO minor groups 63, 64 (forestry workers; fishermen, hunters and related workers). Service: HISCO major groups 0/1, 2, 3, 4, 5 (professionals, technical and related workers; administrative and managerial workers; clerical and related workers; sales workers; service workers except minor group 54 for women in a rural context).
Source: POPLINK.

The distance moved by the rural out-migrants generally increased with time (Figure 10). Seventy-one per cent of all rural out-migrants moved to an adjacent parish in the 1850s, and by the 1940s, just below 47 per cent moved to adjacent parishes. However, most rural out-migrants moved to an adjacent or relatively close parish (up to 100 km from the parish of origin) throughout the investigated period. In contrast, the percentage that moved more than 50 Scandinavian miles (500 km) increased from only 0.5 per cent to nearly 17 per cent in the same period. Rural-to-urban migrants drove this development; almost 28 per cent of rural-to-urban migrants moved more than 50 Scandinavian miles by 1950, mainly to the capital of Stockholm. However, most rural-to-urban migrants moved to one of the regional towns of Umeå or Skellefteå throughout the investigated period, 69 per cent in the 1850s, 57 per cent in the 1900s, and 53 per cent in the 1940s.
Destination of the rural out-migrants in POPLINK by year.
Source: POPLINK.

Discussion
This article proposes that the decentralised industrialisation of northern Sweden introduced inertia to the regional urbanisation process during the first half of the twentieth century. However, as this is a descriptive study, no definitive causal connection can be made between the results and their underlying causes. In this section, the descriptive findings will therefore be critically discussed in relation to the decentralised industrialisation model and other possible explanations for the low urbanisation rate. Thereby assessing the model’s potential for explaining the slow urbanisation of northern Sweden.
The main argument for decentralised industrialisation affecting rural migration is that demand for rural-industrial labour counterbalanced the demand for urban-industrial labour, thereby lowering the rural-to-urban migration rate. Additionally, it was proposed that this effect would be more apparent among men, as the decentralised industrial sector was mainly male-oriented. Furthermore, the inert effect of decentralised industrialisation on rural-to-urban movement is expected to have dissipated as rationalisation in the primary sector decreased demand for rural-industrial labour.
At face value, the findings in this descriptive study lend support to all these empirical predictions. The general development of rural migration follows the patterns we might expect based on the model of decentralised industrialisation. Rural-to-urban migration was initially low but would slowly increase, more so among women. The change was gradual, but by the 1940s, substantial out-migration would affect the rural population development adversely for the first time. This mirrors the development of rationalisation in the decentralised industrial sector around the middle of the twentieth century, which led to a decrease in the demand for rural-industrial labour.
Although the descriptive results indicate that decentralised industrialisation introduced inertia to the urbanisation process, they are far from conclusive. Other factors such as low demand for labour in the northern towns, socio-economic composition of the rural population, or low mobility and lacking infrastructure could also have contributed to the low rural-to-urban movement in northern Sweden during industrialisation. These alternative explanations for the low urbanisation rate will be discussed further in the remainder of this discussion.
Before the late nineteenth century, northern Swedish towns were generally small and undeveloped. However, many would grow rapidly during industrialisation as sawmills, mines, and harbours increased the demand for labour. The two investigated towns of Umeå and Skellefteå were no exception, experiencing rapid growth during the first half of the twentieth century. The population development in the rural and urban regions of Västerbotten (outlined in Figure 3) indicates that while net migration only had a small effect on population development in the rural areas until the 1940s, it had a very substantial effect on the population development in the towns. Very high net migration numbers drove the population development in the two towns during the most rapid expansion (1900–30). By the 1940s, the net value had decreased significantly but was still substantial.
The results indicate that the towns attracted many migrants relative to their size, with in-migration numbers of over 100 per 1,000 inhabitants during some decades. Many new labour opportunities, such as the Boliden mine near Skellefteå (est. in the 1920s) and the Rönnskärsverket blast furnace plant in Skellefteå (est. 1928), added to the already extensive sawmill industries around Umeå to create a diversified urban labour market that emerged in these towns during the early twentieth century (Sundin and Björkman, Reference Sundin and Björkman2015). Umeå and Skellefteå were also the preferred destinations of rural-to-urban migrants that moved from rural areas of Västerbotten during the entire investigated period. Over half of the rural-to-urban migrants (at any given time) moved to one of these towns. However, the towns also experienced significant in-migrations from other parts of Sweden. The percentage of in-migrants moving to Umeå and Skellefteå not coming from Västerbotten ranged from roughly 40–50 per cent during the investigated period. While most came from other northern counties, the towns undeniably attracted many in-migrants over long distances. Other rapidly growing towns could also be found relatively close to Västerbotten. In the adjacent southern county of Västernorrland, the sawmill town of Sundsvall attracted many in-migrants. During the late nineteenth century, over half of the in-migrations came from over 40 km away (Vikström, Reference Vikström2003: 94–102). In the northern county of Norrbotten, the newly established mining town of Kiruna expanded rapidly. The ore from Kiruna was transported on the Iron Ore (railroad) Line (est. 1888) to another rapidly growing town, the steel and harbour town of Luleå. In essence: while the northern Swedish towns by the late nineteenth century were small and far apart, they grew substantially and quickly because of industrialisation – mainly due to high migration over long distances. Thus, there is little indicating that the low rate of rural-to-urban movement resulted from low labour demand in the north compared to the south. Rather, the fact that almost half of the urban immigrants came from other parts of Sweden indicates that the decentralised industrialisation of the region made it difficult to meet the urban demand for labour simply by tapping the population of more adjacent rural areas where employment opportunities were relatively favourable due to the demand in extractive industries such as timber. Therefore, a substantial share of the labour force in the expanding urban industries had to be attracted from other parts of the country.
Another factor that can influence migration behaviour, and thereby the urbanisation rate, is socio-economic structure. In 1850 over 90 per cent of the population in both Scania – the southernmost province of Sweden – and Västerbotten lived in rural areas. By 1950, just over 40 per cent of the Scanian population lived in rural areas, but still over 80 per cent in Västerbotten (as defined by SCB, 1969: 55; see also Svanström, Reference Svanström2015). One difference between Scania and Västerbotten during this period was that a substantial part of the agricultural population were tenants in Scania, while a majority were freeholders in Västerbotten (Morell, Reference Morell2011). Socio-economic context matters in the decision to move or stay. Young, unmarried, and low SES individuals were generally the most mobile demographic during industrialisation (see, e.g., Hochstadt, Reference Hochstadt1999: 7; Jackson and Moch, Reference Jackson and Moch1989: 29; Vikström, Reference Vikström2003: 87–94; White and Woods, Reference White and Woods1980: 12–18). Furthermore, higher investment in the land and greater attachment to the place of residence has been shown to negatively influence the likelihood of moving (see, e.g., Gutman, 1980, ch. 1; Moch, Reference Moch1992: 38). However, while freeholders, most of the agricultural population of Västerbotten can hardly be classified as belonging to the upper economic strata during the investigated period. The farms were generally small (in some of the investigated parishes, the total field area was less than 2 hectares in more than 50 per cent of the farmsteads in 1900: Flach, Juhlin-Dannfelt, and Sundbärg, Reference Flach, Juhlin-Dannfelt and Sundbärg1909: 78) and often subsistence based. The emergence of rural-industrial labour, primarily in the timber industry, was what allowed the northern smallholders to obtain a sufficient income in many cases (Flygare, Reference Flygare2011; Gaunitz, Reference Gaunitz1977). The difference in the tenants-to-freeholders ratio between northern and southern Sweden should also not be overestimated. During the investigated period, the share of farms worked by tenants was always substantially less (and constantly decreasing) than the share worked by freeholders in the entire country (Morell, Reference Morell2011). Therefore, the specific socio-economic foundation of rural northern Sweden fails to satisfactorily explain the low rate of urbanisation in the region as the dominance of freeholders was not region specific, and the northern freeholders were not generally better off than elsewhere.
Furthermore, while still largely rural by 1950, Västerbotten was not nearly as agrarian as 100 years prior. In 1850, over 80 per cent of the working population could be found in the agrarian sector. By 1950, the manual/industrial and agricultural sectors were on par with one another, each composing around 40 per cent of the workforce. As it was common for the northern smallholders to work seasonally in the timber industry, the share of the population engaged in manual/industrial work was likely higher than the purely agricultural workforce by 1950. This means that while still largely agrarian, the rural workforce became increasingly engaged in various tasks related to the extractive industries such as logging, timber floating, transportation, and construction of infrastructure (roads, railroads, hydroelectric power) in rural areas necessary for the extraction of natural resources from the region. This shift in the economic foundation of the rural north is indicative of the rapid expansion of decentralised industrialisation.
Now let us turn to the mobility of the rural population. Low mobility, due to lack of infrastructure or otherwise, could also have contributed to the low urbanisation rate. Overall, the cross-parish movement increased significantly from the late nineteenth century onwards. Furthermore, migrations also became more distant over time. This indicates that the northern rural population was not immobile or stuck in preindustrial migration patterns during industrialisation. However, the trend was the opposite among the working population in the agricultural sector. As the number of farmers decreased in absolute and relative numbers, the ones still engaged in the sector seemed to have become more tied to the land, especially compared to the landless manual/industrial workers. This is likely a consequence of multiple factors. Perhaps most notably, the disappearance of the life-cycle service system where young adults were expected to go through a period of service in a household other than the parental before getting married and starting a household of their own. This both served as a way to accumulate economic resources and a way of learning the skills necessary to run a farm of their own. The system was widespread in agrarian society until the 1900s but would dissipate as new structures of home leaving emerged during industrialisation (Harnesk, 1900; Kok, Reference Kok1997; Lundh, Reference Lundh1999; Dribe and Lundh, Reference Dribe and Lundh2005; Sundvall, Lundh, Dribe and Sandström, Reference Sundvall, Lundh, Dribe and Sandström2023). The increased cross-parish movement was driven mainly by people in the manual/industrial sector, indicating that as larger groups became dependent on logging and other wage labour in rural areas, cross-parish migration became more common and increasingly distant.
The expansion of infrastructure further enabled the increase in cross-parish movement and distance. Geographical barriers make migration harder, even more so without proper infrastructure (Kronborg and Nilsson, Reference Kronborg and Nilsson1975: 85–105; Åkerman Reference Åkerman1971: 77; Hägerstrand Reference Hägerstrand1947: 123 ff; Moch Reference Moch1992: 127–31) During most of the nineteenth century, infrastructure was often lacking, especially in the inland parts of Västerbotten. Large-scale expansion in the road and railroad networks were undertaken towards the end of the century (Lasilla, Reference Lasilla2004). The development of infrastructure eased the process of movement, and the economic and labour market expansions eased and incentivised more distant migration as time went on (Eriksson and Rogers, Reference Eriksson and Rogers1973; Martinius, Reference Martinius1967: 65–90; Thomas, Reference Thomas1941: 26–8, 112–66). While most migrants still moved to adjacent parishes in 1950, the trend points towards more distant migration becoming increasingly more common during the first half of the twentieth century, indicating that the low rural-to-urban movement was likely not the result of lacking communications.
In summary: none of the alternative explanations addressed in this discussion could satisfactorily explain the development of rural migration in the results. It is not likely that low demand from northern towns was the main contributing factor to the relatively low rural-to-urban movement, as northern towns grew rapidly and attracted migrants from all over Sweden. The socio-economic foundation of the northern rural areas was likewise not a satisfactory explanation. Freeholding was the norm in Sweden by the late nineteenth century and was not region-specific, therefore, the low urban-to-rural movement was likely not a consequence of northerners being extensively more ‘tied to the ground’ than the southern population. Furthermore, the quick and drastic expansion of the manual/industrial sector indicates that the county developed rapidly away from agricultural dominance, although without high rural-to-urban movement. Lack of infrastructure and communications can also not explain the low rural-to-urban movement, as the rural population became increasingly mobile and moved progressively longer distances over time. While aspects of these explanatory models might have influenced the northern rural migration during industrialisation, they fail to explain the general development of population structure and migration patterns described in the results.
Conclusions
The results of this study indicate that decentralised industrialisation seems to have contributed to the low rural-to-urban movement, thereby introducing inertia to the urbanisation of northern Sweden during the late nineteenth to the mid-twentieth centuries. The urbanisation process was initially slow but would increase steadily throughout the investigated period. A substantial increase in rural out-migration occurred in the 1940s, mirroring the decreased demand for rural-industrial labour caused by rationalisation. Furthermore, during industrialisation, women started moving to towns at an increasingly higher rate than men. This is indicative of the male-oriented decentralised industrial labour market having a gender-specific effect on migration. However, it should be noted that this is not a region-specific trend as women moved to towns more than men in the entire country and are, therefore, not solely indicative of decentralised industrialisation affecting rural migration.
During industrialisation, the rural population became increasingly less agrarian. Around the middle of the twentieth century, the rural manual/industrial economic sector was on par with the agricultural sector. However, this restructuring did not immediately lead to a drastic drop in rural net migration. Cross-parish rural-to-rural movement increased significantly as more people became engaged in non-agricultural rural labour. The movement of the rural-industrial workforce and the expansion of the manual/industrial economic sector indicate the existence of a rural labour-market demand for non-agricultural workers during the investigated period. The rural-to-rural movement was still substantial by the 1940s. However, rural-to-urban migration had increased significantly by then, and rural out-migration was further reinforced with more distant migrations to the south of Sweden.
The development indicates that decentralised industrialisation was not a system counteracting urbanisation but one that introduced inertia to the process. As the economic structures that lowered the rural-to-urban migration rate disappeared, so did the inertia to urbanisation. Subsequently, depopulation via significant out-migration started to affect the northern rural areas. This trend would continue during the following decades and into the twenty-first century. Apart from the high negative net migration leading to negative population growth, other demographic consequences such as rapid ageing (via age-specific migration), skewed sex ratios (via sex-specific migration),Footnote 7 and subsequently lowered nativity also started to affect rural northern Sweden during the postwar years (SOU 2020: 8, 167–73, 181–91; Löfgren and Thuresson, Reference Löfgren and Thuresson2015). High negative net migration worked in tandem with the decreasing natural growth, mutually reinforcing rural depopulation. This phenomenon has also been observed in other countries, e.g., by Johnson and Lichter (Reference Johnson and Lichter2019) in their study on rural depopulation in the US during the twentieth century. The dissipation of the rural-to-urban inertia in these northern rural areas can therefore be described as a transition from slow demographic change under the decentralised industrial period and a faster rate of change during the postwar period. This illustrates the (often very long-term character) of many demographic processes (Billari, Reference Billari2022).
Many other factors apart from economics can affect rural migration behaviour. For example, political, cultural, and social factors. While these have not been addressed in this paper, it does not mean that only economic structures influenced migration development. Nevertheless, the extensive, aggregated data and the longitudinal approach taken here clearly show the development of long-term patterns of migration that correspond to the development of the region’s economic foundation and the rise and fall of the decentralised industrial system. The results also align with previous studies showing that decentralised industrialisation leads to decreased rural-to-urban movement (Ho, Reference Ho1979). Furthermore, the development of the northern rural population mirrors that of similar countries such as Finland, where the same rural system of agricultural and industrial amalgamation occurred in some regions (also primarily centred around timber); in these places, the general development of urbanisation mirrors that of northern Sweden (Heikkilä and Järvinen, Reference Heikkilä and Järvinen2002; Kotavaara, Antikainen, and Rusanen, Reference Kotavaara, Antikainen and Rusanen2011; Smeds and Mattila, Reference Smeds and Mattila1941).
Although the results in this study indicate that decentralised industrialisation introduced inertia to the rural-urban movement in Västerbotten, more research is needed to further explore this model, both regarding its validity and generalisability. For example, comparative studies between decentralised industrialised areas and areas that remained wholly agrarian, both in Sweden and elsewhere.
Data
The Demographic Database (DDB), Centre for Demographic and Ageing Research (CEDAR), Umeå University (2001) <DOI 10.17197/U20006>.


 Open access