


Introduction
All humans need sleep. At its biological roots, sleep is a state of unconsciousness that is governed by neurotransmitters in our brains and required for basic human functioning (Crick & Mitchison, Reference Crick and Mitchison1983; Huber et al., Reference Huber, Felice Ghilardi, Massimini and Tononi2004; Saper et al., Reference Saper, Scammell and Lu2005; Tobler et al., Reference Tobler, Gaus, Deboer, Achermann, Fischer, Rülicke, Moser, Oesch, McBride and Manson1996). As with all important constructs, different definitions of sleep exist (Cleveland Clinic, n.d.; National Institutes of Health, n.d.). Why we sleep, specifically—whether for reasons articulated by inactivity theory, energy conservation theory, restorative theory, or brain plasticity theory (Frank, Reference Frank2006; Porkka-Heiskanen, Reference Porkka-Heiskanen1999; Siegel, Reference Siegel2005)—is disputed. What is not disputed, though, is that this behavior is necessary at regular, repeated intervals. Sleep finds itself in a core group of behaviors necessary for survival, alongside things like eating, drinking, and breathing. The scientific importance of studying sleep is evidenced by the awarding of the Nobel Prize in Physiology and Medicine in 2017 for research on circadian rhythms and sleep patterns (The Nobel Prize, 2017). Sleep problems are especially important today because many people in industrialized nations struggle to get enough sleep; for example, some estimates suggest that between 50 million and 70 million Americans suffer from chronic sleep deprivation every year (National Heart, Lung, and Blood Institute, 2022).Footnote 1 (Sleep issues are not restricted to the United States; see, e.g., Hafner et al., Reference Hafner, Stepanek, Taylor, Troxel and Van Stolk2017.)
A large and rapidly growing literature suggests that sleep levels and quality influence virtually every aspect of our modern lives—from how we feel to how we spend our time. Specifically, prior research shows that people who get insufficient sleep or whose sleep patterns are disrupted in negative ways have worse moods (Abele et al., Reference Abele, Gendofla and Petzold1998; Haack & Mullington, Reference Haack and Mullington2005; Hansen et al., Reference Hansen, Sonderskov, Hageman, Dinesen and Ostergaard2017; Heboyan et al., Reference Heboyan, Stevens and McCall2019; Kuehnle & Wunder, Reference Kuehnle and Wunder2016; Vandekerckhove et al., Reference Vandekerckhove, Weiss, Schotte, Exadaktylos, Haex, Verbraecken and Cluydts2011), more mental and physical health challenges (Dickinson et al., Reference Dickinson, Wolkow, Rajaratnam and Drummond2018; Giuntella & Mazzonna, Reference Giuntella and Mazzonna2015; Gu et al., Reference Gu, Xu, Devesa, Zhang, Klerman, Graubard and Caporaso2017; Hansen et al., Reference Hansen, Sonderskov, Hageman, Dinesen and Ostergaard2017; Heissel et al., Reference Heissel, Levy and Adam2017; Horne, Reference Horne1993; Kolla et al., Reference Kolla, Coombes, Morgenthaler and Mansukhani2021; Koopman et al., Reference Koopman, Rauh, t Riet, Groeneveld, Van Der Heijden, Elders, Dekker, Nijpels, Beulens and Rutters2017; Roenneberg et al., Reference Roenneberg, Allebrandt, Merrow and Vetter2012; Wong et al., Reference Wong, Hasler, Kamarck, Muldoon and Manuck2015), lower productivity (Giuntella & Mazzonna, Reference Giuntella and Mazzonna2019; Jiddou et al., Reference Jiddou, Pica, Boura, Qu and Franklin2013), and hindered cognitive capacity (Chee & Chuah, Reference Chee and Chuah2008; Dickinson & McElroy, Reference Dickinson and McElroy2010; Giuntella et al., Reference Giuntella, Han and Mazzonna2017; Heissel et al., Reference Heissel, Levy and Adam2017; Heissel & Norris, Reference Heissel and Norris2018; Lim & Dinges, Reference Lim and Dinges2010; Muzur et al., Reference Muzur, Pace-Schott and Hobson2002; Stickgold, Reference Stickgold2005; Wagner et al., Reference Wagner, Gais, Haider and Born2004). These individual changes also seem to create macro-level effects, as communities that sleep less have worse economic performance (Berument et al., Reference Berument, Dogan and Onar2010; Giuntella & Mazzonna, Reference Giuntella and Mazzonna2019), higher crime (Doleac & Sanders, Reference Doleac and Sanders2015; Domínguez & Asahi, Reference Domínguez and Asahi2019), lower student test scores (Giuntella et al., Reference Giuntella, Han and Mazzonna2017; Heissel et al., Reference Heissel, Levy and Adam2017; Heissel & Norris, Reference Heissel and Norris2018), and lower participation in democratic elections (Holbein et al., Reference Holbein, Schafer and Dickinson2019; Potoski & Urbatsch, Reference Potoski and Urbatsch2017; Schafer & Holbein, Reference Schafer and Holbein2020; Urbatsch, Reference Urbatsch2014), to name a few effects (Bliwise, Reference Bliwise2008).
In addition to sleep levels, sleep disruptions—the focus of this article—also seem to be important.Footnote 2 Specifically, it appears that both short-term (which we leverage in this article) and longer-term sleep disruptions matter. For example, the relatively short-term disruptions that happen when travelers are jet-lagged (Foster et al., Reference Foster, Peirson, Wulff, Winnebeck, Vetter and Roenneberg2013; Levandovski et al., Reference Levandovski, Dantas, Fernandes, Caumo, Torres, Roenneberg, Hidalgo and Allebrandt2011; Taillard et al., Reference Taillard, Sagaspe, Philip and Bioulac2021) or when time changes occur in the spring and fall (Berument et al., Reference Berument, Dogan and Onar2010; Hansen et al., Reference Hansen, Sonderskov, Hageman, Dinesen and Ostergaard2017; Heboyan et al., Reference Heboyan, Stevens and McCall2019; Jiddou et al., Reference Jiddou, Pica, Boura, Qu and Franklin2013; Kolla et al., Reference Kolla, Coombes, Morgenthaler and Mansukhani2021; Kountouris, Reference Kountouris2021; Kuehnle & Wunder, Reference Kuehnle and Wunder2016; Laliotis et al., Reference Laliotis, Moscelli and Monastiriotis2019; Munyo, Reference Munyo2018; Rivers, Reference Rivers2018; Roenneberg et al., Reference Roenneberg, Winnebeck and Klerman2019; Sexton & Beatty, Reference Sexton and Beatty2014; Smith, Reference Smith2016) and longer-term disruptions such as living on the eastern side of time-zone boundaries, which interrupts normal circadian rhythms (Giuntella et al., Reference Giuntella, Han and Mazzonna2017; Gu et al., Reference Gu, Xu, Devesa, Zhang, Klerman, Graubard and Caporaso2017; Holbein et al., Reference Holbein, Schafer and Dickinson2019; Roenneberg et al., Reference Roenneberg, Winnebeck and Klerman2019; Schafer & Holbein, Reference Schafer and Holbein2020), both appear to have important consequences (Roenneberg, Reference Roenneberg2013; Sadeh et al., Reference Sadeh, Raviv and Gruber2000; Tikotzky & Sadeh, Reference Tikotzky and Sadeh2001).
What previous research has not told us, though, is whether sleep disruptions of these varieties (and their downstream consequences) will drive society to continue to fracture along important fault lines. With societal cleavages seeming to be at all-time highs (Cramer, Reference Cramer2020; Iyengar et al., Reference Iyengar, Lelkes, Levendusky, Malhotra and Westwood2019), macro-level trends toward worse sleep potentially overlapping with rising trends toward more division, and preliminary work linking sleep with the breakdown of societal norms and connections, the question remains: does disrupted sleep play a role in causing the social fragmentation we see?
Unfortunately, few researchers have tried to answer this question directly. We have little knowledge about whether sleep-disrupted individuals see the world around them and orient themselves within it differently. People who have disrupted sleep are less likely to engage with the world around them in political and civic domains—that is, the literature shows that a lack of sleep influences social engagement levels (Anderson & Dickinson, Reference Anderson and Dickinson2010; Holbein et al., Reference Holbein, Schafer and Dickinson2019; Potoski & Urbatsch, Reference Potoski and Urbatsch2017; Schafer & Holbein, Reference Schafer and Holbein2020). However, we do not know the extent to which sleep disruptions influence how individuals engage with the world around them and the people in it, nor do we know whether sleep disruptions affect how individuals position themselves in that world. Although changes to mood, mental and physicial health, productivity, thought processing, and social context cumulatively come together to predict an effect on social and political views, little empirical research has examined these links directly. Within that literature, rigorous quantitative study is the exception rather than the rule—after all, much of the research in this space is correlational in nature—as it is based on conditional-on-observables research designs. Moreover, much of the research on the effects of sleep and sleep disruptions comes from small and nonrepresentative samples. Therefore, we do not yet know whether sleep disruptions causally influence the general public’s political and social beliefs, including all-important levels of polarization and discrimination.
Do changes to sleep also shape how people see the world, the people around them, and themselves in relation to those groups? To explore this question, we use a uniquely large and broad data set—the Nationscape Survey (NS) conducted by the University of California, Los Angeles (UCLA). The NS is a rolling, nationally representative political survey conducted during 2019–2021. This data set measures a range of outcomes that are theoretically connected to sleep (as we describe in the next section), such as measures of citizens’ polarization—that is, their ideology, policy positions, evaluations of candidate performance, and evaluations of the out-party—and discrimination—that is, racial resentment, gender resentment, and evaluations of many racial/ethnic/religious/social majority and minority groups, including feelings toward Black people, White people (and White males specifically), Latinx people, Asian people, socialists, evangelicals, Muslims, labor unions, the police, undocumented immigrants, LGBT+ people, and Jewish people. In Figure S22 in the Appendix, we display the correlations across individual items analyzed here. The matrix reveals two broader constructs that are related to social fragmentation: those that involve political attitudes and those that revolve around broader social attitudes. For ease of interpretation, we label these two dimensions polarization and discrimination. We examine the individual measures in order to respect the idiosyncrasies of individual relationships between outcomes, but the results do not change if we construct two scales. All of these outcomes are theoretically connected to sleep disruptions (as we describe in the next section). We examine the entire range of outcomes—instead of just one or two—both because doing so (1) helps us make our analysis more complete and (2) serves as a check against selective reporting of results, which can be the result of HARKing (hypothesizing after the results are known; see Kerr, Reference Kerr1998) and lead to publication bias (Easterbrook et al., Reference Easterbrook, Gopalan, Berlin and Matthews1991; Franco et al., Reference Franco, Malhotra and Simonovits2014; Gerber & Malhotra, Reference Gerber and Malhotra2008; Lakens, Reference Lakens2015; Open Science Collaboration, 2015).
To understand the effect of sleep disruptions on these outcomes, we leverage the (modest) sleep shock that occurs at the start (and end) of Daylight Saving Time (DST). This article employs a regression discontinuity in time design (RDiT). Regression discontinuity designs, in general, allow researchers to make causal inferences with modest assumptions (as we describe later). The RDiT employed here specifically takes advantage of the daily measures in the NS data and the fact that the shift to DST in the spring is exogenous within a limited temporal range. As a robustness check, we test for any effects that arise in the transition from DST to Standard Time that occurs in the fall; this is not our main specification, however, given that prior research shows inconsistent effects of “falling back” on sleep. Given the close overlap with the election that occurred in 2020—which is not a problem in the spring period—we look for effects at both the 2019 and 2020 fall cutoffs.Footnote 3 (There is no NS data for the spring change to DST in 2021.) We also explore the possible heteterogeneous effects of sleep by survey respondents’ political party, race, gender, religion, age, education, and income.
We find that despite strong theoretical expectations, DST-induced sleep changes have little to no effect on citizens’ attitudes about the political system or the world around them. Specifically, the DST shock does not systematically affect or polarize political outcomes such as citizens’ ideology, policy positions, evaluations of the performance of politicians, or evaluations of people who belong to the other political party. It also does not affect their discriminatory beliefs as captured in measures such as racial/gender resentment and discriminatory attitudes towards racial/ethnic/religious/social out-groups. Using equivalence testing, we show that the effects we observe are precise enough to rule out very small effects. The effects are also consistent across a host of reasonable specification and robustness checks, including the use of the fall time change instead of the spring, a donut RDiT that adjusts for any precise manipulation around the cutoff, the inclusion of day-of-the-week fixed effects, conceptualizing treatment as the Monday after DST, and running event study models that more flexibly examine the evolution of effects pre- and post-treatment. Our results are consistently present across all of the outcomes tested, even when similar items are scaled together to reduce residual variance. The null effects are consistent—being present across different outcomes, the political spectrum, and across various racial/ethnic groups, age, gender, religious, education, and income groups. Our null effects are highly precise. This is because our study is very well powered—with nearly a half million observations overall and approximately 40,000 observations for most of our outcomes within a month of the time change cutoff. This means that our effects are both very precisely estimated and highly unlikely to be the result of Type M (magnitude) and S (sign) errors (Gelman & Carlin, Reference Gelman and Carlin2014).
In short, our results suggest that while sleep disruptions of the variety that we can readily observe and study affect a host of attitudes and behaviors—including, but not limited to, mood, stress, cognitive processes, physical activity, health, crime, civic engagement, and economic behaviors—these effects do not drive social fragmentation. Sleep disruptions—at least of the modest variety that we explore here—do not influence individuals’ core social and political beliefs about the world, the people around them, how well leaders of import are performing, or their views on how various social problems should be solved.
These precise null effects are an important contribution. The broader (non)consequences of sleep disruptions are vital to understand given the core role that sleep plays. We need to consider not only what sleep disruptions do influence, but also what they do not influence, as this can (1) help researchers better calibrate theoretical models about the role that sleep (and sleep disruption) plays in human behavior, (2) inform future research, and (3) help contribute to policy discussions about the benefits and the nonbenefits of public and private interventions to improve the quality and quantity of sleep. Our work also contributes to an active debate on the merits of changes to DST; for example, in March 2023, the U.S. Senate passied legislation to shift time changes from the status quo by making DST permanent. Beyond these contributions to the study of sleep and its effects, our research also provides empirical findings that should interest many scholars studying discrimination (Cramer, Reference Cramer2020) and political polarization (Iyengar et al., Reference Iyengar, Lelkes, Levendusky, Malhotra and Westwood2019). Our research helps push forward our understanding of what does and what does not influence two key drivers of social fragmentation.
Background and conceptual framework
To better understand the causal effect of disruptions to sleep, we leverage the (modest) exogenous shock to sleep that occurs around changes to and from DST. Changes to and from DST in the spring and fall (respectively) represent a shock to sleep that is exogenous (i.e., orthogonal) to many other factors thought to drive the outcomes we examine (Kamstra et al., Reference Kamstra, Kramer and Levi2000). Changes to and from DST occur in the middle of the night and are, functionally, about changing the hours that people have available in their restful versus their waking states. Time changes also potentially disrupt normal sleeping patterns. Importantly for our identification strategy, shifting the periods of light and dark (arguably) gets as close to a random shift to individual sleep patterns as is possible in the real world.Footnote 4
Consistent with this conceptualization, prior research has shown that humans are most vulnerable to sleep deprivation in early March, as they transition from Standard Time to DST. People lose one hour of time in the spring by setting their clocks forward in the early hours of the morning. This shift forward means that there will be more light later into the evening, thus presenting a disruption to individuals’ circadian rhythms (Roenneberg et al., Reference Roenneberg, Winnebeck and Klerman2019). This shock represents a modest change to sleep patterns. While an hour is lost, there is evidence that people exhibit some compensating behavior around DST changes (Sexton & Beatty, Reference Sexton and Beatty2014). Still, previous research suggests that the spring transition from Standard Time to DST results in up to 40 minutes less sleep (Barnes & Wagner, Reference Barnes and Wagner2009; Sexton & Beatty, Reference Sexton and Beatty2014). This effect represents upwards of two-thirds of the total time lost in the spring transition. The relationship between sleep and the fall change back to Standard Time is more complex. Summarizing prior work, the Sleep Foundation puts it thus: “Major sleep disruptions are less likely to occur in November when DST ends and Standard Time begins. In fact, gaining an extra hour of sleep often leaves people feeling more refreshed following the end of DST. However, people may experience some moderate [negative sleep] effects” (Pacheco, Reference Pacheco2020). (This fact and the close overlap between “fall back” and elections are the reasons why we leverage spring changes to DST as our primary identification strategy and fall changes only as a robustness check.)
Outcomes and their theoretical connection to sleep disruptions
There are multiple reasons to expect that people who experience a sleep disruption of the variety that we study here may exhibit attitudes that drive social fragmentation. This may show up in their different political and social attitudes, and it may be seen in enhanced political polarization and heightened levels of discrimination. Specifically, in this article, we examine people’s attitudinal patterns in terms of their political ideology, policy positions, evaluation of political leaders (belonging to both in- and out-groups), and views toward in- and out-parties. We also examine individuals’ discriminatory attitudes toward racial/ethnic/religious/social majority and minority groups. Each of these outcomes has a strong theoretical connection to sleep disruptions. We describe how prior research and theory connect sleep disruptions with the outcomes that we explore. (In the next section, we outline how each of our outcomes is measured.)
Our outcomes have a similar set of mechanisms in play, which include propensity to participate, mood/affect, personality characteristics, stress/threat, thought processes, and social context. The mechanisms here are likely many and complex; therefore, precisely identifying exact mechanisms is inherently difficult (Green et al., Reference Green, Ha and Bullock2010). It is not our intention to tease apart these individual mechanisms here. Rather, our goal is to lay the theoretical justification for examining sleep disruptions and people’s views about the world around them, their fellow citizens, and themselves. The many mechanisms at play here justify examination, but these mechanisms cannot be easily disentangled.
We test for treatment effect heterogeneity across several dimensions, such as race, party, gender, religion, age, education, and income, as these are likely strong predictors of our outcomes of interest. Looking at effects by political party, in particular, allows us to see whether DST promotes political polarization. However, the other dimensions also allow us to see whether sleep disruption fragments society along other potential cleavages. Moreover, we note that some of the outcomes we examine are likely more malleable than others. Some attitudes harden as people age; hence, in the analyses that follow, one of the checks we also run is to see whether the effects of DST vary by age.
Sleep disruptions and political positions/political polarization
There are several reasons why sleep disruptions could affect individuals’ political views—where people stand on specific policy issues, where they see themselves ideologically, how they evaluate political leaders, and how they approach individuals in their own political party and the opposing party. These mechanisms include: first, increases in engagement levels and all of the experiences that follow this change; second, changes to psychological beliefs; and third, shifts in contextual circumstances.
First, prior research has shown that sleep shocks influence levels of engagement in politics (Holbein et al., Reference Holbein, Schafer and Dickinson2019; Ksiazkiewicz & Erol, Reference Ksiazkiewicz and Erol2022b; Potoski & Urbatsch, Reference Potoski and Urbatsch2017; Schafer & Holbein, Reference Schafer and Holbein2020). For example, Urbatsch (Reference Urbatsch2014) leverages the DST transition in the fall to examine turnout in U.S. presidential elections and finds that longer sleep in the fall increases turnout. This shift in participation results in changes to vote shares in elections (Schafer & Holbein, Reference Schafer and Holbein2020); however, it could also result in attitudinal changes that predate partisan voting. Those who participate in politics enter into an arena that is highly politicized and polarized. Exposure to this environment may be transformative. Participation, then, is only one logical step away from the direction of said participation; after all, those who participate actively tend to be stronger in their ideological/policy views (Bartels, Reference Bartels2000). If this relationship is causal, a shock to an individual’s participation levels may change their political beliefs. Being exposed to or removed from political systems, and everything that comes with those changes (e.g., changes to information streams, social networks, etc.), may spur people’s political views to change as well.Footnote 5
Second, it is possible that people’s political positions change when they experience the psychological changes that follow sleep disruptions. Prior research has shown that sleep disruptions decrease individual mood/affect (Haack & Mullington, Reference Haack and Mullington2005; Hansen et al., Reference Hansen, Sonderskov, Hageman, Dinesen and Ostergaard2017; Heboyan et al., Reference Heboyan, Stevens and McCall2019; Kuehnle & Wunder, Reference Kuehnle and Wunder2016; Vandekerckhove et al., Reference Vandekerckhove, Weiss, Schotte, Exadaktylos, Haex, Verbraecken and Cluydts2011), spark changes to personality characteristics (Anderson & Dickinson, Reference Anderson and Dickinson2010; Castillo et al., Reference Castillo, Dickinson and Petrie2017; Dickinson & McElroy, Reference Dickinson and McElroy2017; McKenna et al., Reference McKenna, Dickinson, Orff and Drummond2007), catalyze changes in thought processes (Dickinson & McElroy, Reference Dickinson and McElroy2010; Heissel et al., Reference Heissel, Levy and Adam2017; Heissel & Norris, Reference Heissel and Norris2018; Lim & Dinges, Reference Lim and Dinges2010), and lead to a heightened sense of social threat (Dahl & Lewin, Reference Dahl and Lewin2002; Prather et al., Reference Prather, Bogdan and Hariri2013; Sadeh, Reference Sadeh1996; Straus et al., Reference Straus, Dolsen, Nishimi, Neylan and O’Donovan2022; Tashjian and Galván, Reference Tashjian and Galván2020). This research on the psychological effects of sleep disruptions can be married with studies showing that mood/affect (Bassi, Reference Bassi2013; Bernardi et al., Reference Bernardi, Mattila, Papageorgiou and Rapeli2023; Ojeda, Reference Ojeda2015), personality characteristics (Dahl & Lewin, Reference Dahl and Lewin2002; Gerber et al., Reference Gerber, Huber, Doherty and Dowling2011; Mondak, Reference Mondak2010; Verhulst et al., Reference Verhulst, Hatemi and Martin2010), thought processes (Hodson & Busseri, Reference Hodson and Busseri2012; Onraet et al., Reference Onraet, Van Hiel, Dhont, Hodson, Schittekatte and De Pauw2015; Zmigrod et al., Reference Zmigrod, Rentfrow and Robbins2020), health (Dickinson et al., Reference Dickinson, Wolkow, Rajaratnam and Drummond2018; Giuntella & Mazzonna, Reference Giuntella and Mazzonna2015; Gu et al., Reference Gu, Xu, Devesa, Zhang, Klerman, Graubard and Caporaso2017; Hansen et al., Reference Hansen, Sonderskov, Hageman, Dinesen and Ostergaard2017; Heissel et al., Reference Heissel, Levy and Adam2017; Horne, Reference Horne1993; Kolla et al., Reference Kolla, Coombes, Morgenthaler and Mansukhani2021; Koopman et al., Reference Koopman, Rauh, t Riet, Groeneveld, Van Der Heijden, Elders, Dekker, Nijpels, Beulens and Rutters2017; Roenneberg et al., Reference Roenneberg, Allebrandt, Merrow and Vetter2012; Wong et al., Reference Wong, Hasler, Kamarck, Muldoon and Manuck2015), and threat perceptions (Enos, Reference Enos2016; Giles & Hertz, Reference Giles and Hertz1994; Homola, Reference Homola2021; Keen & Jacobs, Reference Keen and Jacobs2009; Malhotra & Popp, Reference Malhotra and Popp2012; Reny & Newman, Reference Reny and Newman2018) may shape political preferences. (We note that much of this research in political science relies on conditional-on-observables research designs, leaving us uncertain whether these forces actually cause changes in political beliefs. We return to this point in the Discussion.) This link makes it easy to imagine how a shock to sleep might change political beliefs. For example, people who have a more negative mood may evaluate members of the political out-group more negatively. Similarly, prior work has shown that sleep disruption/deprivation increases the odds that a person has a major depressive episode (e.g., Boakye et al., Reference Boakye, Olechowski, Rashiq, Verrier, Kerr, Witmans, Baker, Joyce and Dick2016). And depression correlates (conditional-on-observables) with political beliefs and actions (Ojeda, Reference Ojeda2015). Prior research has also shown that sleep disruption/deprivation shapes individuals’ risk preferences (Castillo et al., Reference Castillo, Dickinson and Petrie2017; McKenna et al., Reference McKenna, Dickinson, Orff and Drummond2007), which have also been linked with political attitudes and behaviors (Fowler, Reference Fowler2006; Milosh et al., Reference Milosh, Painter, Sonin, Van Dijcke and Wright2021).
Related to this line of research is a body of work that relates individual chronotype—a person’s time-of-sleep preference, or where a person falls in terms of “morningness preference (early to bed, early to rise) [or] eveningness preference (late to bed, late to rise)” (Ksiazkiewicz, Reference Ksiazkiewicz2020, p. 367)—to political views (Ksiazkiewicz, Reference Ksiazkiewicz2022; Ksiazkiewicz & Erol, Reference Ksiazkiewicz and Erol2022b). For example, using seven American samples and one British sample, Ksiazkiewicz (Reference Ksiazkiewicz2020) shows that morningness predicts conservatism. This relationship is “robust to controls for openness, conscientiousness, and demographics, including age, sex, income, and education” (Ksiazkiewicz, Reference Ksiazkiewicz2020, p. 367). Likewise, in a study of representative samples from 10 countries, Ksiazkiewicz and Erol (Reference Ksiazkiewicz and Erol2022a) show that in all contexts, chronotype predicts ideology, with a majority of contexts pointing toward morning chronotype having significant links with political conservatism. Chronotype might also contribute to the development of individual personality traits (e.g., Jonason et al., Reference Jonason, Jones and Lyons2013; Randler et al., Reference Randler, Schredl and Göritz2017; You et al., Reference You, Laborde, Dosseville, Salinas and Allen2020), which, in turn, contribute to political views (Gerber et al., Reference Gerber, Huber, Doherty and Dowling2011).
Finally, it is possible that political views are changed—even if only for a short period— by the fluctuations in social context that occur when a society experiences a collective disruption of sleep. Prior research has shown that when a community experiences a sleep shock, crime increases (Doleac & Sanders, Reference Doleac and Sanders2015; Munyo, Reference Munyo2018), traffic accidents (perhaps) increase (Laliotis et al., Reference Laliotis, Moscelli and Monastiriotis2019; Smith, Reference Smith2016; Varughese & Allen, Reference Varughese and Allen2001), economic performance decreases (Giuntella & Mazzonna, Reference Giuntella and Mazzonna2019), as do educational outcomes (Giuntella et al., Reference Giuntella, Han and Mazzonna2017; Heissel et al., Reference Heissel, Levy and Adam2017; Heissel & Norris, Reference Heissel and Norris2018). Changing the world in such a fundamental and multifaceted way may combine to prompt individuals to change their political views. A long literature in political science shows that when people perceive negative performance shocks—even if they are not real—to the overall economy (Fiorina, Reference Fiorina1978; Healy & Lenz, Reference Healy and Lenz2014, Reference Healy and Lenz2017), to nearby schools (Berry & Howell, Reference Berry and Howell2007; Holbein, Reference Holbein2016; Holbein & Hassell, Reference Holbein and Hassell2019), or to crime or safety (Arnold & Carnes, Reference Arnold and Carnes2012; Bateson, Reference Bateson2012), their political beliefs and actions may change. This literature on “retrospective voting” (Healy & Malhotra, Reference Healy and Malhotra2013) would lead us to expect that shared sleep-induced declines—like those that occur around changes to DST—may result in reduced societal well-being, and this would lead individuals to evaluate the political environment—for example, the leaders who govern it—differently.
Finally, we note that the direction of any political shift is ambiguous. It is possible that enhanced participation, changes to psychological attachments, and a shift in social context push people to be more conservative or more liberal. There may be polarizing effects here, too, whereby people who experience a sleep shock double down on their beliefs. On the flip side, it could be the case that people who are sleep disrupted are more tired and, as a result, more likely to acquiesce to the viewpoints of those on the opposing political team. While the direction of any political preference changes is uncertain, this much is clear: there are strong reasons to suspect that sleep disruptions (even if they are brief) may elicit changes (even if they are brief) to political positions, whether it be a uniform or a polarizing shift.
Sleep disruptions and discriminatory attitudes
A long literature has theorized that changes to sleep could enhance discriminatory attitudes and behaviors. Some have argued that sleep disruptions cause individuals to turn inward and focus on their own needs at the expense of others (Holbein et al., Reference Holbein, Schafer and Dickinson2019). Moreover, those who lose sleep may experience a threat-like state (Dahl & Lewin, Reference Dahl and Lewin2002; Prather et al., Reference Prather, Bogdan and Hariri2013; Sadeh, Reference Sadeh1996; Straus et al., Reference Straus, Dolsen, Nishimi, Neylan and O’Donovan2022; Tashjian & Galván, Reference Tashjian and Galván2020), which may lead individuals to view out-groups more negatively (Enos, Reference Enos2016; Giles & Hertz, Reference Giles and Hertz1994; Homola, Reference Homola2021; Keen & Jacobs, Reference Keen and Jacobs2009; Malhotra & Popp, Reference Malhotra and Popp2012; Reny & Newman, Reference Reny and Newman2018). Individuals who are sleep disrupted may also be less cooperative with others generally (Anderson & Dickinson, Reference Anderson and Dickinson2010). In addition, individuals who lack sleep may also lack the inhibitory control that causes people to self-filter; therefore, sleep may reduce the social desirability bias of respondents. When they are tired, respondents may answer questions probing their discriminatory beliefs more truthfully because they lack a strong cognitive filter to keep socially unacceptable biases at bay.
Consistent with this theoretical connection, evidence from conditional-on-observable research designs documents an association between sleep and discrimination, whereby those who get less sleep are more likely to lash out in discriminatory ways toward other groups. In fact, in a review of 17 studies on the topic of discrimination and sleep, Slopen et al. (Reference Slopen, Lewis and Williams2016) show that all of their studies document this association between sleep problems and discrimination. However, as Slopen et al. note, the research that has been done in this space has distinct data limitations. One potential limitation of this research is omitted variable bias, which occurs when we cannot rule out other factors that are related to both sleep and outcomes. Another potential limitation relates to endogenity, or the possibility that each factor influences the other. Given this limitation in the empirical record, there is value to examining whether an exogenous shock to sleep levels (even if it is modest in size) enhances discrimination.
It is unclear which groups could face more discrimination as a result of a disruption to sleep patterns. Discrimination or bias could occur on multiple dimensions—on racial, ethnic, religious, or social grounds. Given this ambiguity, it is preferable to examine many potential targets of discrimination (as we do here). Moreover, as with our other outcomes, the relationship could be uniform or polarizing—separating along partisan and/or majority/minority lines.
Data and methods
To examine the effects of DST on our outcomes of interest, we use the Nationscape Survey (NS) conducted by the Democracy Fund and UCLA (Tausanovitch et al., Reference Tausanovitch, Vavreck, Reny, Hayes and Rudkin2019). The NS is a large-scale weekly survey (N = 6,250 per week) that began in late 2019 and ended in early 2021. The survey draws samples from the Lucid platform, which has been shown to benchmark well to population parameters (e.g., Coppock & McClellan, Reference Coppock and McClellan2019; Peyton et al., Reference Peyton, Huber and Coppock2022). The NS is reflective of the national adult population in the United States. It is not a panel data set, but a pooled cross-section. It has been widely used in the political and social sciences (e.g., Naeim et al., Reference Naeim, Baxter-King, Wenger, Stanton, Sepucha and Vavreck2021; Reny & Barreto, Reference Reny and Barreto2022), including in evaluations of the effect of discrete events (like police killings) on citizen attitudes (like attitudes toward the police) using the methods that we employ (an RDiT design; for examples, see Reny, Reference Reny2020; Reny & Newman, Reference Reny and Newman2021). Because the NS was fielded daily, with averages of about N = 900 people responding to the survey per day, we can precisely estimate the effect of DST changes on the outcomes of interest. To do so, we use the full set of 77 waves of the NS—comprising just under a half a million individual responses—and draw specific attention to the changes to DST that overlap with the NS time series.
We evaluate the effect of sleep disruptions on a handful of outcomes related to how individuals view the world around them and their place within it. First, we look at citizen ideology. This is coded on a 1–5 scale ranging from very liberal to very conservative. We standardize this outcome and other outcomes in our analyses that follow.
Second, we have measures of policy positions on a host of policies. Individually, these may not have as strong a connection to sleep disruption; however, collectively, they allow us to see whether the direction of policy preferences moves in response to sleep as theory would predict. We examine support for the following issues: building a border wall, capping carbon emissions, requiring background checks, repealing the estate tax, raising taxes on those earning above $600,000 per year, ensuring that all students can graduate college debt-free, never permitting abortion, allowing late-term abortions, replacing private health insurance, providing a public option for health insurance, subsidizing health insurance, offering a path to citizenship to all undocumented immigrants, providing a path to citizenship for undocumented immigrants brought to the United States as children (so-called Dreamers), deporting all undocumented immigrants, banning all guns, banning assault rifles, and limiting gun magazines to 10 bullets (all are agree/disagree, coded in the conservative policy direction, and not standardized).
Third, we investigate evaluations of the incumbent candidate for president (Donald Trump) and the challenger (Joe Biden) in the 2020 presidential election. This is measured on a 1–4 scale, ranging from very favorable to very unfavorable. Fourth, we examine evaluations of both major political parties. This is measured on a 1–4 scale, ranging from very favorable to very unfavorable. In disaggregating these results by party, we see whether there is any effect of sleep disruptions on a measure of political polarization.
Fifth, we construct racial resentment and gender (women) resentment scales using the various measures for these available in the NS. For racial resentment, the NS asks whether Blacks should do the same as other minority groups without having any special favors, whether generations of slavery and discrimination have created conditions that make it difficult for Blacks to work their way out of the lower class, whether the respondent would prefer that close relatives marry spouses from their same race, and whether the respondent thinks that it is alright for Blacks and Whites to date each other. For gender resentment, the NS asks whether the respondent would be more comfortable having a man as a boss than a woman, whether women are just as capable of thinking logically as men, whether increased opportunities for women have significantly improved the quality of life in the United States, and whether women who complain about harassment often cause more problems than they solve. All of these are measured on a 1–5 scale ranging from strongly agree to strongly disagree. They are rescaled so that they are in the same conceptual direction. Then, they are combined into factor weighted scales using principal factor models.
Finally, we inspect the effect of a sleep disruption on evaluations of various majority/minority groups. All of these questions start with the stem “Here are the names of some groups that are in the news from time to time. How favorable is your impression of each group or haven’t you heard enough to say?” The groups evaluated include Whites, Blacks, Latinos, Asians, evangelicals, socialists, Muslims, labor unions, the police, undocumented immigrants, LGBT+, and White men. All of these are measured on a 1–4 scale from very favorable to very unfavorable, which we standardize in our analyses. These combined with the resentment scales allow us to investigate whether those who experience a sleep disruption are more discriminatory in their stated preferences, on average.
We examine effects among the population as a whole and also among several relevant subgroups. These subgroups include Republicans, Democrats, independents, people who belong to another political party, as well as Black, Asian, and White individuals. We look at race and party because there are reasons to expect heterogeneous effects on beliefs across individuals’ starting political affiliation. We disaggregate by race because there are reasons to expect heterogeneous effects on views toward other racial/ethnic/social majority/minority groups. To be thorough, however, we look for heterogeneous effects across all outcomes and all subgroups.
To identify the causal effect of starting DST on political beliefs, we use an RDiT approach. Regression discontinuity designs (RDDs) leverage as-good-as-random variation and continuity in potential outcomes around an arbitrary cutoff to estimate a causal treatment effect (Calonico et al., Reference Calonico, Cattaneo and Titiunik2014; De la Cuesta & Imai, Reference De la Cuesta and Imai2016; Hahn et al., Reference Hahn, Todd and Van der Klaauw2001; Hausman & Rapson, Reference Hausman and Rapson2018; Imbens & Lemieux, Reference Imbens and Lemieux2008; Lee & Lemieux, Reference Lee and Lemieux2010; Thistlethwaite & Campbell, Reference Thistlethwaite and Campbell1960). RDDs have been shown to benchmark well to randomized control trials (Wing & Cook, Reference Wing and Cook2013).Footnote 6 In all of the RDiT models, we use the standard procedures in the rdrobust package in Calonico et al. (Reference Calonico, Cattaneo and Titiunik2014; CCT), which employs local linear regression to construct the point estimator and local quadratic regression to construct the bias correction and employs CCT’s optimal bandwidths, which are the default option in the rdrobust package (Calonico et al., Reference Calonico, Cattaneo and Titiunik2014). With our primary identification strategy—which leverages the spring 2020 time shock—we run the model estimates across four bandwidths: the CCT optimal bandwidth for our unconstrained time series (which is typically 60 days on either side of the cutoff), the CCT optimal bandwidth restricting our sample to 2020 (which is typically about 28 days), 30 days, and 120 days.
The discontinuity we use is the one that appears in time around the transition from Standard Time to DST in the spring. (As a robustness check, we also look at fall changes. We use this as a robustness check as the sleep disruption in the fall is more modest.) This discontinuity has been used before as it shows good properties for causal identification (Kountouris, Reference Kountouris2021; Kuehnle & Wunder, Reference Kuehnle and Wunder2016; Rivers, Reference Rivers2018). We replicate these validation checks, showing first that there is a lack of substantive bunching around the cutoff. In the NS data, there are slightly more respondents after DST. However, the results hold if we take a a so-called donut RDD approach that accounts for precise sorting around the cutoff (Barreca et al., Reference Barreca, Lindo and Waddell2016). Moreover, we show covariate balance, too (see Figure S1b). Out of the 43 controls tested, 42 allow us to rule out substantively meaningful effects using equivalence testing (Hartman & Hidalgo, Reference Hartman and Hidalgo2018; Lakens et al., Reference Lakens, Scheel and Isager2018). And the (null) results hold if we include controls in our models.
Before we proceed to the results, a word about multiple hypothesis testing and statistical power is in order. Our research question requires that we examine multiple outcomes. Looking at only one social/political outcome would give an incomplete picture of DST’s impact on how people see the world and themselves in it. As has long been established, when scholars examine multiple outcomes, the rules of probability mean that some estimates will be statistically significant simply by chance (Dudoit et al., Reference Dudoit, Shaffer and Boldrick2003). Given the results that we present here—overwhelmingly, precisely-estimated coefficients that are not statistically different from zero—we want to be cautious to not over-interpret the presence of some coefficients that are statistically significant by chance. That said, since we are arguing for the null, using the traditional approaches for correcting for multiple hypothesis testing—be it the Bonferroni method, the Šidák approach, or the free step-down resampling correction (Abdi et al., Reference Abdi and Salkind2007; VanderWeele & Mathur, Reference VanderWeele and Mathur2019; Westfall & Young, Reference Westfall and Young1993)—is actually a less conservative approach. By not employing them, we give the best chance for the null to be rejected. This provides a hard test for the null. In all the null results that we present here, these multiple hypothesis corrections, if applied, would only strengthen the case for the null even more than it is without any corrections.
The NS data also has plenty of statistical power—having tens of thousands of observations for our outcome variables with a bandwidth of one month around the cutoff, for example. This is the case because of the NS’s large repeating cross sections. Even if we consider the data to be nested at the level of the running variable and adjust our standard errors accordingly (Lee & Card, Reference Lee and Card2008), the results are still quite precise. As we show, the nulls are not due to an insufficient sample size or large standard errors that overlap with zero. To show this point, we employ equivalence testing. This approach allows us to pay specific attention to the effect sizes and 95% confidence intervals (Hartman & Hidalgo, Reference Hartman and Hidalgo2018; Lakens et al., Reference Lakens, Scheel and Isager2018). In most applications, we are able to rule out even very modest effects. Additionally, to reduce residual variance, when appropriate (e.g., with conservative policy positions and racial and gender resentment), we create scales in our outcomes. These allow even more precision (Ansolabehere et al., Reference Ansolabehere, Rodden and Snyder2008). In short, the null effects we present are not due to a lack of statistical power, which often mars null effect studies.
Finally, we note that in all the visualizations presented here, we use a common range across the outcome axis for ease of comparing similar outcomes. Moreover, when it is not visually possible to do so, we label the coefficient plots with the important model estimates. Where appropriate—that is, in our standardized outcomes—we also mark an often-used benchmark for equivalence testing (Cohen, Reference Cohen1992). Though this approach is certainly not the only standard for which substantive effects should be judged, it does give us a reference point for what effect sizes can be ruled out. Acknowledging that what constitutes a large or small effect is, to a certain extent, in the eye of the beholder, in all cases we note the effects that can or cannot be ruled out based on the 95% confidence intervals.
Results
Theory and prior research provide strong reasons to expect that sleep disruptions cause people to look at the world around them, the other people in it, and their own place in the world differently. There are reasons to expect that this will lead to social fragmentation. There are likely downstream effects on outcomes such as ideology, policy positions, leadership evaluations, racial/gender resentment, and attitudes toward other minority and majority in- and out-groups. Do sleep disruptions affect these social and political beliefs? The answer, based on our research, appears to be “no”.
To illustrate this, we start with a figure that summarizes the results across all outcomes and subgroups. (The equivalent figure for the fall 2019 change from Standard Time to DST can be found in the Appendix, Figure S11.) Figure 1 displays a summary of 1,152 model results (36 outcomes * 8 groups * 4 specifications). Each cell—marked with either a square or a circle—is a separate RDiT model estimate. Squares are model estimates that allow us to rule out a certain effect size—either 20% (of a standard deviation or probability increase, depending on whether the outcome is dichotomous or standardized) or 10%. The first two panels are from models without covariates; the next two panels include covariates. Shapes are shaded depending on whether the effect is statistically significant at the (unadjusted) 5% level. Black circles are significant effects in which we cannot rule out medium-sized effects (based on Cohen’s rules of thumb). Hence, if DST were changing people’s views in a meaningful way, we would expect to see many black circles in Figure 1.
Summarizing the effect of starting DST on social views. (a) Rule out 20%? (no covariates) (b) Rule out 10%? (no covariates) (c) Rule out 20%? (with covariates) (d) Rule out 10%? (with covariates).
Each cell summarizes an RDiT model specification. Points are shaped by whether we can rule out the effect size specified in each of the panel titles (20% or 10% of a standard deviation); squares can rule out the effects listed in each panel title, whereas circles cannot. Points are shaded by whether they are statistically significant at the (unadjusted) 5% level. Hence, effects that are statistically significant and substantively meaningful are black circles. Takeaway: The general pattern of evidence is precisely estimated nulls. This can be seen in most of the cells being gray squares (i.e., effects where we can rule out meaningful effects and the estimates are not significant at traditional levels), the next most common being black squares (i.e., effects where we can rule out meaningful effects, but that are still statistically distinct from 0), and only a minority being black circles (i.e., effects that are both statistically and substantively meaningful).


In fact, this is not what we find. As Figure 1 shows, only in very rare circumstances are effects statistically significant, substantively large, or too imprecise to not rule out medium-sized effects. In the first panel—no covariates and testing against a 20% effect—94.1% of the effects (271 of 288) allow us to rule out what Cohen calls a medium-sized effect. Among the 17 effects for which we cannot rule out a 20% effect, only 3 (1.04%) are statistically significant at traditional levels. The general finding can be seen in the fact that a dominant majority of the shapes are gray—not significant at traditional (unadjusted) levels—and a dominant majority can rule out effects of very modest size. In short, the general pattern is precisely estimated nulls. This is true regardless of whether we look at a 20% effect or an even smaller 10% effect. Testing against an estimate that is half the size of Cohen’s threshold for a small/medium-sized effect, we would expect that fewer models would have sufficient power to hit this, as it is a particularly harsh equivalence test. Still, even with this high bar, we are able to rule out a 10% effect in 72% of cases. Among those, only 10 (3.5% of all the models) estimates are statistically significant at traditional levels.
When we add covariates, the results become even more precise—as we would expect—and even closer to zero. As a result, fewer of the coefficients show signs of a meaningful effect. In the bottom-left panel, we can rule out 20% effects in 96.2% of models and the more punitive 10% threshold in 75% of cases. Among the remaining coefficients, only 0.69% and 2.08% (respectively) are statistically significant at traditional (unadjusted) levels. Recall from the last section that not adjusting for multiple comparisons across models makes our estimates of the number of effects that are signficant conservative. If we were to apply the Bonferroni, Šidák, or free step-down resampling methodology for correcting for multiple comparisons, even fewer effects would be significant.
Digging into the subgroups shown in Figure 1, we can see whether there is heterogeneity in the treatment effect estimates.Footnote 7 Looking at the first column—that for the entire sample (“all”)—it is clear that there is little to no evidence of systematic effects in the public as a whole, on average. None of the 144 model estimates (36 outcomes * 4 specifications) in the first columns of panels (a)–(d) are significant and all of them can rule out very modest effects—20% or even 10% (i.e., all the shapes are squares). Only when we break our sample apart into individual subgroups do we find significant effects and ones that cannot rule out medium-sized effects. One interesting pattern is that many of the effects that are too imprecise to rule out medium-sized effects (i.e., the gray and black circles) are found in the smallest subsets of the population—those in other political parties or in the Asian/American category. Indeed, among the effects that are too imprecise to rule out medium-sized effects, 15 of 17 in the top left panel are in either the Asian or other party subgroup, with all 11 of these in the third panel being in these two subgroups. That we see significant but less precise results in cases when we have the least statistical power suggests that these exceptional cases might be a product of the noisier estimates that come with less statistical power, rather than evidence for a true effect. This is further buttressed by the fact that adding controls—and the precision that comes with doing so—makes the results even more null.
One thing that Figure 1 does not do is display the size of the effects themselves. Figure 2 provides a summary of the effect sizes. Rather than plot all the effects individually, which would take up too much space, Figure 2 shows the distribution of estimated effects. The effects are broken by whether we have a standardized (top row) or a binary (bottom row) outcome. The columns differ in whether we are looking at the effect of shifting from Standard to DST in the spring (left column) or DST to Standard Time in the fall (right column). As can be seen, most of the estimated effects are quite small—falling within the range of what most standards would conceive to be small effects. Indeed, the average/median effect falls close to zero in all cases, with each of the spring distributions being even more spiked at zero than what we would see with a normal distribution—that is, there are even more effects closer to zero. The fall distributions look quite normally distributed around zero—meaning that there are roughly the same numbers of negative and positive effects. As we would expect, the effects are somewhat noisier when we look at binary outcomes. Not surprisingly, the fall treatment estimates (perhaps being confounded with the election itself) are also noisier than the spring. However, still, most of the effects themselves are small and consistent with a small, rather than meaningful effect size in virtually all cases. The equivalent figure for the fall 2019 time change can be found in the second row of Figure S11 in the Appendix. It largely shows null effects, too.
Distribution of effects at the spring and fall cutoffs. (a) Distribution of effect sizes, spring (b) Distribution of effect sizes, fall (c) Distribution of effects on binary outcomes, spring (d) Distribution of effects on binary outcomes, fall.
Distribution of effect sizes for standardized outcomes broken by whether we have a standardized (top row) or a binary (bottom row) outcome. The columns signal whether we look at the effect of shifting from Standard Time to DST in the spring (left column) or DST to Standard Time in the fall (right column). Each of the histograms has a standard kernel density function (black lines) and a normal distribution (pink line) overlayed on top of it. Takeaway: Most of the estimated effects are quite small—falling within the bounds of what most standards would conceive to be small effects. Not surprisingly the fall treatment estimates (perhaps being confounded with the election itself) are also more noisy than the spring. Most of the effects themselves are still small.

We next turn to the effects on individual outcomes. This allows us to see any patterns that Figures 1 and 2 cannot show. Figure 3 shows the effects of starting DST (the spring treatment) on the ideology of all respondents scaled such that higher values mean that a person is more conservative. Despite strong theoretical connections through enhanced engagement, changes to mood/affect, changes to personality characteristics, changes in thought processes, declines in health, a heightened sense of social threat, and negative contextual forces, our results suggest that sleep disruptions appear to have little to no effect. The top panel allows for a visualization of what happens at the cutoff (denoted by a dashed line), but also what happens around the cutoff. As can be seen, there is little evidence of a change in individual ideology that corresponds with a sleep disruption that occurs at the start of DST. Moreover, ideology is a smooth function of the date of the survey—this is a positive thing for the identification strategy used here, given that competing treatments around the cutoff can, sometimes, bias RDiT estimates.
The effect of starting DST on conservative ideology. (a) Effect on conservatism of all citizens (b) Effect on subgroups.
The first panel shows bin averages in the dependent variable—conservative ideology—along with confidence intervals for these estimates. It also plots a smooth function separately on either side of the DST cutoff. The second panel shows the effects of DST on conservative ideology on all participants and four partisan subgroups (denoted on the x-axis). The y-axis is in standard deviation units, with higher values meaning the effect is to make people in that group more conservative and lower values meaning the opposite. Coefficients and standard errors are labeled for each of the estimates. Cohen’s effect sizes and a zero effect are shown as reference points with dotted and dashed lines, respectively. Points are sized as a function of sample size. Takeaway: There is no effect of the DST sleep disruption on individuals’ ideology, regardless of their political party.

The second panel of Figure 3 allows us to see whether there are any polarizing effects of the sleep shock introduced by the transition to DST. To do so, it runs the RDiT models breaking the sample by individuals’ political party. As can be seen, there is limited evidence of any polarizing ideological effects of the sleep disruption DST’s start provides. The estimated effect of Republican is statistically significant at the 5% level; however, its p-value comes close to what we would consider significant at traditional unadjusted levels (p = .03). Moreover, once we include controls, the effect is no longer significant at traditional unadjusted levels (p = .07). The effect estimate is also small, allowing us to rule out effects larger than 14.5% of a standard deviation in the models without controls and 13.1% of a standard deviation in the models with controls. In short, if there is an effect of the sleep shock that occurs around DST on Republicans, it moves them ever so slightly towards being more conservative. However, we cannot be certain that this is the case; and the effects are small, by most standards. We also find that the results are not substantively different across age groups.
The results are very similar if, instead of looking at ideology, we look at policy positions. Figures S2 and S3 in the Appendix do so. As can be seen there, there is little evidence that sleep disruptions change or polarize the public’s views on the many things that government can or should do. All of these effects are small and precisely estimated, allowing us to rule out meaningful effects. This holds true regardless of whether we scale the individual policy items together or look at the outcomes individually. This conclusion is also consistent across the political spectrum. Sleep disruptions, in short, do not change or polarize policy positions.
Do sleep disruptions change how individuals view the performance of their leaders and/or polarize leader views? Despite strong theoretical connection via changes to mood/affect and social context, there appears to be little to no effect of sleep disruptions on evaluations of one’s leaders. Figure 4 shows the estimates for evaluations of the incumbent (Trump) and the challenger (Biden). The results are broken by political party, as there are strong reasons to expect that one’s political party moderates the effect of negative shocks on candidate evaluations (Bartels, Reference Bartels2016). There appears to be little to no relationship. None of the effects are statistically significant at traditional unadjusted levels, much less adjusted levels. All are very close to zero, and all of them allow us to rule out very modest effects. Losing an hour of sleep has no corresponding effect on how respondents evaluate the performance of their leaders—regardless of whether the leader is part of the respondent’s “team” or the other “team.”
The effect of starting DST on incumbent and challenger evaluations. (a) Effect of starting DST on incumbent evaluations (Trump) (b) Effect of starting DST on challenger evaluations (Biden).
The first panel shows the effects on Trump approval and the second shows it for Biden approval. Estimates run for all participants and four partisan subgroups (denoted on the x-axis). The y-axis is in standard deviation units. Directional effects are labeled and shaded by their partisan implications. Coefficients and standard errors are labeled for each of the estimates. Cohen’s effect sizes and a zero effect are shown as reference points with dotted and dashed lines, respectively. Points are sized as a function of sample size. Takeaway: There is no effect of the DST sleep disruption on individuals’ evaluation of political leaders, regardless of their political party.

What about views toward members of the other political party? It is possible that the known effects on mood/affect, threat, and other attitudinal/contextual transformations after a sleep disruption predate a willingness to see the other party in a more negative light and one’s party in a more favorable light—thus polarizing views. In fact, as Figure 5 shows, there is some evidence of a small polarization in the views of Democrats. When they get less sleep over the short-run, Republicans see Democrats (slightly) less favorably ( $ \unicode{x03B2} =0.072\unicode{x03C3} $
; p = .046) and Democrats see members of their own party (slightly) more favorably (
$ \unicode{x03B2} =0.072\unicode{x03C3} $
; p = .046) and Democrats see members of their own party (slightly) more favorably ( $ \unicode{x03B2} =-0.04\unicode{x03C3} $
; p = .025). However, these effects are not very far below the
$ \unicode{x03B2} =-0.04\unicode{x03C3} $
; p = .025). However, these effects are not very far below the $ \unicode{x03B1} =0.05 $
level at the unadjusted levels (neither are significant at adjusted levels). Moreover, these effects are not significant at unadjusted levels when we add controls (Republican views of Democrats:
$ \unicode{x03B1} =0.05 $
level at the unadjusted levels (neither are significant at adjusted levels). Moreover, these effects are not significant at unadjusted levels when we add controls (Republican views of Democrats: $ \unicode{x03B2} =0.043\unicode{x03C3} $
; p = .182; Democratic views of Democrats:
$ \unicode{x03B2} =0.043\unicode{x03C3} $
; p = .182; Democratic views of Democrats:
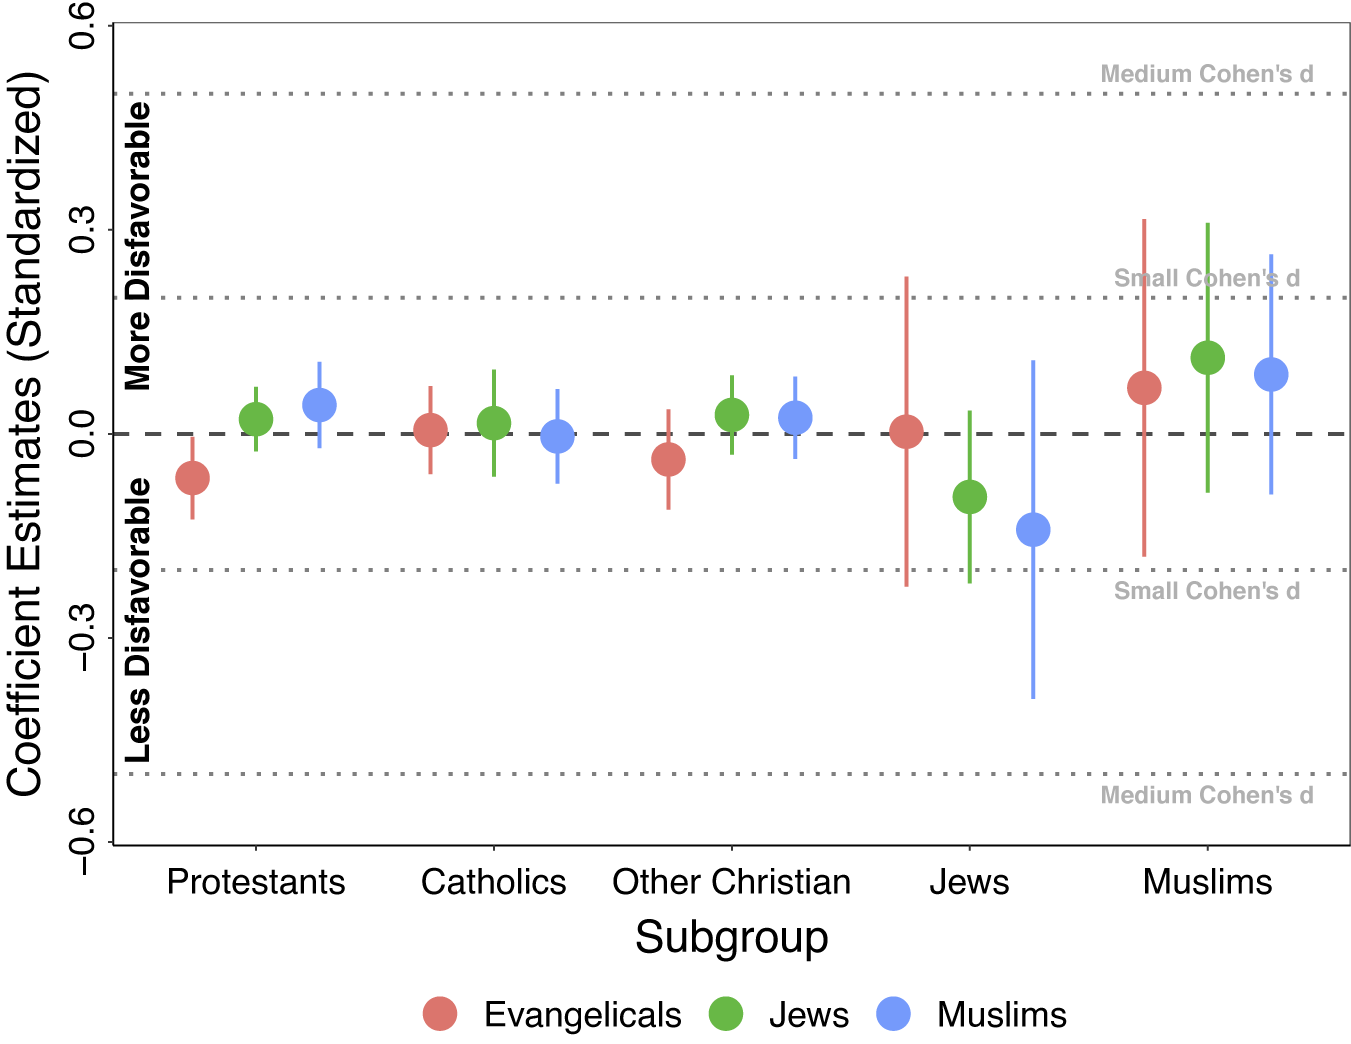
 $ \unicode{x03B2} =-0.035\unicode{x03C3} $
; p = .065). And regardless of specification, views toward Republicans—among Republicans and Democrats—stay the same, with the coefficients being close to zero, not significant, and precise enough to rule out very marginal effects. In short, it looks like disrupting sleep does not meaningfully polarize the public’s views toward the other political party. Short-run changes to sleep have no corresponding effect on measures of what some scholars have called affective polariztion (Iyengar et al., Reference Iyengar, Lelkes, Levendusky, Malhotra and Westwood2019).
$ \unicode{x03B2} =-0.035\unicode{x03C3} $
; p = .065). And regardless of specification, views toward Republicans—among Republicans and Democrats—stay the same, with the coefficients being close to zero, not significant, and precise enough to rule out very marginal effects. In short, it looks like disrupting sleep does not meaningfully polarize the public’s views toward the other political party. Short-run changes to sleep have no corresponding effect on measures of what some scholars have called affective polariztion (Iyengar et al., Reference Iyengar, Lelkes, Levendusky, Malhotra and Westwood2019).
The effect of starting DST on polarization of out-party/in-party. Effect of DST’s sleep disruption on evaluations of the two major political parties. Estimates run for both major parties (denoted on the x-axis). The y-axis is in standard deviation units. Directional effects are labeled on the figure. Coefficients and standard errors are labeled for each of the estimates. Cohen’s effect sizes and a zero effect are shown as reference points with dotted and dashed lines, respectively. Takeaway: There is little to no effect of the DST sleep disruption on individuals’ evaluation of the other/their own political party.

What about views toward other minority-status groups? Figure S7 in the Appendix shows the effects of the DST sleep disruption on attitudes toward racial minorities and women, broken by the political party of the respondent. Despite a theoretical moderating connection here—given large differences in baseline levels of these variables by party (i.e., Republicans have higher gender and racial resentment than Democrats)—there are no differences in the effects of a sleep disruption by party.
Figure 6 shows the effects of DST starting on racial resentment broken by the race of the participant. Here, again, there is no evidence of a meaningful effect, either within in- or out-groups. The closest effect is Asians’ response to member of their in-group, which at first glance appears to improve when Asians experience an exogenous sleep shock. However, this effect is not significant at the 5% unadjusted level (p = .061; 95% confidence interval: [–0.004, 0.164]), much less the adjusted levels. Moreover, when we add controls, the effect completely disappears (p = .217; 95% confidence interval: [–0.029, 0.129]). The other effects also allow us to rule out meaningful effects. In short, sleep disruptions—despite introducing negative shocks to mood/affect, social threat, and context (to name a few)—have little to no effect on racial animus across different groups.
The effect of starting DST on racial in- and out-group views. Effect of DST’s sleep disruption on evaluations of racial groups. Estimates run for both major parties (denoted on the x-axis). The y-axis is in standard deviation units. Directional effects are labeled on the figure. Coefficients and standard errors are labeled for each of the estimates. Cohen’s effect sizes and a zero effect are shown as reference points with dotted and dashed lines, respectively. Takeaway: There is little to no effect of the DST sleep disruption on individuals’ evaluation of the other/their own race.

Does the same hold for in- and out-group views along gender lines? Figure 7 shows the effects on gender resentment (i.e., resentment against females) broken by gender. As can be seen, there is precisely no effect of the DST sleep disruption on views toward the same or the opposite gender. These results are all precise and allow us to rule out very modest effects. Sleep disruptions do not change overall views toward women, nor how men or women view women in society more generally. Despite moving mood/affect, social threat, context, and other potential mechanisms, there is no polarizing or aggregate effect of sleep disruptions.
The effect of starting DST on in- and out-group gender resentment. Effect of DST’s sleep disruption on evaluations of women (i.e., gender resentment). Estimates run for both major parties (denoted on the x-axis). The y-axis is in standard deviation units. Directional effects are labeled on the figure. Coefficients and standard errors are labeled for each of the estimates. Cohen’s effect sizes and a zero effect are shown as reference points with dotted and dashed lines, respectively. Takeaway: There is little to no effect of the DST sleep disruption on individuals’ gender resentment, regardless of gender.

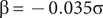
Does the same hold for in- and out-group views along religious lines? Figure 8 shows the effects on evaluations of various religious groups by the religion of the respondent. As can be seen, there is precisely no effect of the DST sleep disruption on views towards the same or the opposite religion in three largest religious groups—Protestants, Catholics, and other Christians. The effects among Jewish people and Muslim people are much noisier—reflecting the smaller number of these individuals in society and in the NS data—however, none of these effects is significant. In-group effects for both Jewish people and Muslim people are in the increased favorability direction, though neither is significant. The rest of the results, however, once adequately powered are all precise and allow us to rule out very modest effects. Like race and gender, sleep disruptions do not change overall views toward religious groups, nor how people of various religions groups view their/other religious groups more generally.
The effect of starting DST on religious in- and out-group views. Effect of DST’s sleep disruption on evaluations of religious groups. Estimates run for both major parties (denoted on the x-axis). The y-axis is in standard deviation units. Directional effects are labeled on the figure. Coefficients and standard errors are labeled for each of the estimates. Cohen’s effect sizes and a zero effect are shown as reference points with dotted and dashed lines, respectively. Takeaway: There is little to no effect of the DST sleep disruption on individuals’ evaluation of the other/their own religion.
Robustness checks
The results just documented are robust to various reasonable alternative approaches. For example, beyond the groups examined, we continue to see precise nulls effects if we look at all other majority-minority group views (see Figures S4 and S5 in the Appendix). Moreover, we see precise nulls if we tweak the conceptualization of the treatment to be the Monday after DST starts, based on the rationale that any sleep effects may appear only when people start their normal work week. This is shown in Figure S10 in the Appendix.
The results also remain (precisely) nulls if we run a donut RDiT, which is designed to address any potential heaping biases or precise manipulation around the cutoff (Barreca et al., Reference Barreca, Lindo and Waddell2016). This is shown in Figure S8 in the Appendix. With this check, the effect sizes are all small, no more are significant than what we would expect by chance, and we can rule out effects of any meaningful size. The systemic nulls remain (and often get even more null) with covariates (see Figures 1 and S6), they are present across bandwidths (see Figures S12 and S13), and they are present around the fall DST change as well (see Figures 1 and S11). The effects are precisely null if we include day-of-week fixed effects to account for any inherent/unobservable fixed intra-weekly differences between those who responded to the survey on different days of the week. This check is provide in Figure S9 in the Appendix. With this check, the effect sizes are very similar, as are the number of effects that are significant, and as also is our ability to rule out effects of any meaningful size. The results remain null if we scale our individual items together into a politics (i.e., a composite measure we can use to look at polarization) and a social (i.e., a composite measure we can can use to look at discrimination) scale (see Figures S23 and S24).
Our effects are also very similar if, instead of a RDiT, we conceptualize our setup as that of an event study and focus in on the immediate days preceding and following DST; Figures S16–S21 show stable patterns in each of the individual days that make up the week before and after DST. Finally, the results are very similar by age (see Figure S14)—suggesting that a hardening across the later life cycle does not drive our findings—education, and income (see Figure S15).
In short, these effects are very robust. None of the changes outlined earlier alters the general pattern that reflects no effect of DST’s sleep disruption in how individuals view the world, other people in it, and themselves relative to that world. There appears to be little evidence that sleep disruptions cause people to become more polarized or more discriminatory. In fact, the evidence is much more consistent with the null hypothesis—sleep disruptions appear to have no effect.
Discussion
To what extent does sleep influence the political polarization, social fragmentation, and discriminatory beliefs that we see in our modern society? There are at least two reasons why the length of sleep would influence these important outcomes. One is that macro-level trends toward less sleep coincide with changes in polarization and discrimination. A second is that theory and conditional-on-observables studies suggest that the changes that sleep disruption has on individuals’ propensity to participate, mood/affect, personality characteristics, feelings of stress/threat, thought processes, and their social context also make individuals more discriminatory and polarized toward potential out-groups.
In this article, we assess the extent to which the effects of sleep extend past the outcomes mentioned earlier, focusing specifically on changes in how people see the world, the people around them, and themselves in relation to those groups. To do so, we used a uniquely large and broad data set of 77 waves survey data from UCLA’s 2019–2021 Nationscape Survey, a regular nationally-representative political survey. Using an RDiT design, we find that—contrary to expectations and previous research—sleep does not polarize, nor does it make people more discriminatory. The overall null result is remarkably robust, the effects are quite precise, and the evidence for the null is fairly consistent across subgroups.
Our work makes several important contributions—to both the study of sleep and the study of the outcomes we explore. On the sleep side, the broader (non)consequences of sleep are vital given the core role that rest plays in human life and the broader macrosocietal trend toward both less and lower-quality sleep. To better understand the role of sleep, it is important not only to consider what sleep does influence, but also what it does not influence. By doing so, we can (1) refine theoretical models about the role that sleep plays in human behavior, (2) inform future research, and (3) contribute to policy discussions about the benefits and the nonbenefits of public and private interventions to improve sleep. Our work shows that sleep disruption’s myriad effects do not include changes to how people approach the world around them, at least not in this context.
On the outcomes side, our research contributes to the large, growing literature on discrimination (for an overview of this literature, see Cramer, Reference Cramer2020) and political polarization (for an overview of this literature, see Iyengar et al., Reference Iyengar, Lelkes, Levendusky, Malhotra and Westwood2019). Scholars have long tried to understand why some humans develop discriminatory attitudes and to develop interventions that address them (e.g., Paluck et al., Reference Paluck, Green and Green2019). Though macro-level trends of sleep deprivation and discrimination and polarization (potentially) overlap, it appears that sleep disruptions do not cause these social problems. (Though the reverse could still be true; future work is needed to know for sure.) This pushes forward our understanding of what does and what does not influence the key societal outcomes of polarization and discrimination and suggests that interventions targeting sleep improvements are unlikely to reduce these issues.
This study has a few important limitations. First, as is true in all RDDs, the effects we estimate are local to the cutoff(s) that we observe. We mitigate this concern somewhat by adding an event study design (in the Appendix), which allows for effects that evolve over time away from the DST cutoff. However, it is possible that effects emerge in other contexts. Second, our effects relate to short-term changes in sleeping patterns and therefore only shed light indirectly on longer periods of sleep loss or variability. In short, this should not be the last study that uses a causal identification strategy to study the question at hand. Third, it is possible that sleep might have heterogeneous effects on outcomes that we do not observe in our survey data. We have tested for heterogeneity in, arguably, the most important dimensions for the outcomes of our study—race, gender, political party, religion, age, education, and income. There could be, however, effects that emerge in other smaller subsets of the population. Finally, we readily admit that our study was (mostly) conducted during the COVID-19 pandemic (aside from the fall 2019 results), and our results may not generalize beyond this period.
Future research would do well to further document the boundaries of sleep’s influence. After all, “despite its centrality to human life, health, and happiness, sleep has never been a central topic of concern to political scientists” (Ksiazkiewicz, Reference Ksiazkiewicz2020, p. 367). Taking the interdisciplinary literature on sleep seriously would lead us to believe that sleep could affect (virtually) every outcome of any importance. Our results, however, show that there are limits to what sleep and sleep variations affect. Though our study shows that sleep disruptions do not affect polarization or discrimination, we are unable to explain why this is. Mechanism testing is inherently difficult—if not impossible—in many cases (Green et al., Reference Green, Ha and Bullock2010), and that is no different in the case of studying sleep’s effects. This limitation highlights the need for future research on why sleep disruptions of the variety that we study do not change core social and political views. One avenue for this research is to better unpack sleep’s effects on the many dimensions of individual mood and emotion. While we have a general sense that sleep disruptions make people feel worse, we do not know have a clear sense of sleep’s effects across the many dimensions of individual emotion (e.g., anger, anxiety, confusion, fear, disgust, etc.). And the lingering lack of causal identification in research on psychological attachments and political views looms large. Pushing these areas forward will better allow for a connection to the research that studies the effect of mood/emotion on political behaviors (Valentino et al., Reference Valentino, Brader, Groenendyk, Gregorowicz and Hutchings2011; Webster, Reference Webster2020).
Our work is vital in the current moment of soaring levels of social fragmentation. The results represent, ultimately, a hopeful finding, which, if replicated in the context of other sleep disruptions, suggests that our society will not become more discriminatory or politically polarized because of the recent steep decline in sleep levels. Our work suggests that we cannot sleep our way to solutions in this domain.
Supplementary material
The supplementary material for this article can be found at http://doi.org/10.1017/pls.2023.7.
Open scientific practices statement
This article earned the Open Data and Open Materials badges. All data and replication code for this study are available on the Harvard Dataverse at https://dataverse.harvard.edu/dataset.xhtml?persistentId=doi:10.7910/DVN/6WN41J. This study was not preregistered.


 Open access