


Introduction
In a dramatically warming Earth, making household energy consumption sustainable has become more important than ever (IPCC, 2022). Technical progress in smart technologies, insulation and efficient appliances plays an important role in achieving that goal. However, household energy provision necessarily reflects individual choices and preferences, which determine how these technologies are used. Hence, inefficient or inappropriate use is an all-too-common occurrence, leading to the so-called energy performance gap (Galvin, Reference Galvin2014). In particular, many households fail to consume sustainably even when they want to, and when they have access to relevant information (Frederiks et al., Reference Frederiks, Stenner and Hobman2015). Such cases are commonly explained either as cognitive biases (people systematically fail to behave in ways they actually want to behave) or as competence failures – people know why, but not how to conserve energy (Shipley and Elliot, Reference Shipley and Elliot2001). Consequently, reaching sustainable goals requires both cognitive and behavioral change.
A variety of legislative and policy measures have been implemented to promote sustainable behavior (for a categorization of interventions, see Loewenstein and Chater, Reference Loewenstein and Chater2017). Besides traditional approaches like coercion, penalization or financial incentives, several behavioral public policies (BPPs) have been proposed (for recent reviews, see Lourenço et al., Reference Lourenço, Ciriolo, Almeida and Dessart2016; Hong et al., Reference Hong, Yan, D'Oca and Chen2017; Yoeli et al., Reference Yoeli, Budescu, Carrico, Delmas, DeShazo, Ferraro, Forster, Kunreuther, Larrick, Lubell and Markowitz2017; Della Valle and Bertoldi, Reference Della Valle and Bertoldi2021). Initially bundled under the umbrella term “nudges” (Thaler and Sunstein, Reference Thaler and Sunstein2008), the literature now distinguishes between different types of BPPs. Here we focus on the distinction between nudges and boosts (Grüne-Yanoff and Hertwig, Reference Grüne-Yanoff and Hertwig2016). Both share the goal of changing behaviors that are either suboptimal for the agents themselves (e.g. going against their own cost-saving goals) or harmful to the environment (DesRoches et al., Reference DesRoches, Fischer, Silver, Arthur, Livernois, Crichlow, Hersch, Nagatsu and Abbott2023). Consequently, both interventions might be justified either paternalistically or through externality considerations (Loewenstein and Chater, Reference Loewenstein and Chater2017). Their differences lie in the processes through which boosts and nudges induce behavioral change. Nudges make use of known cognitive biases and subtle changes in the choice environment to promote sustainable behavior. Examples include activating social norms (Allcott, Reference Allcott2011), re-setting thermostat defaults (McCalley, Reference McCalley2006) or re-framing energy costs (Cheng et al. Reference Cheng, Putti, Kendall and Yeh2011). The common theme is that the desired behavior is achieved mostly by harnessing processes outside of the individuals' conscious control (Hansen and Jespersen, Reference Hansen and Jespersen2013). In contrast, boosts seek to induce the desired behavior by improving people's energy-saving competences. This is done by either providing them with new heuristics (rules-of-thumb) or by training them to apply already acquired heuristics in new environments (Hertwig and Grüne-Yanoff, Reference Hertwig and Grüne-Yanoff2017). Examples include supporting personalized habit formation (Verplanken and Wood, Reference Verplanken and Wood2006), enhancing energy literacy (van den Broek, Reference van den Broek2019) and providing device-specific energy-saving tips (Energimyndigheten, 2017).
Nudge-based BPPs have been applied to energy saving for more than a decade, with rather inconsistent results. Some interventions report impressive energy savings (Allcott and Rogers, Reference Allcott and Rogers2014), while others fail to deliver at all (Heiskanen et al., Reference Heiskanen, Matschoss, Laakso and Apajalahti2020). Meta evidence shows that observed effect sizes vary drastically across settings, sometimes even going in the negative (Karlin, Zinger and Ford, Reference Karlin, Zinger and Ford2015). Finally, there is the concern that measurable effects might wear off over time (e.g. Ruokamo et al., Reference Ruokamo, Räisänen and Kauppi2022). No comparable reviews exist for boosts yet – which of course does not exclude that they might suffer from similar limitations.
In theory, boosts should produce more stable effects by facilitating the acquisition of versatile energy-saving competences. To clarify, the boosting paradigm builds on the premise of ecological rationality (Gigerenzer et al., Reference Gigerenzer, Hertwig and Pachur2011), which states that humans rely on a system of simple strategies (heuristics) to reach a decision. Good decisions stem from successfully matching these strategies to the respective decision-making environment. Ideally, boosts enrich the cognitive repertoire by teaching new heuristics and skills, by repurposing existing competences or by adjusting information formats to match extant competences (Hertwig and Grüne-Yanoff, Reference Hertwig and Grüne-Yanoff2017). For instance, a long-term boosting intervention can expand people's energy-saving competences by gradually providing energy conservation “shortcuts” or “rules-of-thumb”. More importantly, a carefully designed boost could also facilitate transferring these competences to multiple environments. If the acquired heuristics relate to widespread consumption practices and commonplace consumer appliances, the resulting behavioral outcomes should become easier to transfer across settings.
Boosts could also produce more durable effects than nudges, given that people find reasons to adopt the acquired energy-saving heuristics (e.g. if they are easy to execute). Once adopted, and unless consequent experience invalidates them, it is plausible that people firmly incorporate these strategies into their behavioral repertoire (Hertwig and Grüne-Yanoff, Reference Hertwig and Grüne-Yanoff2017). For similar reasons, boosted effects should remain stable after the intervention is removed. Once people have mastered the provided strategies and have experienced their effectiveness themselves, no further intervention should be needed to support continued use.
Inspired by these implications, literature is beginning to emerge that empirically compares the effectiveness of nudging and boosting interventions. Competitive tests have been run in areas such as financial decision-making (Franklin et al., Reference Franklin, Folke and Ruggeri2019), information assessment (Bradt, Reference Bradt2022) and meal choice (Banerjee et al., Reference Banerjee, Galizzi, John and Mourato2022). While some limited evidence on the impact of interventions, which combine nudge and boost elements in the energy domain is present (Lazaric and Toumi, Reference Lazaric and Toumi2022), a direct comparison of the effectiveness of boosts vs nudges exists only in a virtual setting (Caballero and Ploner, Reference Caballero and Ploner2022). To our knowledge, our study is the first that compares boosts and nudges in a real-world energy setting, and that furthermore investigates long-term effects.Footnote 1
In the present research, we ask whether nudges or boosts are the better tools for inducing lasting sustainable behavioral outcomes. We competitively test the effects of nudge and boost-based interventions on energy consumption (electricity in kWh and warm water in m³) in a randomized control trial running over a period of 29 weeks. For this purpose, we collected the most prominent examples of the respective intervention types, bundled them in packages and applied them to a student dormitory context. More specifically, the nudging package combined a goal-setting and commitment component (for a comprehensive review, see Abrahamse et al., Reference Abrahamse, Steg, Vlek and Rothengatter2005) with a feedback and social comparison component (for a meta-analysis, see Karlin et al. Reference Karlin, Zinger and Ford2015). The boosting package included the automated provision of (by-)weekly energy-saving tips related to common household devices and appliances (e.g. microwave, shower, fridge). All interventions are described in the Method section, and visual representations of the experimental conditions are available in the Open Science Framework (OSF) directory (see Data Availability Statement). A mere information provision condition provided a consumption baseline.
We approached the experiment with the following predictions: If nudge effectiveness wears off over time (Ruokamo et al., Reference Ruokamo, Räisänen and Kauppi2022) and boost effectiveness does not (Hertwig and Grüne-Yanoff, Reference Hertwig and Grüne-Yanoff2017), then our boosting intervention should outperform the nudging one in the long run. Therefore, we assume that cumulatively, the participants in the boosted group will consume less electricity/warm water for the test period than those in the nudged group (H1). Moreover, if the boosted participants progressively internalize the provided energy-saving heuristics (tips), then the differences in consumption between both groups should become more pronounced towards the middle and the end part of the experiment (H2). Progressive competence expansion should also predict the shape of the consumption curves within the condition, such that the boosted participants should progressively consume less electricity/warm water as time progresses (H3). Meta-analytic evidence on the effects of time as a moderator of feedback intervention effectiveness (Karlin et al., Reference Karlin, Zinger and Ford2015) suggests that no such tendency should appear for the participants in our nudging condition.
Furthermore, since boosts involve the conscious acquisition of new skills that can be transferred to different domains “at will” (Hertwig and Grüne-Yanoff, Reference Hertwig and Grüne-Yanoff2017, p. 977), then it is plausible that the energy consumption pattern of the participants in our boosting intervention would exhibit behavioral spillover effects (Dolan and Galizzi, Reference Dolan and Galizzi2015) (H4). To test that, we intervened merely on electricity consumption in the first three months for all groups, starting interventions on warm water consumption only after week 13. This allowed us to test whether the interventions on electricity nevertheless had differential effects on warm water consumption.
While our intervention packages are supposed to represent the boost and nudge intervention types, it is an open question whether they actually do. None of the extant literature addresses this empirically, so we designed a new procedure to test that. Inspired by the method of process tracing (Beach and Pedersen, Reference Beach and Pedersen2019), we defined six mechanistic markers that we expect – based on the theoretical boost/nudge distinctions – to indicate whether an intervention operates through a boost or a nudge mechanism. In our boosting package, the participants could access various energy-saving tips by scanning a QR code with their cell phones (for more details, see Procedure). If they make a genuine effort to learn and apply the suggested heuristics, then they should proactively access them on a regular basis. Therefore, we assume that they will interact with the energy-saving information more often than the participants in the other conditions (H5a). We call this marker Information engagement. We also expect that the content of the energy-saving tips gets successfully internalized. Hence, the participants in the boost condition should perform better than the nudged on a final energy Competences quiz (H5b). Moreover, mastering the energy-saving techniques should enhance our boosted participants' self-efficacy feelings (Bandura, Reference Bandura1977; Usher and Pajares, Reference Usher and Pajares2008), making them more confident in their ability to conserve energy than the participants in the other conditions (H5c).
Conversely, we identified three mechanistic markers, which should be more prevalent in nudge than in boost mechanisms. The first is Feedback engagement – a measure of how often the participants viewed their weekly consumption data. In the nudging package, this information is presented in an interactive graph. Therefore, we assume that the participants in the nudged group will interact with it more often than those in the other conditions (H6a). In addition, our consumption feedback included visual information about the average consumption of the other participants in the experiment. Hence, we expect that the members of the nudged group will compare themselves to others more often than the rest (H6b). This measure constitutes our Social comparison marker. Lastly, our nudging package also included a commitment to an energy-saving goal and the opportunity to track ones' progress towards it. Hence, we assume that the participants in the nudge condition will consider values closer to the set goal more attainable than the participants in the other conditions (H6c).
Method
Ethics
This research was approved by the Swedish Ethical Review Authority (Etikprövningsmyndigheten, decision number 2021-02612). Participants were provided with an ethics brief, and participation was voluntary. Participants were offered a € 25 voucher, delivered at the end of the study period in exchange for their participation.
Participants and design
Previous literature reports a significant reduction in energy consumption as a result of combined behavioral interventions involving feedback, external goal-setting and commitment (11% to 22%; Andor and Fels, Reference Andor and Fels2018). We do not have prior data for long-term boost effectiveness. Hence, we based our power analyses on t-tests and an expected energy use of 630.65 kWh with a standard deviation of 4.88 in the baseline group (obtained from consumption data in the same locations from 2018 to 2019). The minimum detectable effect size with 50 participants per group is −2.762 kWh with 1 − β = 0.8 and p = 0.05. Similarly, the base consumption of water is 14.2 m³ with a standard deviation of 0.10 (same baseline period). The minimum detectable effect size with 50 participants per group is −0.057 m³ with 1 − β = 0.8 and p = 0.05.
We conducted our recruitment during the height of the COVID-19 pandemic, which greatly reduced the available participant pool. A large part of the student population stayed at home instead of moving into the respective dormitories. We managed to successfully recruit 98 participants, who registered to participate on our website. After the initial round of registrations, four respondents requested to be removed from the sample for personal reasons. Further 16 respondents never logged in when they were invited to receive their experimental instructions. Seven participants left the dormitories before 50% of the experimental period elapsed. Three respondents logged in for the first time shortly before the end of the experimental period. Two participants ran highly powered computers around the clock, and one spent less than 10 s on the page with the embedded experimental video instructions. All these participants were excluded, resulting in a total participant sample of 65 individuals. While the participant count is smaller than expected, an ex-post power analysis reports satisfactory statistical power for our tests, given the effect size we observed (Results section, p. 14).
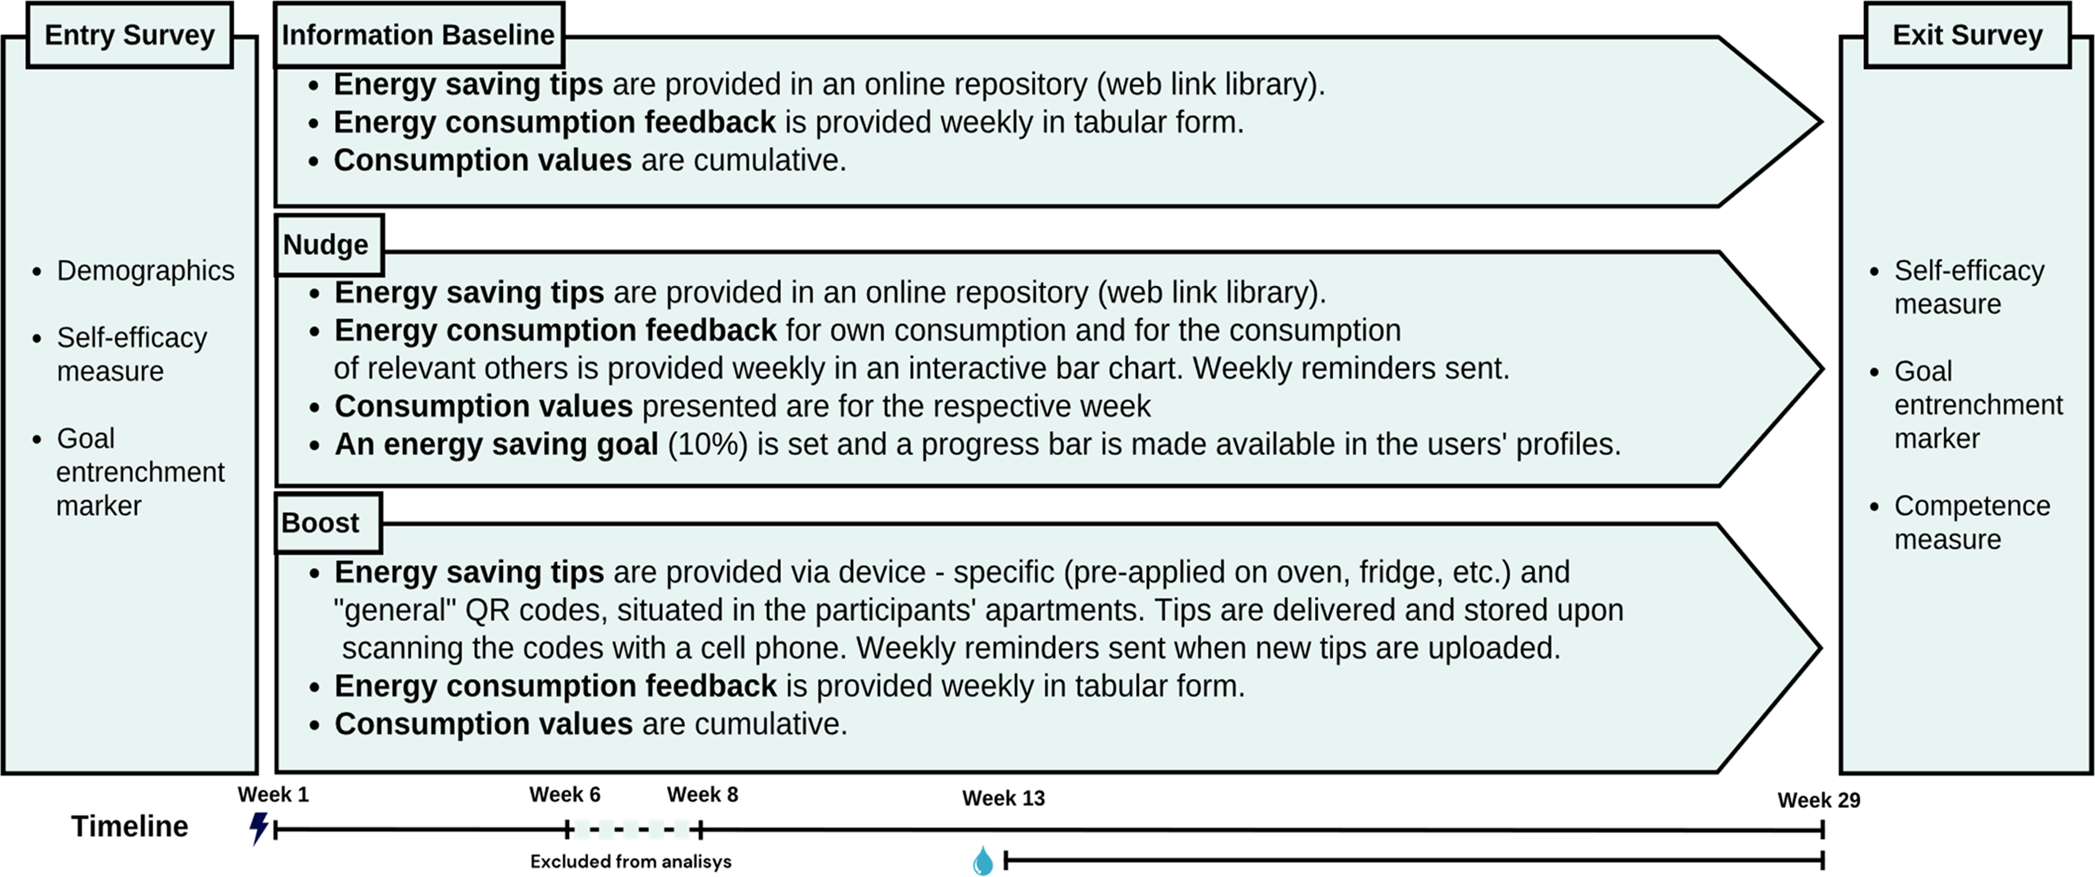
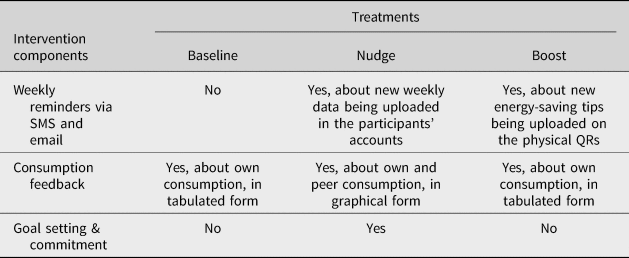
The participants were randomly allocated to one of three groups. Two experimental treatments, nudge and boost, were contrasted against an information provision baseline. Each treatment group combined intervention elements, considered in the literature as representative of the respective intervention types (nudges or boosts).Footnote 2 The nudge package included feedback provision and social comparison elements, as well as a goal-setting and commitment component. All groups gained access to their energy consumption values and useful energy-saving tips. The mode of their presentation was varied between conditions. In the boost group, energy-saving tips were provided in an interactive way. In the nudge and baseline groups, the tips were accessible via web links. In the nudge condition, energy use information was provided by an interactive graph, and in the boost and baseline conditions in tabular form. Figure 1 provides a summary of the intervention content and experimental timeline. A detailed description of all experimental conditions is available in the Procedure subsection. Table 1 provides a summary of the intervention components per experimental condition. Extensive documentation of the instructions and visuals of the user interfaces per group are available in the OSF directory.
Intervention content and experimental timeline.

Intervention components per experimental treatment

The experiment began on Monday, 15 November 2021 with a measurement of the previous week's consumption, and ended on Friday, 3 June 2022. Two weeks during the 2021 winter holidays are excluded from the analyses for electricity consumption due to the large number of respondents traveling abroad (weeks 6 and 7). Interventions on warm water began in week 13. The main dependent variables were electricity consumption (in kWh) and warm water consumption in m³.
Gender distribution in the sample was roughly equal, with 31 female (50.8%) and 27 (44.3%) male participants. Three respondents indicated “other” as their fitting gender category, and four preferred not to answer. The mean age of the respondents was 25.5 years (SD = 4.21). The majority of the participants (72.1%) were master students, proficient (41%) or native (13.1%) English speakers. Most (86.9%) fell into a low-income bracket. The lowest geographical representation was from the African countries (6.8%), with the rest of the world regions represented equally.
To check for abnormalities in the distribution of the demographic characteristics in the experimental groups, we cross-tabulated them with our condition dummies. The lack of significant Pearson's chi-squared coefficients indicated an even demographical spread across the experimental conditions. Distributions per treatment and the respective tests are reported in the Supplementary Appendix Tables S5–S7.
Procedure
After scanning a QR code on a recruitment pamphlet, all participants were directed to a custom-built website where they read an informed consent form and could agree to participate. Those who did so were prompted to create an account on our system, which was automatically associated with electricity and warm water consumption data for the respective user. Upon creating the accounts, the respondents were redirected to a survey containing a number of self-report measures (full list available in the OSF directory). A related survey was administered at the end of the experimental period. A week after the initial survey was completed, the participants received detailed video instructions varied by condition.
In all groups, the participants were provided with online access to electricity and warm water consumption data, as well as a number of energy-saving tips. The different forms of information delivery constituted our treatments and separated them from the information provision baseline. Most extant definitions of nudges (e.g. Hansen and Jespersen, Reference Hansen and Jespersen2013; Mongin and Cozic Reference Mongin and Cozic2018; Congiu and Moscati Reference Congiu and Moscati2022) support the notion that bias harnessing is a key characteristic of nudges, which makes them distinct from mere information provision. In the nudge condition, we provided the participants with a reference for the consumption of their peers, allowing for harnessing the social norm bias (Deutsch and Gerard, Reference Deutsch and Gerard1955; Cialdini and Trost, Reference Cialdini, Trost, Gilbert, Fiske and Lindzey1998). This was not the case in the baseline and boost treatments, where the participants received only their personal consumption values. To facilitate competence enhancement, we continuously engaged the boosted participants with energy-saving tips in an interactive way. In contrast, the participants in the other treatments received a one-off list of web links, which were pointed at repositories for energy-saving tips. The information provision baseline was constructed to only give access to information, while remaining neutral with respect to biases or competences as much as possible: only personal consumption information was available, and the energy-saving tips were provided once as a list of static web links. Providing information in all treatments (and varying its presentation, but not content) also ensured that all participants were aware of being monitored, thus addressing potential Hawthorne concerns (Landsberger, Reference Landsberger1958).
Consumption data were retrieved directly from the energy providers and were uploaded to the users' accounts once a week. Data presentation started in week 1 for electricity and week 13 for warm water. The data delivery mode was manipulated between conditions as follows: In the information provision baseline and the boost groups, the participants received their cumulative electricity and warm water consumption values each week in tabular form. Hence, simple arithmetic was needed to calculate consumption for the period they wanted. In the nudge condition, the data was presented as an interactive histogram, where each bar showed the users' weekly consumption values. A second weekly bar allowed the nudges to compare their own consumption with the average of all other participants in the project. In addition, the participants in the nudge condition received a prompt to try to save 10% energy until the end of the experimental period. Those who agreed to do so, committed by signing their initials under a pledge on their dashboard page. An interactive progress bar informed them how close they were to attaining their conservation goal. This constituted our goal-setting manipulation. A screen reference for the nudge condition is available in the OSF directory.
The delivery of energy-saving tips was also varied between conditions. In the information provision baseline and in the nudge condition, the participants gained access to a static web link dump, pointed at repositories for energy-saving tips (verified websites and open-source peer-reviewed publications). In the boost condition, the energy-saving tips were delivered via custom-designed stickers (sample sticker for reference in the OSF directory). The stickers were installed on key locations in the participants' housing units: on the stove/microwave combo, on the fridge/freezer and on the bathroom door. Each sticker contained a QR code, which was associated with the participant account on the backend. On scan, the QR codes lead to (phone scalable) device-specific energy conservation “tip of the week” (for all tips, see OSF directory). If the user scanned the code with their phone, they could view the tip, and access it again on further logins. Tips which were not scanned on time were not saved and were automatically replaced with new ones the following week. In addition, a poster with a device consumption rating was provided to each boosted participant.
Measures
In addition to electricity and warm water consumption data, we collected behavioral and self-reported information to capture the mechanistic markers discussed in the introduction. Behavioral data were used to compute our “feedback engagement” and “information engagement” markers. Feedback engagement is a cumulative value, representing the total time spent on the dashboard page by each participant for the duration of the experiment. The dashboard contained their personal energy consumption information. Logins shorter than 3 s were excluded from the measure.
Information engagement was calculated based on the total number of unique tips/links accessed by the participants. To become comparable, the mean values were adjusted by the ratio between link (17) and tip (84) count. The content of the web links was reflected in the tips, and the information was unified to the best of our ability.
Survey data from two surveys were collected to compute the self-reported process markers. The measures include an energy-saving competence scale, a goal-entrenchment marker, a self-efficacy feelings scale and a social comparison measure. Summarized information about the time of data collection, item types, item count and sample items are available in Supplementary Appendix Table S2. All scales (self-constructed and adapted) are sufficiently consistent, as indicated by Cronbach's α's > 0.70 for all measures.
Results
Energy consumption
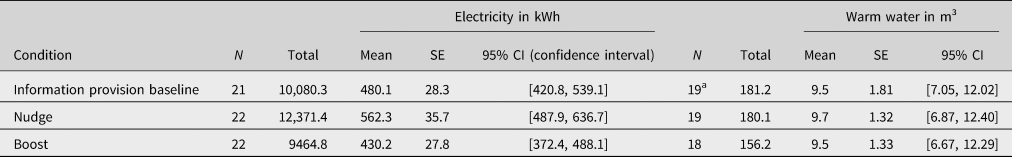
To estimate the effectiveness of our interventions, we first compared the electricity and warm water consumption of the respondents from the nudging and boosting conditions with the consumption values of the participants in the information provision baseline. The respective cumulative and mean values are available in Table 2.
Cumulative and mean consumption values per experimental condition

Note: aWarm water data for nine participants was not available due malfunctioning water meters
For the experimental period, the participants in the boost condition used a total of 6.3% less electricity than the participants from the information provision group. In comparison, the nudged participants used a total of 20.4% more electricity than the information condition. Moreover, the boosted participants consumed 26.6% less electricity and 14.2% less warm water than the nudged group. The boosted group also consumed 14.7% less warm water than the participants in the information provision condition. Differences in warm water consumption between the nudged and informed groups were negligible (0.56%).
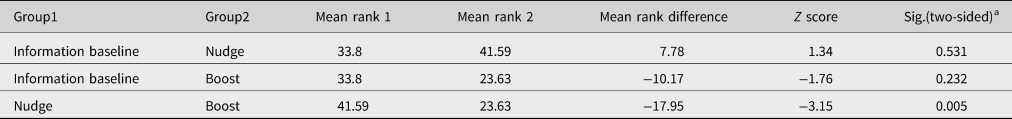
Our sample size was small, there was a high variability within groups, and there were deviations from normality in the distributions for both electricity and warm water. Hence, drawing reliable conclusions from means is less precise and may not accurately represent the true difference in the population.Footnote 3 Instead, we used non-parametric methods to estimate the significance of the reported differences. We conducted a Kruskal–Wallis analysis of variance (Kruskal and Wallis, Reference Kruskal and Wallis1952), which is robust against distribution abnormalities, small sample sizes and the presence of outliers in the data. The analysis generates a test statistic (H), derived from the mean electricity consumption ranks per experimental condition, and the rank variance. Dunn's post-hoc tests (Dunn, Reference Dunn1961) were used to make the respective pairwise comparisons, and the effect sizes were calculated with an H-based η² (Tomczak and Tomczak, Reference Tomczak and Tomczak2014). The omnibus test showed that the differences in electricity consumption were significant and moderate (H = 9.97(2), p = 0.007, η² [H] = 0.129). A pairwise post-hoc test with Bonferroni adjustments for the boost vs nudge contrast (p = 0.005) showed that the boosted participants used significantly less electricity than the nudged over the course of the experiment. Further comparisons with the information provision condition did not reach statistical significance. No significant differences were found when warm water consumption ranks were compared between conditions (H = 0.663(2), p = 0.71). Hence, the data support H1 for electricity, but not for warm water. The respective mean ranks and post-hoc test statistics are presented in Table 3.
Pairwise comparisons for electricity consumption

a All coefficients are Bonferroni adjusted.
Since the final participant sample was smaller than expected, we conducted a sensitivity analysis to determine the statistical power for our non-parametric test. First, we converted η 2[H] to R (formula in Bakeman, Reference Bakeman2005). Given three groups, a total sample size of n = 65, and an observed effect size R = 0.352, we estimate a statistical power of 1 − β = 0.70 (calculated with pwr library for R). Importantly, for the comparison between the nudge and boost condition, our test has 74% power to detect the effect size we obtained at a significance level of 0.05.
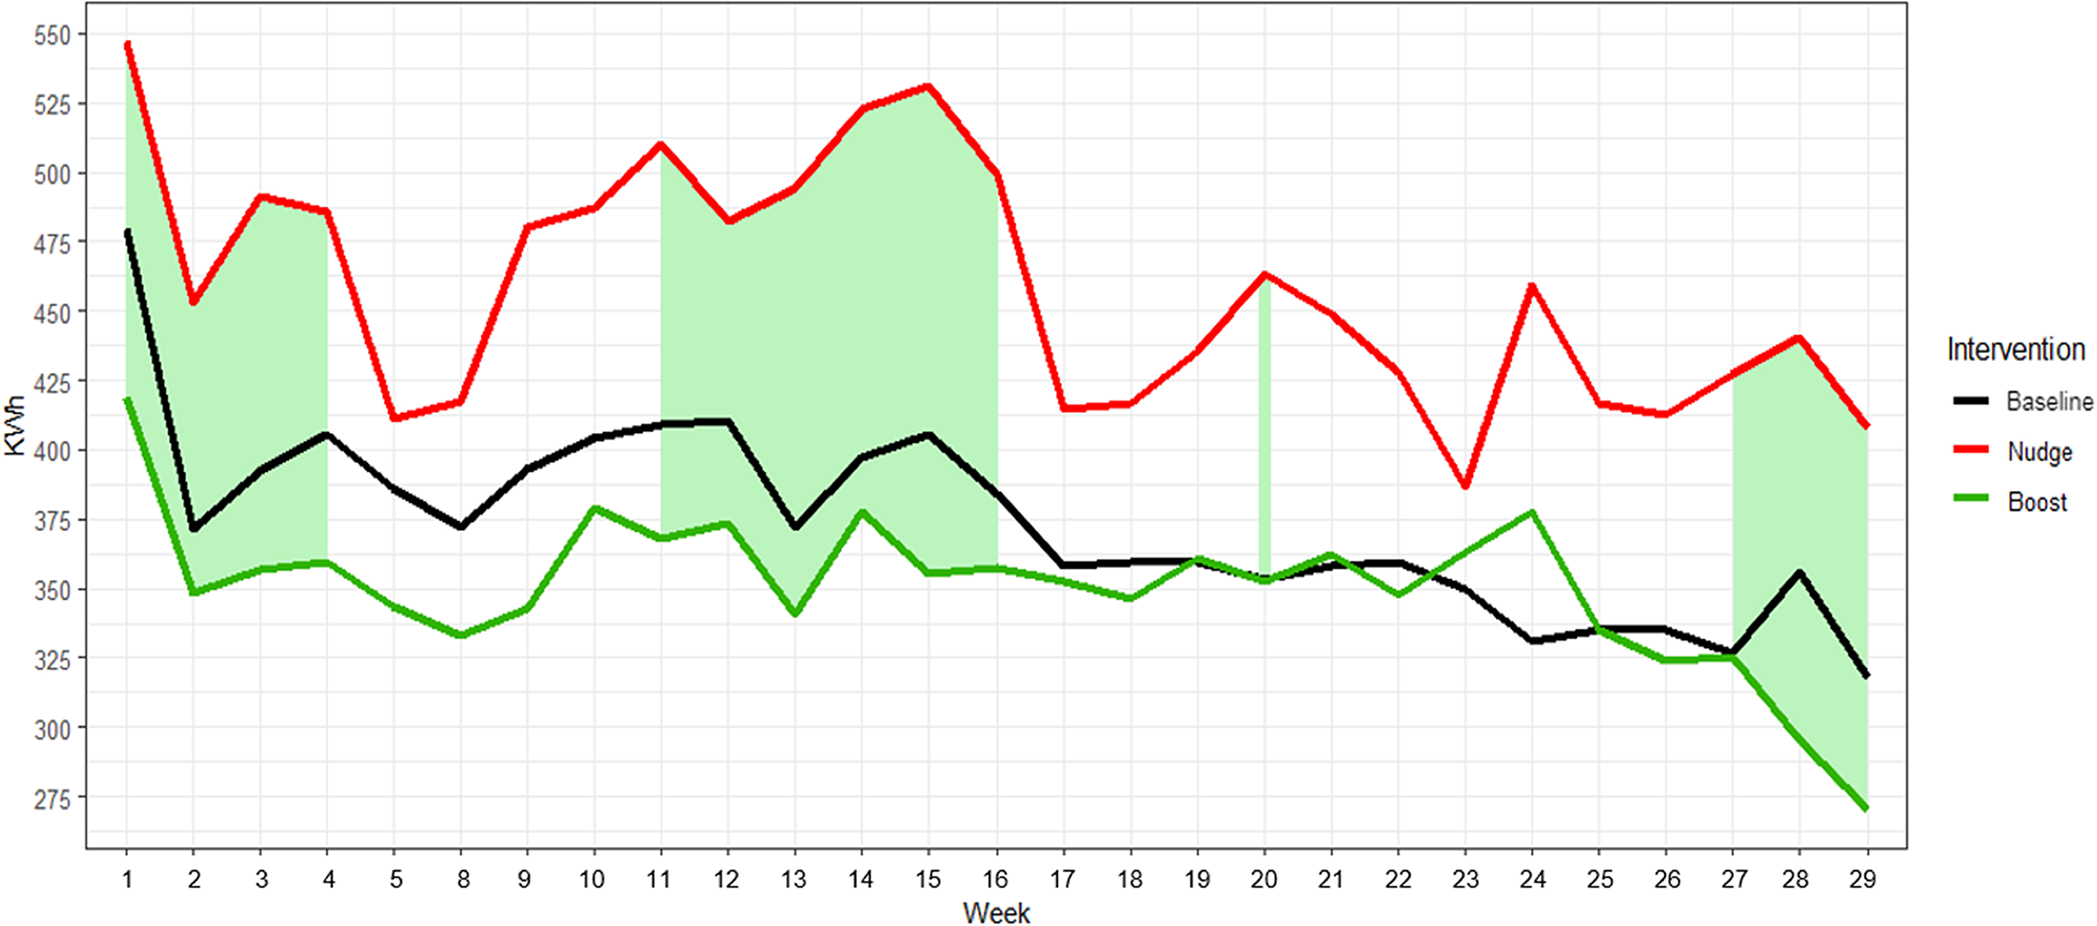
Next, we assessed the temporal consumption profiles for electricity and warm water consumption over the experimental duration. We opted for reporting cumulative weekly values, since the characteristics of the sample render weekly mean comparisons less accurate. These are nevertheless presented in the Supplementary Appendix Figure S2 and Tables S3 and S4 and report the same pattern as the values reported here. The weekly sum consumption values for electricity are plotted in Figure 2.
Cumulative weekly electricity consumption per intervention type. Note: significant differences in mean weekly ranks are highlighted in green.

Visually, the consumption curves for all conditions follow roughly the same shape. What is immediately obvious is the difference in electricity use between the boosted and the nudged participants, reported previously. A series of Dunn post-hoc tests with Bonferroni-adjusted significance coefficients (df = 26) revealed exactly when the differences occurred. Those periods appear shaded in green in the figures. The participants in the boost condition used significantly less electricity than the nudged group in the beginning (weeks 1–4), the mid part (weeks 11–16) and towards the end of the experimental period (weeks 27–29).
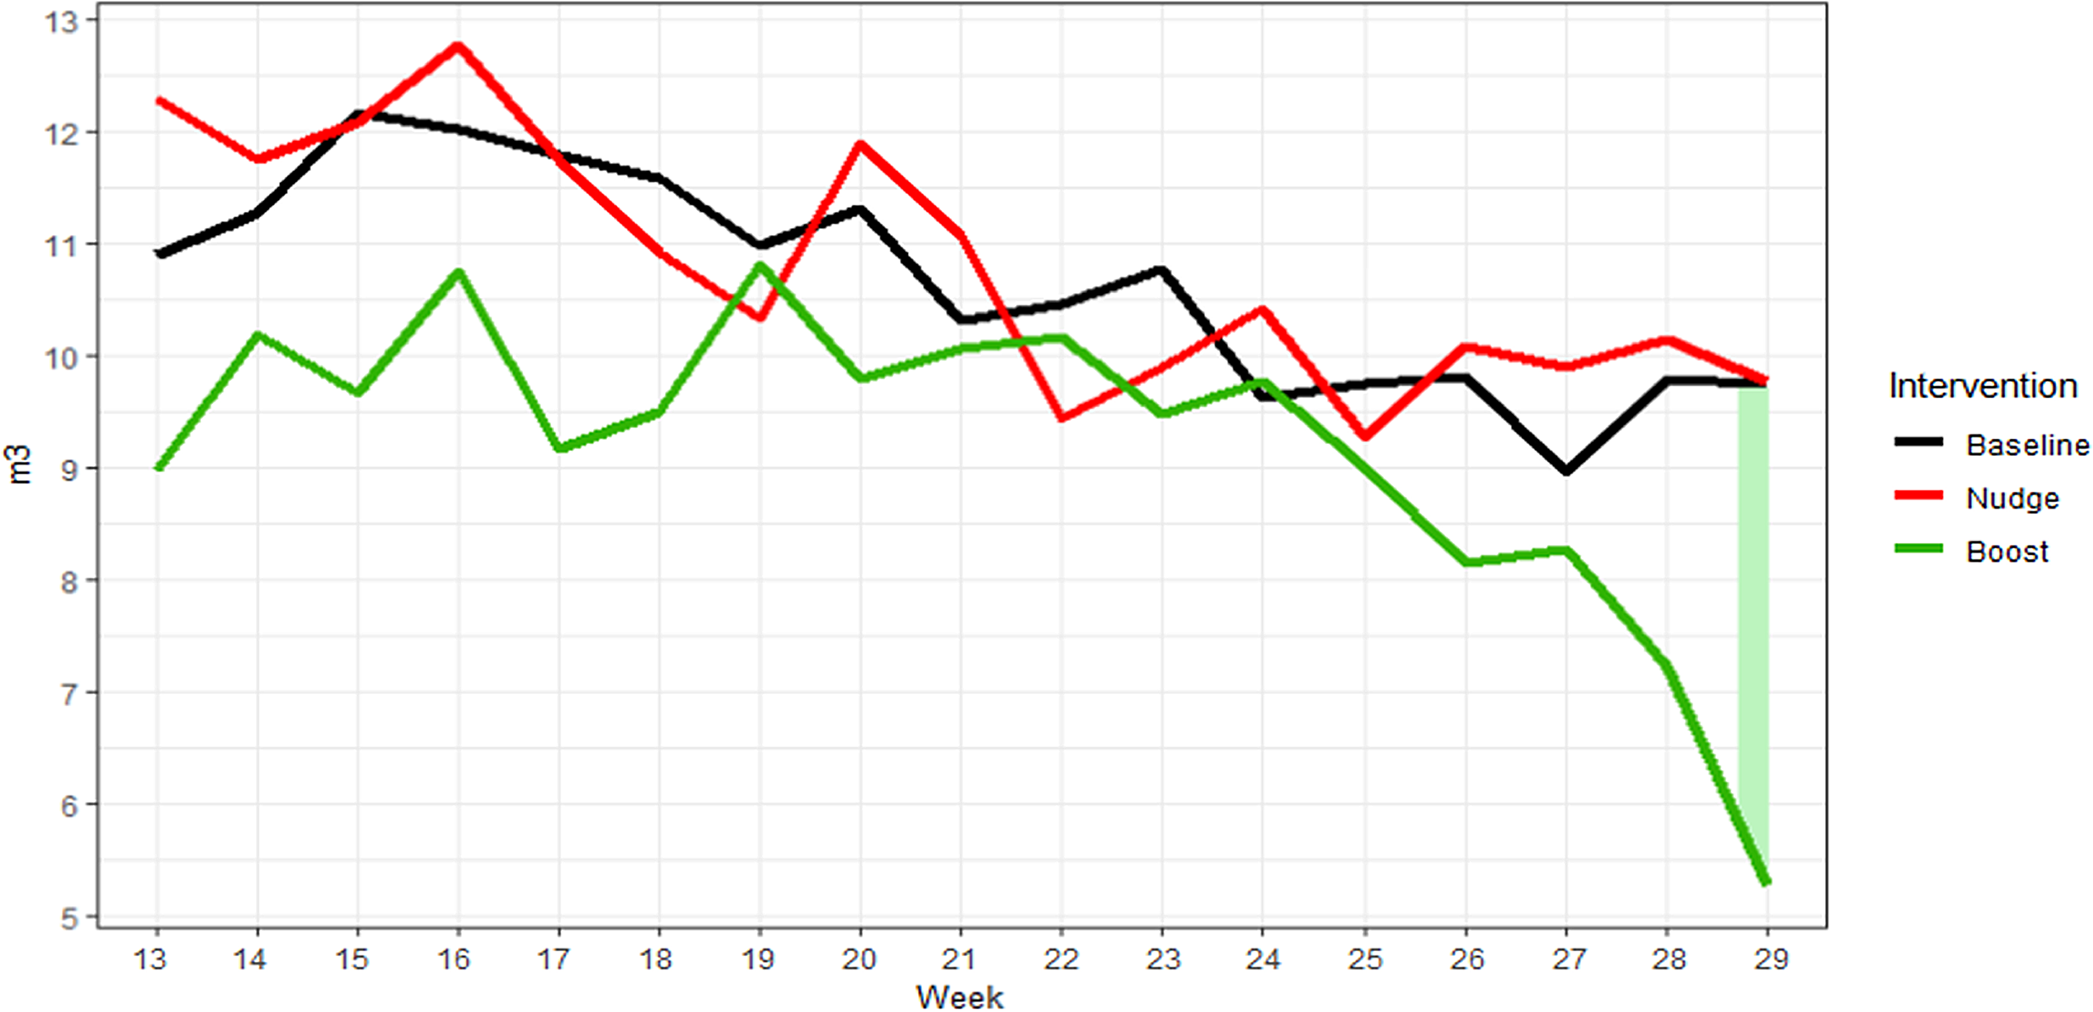
For warm water (Figure 3), the only significant differences between the boosted and the nudged participants occurred at the end of the experimental period (week 29). Hence, H2 was fully supported by electricity and partly supported by warm water.
Cumulative warm water consumption per intervention type. Note: significant mean rank differences are highlighted in green.

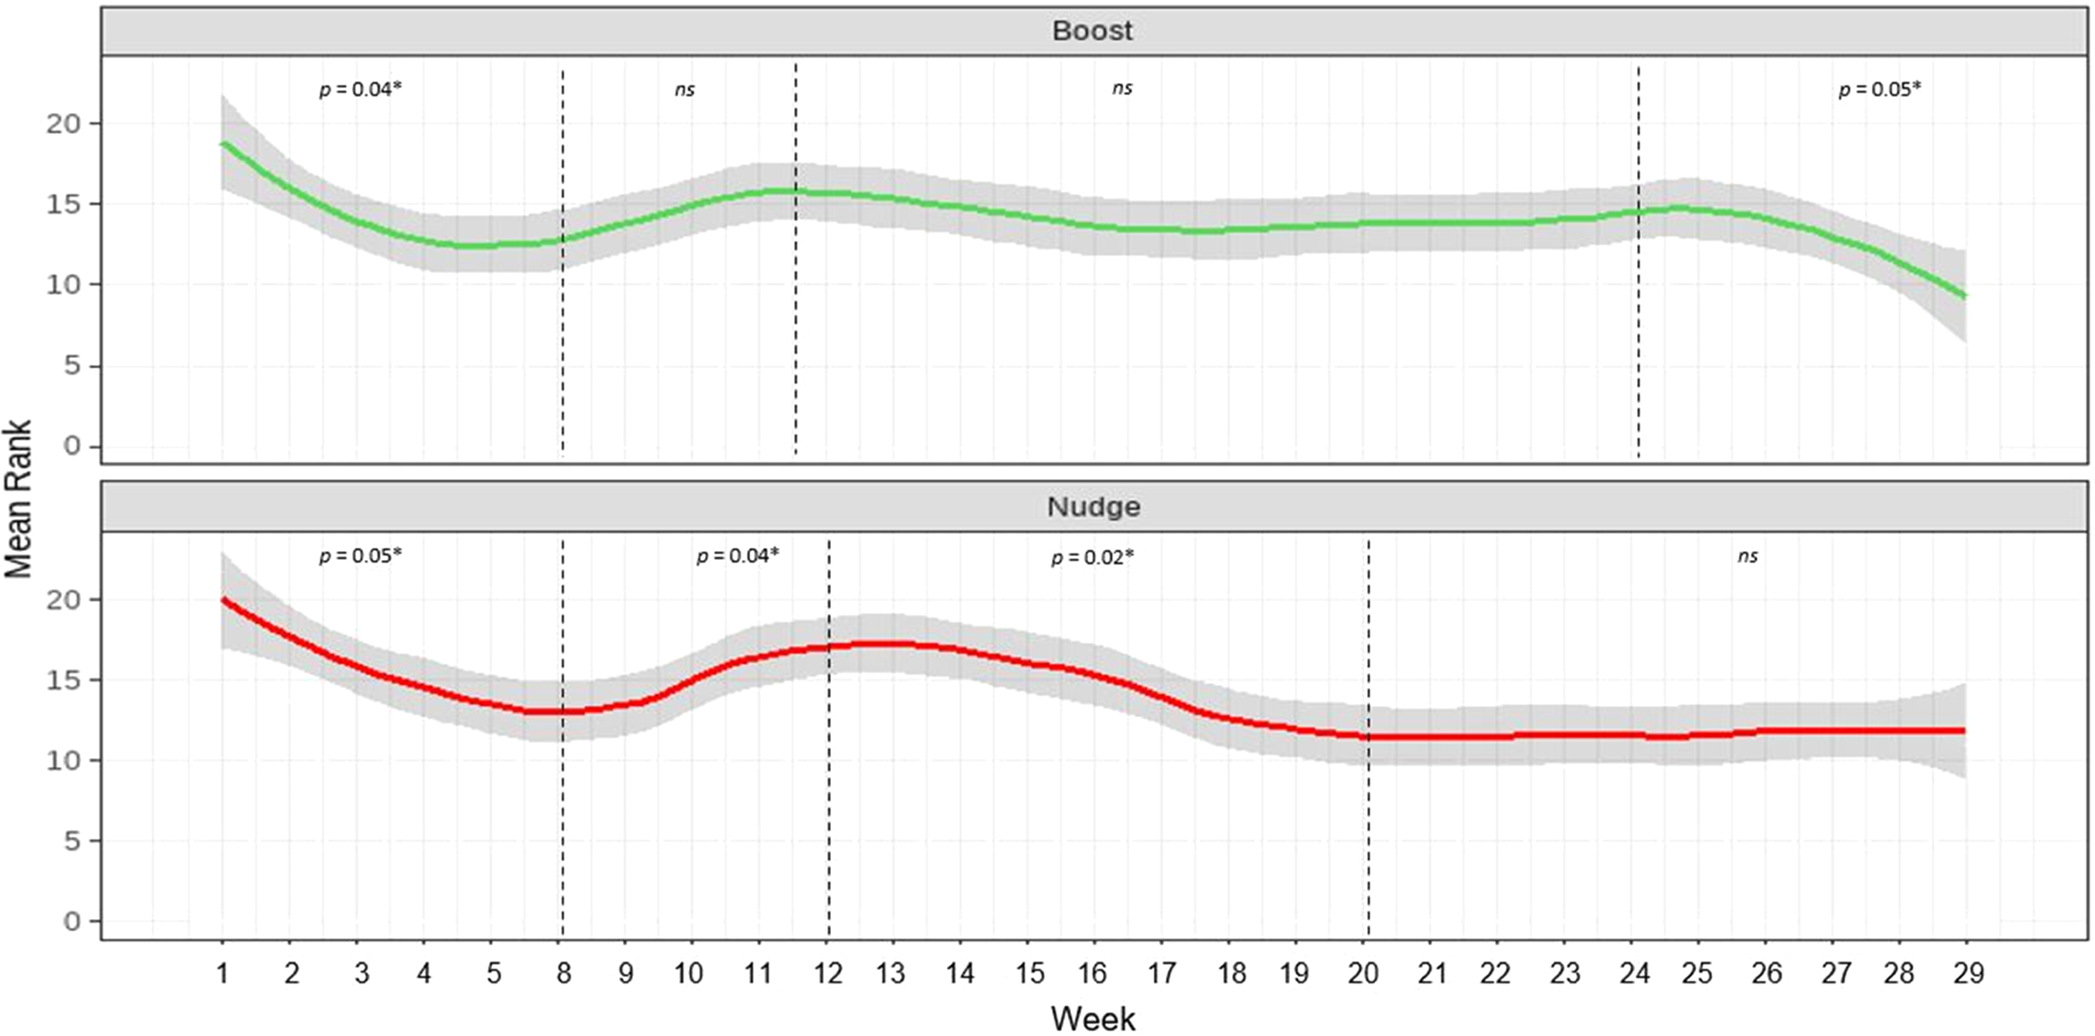
Our next objective was to map the temporal energy consumption profiles of our interventions. Hence, we explored how energy use fluctuates over time within the nudging and the boosting groups. We did not use a traditional difference-in-difference approach, as we lack consumption data before the treatment or a non-treated control. Instead, we opted for the overall differences between mean consumption ranks per condition. We conducted separate Friedman repeated measurements chi-squared tests (Friedman, Reference Friedman1937). The Friedman test is robust against violations of distributional assumptions, as it is based on the rank ordering of the observations within each condition. Significant results would suggest that there is variability or changes in electricity consumption over time within a given experimental group. The tests were significant for the boosted (χ 2(26) = 44.8, p = 0.01) and for the nudged (χ 2(26) = 74.7, p < 0.01) participants. Hence, electricity use varied significantly over time for both experimental groups. The mean weekly consumption ranks are plotted in Figure 4.
Ranked electricity consumption within intervention. *Significance coefficients are Bonferroni adjusted.

We also conducted a series of Wilcoxon signed rank tests (Wilcoxon, Reference Wilcoxon1945) to pinpoint the significant pairwise differences between all weeks during the experimental period (n = 352). Then, we identified meaningful time points on each consumption curve visually (peaks and lows), and extracted the comparisons for the corresponding periods. The respective significance coefficients were Bonferroni adjusted for the number of comparisons made. For the boosted group, there is a significant decline in consumption from the beginning of the experiment up until week 8. The same is evident for the nudged participants. However, consumption for the boosted remains low and stable after the initial drop, while electricity use for the nudged goes back up in a matter of a month (weeks 8–12). Moreover, the boosted participants lowered their consumption even more during the last part of the experiment (weeks 24–29). At week 20, the nudged participants finally recovered from the increase, stabilizing their consumption until the end of the experiment.
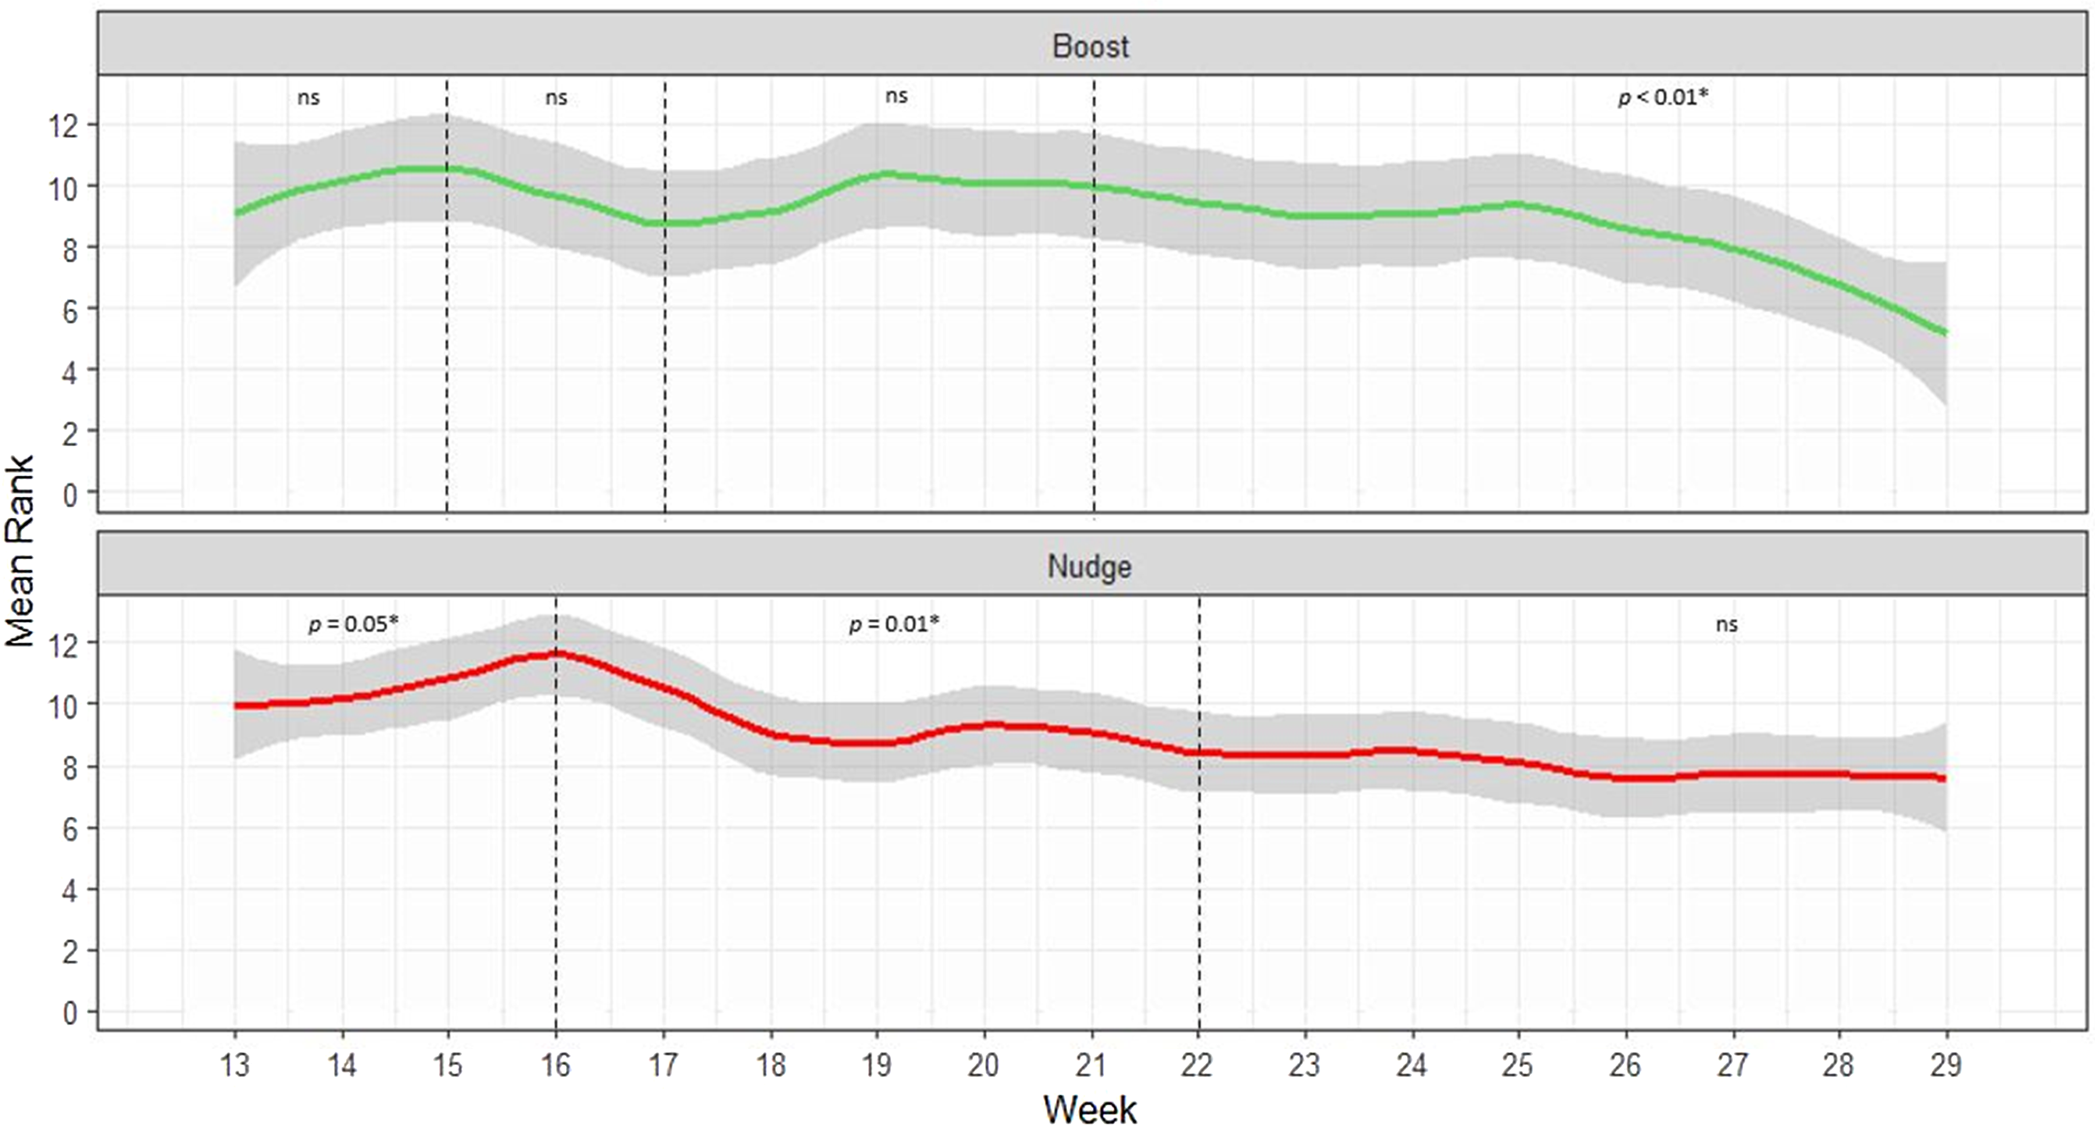
Friedman tests for warm water consumption revealed significant differences in time for the boosted (χ 2(16) = 26.8, p = 0.04), but not for the nudged (χ 2(16) = 22, p = 0.140) participants. The respective weekly mean ranks are plotted in Figure 5.
Ranked warm water consumption within intervention. *Significance coefficients are Bonferroni adjusted.

Warm water consumption increased for both interventions around the end of the first month of the experimental period. The increase was significant for the nudged, but not for the boosted. Over the next two months, the nudged participants' consumption recovered to its initial level and remained relatively unchanged until the end of the experimental period. At the same time, no significant fluctuations were observed for the boosted. From week 21 onwards, the boosted participants began to steadily lower their warm water consumption each week, up until the end of the experiment. Hence, H3 was supported for both electricity and warm water.
Mechanistic indicators
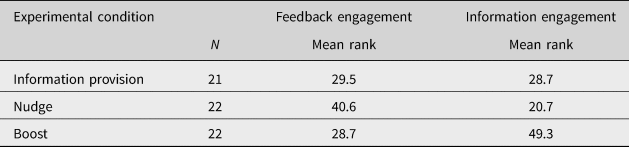
We used two types of markers to probe for mechanistic explanations of the consumption effects – behavioral (observed) and self-reported (surveyed). The behavioral markers included feedback engagement (time spent on the consumption feedback page) and information engagement (number of unique tips/links open). The mean ranks of the behavioral markers for nudges and boosts are available in Table 4.
Mean values for behavioral mechanistic markers by experimental condition

As expected, the nudged respondents spent most of the time on the feedback page, followed by the members of the boosted and the information provision groups. However, a Kruskal–Wallis analysis of variance revealed that the differences failed to reach statistical significance, H = 4.90(2), p = 0.86. Hence, H6a was not supported.
The mean ranks for information engagement showed a different pattern. In support of H5a, the participants in the boost condition engaged the most with the energy-saving information, followed by the information provision and the nudging groups. The difference was large and significant (H = 27.94(2), p < 0.001, η 2[H] = 0.41). A pairwise Dunn post-hoc test was significant for the differences between the boost group and the nudge (p < 0.001) and the information provision groups (p = 0.001). No significant differences were found between the nudged and the information provision group.
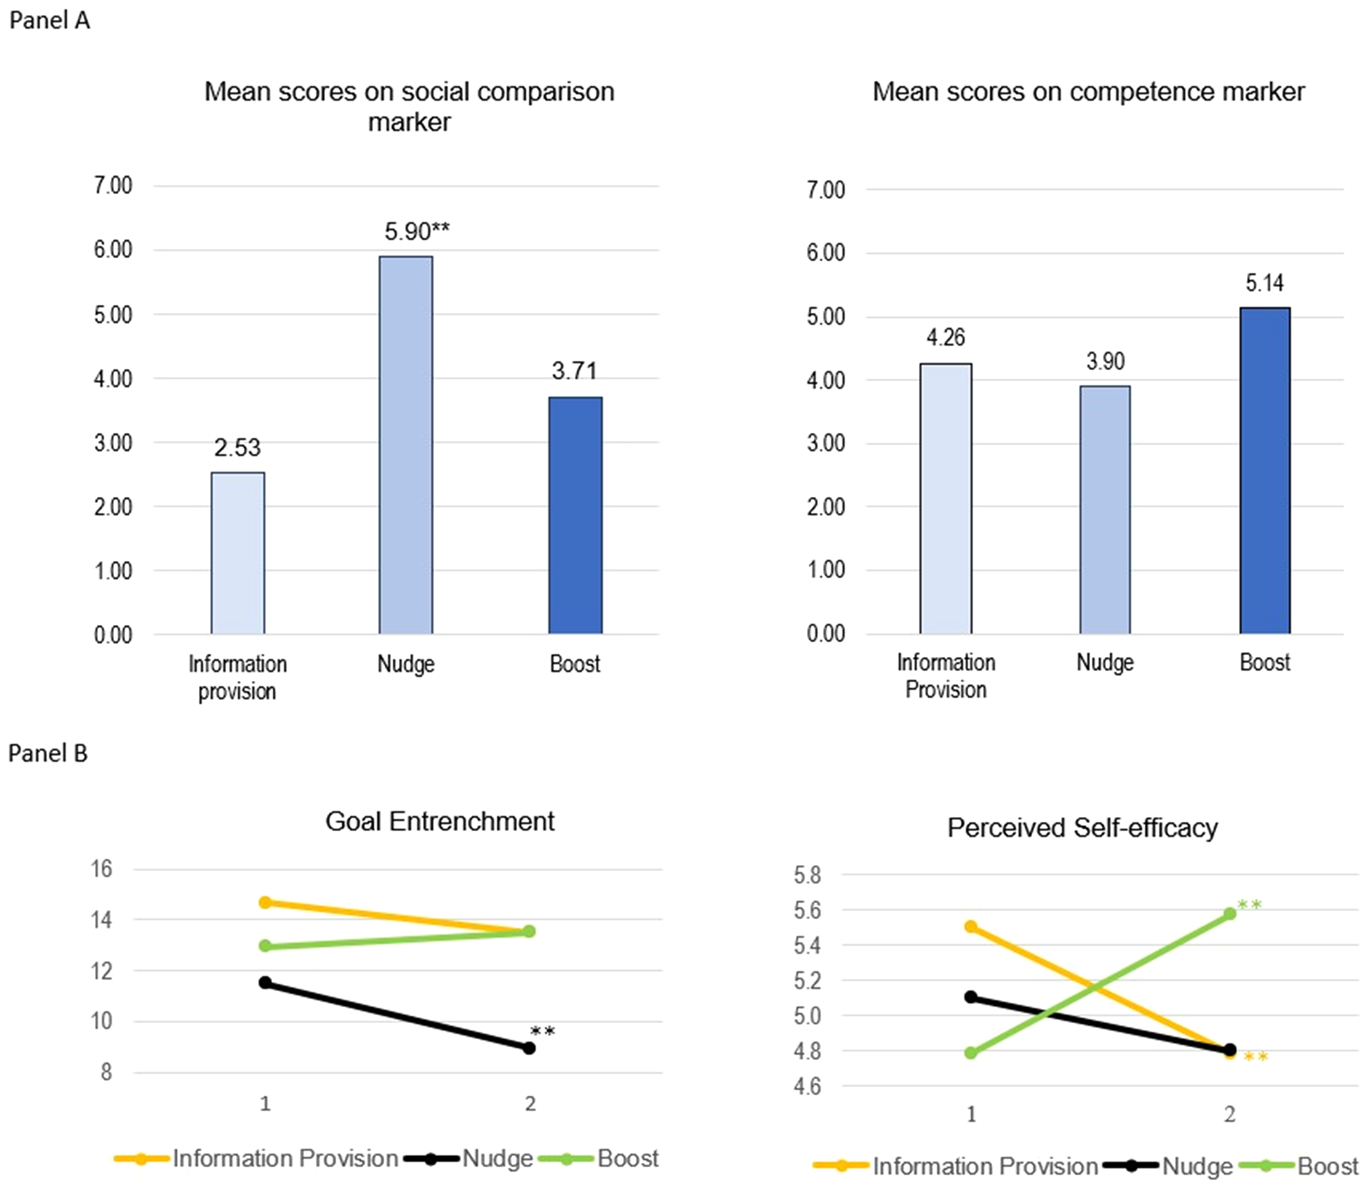
The self-reported markers included a number of measures, described in detail in the Method section. The respondent count is N = 60 at time 1 and N = 31 at time 2. Figure 6a contains the mean respondents scores on the mechanistic markers measured once at Time 2. Figure 6b contains the mean changes in time, derived from the respondents' scores on the pre-and-post questionnaires. The significant mean differences and the respective tests and coefficients are available in Supplementary Appendix Table S1. The scores on all self-reported markers were normally distributed, and due to the absence of significant outliers in the data, we used parametric methods to compare the groups.
Self-reported mechanistic markers per experimental condition. **p < 0.01, two-tailed.

As expected (H6b), the respondents in the nudge condition compared themselves to their peers significantly more often than the participants in the boost condition (t(15) = −4.01, p = 0.001) or the information provision baseline (t(23) = −6.53, p < 0.001). Unsurprisingly, the respondents in the boost condition scored highest on the energy-saving competence measure, but the differences from the nudge (t(15) = 0.550, p = 0.591) and the baseline (t(20) = 0.446, p = 0.646) conditions failed to reach statistical significance. Hence, H5b was not supported.
For our goal-entrenchment marker, we asked respondents (both at the beginning and at the end of the experiment) to estimate how much energy they could realistically save until the end of the project. The closer participants converge to the 10% threshold implemented in the goal-setting intervention, the more we consider this goal to be entrenched. As expected (H6c), by the end of the experimental period, only the respondents in the nudge condition had significantly adjusted their initial expectation, (t(15) = 3.41, p = 0.01), lowering it from 11.5 to 8.95%. No differences were found in the boost group or the baseline condition.
Notably, by the end of the experimental period only the respondents in the boost condition trusted their own energy conservation skills significantly more than at the beginning (t(6) = −3.26, p = 0.02), while the pattern for the respondents in the baseline condition was the opposite, t(13) = 2.45, p = 0.02. The nudged participants did not feel more or less confident in their ability to save energy. This supports hypothesis H5c.
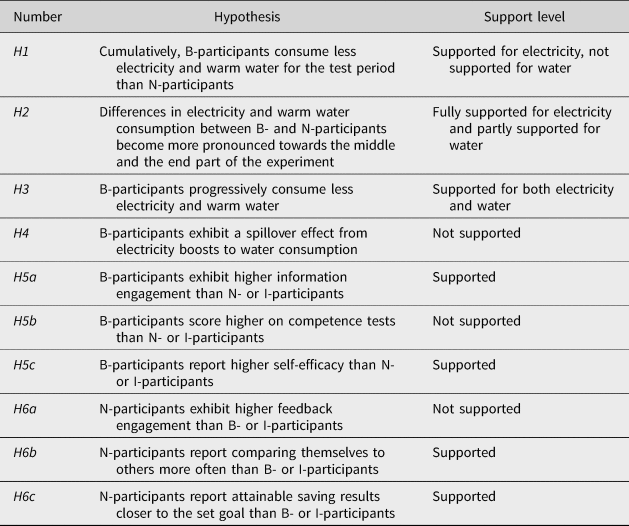
To probe for possible spillover effects from our intervention on electricity, we compared the mean ranks for water consumption between groups for the first 12 weeks of the experiment (as we started intervening on warm water in week 13). A Kruskal–Wallis analysis of variance revealed that overall, group membership had no detectable influence on warm water consumption (H = 0.69(2), p = 0.71), i.e. no significant differences between conditions were found. Hence, we find no evidence for the hypothesized spillover effects from our interventions on electricity to warm water consumption for any of the experimental groups (H4). Table 5 presents a summary of the experimental findings per hypothesis.
Experimental hypotheses summary and support level

General discussion
In a literature first long-term field randomized controlled trial, we compared the effectiveness of traditional bias-harnessing behavioral interventions – nudges – with a competence-based approach to behavioral influence: boosting. We collected electricity and warm water consumption data for a period of 29 weeks in a student dormitory setting and surveyed for a number of mechanistic markers in an attempt to explore the processes behind the interventions.
Critically for our research objectives, we showed that the boosted participants consumed significantly less electricity than the members of the nudge group throughout the experimental period. Cumulative differences in consumption were not trivial, as the boosted group used about 3 MWh less electricity than the nudged participants. For reference, the same amount is sufficient to power two housing units in the dormitories we intervened on for a year. Despite the fact that the pattern did not replicate for warm water, this is the literature's first empirical finding favoring boosting over a set of traditional nudges in the energy-saving domain.
Consistent with our theorizing, the temporal electricity consumption profiles differed between the experimental conditions. As the boosted participants acquired more energy-saving heuristics, the consumption gap between them and the nudged group became larger. The pattern was not linear, but the differences were most pronounced towards the end of the experiment when the boosted participants had accumulated the most energy-saving skills.
Consumption trends within conditions also seem to highlight (albeit indirectly) a correlation between competence acquisition and consumption. Consistent with the Hawthorne effect (Landsberger, Reference Landsberger1958), a consumption dip was evident for both groups in the first month. However, while electricity use for the nudged bounced quickly back up, the boosted group kept their consumption consistently low throughout the remaining part of the experiment. As they learned more ways to conserve energy, they continued to use less electricity until data acquisition ended.
The pattern was even more pronounced for warm water, where consumption for the boosted began dropping steadily from week 22 onwards. However, given the overall non-significant difference between groups, such a strong trend might be attributed to more than competence acquisition. In our sample, water use for the boosted group was inversely related to outdoor temperature (see Supplementary Appendix Figure 1 for a graphical representation and a correlation analysis). Residential warm water consumption for showering can exhibit a similar trend, possibly reflecting a need to “warm up” in the cold season (Rathnayaka et al., Reference Rathnayaka, Malano, Maheepala, George, Nawarathna, Arora and Roberts2015). Once the need recedes, the differential effect of our three interventions becomes more pronounced: people keep habitually using similar amounts of water unless they are boosted.
The findings also support the notion that our boost and nudge packages were indeed representative of the respective intervention types. First, we found that the members of the boost group interacted most with the provided energy-saving tips. This was true for both unique tip reads and repeated visits. In addition, the boosted participants felt more confident in their energy-saving capabilities over time, while self-efficacy scores for both the baseline and the nudged groups went down as the experiment progressed. Hence, we can speculate that the participants in the boosted group attempted to learn and apply the provided heuristics and that the experience made them more self-confident. This constitutes the first empirical (albeit indirect) indication that our boosting package triggered processes that were previously ascribed to boosts only in theory (Hertwig and Grüne-Yanoff, Reference Hertwig and Grüne-Yanoff2017).
We also find reasons to assume that our nudging package activated processes, commonly associated with the interventions it contained. First, members of the nudged group made the most comparisons with their peers out of all experimental conditions, as expected from a large body of literature on normative influence (Andor and Fels, Reference Andor and Fels2018; Khanna et al., Reference Khanna, Baiocchi, Callaghan, Creutzig, Guias, Haddaway, Hirth, Javaid, Koch, Laukemper and Löschel2021). Second, the nudged participants were the only ones to adjust their energy-saving expectations closer to the provided goal after they already had experience in trying to reach it. This indicates the presence of anchoring-and-adjustment processes (Tversky and Kahneman, Reference Tversky and Kahneman1974), typical for goal-setting and feedback interventions.
Despite being promising, our findings have limitations to their generalizability. We started the experiment during the height of the COVID-19 pandemic, when most of the available student population was staying at home. Hence, it was extremely hard to recruit and maintain a sample size sufficient to ensure that the findings truly apply to a larger population. Due to the small sample size, there might be more significant differences that we could not detect, which renders our results more conservative. While the non-parametric analyses we used are suited for dealing with distribution deviances and small participant counts (Tsybakov, Reference Tsybakov2009; Field et al., Reference Field, Miles and Field2012), we still recommend that the reported findings are treated with caution.
A second limitation is related to the interpretation of the data from our self-reported mechanistic markers. While we find significant differences between conditions as hypothesized, we do not claim that we pinpoint the exact processes behind the interventions. We recommend that future high-powered field research models the relationships between goal entrenchment, perceived self-efficacy and social comparisons in more detail. Nevertheless, our findings should provide a useful starting point for analysis.
Last, we realize that our conclusions could depend on the choice of tested interventions. We do not claim that boosts will always outperform nudges, or that nudges will remain ineffective. It could very well be that our baseline treatment was too conservative, especially when compared with a non-treated control. To clarify, our baseline treatment included feedback provision and access to energy-saving tips, which could have made it harder for both the nudge and boost treatments to outperform it (a manifestation of a ceiling effect). The choice of interventions in our research was based on theory and practicality, and we acknowledge that further tests contrasting other influence techniques might yield different results. The line between information nudges and long-term boosts can be blurred, so we limit our conclusions to the specific boosting and nudging packages we tested.
Conclusion
Despite its limitations, our research constitutes the first longitudinal field test comparing nudging and boosting interventions in the energy-saving domain. We demonstrate that boosting can be a valuable behavioral influence approach, both in terms of cumulative outcomes, and effect longevity. The findings are especially relevant in the context of current EU-level initiatives targeting citizen behaviors to induce energy savings. The EU Save Energy Communication (European Commission, 2022), for instance, emphasizes that these behaviors should be both voluntary and repetitive, so that they could lead to the formation of reliable energy-saving habits. As boosting offers a way to promote exactly these types of behaviors, we hope our evidence about the effectiveness of boosts could inform the current discussion. Beyond information campaigns, we aim to offer policymakers an effective and reliable tool for empowering sustainable decision-making and reducing energy consumption.
Supplementary material
To view supplementary material for this article, please visit https://doi.org/10.1017/bpp.2023.30.
Acknowledgements
The authors want to thank the following researchers for their valuable contributions:
Prof. Dr. Ralph Hertwig, Max Planck Institute for Human Development in Berlin, Germany
Dr. Claudia Schwirplies, Microeconomics Research Group in the University of Marburg, Germany
Dr. Caterina Marchionni, University of Helsinki, Finland
Prof. Dr. Michaela Wänke, University of Mannheim, Germany
Funding statement
This study was funded by the Swedish Research Council for Sustainable Development (FORMAS, grant number 2019-00354). FORMAS had no influence on the design, execution, analysis and interpretation of data, or writing of the study.
Competing interest
The author(s) declare none.


 Open access