


A growing body of research is moving beyond level of education to examine how the substantive content of what people study shapes political attitudes and vote choice. Recent papers using panel data find that a person’s field of education actually has a causal effect and is not merely a proxy for prior influences that lead a person to study a particular subject (Goldstein and Kolerman-Shemer Reference Goldstein and Kolerman-Shemer2025; Hooghe, Marks, and Kamphorst Reference Hooghe, Marks and Kamphorst2025; Kamphorst et al. Reference Kamphorst, Hooghe, Marks and Wang2025; Martin, Scott, and Kappe Reference Martin, Scott and Kappe2025). However, the panel data required for causal inference cover a limited set of political attitudes and a small number of national contexts, which makes them ill suited for assessing how broadly, and how selectively, educational field is related to political attitudes. Rather than reestimating causal effects, this paper draws on cross-sectional data covering a wide range of political attitudes in Europe and the United States to assess which political attitudes are systematically associated with educational field, and which are not.
This paper addresses fundamental questions concerning the scope, power, and generality of educational field theory:
-
• Scope : Which kinds of political attitudes are systematically related to field of education, and which are not?
-
• Power : How strongly are political attitudes related to different fields of education, and how does this compare with level of education?
-
• Generality : Do these patterns hold across all Western democracies, or are they limited to specific countries or systems of higher education?
To understand which political attitudes are related to field of education, we need to reverse the conventional approach to political behavior. Existing research tends to isolate one or two outcomes, often producing statistically significant effects for particular attitudes or behaviors, such as immigration (Almstedt Valldor Reference Almstedt Valldor2024; Eger, Hjerm, and Velásquez Reference Eger, Hjerm and Velásquez2025), ideological self-placement (Goldstein and Kolerman-Shemer Reference Goldstein and Kolerman-Shemer2025), or voting on the sociocultural divide (Attewell and Zollinger Reference Attewell and Zollinger2025; Hooghe, Marks, and Kamphorst Reference Hooghe, Marks and Kamphorst2025; Martin, Scott, and Kappe Reference Martin, Scott and Kappe2025). This is valuable information, but it leaves open the question of whether the observed relationships fit a broader pattern with distinct scope conditions. Rather than isolating a narrow set of outcomes, we map how field covaries with a wide range of political objects: economic preferences, cultural views, political identities, democratic norms, and political engagement.
We begin from the premise that academic disciplines are cognitive environments in which students are socialized into distinct modes of reasoning (Hooghe and Marks Reference Hooghe and Marks2022; Ladd and Lipset Reference Ladd and Lipset1975; Lazarsfeld and Thielens Reference Lazarsfeld and Thielens1958). Drawing on attribution theory (Guimond, Begin, and Palmer Reference Guimond, Begin and Palmer1989; Guimond and Palmer Reference Guimond and Palmer1990; Heider Reference Heider1958; Weiner Reference Weiner1985), we argue that fields vary in whether they encourage contextual or individual-centered attribution. To what extent do they engage empathy, care, and social complexity rather than technical control, efficiency, or market rationality? Human-centered fields—those engaging the social, cultural, and emotional dimensions of human experience—encourage interpretive judgments conducive to liberal political views. In contrast, material-centered fields, oriented toward technical or economic thinking, encourage interpretive judgments aligned with more conservative worldviews grounded in individualism and accountability.
The theory we propose has scope conditions that specify both where it applies and where it does not. Attribution theory is concerned with how a person interprets the motivations of others; it does not address how politically involved a person chooses to be. While attributional judgments encompass a broad range of political attitudes, there is little reason to expect them to determine the intensity of political commitment or the incidence of political behavior. Hence, we do not expect field of education to shape attitudes related to political engagement—that is, a person’s interest in politics, sense of efficacy, propensity to participate, or emotional identification with political parties.
Assessing these claims calls for conceptual precision. Most importantly, we need to move beyond a categorical treatment of academic disciplines. Existing research relies on nominal indicators that obscure the underlying logic of variation. Our theoretical argument calls for a continuous measure that reflects the degree to which each field emphasizes human-related concerns. In addition, we need reliable, up-to-date data to construct such a measure. Existing continuous measures, most notably the skill-content typology developed in the Netherlands in the late 1990s (Van de Werfhorst Reference van de Werfhorst and Kraaykamp2001; Van de Werfhorst and Kraaykamp Reference van de Werfhorst and Kraaykamp2001), are valuable but outdated, and they may not reflect how fields have evolved in response to social and economic change.
To address these conceptual and empirical challenges, we construct a new continuous measure of field human-centeredness using original data from contemporary surveys in the US and the Netherlands. The resulting measure provides a common scale for comparing disciplines from anthropology to engineering by the extent to which they emphasize communicative and cultural understanding. This enables us to model field as a continuous predictor rather than as a set of unrelated nominal categories.Footnote 1
Our findings are twofold. First, the human-centeredness of a field of education is strongly and consistently associated with liberal views on a wide range of political attitudes: redistribution, immigration, racial inequality, gay marriage, foreign aid, and environmental protection. These are precisely the domains where attributional reasoning and moral appraisal shape political judgment. Those with human-centered education are also much less willing to endorse Christian nationalism and extralegal political behavior.
Second, we find no comparable pattern of association of field with political engagement. The human-centeredness of a person’s field does not predict how interested they are in politics, whether they feel efficacious, whether they vote, or how strongly they identify with or feel toward political parties. This null finding is theoretically meaningful, for it suggests that field is associated with how individuals interpret the political world but not with the extent to which they choose to enter or engage with it.
In the following section we explain why it is valuable to take seriously the content of education alongside the level of education, and we outline the principal empirical implications of a theory of field of education. We then introduce our measure and assess our expectations using surveys of political attitudes in the US and 10 European countries.
Empirical Implications of Field Theory
Why should the field that someone studies shape their political worldview? We draw on attribution theory to argue that academic training affects how individuals explain the causes of social phenomena—what psychologists call causal attributions. Classic attribution theory holds that individuals tend to explain behavior either in terms of internal dispositions related to effort, morality, or talent (i.e., they person blame) or they do so by invoking social constraints or structural factors (i.e., they system blame) (Heider Reference Heider1958; Jones and Nisbett Reference Jones, Nisbett, Jones, Kanouse, Kelley, Nisbett, Valins and Weiner1972; Ross Reference Ross1977).
We posit that academic fields cultivate distinct repertoires for understanding human behavior and social outcomes. Some fields emphasize situational and structural causes; we term these human centered (see also Kunst Reference Kunst2020; Surridge Reference Surridge2016). Students in these disciplines routinely encounter theories that emphasize historical context, social influence, inequality, and constraint on human behavior. Material-centered fields of study are those that do not engage human behavior at all, or if they do, they are more likely to promote dispositional reasoning and individual responsibility.
Experimental research supports this distinction. Guimond and colleagues (Guimond, Begin, and Palmer Reference Guimond, Begin and Palmer1989; Guimond and Palmer Reference Guimond and Palmer1990; Reference Guimond and Palmer1996) find that students in different fields vary in how they explain poverty and unemployment: social science students are more inclined toward system blame, while business students lean toward person blame, with engineering and applied science occupying a middle ground. Engineering graduates tend to display a “penchant to seek simple and unambiguous explanations of the social world and its ills” (Gambetta and Hertog Reference Gambetta and Hertog2016, 147). Importantly, these differences are not reducible to anticipated earnings or career outlooks, suggesting a role for field-based socialization in shaping explanatory styles.
If field of education influences how people assign causes and responsibilities, it should shape political judgments that require attributional reasoning. Many political beliefs hinge not only on values but also on causal accounts: Do people succeed because of effort or luck? Is poverty the result of bad choices or structural disadvantages? Are immigrants responsible for social problems, or are they victims of exclusion? Such questions are attributional as well as ideological.
This logic extends beyond cultural liberalism. Issues like race, gender, and immigration clearly engage attributional reasoning. Redistribution preferences often do as well, especially when debate centers on judgments of deservingness (Cavaillé Reference Cavaillé2023). As Attewell (Reference Attewell2021, 615) notes, “perceptions of the deservingness of welfare state beneficiaries hinge on mechanisms of social affinity and empathy.” Are recipients judged as unlucky or irresponsible; are they socially deviant or constrained by forces beyond their control? Situational thinking fosters empathic support for redistribution, whereas dispositional reasoning may lead to skepticism or resistance.
The preceding discussion yields two core empirical implications that translate the logic of attributional socialization and field-based reasoning into testable claims about political attitudes.
H1: the human-centeredness of a person’s field of education systematically predicts political and ideological attitudes that require interpretive judgment.
An attributional theory of educational field encompasses a wide range of political attitudes, but it is not limitless. The theory is bounded by its focus on interpretive questions that require individuals to locate causes—whether in personal failings and choices or in social constraints and structural forces. The mechanisms that link field of education to political attitudes operate through how people explain social outcomes and assign responsibility, not whether or how they act on such judgments.
Hence, we do not expect field of education to shape attitudes related to political engagement. These dispositions are about how much time or energy a person invests in politics, and this depends on the intensity of their political attitudes alongside their sense of political efficacy, resource endowments, and other factors weakly related, if at all, to the substantive content of their political attitudes.
This aligns with the classic argument that civic engagement depends on time, money, and civic skills, capacities that are associated with level rather than field of education (Brady, Verba, and Schlozman Reference Brady, Verba and Schlozman1995). A recent study of level of education finds that the strongest effects are on voting, protest, political interest, and activism, precisely the outcomes we theorize as less susceptible to attributional reasoning (Apfeld et al. Reference Apfeld, Coman, Gerring and Jessee2024, chaps. 4–5). Weaker effects are observed for cosmopolitanism, cultural attitudes, party identification, and economic attitudes, where we expect attributional reasoning to be consequential.
Our theory therefore predicts an asymmetry: the field effect will be pronounced for attitudes that depend on attributional reasoning, and weak or negligible for attitudes that capture political engagement, affect, or moralized partisanship.
H2: field of education has little or no predictive power for attitudes that reflect political motivation, affect, or engagement.
Measurement and Data
Our analysis investigates how the content of higher education shapes a range of political attitudes and forms of engagement. Our core explanatory variable is the human-centeredness of a person’s field of education, a measure that we develop using original data from two surveys and apply across two major external datasets. This section details the data sources we use, how we construct the human-centeredness index and map it onto existing surveys, and how we operationalize our dependent variables.
Data Sources
Our analysis draws on four data sources that vary in scope, population, and mode of data collection:
-
• US Field Survey (2024). The authors fielded this original survey in February 2024, administered by TGM, to US adults with population quotas for gender, age, region, education, and rural/urban location (N = 6,435).
-
• Dutch Field Survey (2024). The authors fielded this original survey in fall 2024, administered by CloudResearch, to college-educated Dutch citizens with population quotas for gender and age (N = 1,000).
-
• General Social Survey (GSS) (2012–22). The GSS is a nationally representative cross-sectional survey of US adults that has been conducted since 1972 (Davern et al. Reference Davern, Bautista, Freese, Herd and Morgan2024). The GSS collects detailed field-of-study information (college majors) from 2012 to 2022 (N = 17,272; college educated N = 7,324).
-
• YouGov Europe Survey (2023). This survey is conducted by a research team at the European University Institute in 10 Western European democracies, with items on field of study supplied by the authors (N = 16,798) (Hemerijck et al. Reference Hemerijck, Genschel, Stolle, Cicchi, Russo, Nasr and Schelkle2023).
Measuring Human-Centeredness
To estimate the human-centeredness of academic fields, we replicate a schema introduced by Van de Werfhorst and Kraaykamp (Reference van de Werfhorst and Kraaykamp2001) that categorizes skills in four domains:
-
• cultural skills: historical analysis, artistic expression, writing and reading, arts and literature
-
• economic skills: management, accounting, commercial thinking, law
-
• communicative skills: public speaking, group discussion, teaching, social psychology
-
• technical skills: mechanization and production processes, automation and computing, calculus, tests and experiments
Communicative and cultural skills emphasize the contextual conditions of human behavior, whereas economic and technical skills are concerned with the physical world or with the material incentives underlying human behavior (Elchardus and Spruyt Reference Elchardus and Spruyt2009; Surridge Reference Surridge2016). Van de Werfhorst and Kraaykamp (Reference van de Werfhorst and Kraaykamp2001, 299) observe that behavioral sciences, which focus on social issues and human interaction, train students in skills that “make students aware of other people’s standpoints and motives.” Cultural skills in history, literature, and the creative arts sensitize students to the diversity of human norms and ways of life (Maxwell Reference Maxwell2020; Van de Werfhorst and de Graaf Reference van de Werfhorst and de Graaf2004). Conversely, there is an elective affinity between person-blame attribution and technical and economic skills. Technical skills (production processes, calculation, testing) train students to transpose materials into products; economic skills (accounting, commerce, management, law) focus on instrumental cost-benefit analysis and profit maximization. These skills direct attention to how humans can command nature or take control over their own fate.
Despite the suitability of this skills schema for our purpose, Van de Werfhorst and Kraaykamp’s survey was conducted in the Netherlands in 1998, raising the possibility that its skill profiles may be dated or context specific. To assess this, we fielded a population-representative survey in the US in spring 2024, asking college-educated respondents to evaluate the extent to which their major subject emphasized specific skills. In fall 2024, we replicated this in the Netherlands. Each respondent rated on a five-point scale how much their program of study emphasized each of 16 skills. We compute average scores across respondents for each skill and skill domain for 80 fields of study.
A field’s human-centeredness score is the proportion of cultural and communicative skills relative to the total of all four domains across all respondents in a field of study, where n is the number of individuals i in a field of study j, and so for each j:

This estimate is rescaled so that it ranges from zero (fully material centered) to one (fully human centered).
Psychometric analyses confirm the reliability and structure of this measure. All four skill scales have high internal consistency (Cronbach’s α between 0.76 and 0.83 for the US survey and between 0.77 and 0.86 for the Dutch survey), and a principal components analysis yields four robust factors corresponding to the four domains. These patterns are consistent across demographic subgroups (gender, cohort). Further, analysis of variance reveals that field of education is by far the strongest predictor of skill emphasis, exceeding occupation, education level, income, gender, or age. Online appendix G and Hooghe and colleagues (Hooghe et al. Reference Hooghe, Marks, Kamphorst and Schulte-Cloos2026) provide detailed documentation and replication materials.Footnote 2
Cross-Walking the Index to External Datasets
We use these field-level human-centeredness scores to construct respondent-level variables in two large secondary datasets: the US GSS and the 2023 YouGov survey in Europe. Each dataset includes information on respondents’ field of study, which we match to the closest ISCED-aligned category in our US field survey:Footnote 3
-
• In the GSS, 80 majors are matched to fields in the US field survey to assign a unique human-centeredness score.
-
• In the YouGov survey, respondents report their main subject from a list of 21 fields. We align these to the most similar fields in the US field survey. We repeat this exercise with field scores derived from the Dutch field survey and find that these correlate at 0.93 with scores from the US field survey.
This converts a series of dichotomies, one for each field of study, into a single continuous measure that taps the human-centered content in a person’s education.
For descriptive purposes and robustness, we also construct a trichotomous variable for educational experience: (1) individuals with no college education (high school or below), (2) those with a college degree in a low human-centered field (score < 0.5), and (3) those with a college degree in a high human-centered field (score ≥ 0.5). This categorical operationalization allows us to compare field-based differences with the more familiar diploma divide (level of education).
Dependent Variables
The dependent variables in this study comprise the following political outcomes:
-
• political identity: ideological self-placement, party identification
-
• political attitudes: redistribution, immigration, environment, racial discrimination, gay marriage, Christian nationalism, extralegal norms
-
• political engagement: political participation, political efficacy, political interest, party affect, expressive partisanship, affective polarization, moral disengagement
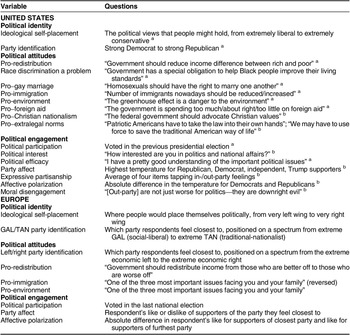
Table 1 lists these variables alongside abbreviated survey questions. All noncategorical variables are rescaled from zero to one for comparability, with zero indicating maximum opposition and one indicating maximum support, except in the cases of ideological self-placement and party identification. We estimate multiple regressions, controlling for level of education, gender, income, ethnicity, rural or urban residence, age, religiosity, and relevant country/year fixed effects. For full wording of survey questions and variable construction, see online appendix A.
Political Attitudes and Political Engagement in the US and Europe

Table 1 Long description
The table is divided into two primary sections: United States and Europe.
United States Section:
* Political identity: Includes Ideological self-placement (liberal to conservative) and Party identification (Democrat to Republican).
* Political attitudes: Measures Pro-redistribution, Race discrimination as a problem, Pro-gay marriage, Pro-immigration, Pro-environment, Pro-foreign aid, Pro-Christian nationalism, and Pro-extralegal norms (using force or taking the law into own hands).
* Political engagement: Measures Political participation (voting), Political interest, Political efficacy, Party affect (feeling thermometers), Expressive partisanship, Affective polarization, and Moral disengagement (viewing the out-party as evil).
Europe Section:
* Political identity: Includes Ideological self-placement (left wing to right wing) and G A L / T A N party identification (social-liberal to traditional-nationalist).
* Political attitudes: Includes Left/right party identification (economic spectrum), Pro-redistribution, Pro-immigration, and Pro-environment.
* Political engagement: Measures Political participation (voting), Party affect (liking supporters of own party), and Affective polarization (difference in liking between closest and furthest party supporters).
Data sources are indicated by superscripts: ‘a’ for G S S, ‘b’ for the 2024 U S field survey, and the 2023 YouGov survey for European data.
Sources: The superscripts a and b refer to data from GSS and the 2024 US field survey, respectively; all data on attitudes and engagement in Europe come from the 2023 YouGov survey.
Where Field Matters: Political Attitudes, Not Political Engagement
We begin by examining where field of education matters, and where it does not. We focus on college graduates for whom we have detailed information on educational specialization. Our expectation is that human-centeredness is most closely associated with attitudes that involve attributional reasoning, such as political identity and cultural views, but less closely associated with political engagement, including interest, participation, and party affect. While our primary focus is the US, we also assess whether similar patterns appear across Western Europe.
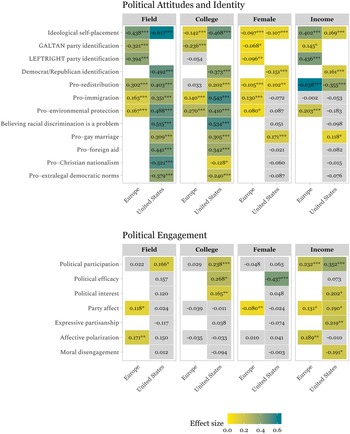
Figure 1 summarizes standardized regression coefficients for a range of political attitudes and political engagement outcomes (listed on the y-axis) across Europe and the US. The figure presents results from multivariate regression models separately by predictor.
Field of Education Compared with College, Gender, and Income
Note: The figure reports standardized regression coefficients from a single multivariate model for four predictors (panels) on a range of outcomes (y-axis). Dependent variables are z-standardized (mean = zero, standard deviation = one), and independent variables are rescaled from zero to one. Coefficients therefore represent the expected difference in the outcome (in standard deviations) between observations at the minimum versus maximum value of each predictor in the sample. Light gray coefficients are not statistically significant. Online appendix B reports regression tables. Appendix figure B.1 shows that results are similar when excluding covariates that could be endogenous to field choice (income, rural/urban, age). * p < 0.01, ** p < 0.001, *** p < 0.0001.

Figure 1 Long description
The image consists of two main horizontal sections: Political Attitudes and Identity (top) and Political Engagement (bottom). Each section contains four vertical panels representing predictors: Field, College, Female, and Income. Each panel has two columns for Europe and United States. Values are standardized regression coefficients indicated by color (yellow for low/negative, green for high/positive) and text.
Top Section: Political Attitudes and Identity
- Ideological self-placement: Field shows negative coefficients for Europe (-0.438) and U S (-0.617). College shows -0.142 (Europe) and -0.468 (U S). Female shows -0.097 (Europe) and -0.107 (U S). Income shows positive coefficients 0.402 (Europe) and 0.169 (U S).
- G A L T A N party identification: Field is -0.321 (Europe). College is -0.236 (Europe). Female is -0.068 (Europe). Income is 0.145 (Europe).
- L E F T R I G H T party identification: Field is -0.394 (Europe). College is -0.054 (Europe). Female is -0.096 (Europe). Income is 0.436 (Europe).
- Democrat/Republican identification: U S values are -0.492 (Field), -0.373 (College), -0.151 (Female), and 0.161 (Income).
- Pro-redistribution: Field shows 0.302 (Europe) and 0.403 (U S). Income shows strong negative coefficients: -0.638 (Europe) and -0.355 (U S).
- Pro-immigration: Field shows 0.163 (Europe) and 0.351 (U S). College shows 0.140 (Europe) and 0.543 (U S).
- Pro-environmental protection: Field shows 0.167 (Europe) and 0.488 (U S). College shows 0.270 (Europe) and 0.410 (U S).
- Believing racial discrimination is a problem: U S values are 0.515 (Field) and 0.534 (College).
- Pro-gay marriage: U S values are 0.309 (Field), 0.305 (College), 0.171 (Female), and 0.118 (Income).
- Pro-foreign aid: U S values are 0.441 (Field) and 0.342 (College).
- Pro-Christian nationalism: U S values are -0.521 (Field) and -0.128 (College).
- Pro-extralegal democratic norms: U S values are -0.379 (Field) and -0.240 (College).
Bottom Section: Political Engagement
- Political participation: Income shows 0.232 (Europe) and 0.352 (U S). College is 0.238 (U S).
- Political efficacy: Female is -0.437 (U S). College is 0.268 (U S).
- Political interest: College is 0.165 (U S). Income is 0.202 (U S).
- Party affect: Field is 0.118 (Europe). Female is -0.080 (Europe). Income is 0.131 (Europe) and 0.190 (U S).
- Expressive partisanship: Income is 0.219 (U S).
- Affective polarization: Field is 0.171 (Europe). Income is 0.189 (Europe).
- Moral disengagement: Income is -0.191 (U S).
A color scale at the bottom indicates Effect size from 0.0 (yellow) to 0.6 (dark green). Asterisks denote statistical significance levels.
The purpose is to evaluate whether even after accounting for variables that are commonly correlated with political outcomes, field of education retains explanatory leverage. Each panel shows a predictor—field, college, gender, income—and columns within each panel display coefficients for Europe (left) and the US (right). All predictors are rescaled from zero to one, and coefficients are standardized differences in the outcome (in standard deviations) between observations at the minimum versus maximum of each covariate. Putting estimates on a common scale allows readers to compare the relative magnitude of associations among field, gender, income, rural/urban location, religiosity, and race, without treating these variables as causal interventions. Cell shading signals the magnitude of statistically significant coefficients, ranging from light yellow (smaller) to dark green (larger). Light gray cells denote nonsignificant coefficients. Empty cells indicate that no data are available for that covariate outcome pair.
We begin with the US, with results reported in the second column of each panel (full regression results in tables B.1a, B.1b, and B.2 in online appendix B). The top left panel indicates that the human-centeredness of a person’s field of education is a strong and statistically robust predictor across a range of political attitudes (H1).
The association with political identity is highly significant (p < 0.00001) and substantively meaningful. A one-unit shift on field—from material centered, such as mechanical engineering or accounting, to human centered, such as history, education, or sociology—is associated with a 0.617 standard-deviation change toward liberalism. This is equivalent to moving from moderate to strongly liberal on the standard American National Election Studies ideological self-placement scale, and it is larger than the difference between completing a two-year college degree and doing a graduate degree (0.468, first cell in the fourth column). A one-unit shift on the field scale also predicts a 0.492 standard-deviation move on party identification. This is comparable to moving from weak Republican to independent, or from weak Democrat to strong Democrat on the seven-point scale. On political identity, the substantive effect of field exceeds that of educational level, gender, and income.
Respondents from human-centered fields also express greater support on income redistribution (+0.403 standard-deviation change), government obligation to reduce racial inequality (+0.515), gay marriage (+0.309), and immigration (+0.351), and they are more likely to find the greenhouse effect a dangerous threat to the environment (+0.488).
These associations are statistically significant at p < 0.00001. On redistribution, the field effect is comparable to the difference between holding a neutral position on whether “the government in Washington ought to reduce income differences between rich and poor” and expressing moderate support for a government role. For the environment, a one-unit increase in field leads to an increase of roughly 0.6 points on the five-point scale. For immigration, field is moderately associated with support, with a one-unit increase in field producing a 0.351 standard-deviation difference in the outcome.
We draw on our 2024 US field survey for the last two attitudes in the US panel on political attitudes. “Christian nationalism” refers to the demand that the US federal government impose Christian religious-nationalist values on US society (Djupe, Lewis, and Sokhey Reference Djupe, Lewis and Sokhey2023; Shady, Hooghe, and Marks Reference Shady, Hooghe and Marks2024; Whitehead and Perry Reference Whitehead and Perry2020). “Extralegal norms” taps a willingness to disregard the rule of law in favor of extralegal action and averages responses on two items: “A time will come when patriotic Americans have to take the law into their own hands” and “The traditional American way of life is disappearing so fast that we may have to use force to save it” (Bartels Reference Bartels2020). We find that individuals who studied a human-centered field are significantly less supportive of Christian nationalism (p < 0.00001) and of extralegal norms (p < 0.00001).
These associations are substantively large (table B.2 in the online appendix). The effect of field on support for Christian nationalism, for example, is more than half the size of the religiosity coefficient, widely seen as the predominant predictor for religious authoritarianism (Whitehead and Perry Reference Whitehead and Perry2020). Graduates of human-centered disciplines are about 19 percentage points less likely to agree that the federal government should advocate Christian values compared with those trained in material-centered fields. And they are about 12 percentage points less likely to endorse extralegal norms.
Further, we find that among college graduates the magnitude of field-based differences (panel 1 of figure 1) is comparable to the magnitude of differences associated with educational attainment (panel 2), and a formal Wald equality test indicates that the association with educational field is significantly larger than the association with educational level for ideological self-placement, redistribution, and Christian nationalism (table B.4 in the online appendix). The exception appears on immigration, where the association with educational level is larger than the association with field.
Coefficients on field are also consistently larger than those for gender (panel 3), income (panel 4), rural/urban residence, and age (tables B.1a–b and B.2 in the online appendix). Only ethnicity (for party identification and race discrimination) and religiosity (for gay marriage, ideological self-placement, and Christian nationalism) have larger coefficients.
We address potential heterogeneity across subgroups by running 64 models that regress political identity and political attitudes on the interaction between field and each of four group variables: gender (men and women), age (younger than 45 or older), religiosity (practicing at least several times a year or secular), and ethnicity (white and minority citizens). We find that in 59 of the 64 analyses, the estimated marginal association with educational field is statistically significant at the 0.05 level or stronger (tables C.1 and C.2 in the online appendix).
We now extend the analysis to 10 West European countries (see the left column of each panel in figure 1). To our knowledge, this YouGov survey is the only recent cross-national source that includes both respondents’ field of education and a broad set of political attitudes. Where available, we match attitudes examined in the US analysis. Results are reported in the first column of each panel.
The first three variables in the top left panel examine the association between human-centered field and political identity. Left/right self-identification is the standard ideological self-placement measure in Europe. Party identification is measured by asking respondents which party they feel closest to. For comparability, we locate European parties in an ideological space consisting of a sociocultural or GAL/TAN dimension and an economic left/right dimension (Kriesi et al. Reference Kriesi, Grande, Lachat, Dolezal, Bornschier and Frey2006; Marks and Steenbergen Reference Marks and Steenbergen2004).Footnote 4 Using the Chapel Hill expert survey of 2023 (Hooghe et al. Reference Hooghe, Marks, Bakker, Jolly, Polk, Rovny, Steenbergen and Vachudova2024), we assign each party a position along both dimensions. We then place respondents at the ideological coordinates of the party they feel closest to.
The results closely mirror what we observe in the US. A one-unit shift on human-centered field produces a 0.438 standard-deviation shift on left/right self-placement, a 0.321 standard-deviation shift to a GAL party, and a 0.394 shift to an economically left party. These results are substantively large: across the full range of the human-centeredness scale, the implied contrast is about 0.68 (≈ 11%) on the six-point left/right self-placement scale. Holding all other variables at their means, a person educated in a human-centered field such as the arts or humanities feels closest to a party located at 4.3 on the 11-point GAL/TAN dimension and at 4.7 on the left/right dimension. This contrasts with 5.1 on GAL/TAN and 5.5 on left/right respectively for an engineer or a business major. High and low human-centered college graduates tend to inhabit political worlds on opposing sides of the European median voter.
The effects of field on redistribution, and to a lesser extent immigration and the environment, are also highly statistically significant (H1). This aligns with research suggesting that human-centered education fosters greater moral concern for systemic inequality and individual vulnerability (Broćić and Miles Reference Broćić and Miles2021; Graham, Haidt, and Nosek Reference Graham, Haidt and Nosek2009; Guimond, Begin, and Palmer Reference Guimond, Begin and Palmer1989).
It is worth emphasizing that, as in the US, these associations are not reducible to educational attainment.Footnote 5 Level of education—whether a respondent holds a two-year college degree or an advanced graduate degree—has a smaller substantive effect than field of education for five of six outcomes, and a Wald equality test indicates that this difference in the magnitude of association is significant for ideological self-placement, left/right party identification, and redistribution (table B.4 in the online appendix). For economic left/right party identification and redistribution, the association with education operates almost entirely through field, while level is insignificant. Environmental concern is the only attitude for which level of education exhibits a larger substantive association than field of education, though the difference is not significant. In all, these findings underscore a recurring theme: if you wish to predict a person’s political identity and attitudes, the content of their education is a better guide than the duration of their education.
What are the scope conditions of field of education? A principal objective of our inquiry is to identify the political domains in which field may not structure outcomes. Attribution theory suggests that causal attribution is unlikely to be consequential for political engagement—that is, how often, how cognitively informed, or how emotionally invested a person is in politics (H2). In this domain, level of education has been shown to be influential (Apfeld et al. Reference Apfeld, Coman, Gerring and Jessee2024; see also Jensen Reference Jensen2025).
Moving to the bottom panels of figure 1, again focusing first on the US in the second column, we find no statistically significant association with field for seven engagement outcomes: political participation; political interest; political efficacy (Niemi, Craig, and Mattei Reference Niemi, Craig and Mattei1991); party affect (i.e., the extent to which someone holds a warm emotional evaluation toward their party) (Iyengar, Sood, and Lelkes Reference Iyengar, Sood and Lelkes2012); expressive partisanship (i.e., the extent to which someone is emotionally invested in their party identity) (Huddy, Mason, and Aarøe Reference Huddy, Mason and Aarøe2015); affective polarization (i.e., the tendency to view opposing partisans negatively and copartisans positively) (Iyengar et al. Reference Iyengar, Lelkes, Levendusky, Malhotra and Westwood2019); and moral disengagement (i.e., willingness to blame, harm, or vilify partisan out-groups) (Kalmoe and Mason Reference Kalmoe and Mason2022). We do find a statistically significant association for level of education on political participation (p < 0.0001) and political interest (p < 0.001), but not for any measure of emotional engagement. In Europe, no outcome reaches statistical significance at p < 0.001 or lower on either field or level (see table B.5 in the online appendix for Wald tests of equality of marginal means).
In sum, human-centeredness strongly predicts political attitudes among college graduates in both the US and Europe. The association is clearest for attitudes rooted in attributional reasoning: political identity, redistribution, and cultural views. It is more limited for political engagement, including political interest, voting, and party affect. Overall, field is related to many attitudinal outcomes among college graduates at magnitudes comparable to level of education while its relationship to political behavior is modest.Footnote 6
We now ask whether this pattern holds when we widen the comparison to include the noncollege educated.
The Field Divide and the Diploma Divide
We now broaden the scope to include individuals without a college degree. Much research on education and political behavior focuses on the “diploma divide,” which consistently finds that individuals with college degrees tend to hold more liberal political positions than those without a college degree (Apfeld et al. Reference Apfeld, Coman, Gerring and Jessee2024; Grossmann and Hopkins Reference Grossmann and Hopkins2024). Yet the previous section suggests that the college educated are not a politically homogenous group: their attitudes differ substantially, and in ways that are intelligible in terms of their field of education. This raises a clear question: how do differences within the college-educated population compare with the familiar divide between graduates and non-graduates?
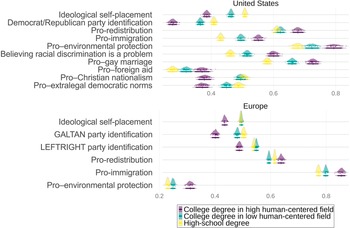
Figure 2 visualizes the average predicted values on political outcomes for three educational groups: people with a high-school degree or less (yellow), college graduates from low human-centered fields (green), and college graduates from high human-centered fields (purple).
Field of Education across Three Educational Groups
Note: Average predicted values by education group, based on bootstrapped regression estimates (one thousand resamples) from linear regressions of level/field, averaging over all other covariates according to their observed distribution in the dataset. All outcomes are rescaled from zero to one. Respondents fall in three groups: high-school degree (yellow), college degree in a low human-centered field (green), and college degree in a high human-centered field (purple). We use the emmeans package in R to compute marginal means. Intervals beneath each distribution represent the 90%, 95%, and 99% confidence intervals (table D.1 in the online appendix). Table D.2 and figure D.2 in the online appendix show that these conclusions hold when removing controls that may be endogenous to field choice (income, age, rural/urban).

Figure 2 Long description
The plot consists of two panels. The top panel is titled United States and the bottom panel is titled Europe. The X-axis represents rescaled values from 0.2 to 0.8. A legend at the bottom identifies three groups: College degree in high human-centered field (purple), College degree in low human-centered field (green), and High-school degree (yellow).
In the United States panel, ten categories are listed from top to bottom:
* Ideological self-placement: Purple is furthest left (approx. 0.38), Green in middle, Yellow furthest right (approx. 0.5).
* Democrat/Republican party identification: Purple is furthest left (approx. 0.25), Green in middle, Yellow furthest right (approx. 0.42).
* Pro-redistribution: Yellow is furthest left (approx. 0.62), Green in middle, Purple furthest right (approx. 0.7).
* Pro-immigration: Yellow is furthest left (approx. 0.45), Green in middle, Purple furthest right (approx. 0.58).
* Pro-environmental protection: Yellow is furthest left (approx. 0.68), Green in middle, Purple furthest right (approx. 0.78).
* Believing racial discrimination is a problem: Yellow is furthest left (approx. 0.48), Green in middle, Purple furthest right (approx. 0.58).
* Pro-gay marriage: Yellow is furthest left (approx. 0.58), Green in middle, Purple furthest right (approx. 0.7).
* Pro-foreign aid: Yellow is furthest left (approx. 0.25), Green in middle, Purple furthest right (approx. 0.38).
* Pro-Christian nationalism: Purple is furthest left (approx. 0.38), Green in middle, Yellow furthest right (approx. 0.5).
* Pro-extralegal democratic norms: Purple is furthest left (approx. 0.38), Green in middle, Yellow furthest right (approx. 0.48).
In the Europe panel, six categories are listed:
* Ideological self-placement: Purple is furthest left (approx. 0.42), Green and Yellow are clustered near 0.5.
* G A L T A N party identification: Purple is furthest left (approx. 0.4), Green in middle, Yellow furthest right (approx. 0.5).
* L E F T R I G H T party identification: Purple is furthest left (approx. 0.48), Green and Yellow are clustered near 0.55.
* Pro-redistribution: Green is furthest left (approx. 0.6), Yellow in middle, Purple furthest right (approx. 0.65).
* Pro-immigration: Yellow is furthest left (approx. 0.78), Green in middle, Purple furthest right (approx. 0.85).
* Pro-environmental protection: Yellow and Green are clustered left (approx. 0.22), Purple is furthest right (approx. 0.32).
With few exceptions, college graduates are more liberal: they are more supportive of gay marriage, immigration, preserving the environment, addressing race discrimination, and foreign aid, and are less willing to endorse extralegal norms. In the US, college-educated respondents also tend to self-identify more as liberal and as Democrat; in Europe, they identify more with parties that take GAL positions.Footnote 7
However, the chief takeaway from figure 2 is that this conventional divide by level of education ignores deep differences among the college educated. For almost every outcome, college graduates from high human-centered fields are more liberal, left, GAL, or Democratic than both of the other groups.Footnote 8
This contrasts with what we find for political engagement (H2), where high and low human-centered college graduates are not measurably different (figure D.3 in the online appendix). However, in the US (but not in Europe) we confirm substantively large differences between the two college groups and high schoolers for political participation, political efficacy, and political interest.
The most striking takeaway from figure 2 is the distinctiveness of college graduates in high human-centered fields.Footnote 9 They lean more liberal than their peers in low human-centered fields and more liberal than high-school graduates. In Europe, there is no statistically significant ideological or partisan difference between high schoolers and low human-centered college graduates; in the US, low human-centered college graduates are, on average, less conservative and less Republican than high schoolers, but the substantive distance with high schoolers is smaller than with high human-centered college graduates (table D.1 in the online appendix). In short, computing engineers and business graduates are closer to the political views of lower-educated voters than social scientists or teachers.Footnote 10
Together, these findings challenge a deeply entrenched assumption in political behavior research: that what is decisive about education is how long individuals attend school or college.
Income and Sex Composition as Alternative Explanations
Two plausible alternative explanations concern income and sex composition. First, the association of field and attitudes may reflect the material incentives of choosing a high- versus a low-income major (Kim, Tamborini, and Sakamoto Reference Kim, Tamborini and Sakamoto2015; Marginson Reference Marginson2019; Roksa and Levey Reference Roksa and Levey2010). Second, it may reflect the gendering of educational fields, given that some majors disproportionately attract women and that women, on average, tend to hold more liberal political orientations (Peri and Anelli Reference Peri, Anelli, Boeri, Patacchini and Peri2015; Schäfer and Steiner Reference Schäfer and Steiner2025; Van de Werfhorst Reference van de Werfhorst2017; Van Ditmars and Shorrocks Reference van Ditmars and Shorrocks2025).
We begin by testing whether the association between field and political attitudes is confounded by income, operationalized as the average income of respondents who report a degree in each specialization. We label this variable income by field to distinguish it from our standard operationalization of field as the human-centeredness of the skills conveyed in a field of study.
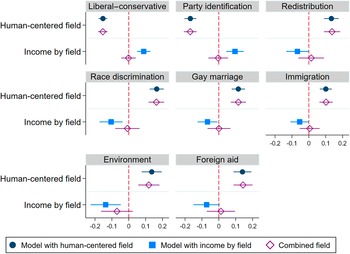
Figure 3 contrasts three models: a model with the standard human-centered field variable, a model with income by field, and a model with both variables—each under full controls. Graduates from higher-earning fields tend to be more conservative in models with only income by field (squares), and in some cases, this matches the association with human-centered field (circles). If income by field were the primary explanation for field differences, the association with income by field should be retained when both variables are included. However, in the combined model (diamonds), the association with income by field loses statistical significance while the association with human-centered field remains strong and statistically significant across political attitudes. These results suggest that the observed associations between educational field and political attitudes are not primarily accounted for by income differences across fields.
Testing Income by Field
Source: GSS (2012–22).
Note: Points show regression coefficients with 95% confidence intervals from linear models estimated on one thousand bootstrap resamples. Outcomes and predictors are rescaled from zero to one; coefficients represent the model-implied difference in the outcome between the minimum and maximum of each predictor. Circles indicate estimates from a model with human-centered field only; squares from a model with income-by-field only; diamonds from a combined model (tables F.1a and F.1b in the online appendix). All models include full controls.

Figure 3 Long description
The multi-panel plot consists of eight individual graphs arranged in three rows. The x-axis for all panels ranges from negative 0.2 to 0.2, with a dashed vertical red line at zero representing no effect. The y-axis lists two predictors: Human-centered field and Income by field. Three models are represented: dark blue circles for human-centered field only, light blue squares for income by field only, and purple diamonds for a combined model.
* Top Row: Liberal-conservative, Party identification, and Redistribution. In the first two, human-centered field shows a negative coefficient (left of zero), while income by field shows a positive coefficient (right of zero). For Redistribution, human-centered field is positive and income by field is negative.
* Middle Row: Race discrimination, Gay marriage, and Immigration. In all three, human-centered field shows a strong positive coefficient, while income by field shows a negative coefficient.
* Bottom Row: Environment and Foreign aid. Both show a positive coefficient for human-centered field and a negative coefficient for income by field.
In the combined model (purple diamonds), the effect of human-centered field generally remains significant and in the same direction as the single model, while the effect of income by field often shifts closer to the zero baseline, sometimes losing statistical significance as indicated by the horizontal confidence interval bars crossing the zero line.
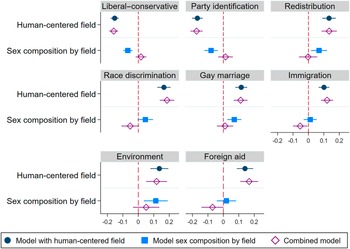
A similar logic applies to gender. Some fields such as the arts, humanities, and care professions attract more women. Could the observed association with human-centered field simply reflect the sex composition of majors?
Figure 4 addresses this possibility, again by visualizing the coefficients from three models. Women who graduated from female-dominated fields lean more liberal when only sex composition by field is included in the model (squares). However, this association becomes statistically insignificant when both sex composition and human-centered field are included, with human-centeredness remaining large and statistically robust. This pattern is consistent with the view that gender sorting across majors is not likely to account for the main results. Instead, the results align more closely with an interpretation emphasizing the content of what is taught and learned.
Testing Sex Composition by Field
Source: GSS (2012–22).
Note: Points show regression coefficients with 95% confidence intervals from linear models estimated on five hundred bootstrap resamples. Outcomes and predictors are rescaled from zero to one; coefficients represent the model-implied difference in the outcome between the minimum and maximum of each predictor. Circles indicate estimates from a model including human-centered field only; squares from a model including sex-composition-by-field only; diamonds from a combined model (tables F.2a and F.2b in the online appendix). All models include full controls.

Figure 4 Long description
A multi-panel coefficient plot with eight panels arranged in three rows. The x-axis for all panels ranges from negative 0.2 to 0.2, with a vertical dashed red line at zero. The y-axis lists two predictors: Human-centered field and Sex composition by field. Three models are compared: dark blue circles for human-centered field only, light blue squares for sex-composition-by-field only, and purple diamonds for a combined model.
* Top row panels: Liberal-conservative, Party identification, and Redistribution. In all three, the dark blue circle and purple diamond for Human-centered field are positioned to the left of zero, while the light blue square and purple diamond for Sex composition by field are near or slightly right of zero.
* Middle row panels: Race discrimination, Gay marriage, and Immigration. For these, the dark blue circle and purple diamond for Human-centered field are positioned to the right of zero. The light blue square for Sex composition by field is also to the right of zero, but the purple diamond in the combined model shifts left, crossing or touching the zero line.
* Bottom row panels: Environment and Foreign aid. In Environment, all markers are to the right of zero. In Foreign aid, the Human-centered field markers are to the right of zero, while the Sex composition markers are near zero or slightly left.
Horizontal lines through each point represent 95 percent confidence intervals. A legend at the bottom identifies the three model types.
Field of education stands out as a robust correlate of political attitudes, and its association persists after adjustment for two major covariates: income and gender. The field coefficient is therefore unlikely to be simply capturing who studies which subjects or the average earnings associated with different majors; rather, it appears to reflect systematic differences across fields in the kinds of interpretive frameworks and modes of reasoning they emphasize.
Conclusion
Across four datasets, 17 outcomes, and both sides of the Atlantic, this study documents strong and consistent evidence that the content of higher education—specifically, the human-centeredness of a field of education—is systematically associated with a wide range of political attitudes. Although our analyses are cross-sectional, they connect to longitudinal work suggesting that field of education is not a mere proxy for selection effects but can be a site of political socialization. Here, our focus is the predictive and descriptive leverage of field of study: If we know what major a person completed, how well can we predict differences in their political attitudes later in life?
While prior research has emphasized the liberalizing effect of university education, our findings suggest that it is not just the duration of education but also the kind of education that matters. Field of education and its relative emphasis on human-centered versus material-centered skills is strongly associated with attitudes on economic distribution, ideological orientation, party identity, and a range of sociocultural attitudes.
These associations are substantial. The size of field coefficients is comparable to, and in several cases larger than, that of well-established correlates of political behavior, including gender, income, rural versus urban location, and religiosity. Moreover, field is not accounted for by compositional differences in income or gender, nor is it accounted for by educational attainment. Indeed, the divide between human- and material-centered fields among the college educated is often as large as, or larger than, the gap between college graduates and those without a college degree. This finding challenges a deeply entrenched assumption in political behavior research: that education can be reduced to its extent.
Instead, our findings point toward a more differentiated theory of education that takes seriously the content of what is taught alongside the duration of exposure. Attribution theory posits that academic fields foster distinct interpretations of human motivation and responsibility. Human-centered fields are associated with more liberal views on redistribution, race, LGBTQ+ issues, immigration, the environment, and stronger support for a secular state and the rule of law. Material-centered fields, by contrast, are associated with a more individualistic and instrumental cognitive style and more conservative positions on those same issues.
At the same time, field theory specifies limits to its reach. While educational content aligns with a wide range of attitudes, it is not consistently associated with political engagement, affective attachment to parties, or moral polarization. These outcomes reflect “what now?” decisions—whether to act, participate, invest attention, or express partisan passion—rather than the “why?” questions most directly related to attributional reasoning.
The implications are far reaching. Human-centered academic disciplines have become politically contested and public funding for the humanities and social sciences is increasingly under scrutiny. If what students study is systematically related to their worldview, then curricular decisions and funding allocations are far from politically neutral. Efforts to restrict or defund certain disciplines may be motivated as much by political calculus as by labor market considerations. As higher education becomes a site of cultural and partisan conflict, the content of academic training and who controls it may become a lightning rod in democratic contestation (Neundorf et al. Reference Neundorf, Nazrullaeva, Northmore-Ball, Tertytchnaya and Kim2024).Footnote 11
In short, political scientists cannot afford to treat education as a black box. What people study matters, not just for labor market outcomes but also for the democratic health of societies. Educational field theory offers a framework for understanding how political attitudes develop over a person’s life, and at the aggregate level, how political cleavages are formed, reinforced, and contested.
Supplementary material
To view supplementary material for this article, please visit http://doi.org/10.1017/S1537592726104824.
Data replication
Data replication sets are available in Harvard Dataverse at: https://doi.org/10.7910/DVN/FOZGGB.


 Open access

