

INTRODUCTION AND RATIONALE
The occurrence of large slabs of bedrock and coherent sediment intraclasts in glacigenic stratigraphic sequences has long been widely recognised and linked to the glacitectonic process of raft detachment, facilitated by displacement along décollement zones in horizontally bedded strata (e.g., Christiansen, Reference Christiansen1971; Moran, Reference Moran and Goldthwaite1971; Ruszczynska-Szenajch, Reference Ruszczynska-Szenajch1976, Reference Ruszczynska-Szenajch1987; Stalker, Reference Stalker1973, Reference Stalker1976; Ringberg et al., Reference Ringberg, Holland and Miller1984; Christiansen and Sauer, Reference Christiansen and Sauer1988; Aber et al., Reference Aber, Croot and Fenton1989; Hopson, Reference Hopson1995; Aber and Ber, Reference Aber, Ber, Aber and Ber2007; Burke et al., Reference Burke, Phillips, Lee and Wilkinson2009; Evans et al., Reference Evans, Hiemstra, Boston, Leighton, Ó Cofaigh and Rea2012; Sigfusdottir et al., Reference Sigfusdottir, Benediktsson and Phillips2018; Fig. 1). Glacitectonic rafts, as defined by Aber et al. (Reference Aber, Croot and Fenton1989), are broadly defined as megablocks/rafts of up to 30 m high and 1000 km2 in area. The proposal by Moran et al. (Reference Moran, Clayton, Hooke, Fenton and Andriashek1980) that such rafts were displaced and transported subglacially, especially in the submarginal, frozen bed zone implies that some mechanism of incorporation into the basal transport (shear) zone was in operation (e.g., Vaughan-Hirsch et al., Reference Vaughan-Hirsch, Phillips, Lee and Hart2013) and that upwards thrusting of the detached raft was driven by compressive ice flow (Clayton and Moran, Reference Clayton, Moran and Coates1974; Bluemle and Clayton, Reference Bluemle and Clayton1984). Deep-seated deformation and liberation of bedrock rafts in association with pressurised aquifers has been widely proposed as the likely mechanism of such subglacial raft origins (cf. Moran et al., Reference Moran, Clayton, Hooke, Fenton and Andriashek1980; Bluemle and Clayton, Reference Bluemle and Clayton1984), and responsible for the propagation of basal detachments in glacitectonic thrust complexes (e.g., Phillips et al., Reference Phillips, Cotterill, Johnson, Crombie, James, Carr and Ruiter2017a, Reference Phillips, Evans, Atkinson and Kendall2017b; Vaughan-Hirsch and Phillips, Reference Vaughan-Hirsch and Phillips2017). Their subsequent incorporation into the deforming layer via “cannibalisation” (Hicock and Dreimanis, Reference Hicock and Dreimanis1992a, Reference Hicock, Dreimanis, Clark and Lea1992b) initiates the sedimentologic process continuum from glacitectonite to pseudo-laminated diamicton and ultimately to subglacial till via gradual homogenisation (Benn and Evans, Reference Benn and Evans1996, Reference Benn and Evans1998, Reference Benn and Evans2010; Boulton et al., Reference Boulton, Dobbie and Zatsepin2001; Evans, Reference Evans2018). The glaciological community has recently recognised the potential for basal freeze-on to occur at the till interface beneath modern Antarctic ice streams, particularly during quiescent phases between fast-flow events (cf. Iverson, Reference Iverson2000; Bougamont et al., Reference Bougamont, Tulaczyk and Joughin2003a, Reference Bougamont, Tulaczyk and Joughin2003b; Christoffersen and Tulaczyk, Reference Christoffersen and Tulaczyk2003a, Reference Christoffersen and Tulaczyk2003b; Vogel et al., Reference Vogel, Tulaczyk and Joughin2003; Christoffersen et al., Reference Christoffersen, Tulaczyk, Carsey and Behar2006), which may represent an additional mechanism for the liberation of rafts beneath former ice sheets. Once incorporated into the ice sheet traction zone, the form and dimensions of rafts will be modified at a rate that is conditioned by the stage of glaciation at which they were detached. Hence, features created by late-stage detachment are often recognisable as clear surface manifestations similar to hill-hole pairs (Bluemle and Clayton, Reference Bluemle and Clayton1984) or slightly more streamlined cupola hills (Aber et al., Reference Aber, Croot and Fenton1989; Evans et al., Reference Evans, Young and Cofaigh2014; Phillips et al., Reference Phillips, Evans, Atkinson and Kendall2017b); in contrast, more modified forms are mostly recognised as bedrock intraclasts in till sequences (Stalker, Reference Stalker1973, Reference Stalker1976; Andriashek and Fenton, Reference Andriashek and Fenton1989).
Examples of bedrock rafts and likely associated landforms from the Canadian prairie region of soft bedrock: (a) schematic diagram of raft detachment (after Benn and Evans, Reference Benn and Evans2010); (b) a deformed raft of the late Cretaceous Foremost Formation in glacigenic sequence near Bow Island, southern Alberta; (c) the “Laundry Hill erratic” (Stalker and Barendregt, Reference Stalker and Barendregt1988), composed of fragmented Cretaceous bedrock slabs (yellow arrows) in a thick till sequence, Lethbridge, Alberta (cf. Evans et al., Reference Evans, Hiemstra, Boston, Leighton, Ó Cofaigh and Rea2012); (d) sketch of Stalker's (Reference Stalker1973) “murdlin” based on examples near Drumheller, central Alberta; (e) LiDAR image showing tabular-shaped raft north of Irma, central Alberta (Evans et al., Reference Evans, Atkinson and Phillips2020); (f) LiDAR image showing conical-shaped raft north of Battle River, central Alberta (Evans et al., Reference Evans, Atkinson and Phillips2020). (For interpretation of the references to color in this figure legend, the reader is referred to the web version of this article.)
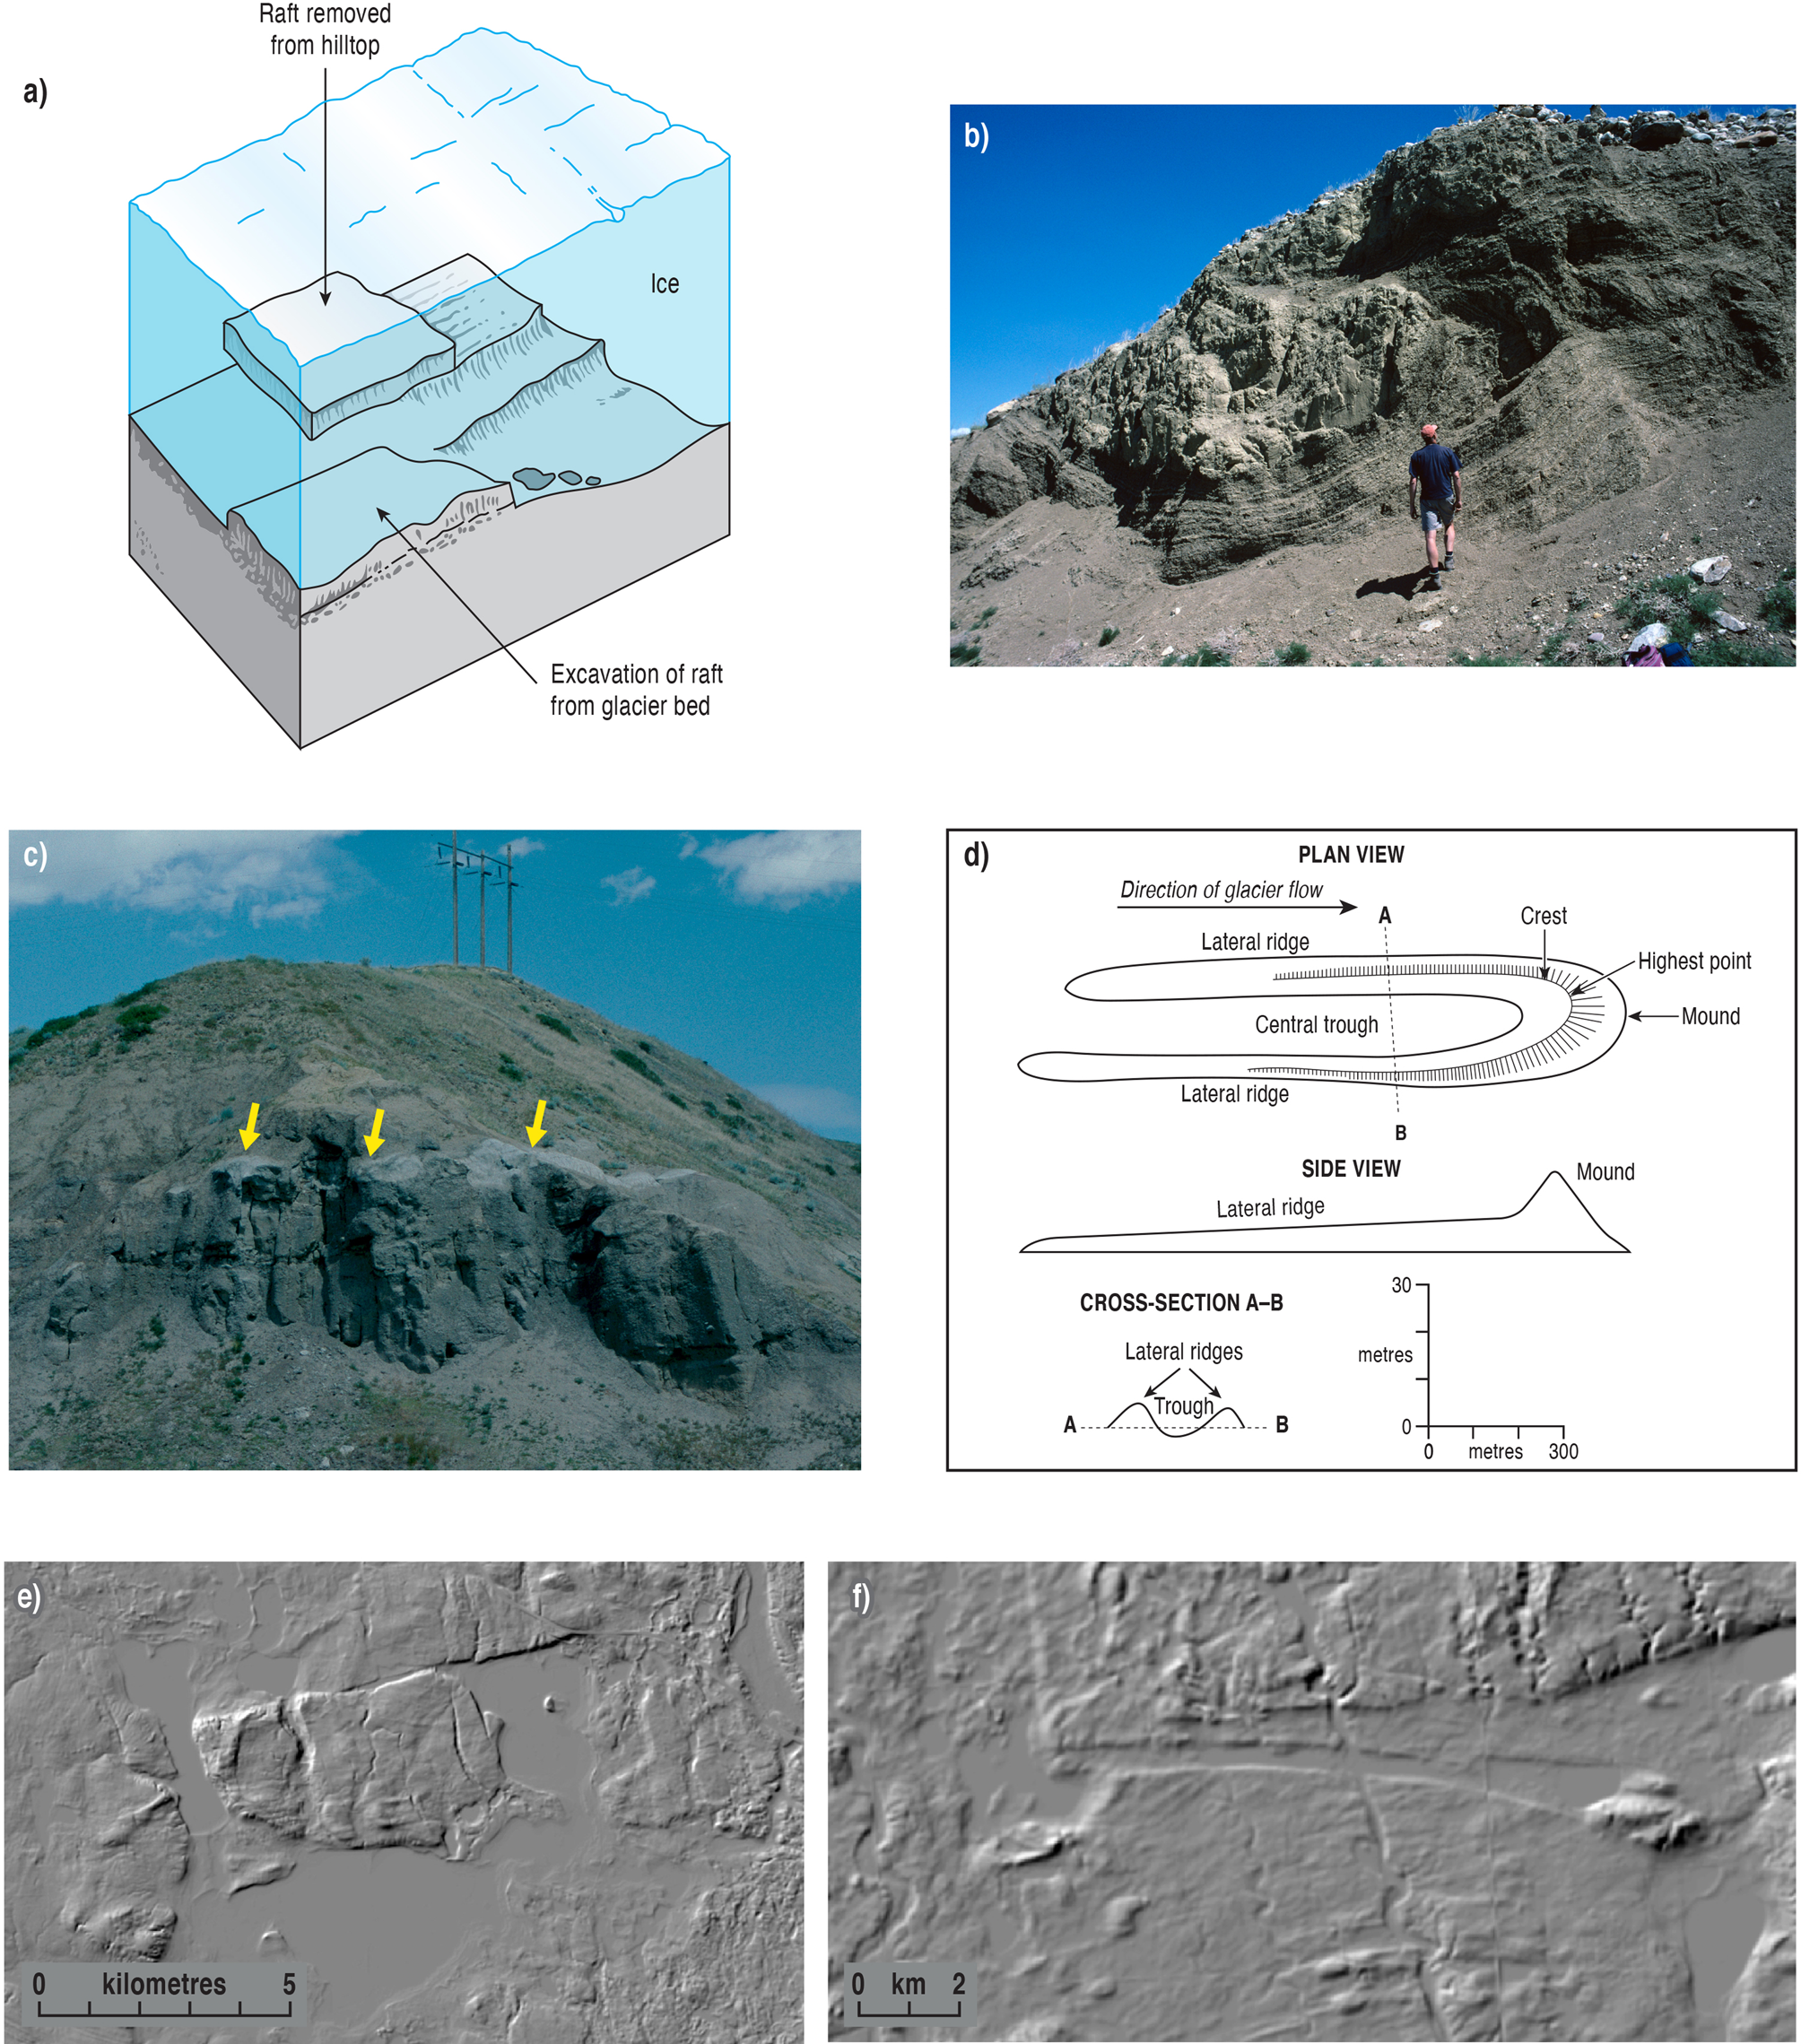
Consequently, glacitectonic raft production is critical to both ice-marginal and subglacial landform development, as well as the generation of subglacially deformed materials over large areas of former ice sheet beds, particularly where soft, sedimentary substrata predominate, for example, across the Western Canada Sedimentary Basin, at the western margins of the Laurentide Ice Sheet (Stalker, Reference Stalker1973, Reference Stalker1976; Bluemle and Clayton, Reference Bluemle and Clayton1984; Andriashek and Fenton, Reference Andriashek and Fenton1989). Thrust masses located at the stoss ends of megaflutings and megascale glacial lineations (MSGLs) prompt comparisons with the lodged stoss boulders that are critical to the production of minor flutings (e.g., Boulton, Reference Boulton1976; Rose, Reference Rose1989; Benn, Reference Benn1994; Evans et al., Reference Evans, Nelson and Webb2010, Reference Evans, Roberts, Hiemstra, Nye, Wright and Steer2018; Eyles et al., Reference Eyles, Boyce and Putkinen2015; Evans, Reference Evans2018). The absence of stoss initiators at both scales has been explained by erosional groove ploughing (e.g., Baligh Reference Baligh1972; Boulton, Reference Boulton, Wright and Moseley1975, Reference Boulton1976, Reference Boulton, Davidson-Arnott, Nickling and Fahey1982; Boulton et al., Reference Boulton, Morris, Armstrong and Thomas1979; Tulaczyk, Reference Tulaczyk1999; Fischer et al., Reference Fischer, Porter, Schuler, Evans and Gudmundsson2001). Indeed, clast ploughing is clearly manifest by frontal sediment prows within fields of minor flutings, where clasts had only just made contact with the bed or their momentum had been arrested by frictional retardation just before ice flow ceased (e.g., Boulton, Reference Boulton, Davidson-Arnott, Nickling and Fahey1982; Benn, Reference Benn1994; Evans and Rea, Reference Evans, Rea and Evans2003; Eyles et al., Reference Eyles, Boyce and Putkinen2015; Evans et al., Reference Evans, Roberts, Hiemstra, Nye, Wright and Steer2018). This “excavational” scenario in subglacial deforming materials (cf. Hart, Reference Hart1997) is the “erodent layer” of Eyles et al. (Reference Eyles, Putkinen, Sookhan and Arbelaez-Moreno2016), wherein the “erodents” are ploughing clasts. At these scales, the early stages of such processes are evident in the form of ice-pushed flutes, ploughed grooves, or frontal sediment prows, some of which exhibit the lodged boulder still in place (cf. Eyles et al., Reference Eyles, Boyce and Putkinen2015; Evans et al., Reference Evans, Roberts, Hiemstra, Nye, Wright and Steer2018). But do such features also occur at larger scales and hence potentially relate to the ploughing of glacitectonic rafts? An interesting observation by Stalker (Reference Stalker1973) of a feature he described as a “murdlin” (Fig. 1d), and resembling a megascale ploughed groove, indicates that they do.
Groove ploughing was applied to MSGLs by Tulaczyk et al. (Reference Tulaczyk, Scherer and Clark2001) and Clark et al. (Reference Clark, Tulaczyk, Stokes and Canals2003), who invoked subglacial erosion by a sliding, bumpy glacier sole, such that ploughing took place via till deformation around ice keels as they were dragged through the substrate. Hence, initiator clasts or rafts would not necessarily be expected to lie on (erosional) or within (lee-side infilling) the MSGL. However, the tendency for flutings and MSGLs to maintain their cross-profile shapes for tens of kilometres, which would be unlikely for a relatively low-yield stress material such as ice, is problematic in the ice keel groove-ploughing model. Large-scale groove ploughing, described in the megafluting complexes of the Central Alberta Ice Stream (CAIS; Evans, Reference Evans1996), often initiates at thrust bedrock masses but appears as flat-bottomed grooves across an otherwise accordant surface. This suggests that once the rafts were displaced from the parent thrust masses, they behaved as erodents during their progressive disaggregation in a down-ice direction.
Based upon the previous discussion, the aims of this paper are to evaluate the role of sedimentary bedrock and composite bedrock–sediment rafts in the production of submarginal to subglacial landforms and sequences of fine-grained tills and glacitectonites. First, if rafts are critical to the development of subglacial bedforms and their production results in the antecedent conditions required for streamlining bed obstacles (converse to bedform production via till instability; sensu Dunlop et al., Reference Dunlop, Clark and Hindmarsh2008; Stokes et al., Reference Stokes, Fowler, Clark, Hindmarsh and Spagnolo2013; Fowler and Chapwanya, Reference Fowler and Chapwanya2014), then they should be visible on ice sheet beds in a variety of forms that reflect an ergodic spatiotemporal continuum using “location-for-time reasoning” (cf. “relaxation time” model of Brunsden and Thornes, Reference Brunsden and Thornes1979; cf. Paine, Reference Paine1985). Second, if rafts do indeed behave as erodents, then they are critical components of the ice–bed interface, effectively operating as a fault gouge (Eyles and Boyce, Reference Eyles and Boyce1998; Tulaczyk et al., Reference Tulaczyk, Scherer and Clark2001), thereby representing asperities in the fault plate that plough through the soft substrate, generating and replenishing the deforming till layer or the fault gouge layer above the underlying, rigid strata or the lower fault plate. This ploughing model appears to be fundamental to till continuity (Alley, Reference Alley, Maltman, Hubbard and Hambrey2000; Iverson, Reference Iverson2010) for several reasons. First, no sediment input is necessary from the glacier base. Second, it provides an explanation for substrate deformation and streamlining of pre-existing sediments and thereby also the creation and/or replenishment of subglacial deforming layers. Finally, till units of relatively uniform thickness can be explained as a product of the operation of a stabilising feedback. This operates in a thickening till when increasingly fewer asperities can penetrate through it to the underlying substrate, thereby arresting and ultimately terminating the thickening rate; till thinning, on the other hand, allows more ice bumps to protrude into the substrate, in turn generating more till.
Because the ploughing mechanism also appears fundamental to the production of erosional flutes on modern glacier forelands, where boulders are dragged through subglacial deforming layer tills (cf. Boulton, Reference Boulton, Wright and Moseley1975, Reference Boulton1976, Reference Boulton, Davidson-Arnott, Nickling and Fahey1982; Eyles et al., Reference Eyles, Boyce and Putkinen2015; Evans, Reference Evans2018; Evans et al., Reference Evans, Roberts, Hiemstra, Nye, Wright and Steer2018), we here evaluate the potential for rafts to initiate large-scale flutings and MSGLs. Proof of the operation of substrate ploughing by rafts to produce MSGLs lies in the discovery of rafts at various stages of displacement and incorporation into former subglacial deforming layers, including their association with prows (murdlins) and grooves as well as obvious initiator source depressions. A sedimentologic signature of former large-scale ploughing should also be encoded into landforms that appear to have been streamlined by erodent rafts, and hence we provide some diagnostic characteristics of such a process-form regime.
STUDY AREA AND METHODS
The province of Alberta, with its widespread glacitectonic structures (cf. Stalker, Reference Stalker1973, Reference Stalker1975, Reference Stalker1976; Moran et al., Reference Moran, Clayton, Hooke, Fenton and Andriashek1980; Stalker and Barendregt, Reference Stalker and Barendregt1988; Aber et al., Reference Aber, Croot and Fenton1989; Evans et al., Reference Evans, Clark and Rea2008, Reference Evans, Hiemstra, Boston, Leighton, Ó Cofaigh and Rea2012), is the ideal region to investigate the nature and implications of glacitectonic rafts (Fig. 2). The concentration of large-scale glacitectonic disturbance at the margins of preglacial valleys (Tsui et al., Reference Tsui, Cruden and Thomson1989) and the widespread occurrence of displaced bedrock within the infill sequences of such valleys (Andriashek and Fenton, Reference Andriashek and Fenton1989) indicate that they were critical to raft detachment during glaciation. The recent acquisition of light detection and ranging (LiDAR) data for the province of Alberta has enabled the study of glacial landforms, including rafts, at very high resolution and the identification of a range of glacitectonic structures, many for the first time (Atkinson et al., Reference Atkinson, Utting and Pawley2018; Evans et al., Reference Evans, Atkinson and Phillips2020). This facilitates a more comprehensive assessment of the number and extent of such features as well as their role in the genesis of subglacial landform and sediment assemblages in soft-bedded terrain.
(color online) Location maps/digital elevation models of Alberta, western Canada, and the sites reported in this study: (a) Province of Alberta with major rivers, major cities, and relevant place names, together with the outlines of the major palaeo–ice stream footprints. HPIS, High Plains; CAIS, Central Alberta; LLBIS, Lac la Biche; SIS, Seibert. The two study areas of this paper are outlined by black boxes. (b) Enlargements of the two study areas outlined by black boxes in a, showing major rivers, lakes, and settlements and outlines of areas in later figures.
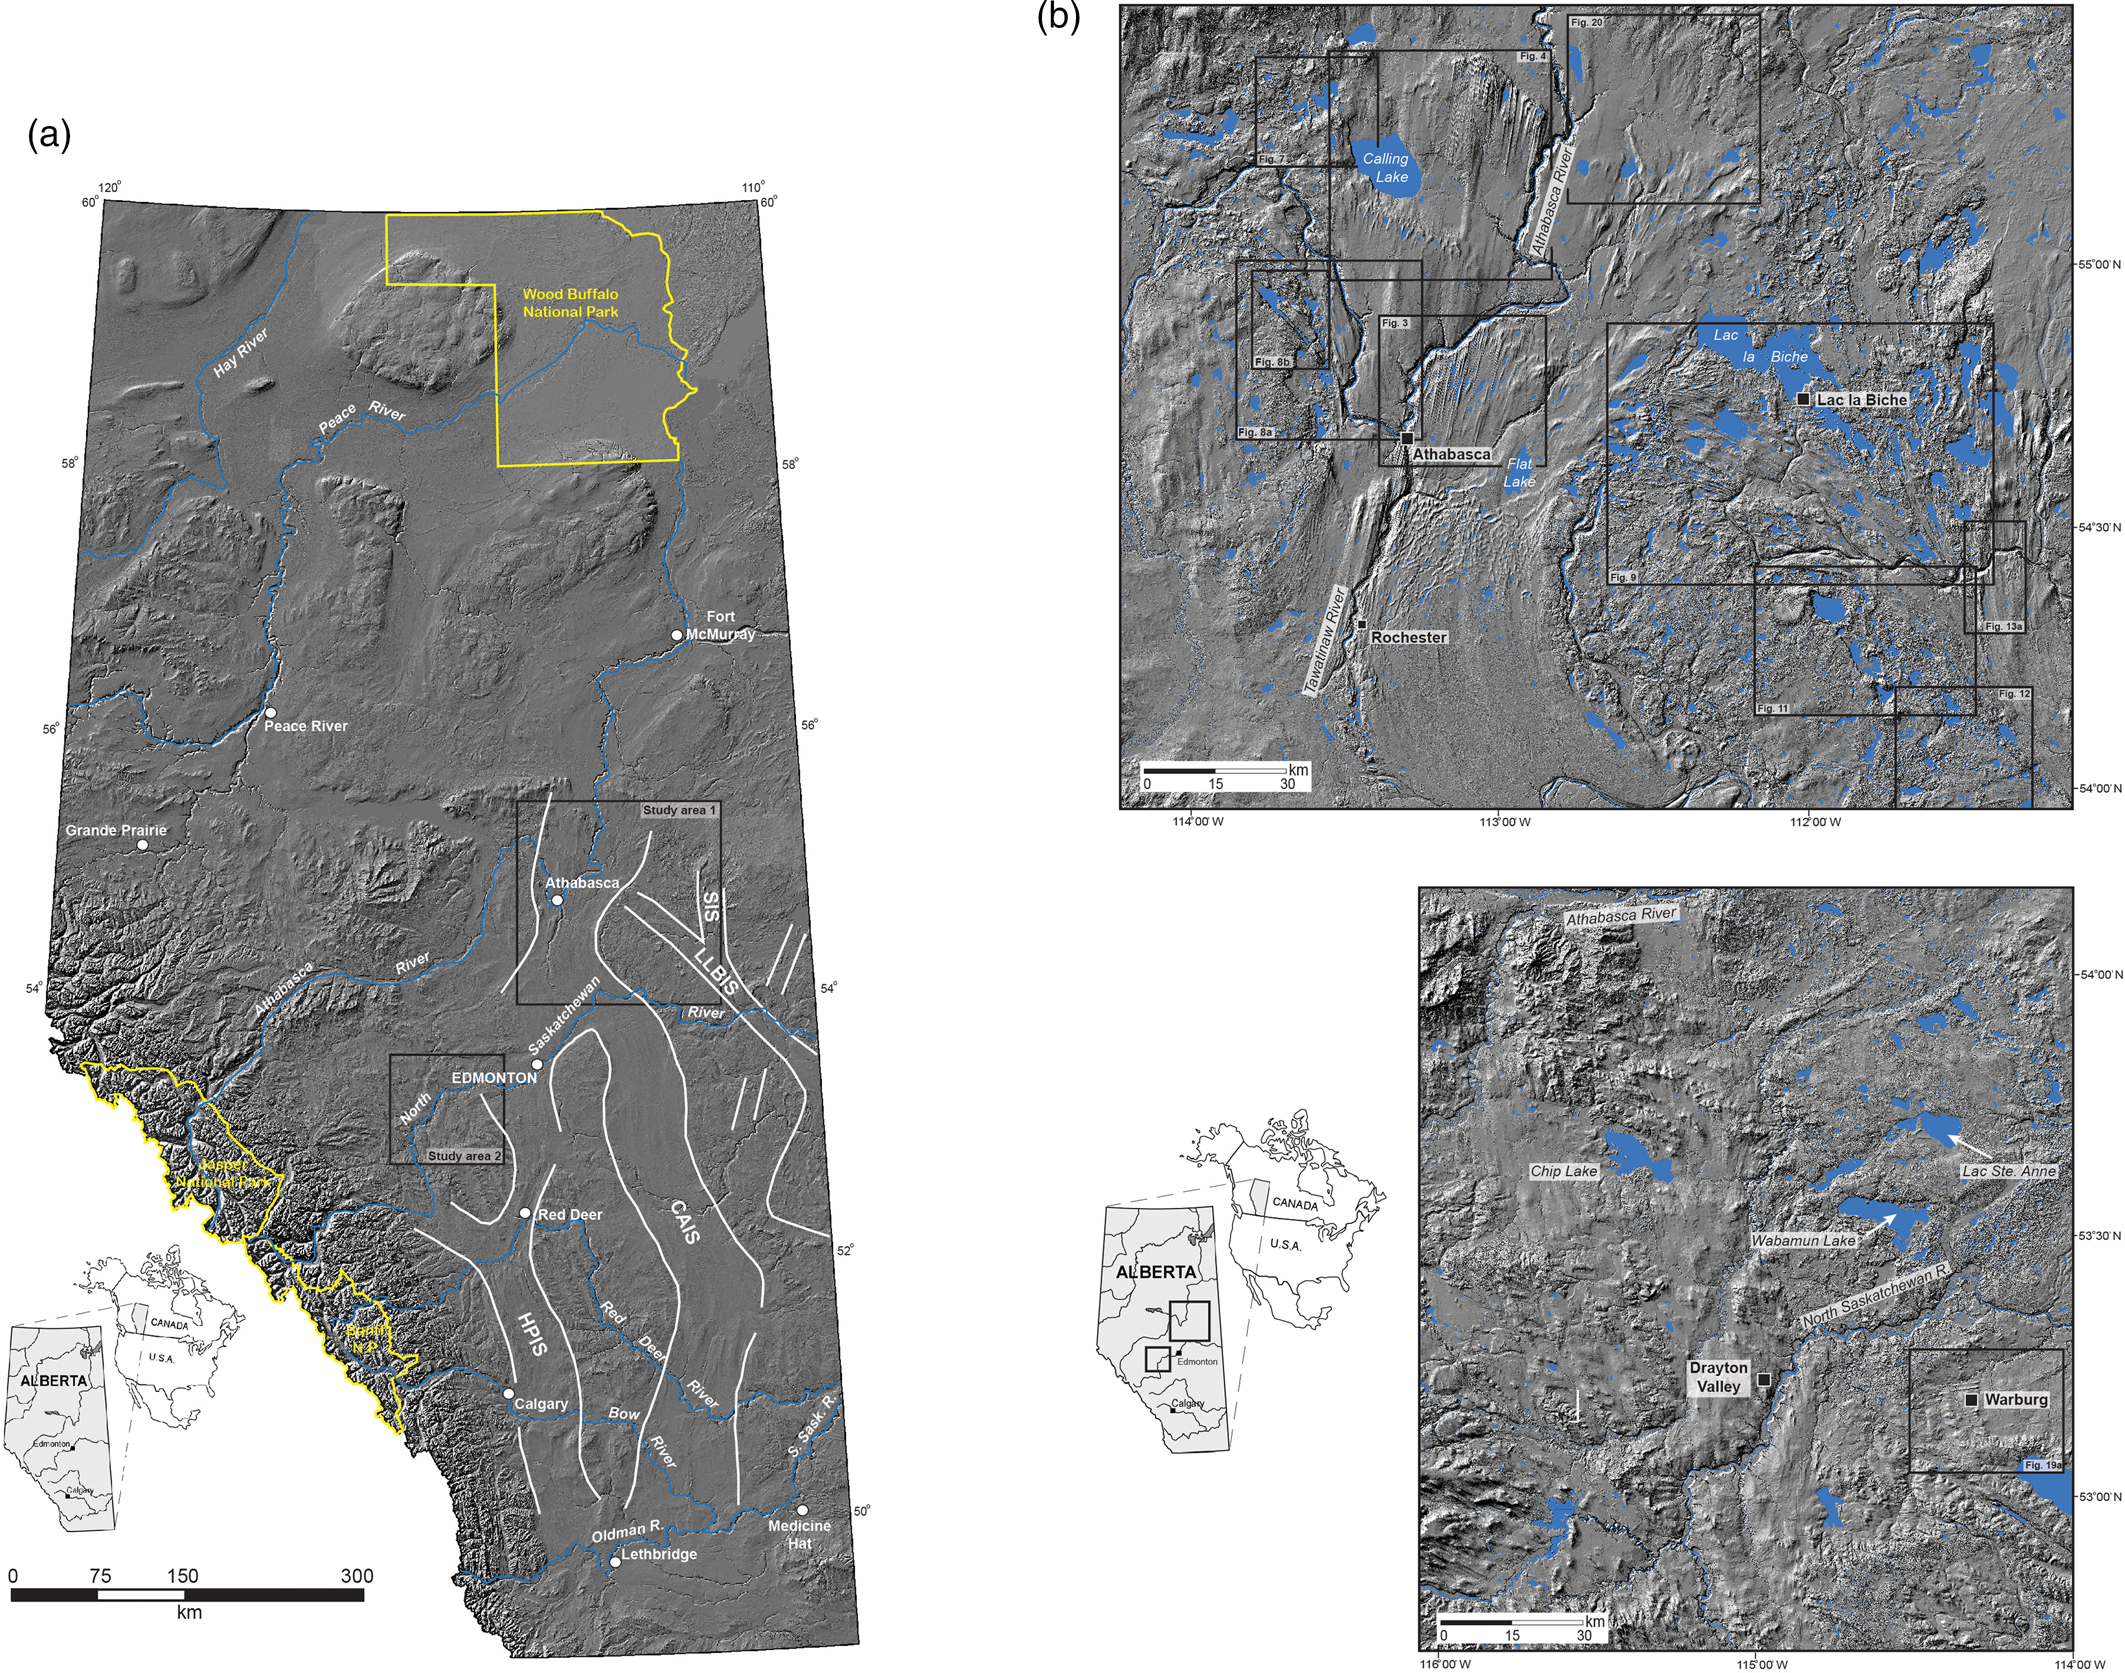
The geomorphology of individual study areas in east-central and west-central Alberta (Fig. 2) was captured and annotated on imagery derived from a 15 m LiDAR bare-earth digital elevation model (DEM). This involved the identification of features using first their nongenetic, morphometric characteristics, followed by the assignment of genetic classifications. The stratigraphy and sedimentology of the landforms were investigated wherever exposures were available, and these were recorded in scaled section sketches that included primary sedimentary structures, bed contacts, sediment body geometry, sorting and texture, and any pertinent data on clast macrofabric. These data were then used to characterize lithofacies types and to allocate facies codes following the procedures of Evans and Benn (Reference Evans, Benn, Evans and Benn2004). Clast macrofabrics were measured on samples of 30 or 50 clasts from diamictons using A-axis orientation and dip and plotted on Schmidt equal-area lower-hemisphere diagrams using Rockworks™.
The glacitectonic deformation of the sediments and bedrock rafts, where exposed, has been investigated using a range of macroscale techniques. Sections through the rafts were described based on their macroscale features, particularly lithology, type of bedding, bed geometry, and structure (both sedimentary and glacitectonic). The orientations of folds, foliations, and faults, as well as bedding, were recorded at a number of localities and plotted on a series of lower-hemisphere stereographic projections (dip and dip-direction/azimuth) using the StereoStat software (Rockworks). The sense of asymmetry of folds and movement on the faults and interrelationships between the various generations of structures were established. Successive generations of structures are distinguished using the nomenclature normally used in structural geologic studies (e.g., folds: F1, earliest folds, to Fn, latest). However, this nomenclature does not necessarily imply that these structures evolved during separate deformation events (D1, D2, … Dn). A series of overlapping photographs taken of the exposed sections containing the rafts has enabled the analysis of the larger-scale structures, providing valuable insights into the internal structural architecture and disaggregation of these transported bedrock blocks.
GEOMORPHOLOGY AND SEDIMENTOLOGY OF ALBERTA CASE STUDIES
We now present the landform, sedimentary, and structural descriptions and interpretations of 10 sites from around central Alberta (Fig. 2) before discussing their implications for the development of rafts and their impacts on subglacial deforming beds beneath the palaeo–ice streams of the SW Laurentide Ice Sheet. These landform–sediment associations record the operation of the northern end of the CAIS (cf. Evans et al., Reference Evans, Clark and Rea2008) and its tributaries, the onset zones of the Lac la Biche Ice Stream (Andriashek and Fenton, Reference Andriashek and Fenton1989) that migrated westward into the head of the CAIS during Event 2 of Ó Cofaigh et al. (Reference Cofaigh, Evans and Smith2010) and Norris et al. (Reference Norris, Evans and Cofaigh2018), and the High Plains Ice Stream (HPIS) and its northern tributaries (Evans et al., Reference Evans, Clark and Rea2008, Reference Evans, Young and Cofaigh2014; Ó Cofaigh et al., Reference Cofaigh, Evans and Smith2010; Atkinson et al., Reference Atkinson, Utting and Pawley2014; Utting et al., Reference Utting, Atkinson, Pawley and Livingstone2016).
Athabasca River lowlands area
A 110-km-long, NNE-SSW aligned corridor of highly elongate subglacial bedforms (megaflutings), parallels the axis of the Tawatinaw and Athabasca Rivers, north of Rochester (study area 1, Fig. 2). Described by Richard (Reference Richard1979, Reference Richard1986, Reference Richard1987) as “drumlins, drumlinoids, flutings, grooves and furrows,” these landforms record vigorous ice flow along the northernmost CAIS (Evans et al., Reference Evans, Clark and Rea2008; cf. Margold et al., Reference Margold, Stokes and Clark2015a, Reference Margold, Stokes, Clark and Kleman2015b, Reference Margold, Stokes and Clark2018). In detail (Fig. 3), they are discontinuous features, locally superimposed upon a number of largely elongate and smoothed mounds that extend obliquely to the main megafluting direction. The megaflutings display highly variable spacing, lengths, and widths. Plan forms also vary, with some comprising wider stoss- and tapering lee-ends but most displaying tapering stoss- and lee-ends typical of spindle drumlins (cf. Gluckert, Reference Gluckert1973; Shaw, Reference Shaw1983). Some features also display multiple flow-parallel ridges and/or summit grooves, and in places densely spaced lineations give the appearance of ridges and grooves of similar amplitudes. Large blocks (rafts) occur either in areas between ridges or embedded in the stoss-ends; in at least one case, elongate mounds (likely rafts) within partially grooved drumlins lie downflow of elongate depressions (Fig. 3, insets). North of the Athabasca townsite, megaflutings reported by Shaw et al. (Reference Shaw, Faragini, Kvill and Rains2000) clearly initiate at a scarp, in this case the margin of the modern Athabasca River valley. This relationship indicates that the megaflutings are genetically related to the scarp, which predates these streamlined landforms and hence potentially represents an incipient palaeo-valley margin within the vicinity of the ancestral Athabasca River (Fig. 3).
(color online) Annotated LiDAR digital elevation model (top) and geomorphology map (bottom) of the megafluting field located near the Athabasca townsite, showing the locations of exposures studied as well as that of Shaw et al. (Reference Shaw, Faragini, Kvill and Rains2000).

Other examples of megaflutings initiating at scarps (either along valley margins or the edges of uplands) occur around the Athabasca townsite (Fig. 3) and on the south shore of Calling Lake, 25 km northeast (Fig. 4). Indeed, such scarp-fluting associations are very common in the region, particularly in areas where bedrock occurs at, or close to, the modern land surface (Atkinson et al., Reference Atkinson, Pawley, Andriashek, Hartman, Utting and Atkinson2020), and hence we propose the term “initiator scarp” to describe such occurrences. Many megaflutings do not initiate directly at the scarp but rather at various distances down-ice, where they often appear to have conical or spindle-shaped stoss-ends and taper southwards (stoss-and-lee flutings/drumlins). Also apparent are flat-floored grooves separating flat-topped ridges, the latter locally exhibiting grooved summits. Northeast of Calling Lake, the width and amplitude of all of the megafluting ridges decrease over a distance of 25 km, where they merge into tracts of prairie mounds and/or doughnuts and other low-amplitude hummocks (Figs. 3 and 4). Ridge widths also tend to alternately widen and narrow, and many groove floors undulate due to the occurrence of chains of straight-sided depressions (Fig. 4). At south Calling Lake, the initiator scarp has been heavily subglacially moulded to form a band of short drumlins with surface ridge and groove patterns and interspersed flutings (Fig. 4). Drumlins generally taper out/flatten over 3 km, with overall streamlining (fluting) disappearing ca. 8 km downflow of the scarp. Many drumlins appear rectilinear at their stoss-ends, hence their tendency to flatten in long profile rather than taper in plan form, potentially indicative of raft cores.
(color online) Annotated LiDAR digital elevation model of megafluting fields, drumlins, and initiator scarps near Calling Lake. The Google Earth image (inset) shows an enlarged area of the western flutings and illustrates examples of the chains of straight-sided depressions in the flat-floored grooves.

The complex sedimentology of the megaflutings was reported by Shaw et al. (Reference Shaw, Faragini, Kvill and Rains2000) based on exposures through the Schiller site, north of Athabasca town (Figs. 3 and 5). The main lithofacies were described as: (1) a mélange, comprising sand and gravel intrabeds within a matrix of fine-grained diamicton; and (2) interbedded deposits, characterised by diamicton and plane-bedded and cross-laminated sorted sediments. Glacitectonic structures included widespread folding, localised but densely spaced normal faults, and diapiric or injection features. Clast macrofabrics from the diamictons revealed a wide range of orientations with weak to moderately strong S1 eigenvalues (0.44–0.71; see Fig. 5), although two broad alignments are visible at N-S and W-E. Overall, Shaw et al. (Reference Shaw, Faragini, Kvill and Rains2000) considered a diapiric mélange rather than shear zone mélange (sensu Orange, Reference Orange1990) origin for these sediments and consequently dismissed megafluting production by subglacial deformation, preferring instead an erosional origin due to subglacial megaflooding. Additionally, the initiation of the megaflutings at an upflow-facing bedrock escarpment was explained as the product of longitudinal vortices being generated at this escarpment to form high-velocity, eroding streaks in subglacial sheet flows. The widespread deformation was interpreted as a product of the gradients generated between highly pressurised groundwater and low-pressure subglacial cavities.
Sketch of sedimentary structures and clast macrofabric data (including one palaeocurrent sample from the sands) at Schiller excavation site (modified after Shaw et al., Reference Shaw, Faragini, Kvill and Rains2000).

New exposures through a fluting ridge south of the Athabasca townsite (Fig. 3) provide further ridge-parallel and ridge-transverse sections displaying complexly deformed diamictons and stratified sediments and mélange. This tripartite sequence (Fig. 6) comprises a lower pseudo-stratified, clay-rich diamicton (LF1); a middle gravel-rich, sandy diamicton containing irregular, deformed lenses of silt/clay diamicton (LF2); and an upper massive, matrix-supported diamicton (Dmm; LF3).
(color online) Details of the south Athabasca townsite section in the megafluting complex. (a and b) The main section face orientated parallel to the fluting long axis; (c) the exposure orientated oblique to fluting long axis with associated clast macrofabrics. Dmm–massive, matrix-supported diamicton. MLA–mean lineation azimuth.

In detail, LF1 characterises as a Type I/II mélange (sensu Cowan, Reference Cowan1985; cf. Evans, Reference Evans2018), wherein deformed intraclasts of stratified sand and gravel within a clay-rich diamicton have been highly folded and thrust. Also apparent are irregular, highly deformed rafts of lower Cretaceous sandstone, the closest available outcrops of which occur ~100 km to the north (Pelican Formation; Prior et al., Reference Prior, Hathway, Glombick, Pana, Banks, Hay, Schneider, Grobe, Elgr and Weiss2013). The numerous intraclasts/rafts give the impression of pseudo-stratification in a diamictic mélange. The geometry of the thrusts and asymmetrical folds record a sense of shear towards the S/SE, consistent with an applied stress direction from the N/NW (Fig. 6b). Towards the top of LF1, forming a ≤0.30-m-thick deformed contact with overlying LF2, is a zone of more attenuated lenses and recumbent rootless folds more similar to a Type IV mélange (sensu Cowan, Reference Cowan1985; cf. Evans, Reference Evans2018). The diamicton of LF2 has a coarser sand/gravel matrix and contains deformed intraclasts of poorly sorted cobble to pebble gravel as well as clayey/silty diamicton similar to the matrix of underlying LF1 (Type II/III mélange). A clast macrofabric from LF2 displays a moderately strong (S1 = 0.65; Fig. 6c), WNW-ESE clast alignment towards 120°. This mélange (LF2) is unconformably overlain by LF3 (Dmm), the contact and outcrop of which is well exposed in upper sections along the sides of a track cut oblique to the main face. The Dmm is ≤1 m thick, compact, and locally fissile, with a moderately strong (S1 = 0.58) clast macrofabric orientated 353° (Fig. 6c). The two general alignments of the LF2 and LF3 macrofabrics replicate most of the data presented by Shaw et al. (Reference Shaw, Faragini, Kvill and Rains2000), with broadly N-S alignments matching the NNE-SSW orientation of the megaflutings, and the broadly W-E alignments representing fluting-transverse signatures (cf. Figs. 3, 4, and 6c).
Contrary to the genesis proposed by Shaw et al. (Reference Shaw, Faragini, Kvill and Rains2000), we advocate a raft-ploughing origin for the Athabasca megaflutings. At sites bordering the Athabasca River valley in particular (Figs. 3, 5, and 6), this is consistent with both: (1) the landforms, specifically the close association of initiator scarps, rafts, elongate hill-hole pairs, and stoss-and-lee flutings with rectilinear stoss bumps; and (2) the internal sedimentology, comprising mélanges of fragmented bedrock and glacigenic sediments representative of a vertical continuum from Type A to Type B glacitectonites (sensu Benn and Evans, Reference Benn and Evans1996; Evans et al., Reference Evans, Phillips, Hiemstra and Auton2006; Evans, Reference Evans2018) capped by a more homogenised Dmm or subglacial traction till. Deformation of this sequence was initially driven by ice advancing from the northwest, leading to the construction of a series of ice flow-transverse ridges (likely thrust ridges) that were subsequently overridden to form the NE-SW aligned streamlined hills. These ridges were then ploughed obliquely by erodent rafts detached from the initiator scarps, giving rise to increasingly intense glacitectonite production and homogenisation to create the streamlined till carapace beneath the southward-flowing ice stream. A clear pattern of downflow dissipation of glacial bedforms represents raft fragmentation and the propagation of lee-side till deformation. Also important are the chains of straight-sided depressions in the flat-floored grooves (Fig. 4). These features resemble chatter marks observed at smaller scales across subglacially eroded bedrock (e.g., striations and grooves; Laverdiere et al., Reference Laverdiere, Guimont and Pharand1979, Reference Laverdiere, Guimont and Dionne1985). Consequently, we speculate that these features represent soft-bedded mega-chattermarks created by the stick-slip motion of rafts being dragged across a deformable substrate to create megafluting, a concept that requires further testing.
Otter–Orloff Lakes area
Located west of Calling Lake (Fig. 2b), this area comprises substantial hill-hole pairs (sensu Aber et al., Reference Aber, Croot and Fenton1989) as well as numerous smaller hills with rectilinear edges separated by water-filled depressions (Fig. 7), all developed in an area of thick Quaternary sediment (≤45 m). The most obvious hill-hole pairs occur around Otter–Orloff Lakes, where a series of rectangular NNW-SSE aligned, water-filled depressions lie to the north of a 37 km2 complex of thrust masses (hills) derived from the depressions. Diagnostic of a thrust origin are arcuate inset subsidiary ridges or crenulations on the summits of the main hills, as well as linear hill margins and internal structural lineaments marked by channels, both aligning with the predominantly straight margins of the source depressions; the straight margins represent wrench faults initiated by stick-slip displacement. These parallel fault structures have also locally influenced/controlled the morphology of the adjacent thrust masses, resulting in the linear nature of the thrust hill margins. Paraxial ridges also occur at the lateral edges of some thrust masses (Fig. 7). Glacial overriding of these features is indicated by more hummocky to smoothed rather than crenulate surfaces and the continuation of eskers from the holes and onto the proximal slopes, where they connect with meltwater channels incised through the hills (cf. Moran et al., Reference Moran, Clayton, Hooke, Fenton and Andriashek1980; Fig. 7). The displacement direction of the hills is towards the SSE, parallel to, but partially crosscutting, the westernmost megaflutings of the Athabasca Ice Stream (the up-ice component of the CAIS). This indicates that the features were displaced during the early shutdown of the western edge of the CAIS. Elongate assemblages of prairie doughnut chains and eskers on the distal slopes and down-ice flow of the main thrust mass record the release of pressurised groundwater due to glacitectonic stress/ice sheet loading; this was linked to subglacial drainage networks at the junction with the active part of the CAIS immediately to the east (cf. Moran et al., Reference Moran, Clayton, Hooke, Fenton and Andriashek1980; Evans et al., Reference Evans, Atkinson and Phillips2020).
(color online) Annotated LiDAR digital elevation model (top) and geomorphology map (bottom) of the Otter–Orloff Lakes and Calling Lake area, showing the major landforms.

To the west of the Otter-Orloff Lakes hill-hole pairs, a similar but less prominent thrust moraine arc forms the easternmost extent of a 14-km-wide corridor of streamlined ridges and small hills. This moraine arc records a late-stage readvance from the WNW (hereafter the Otter Lake readvance), which appears to have partially modified the earlier thrust mass excavated from Otter Lake by the shutdown of the Athabasca Ice Stream. This is manifest by overprinted surface crenulations indicative of thrusting and folding, which are aligned E-W (oldest) on the front of the thrust mass and SW-NE (youngest) on the back (Fig. 7). The streamlining created by the readvance comprises subtle fluting that has modified underlying arcuate to crenulated ridges and chaotically distributed hills. Directly west and northwest of Otter Lake, the ridges and hills are less modified, appearing as rectangular, flat-topped uplands (≤0.4 km wide × 1.4 km long), in some cases displaying crenulated summits interspersed with rectilinear depressions. The linear edges of the hills parallel those of a prominent escarpment located immediately to the west, giving the impression that they have been horizontally detached and then extensionally displaced along a shallow décollement zone towards the western side of the Otter Lake depression (Fig. 7). We hereafter adopt the term “en échelon hill-hole complex” (EHHC) for this landform assemblage and relate the preservation of individual thrust masses here to late-stage production, in this case the result of either: (1) the basal submarginal freeze-on of the ice lobe responsible for the Otter Lake readvance; or (2) their detachment due to transient variations in groundwater pressure during the rapid ice advance, possibly also explaining the presence of doughnut chains and eskers (cf. Moran et al., Reference Moran, Clayton, Hooke, Fenton and Andriashek1980).
Jenkins Lake-Grosmont area
Remarkable features on the escarpment flanking the western edge of the Athabasca River lowlands (Figs. 2b and 8) relate to a late-stage, curvilinear, NW-SE pattern of ice streaming recorded in a strongly fluted terrain that feeds into the more dominant N-S flowing CAIS (Fig. 8). A final WNW-ESE linear flow crosscuts the northernmost part of this curvilinear pattern but similarly terminates at the footprint of the CAIS. The suture zone between these easterly flowing ice streams and the CAIS is demarcated by a shear margin moraine (sensu Dyke and Morris, Reference Dyke and Morris1988; Stokes and Clark, Reference Stokes and Clark2002) some 20 km long and grading into a northward-widening, elongate zone of thrust masses and associated up-ice source depressions. This shear margin moraine separates the present-day Athabasca River valley and the glacifluvial landforms and large depressions containing Island and Baptiste Lakes. Located immediately to the west of this heavily pitted glacifluvial complex and its esker ridges is a prominent rectilinear scarp. To the west of Island and Majors Lakes, right-angled re-entrants that cut back into the scarp are floored by shallow depressions, one of which is now occupied by Ghost Lake. Further south, Baptiste Lake appears to occupy a similar depression but also contains islands and peninsulas composed of crenulated thrust masses; indeed, a larger thrust mass occurs at the southern end of Baptiste Lake, suggesting that its twin lake basins are two inset hill-hole pairs (Fig. 8). A further hill-hole pair occurs below the right-angled re-entrants, where the highly linear Majors Lake has been excavated to form a 5-km-long and 0.75-km-wide groove, ending at an upstanding mound of the same width. This groove also displays a clear paraxial ridge comprising four slightly offset segments, likely due to the progressive narrowing of the thrust mass while it continued to excavate the groove (Fig. 8, inset). We classify this type of feature a “paraxial ridge and groove association” (PRGA).
(color online) The glacial geomorphology of the Laurence Lake-Grosmont area to the northwest of Athabasca. Main panel is annotated LiDAR digital elevation model of the major landforms of the area. Bottom left inset shows the details of the Majors Lake paraxial ridge and groove association (PRGA) and top right inset shows detailed mapping of the glacitectonic landforms in the Jenkins Lake–Grosmont area.

The most obvious hill-hole pairs and associated PRGAs lie to the north of Grosmont, where narrow thrust masses have been displaced southeastward, carving deep grooves into the uplands and surrounding scarp. The most spectacular of these is the Jenkins Lake hill-hole pair, where a 6.5 km2 crumpled thrust mass originating from Laurence Lake has been displaced over 11 km to form a 45-m-deep mega-groove (Atkinson et al., Reference Atkinson, Utting and Pawley2018; Fig. 8), effectively creating a hill-groove pair. Along the groove edge are dislocated compressive ridges curving downflow and truncated by small flutings or paraxial ridges. Emerging from the up-ice and distal ends of the thrust mass are multiple eskers that coalesce into a single ridge immediately to the southwest and then wind 15 km southwards into the Baptiste Lake depression. This is reminiscent of the thrust mass–esker relationships identified by Bluemle and Clayton (Reference Bluemle and Clayton1984), due to transient variations in porewater pressures associated with thrusting, with eskers forming during water escape and depressurisation of the hydrogeologic system, leading to the cessation of thrust mass displacement.
Further groove-shaped hill-hole pairs north of Jenkins Lake indicate that thrusting was initiated when ice flow shifted slightly from SE to ESE in an onset zone of a tributary of the CAIS. Also apparent here is the tendency for the thrust masses to have partially fragmented downflow, producing partially streamlined linear rubble trains (see Lac la Biche-Beaver Lake area below). The compressive, constructional nature and excellent preservation of the Laurence-Jenkins Lakes hill-hole pair and other smaller examples to the north indicate that they were late-stage features, likely developed beneath a thinning ice margin. This contrasts with the more slablike thrust masses (rafts) that were detached from the rectilinear source scarps, the re-entrants along which are thought to be controlled by the intersection of fracture sets within the underlying bedrock (cf. Ozoray, Reference Ozoray1972; Misra et al., Reference Misra, Slaney, Graham and Harris1991; Pana and Waters, Reference Pana and Waters2016). These bedrock structures were exploited during subsequent erosion of the source scarp, forming the prominent, linear “sidewalls” and “backwalls” (Fig. 8) left behind after raft removal. Two genetic scenarios are possible here. First, rectilinear re-entrants within down-ice flow-facing scarps are similar to headwalls of translational mass movement features, ubiquitous in Alberta, and hence the detachment of incipient rafts could have been initiated by shallow slope failure before ice advance. Second, and not mutually exclusively, we suggest a two-stage raft-detachment process comprising: (1) basal freeze-on during ice stream thinning and shutdown; followed by (2) dislocation and lateral displacement of thin rafts across near-surface décollements, likely aided by variations in porewater pressure beneath these areas of the ice stream when its fast flow switched back on.
Lac la Biche-Beaver Lake area
The glacial landforms in the Lac la Biche and Beaver Lake area (Figs. 2a and 9) record vigorous flow within the Lac la Biche and Seibert Ice Streams (cf. Andriashek and Fenton, Reference Andriashek and Fenton1989), which form the northernmost branches of the onset region of the Buffalo-James Lobe Ice Stream system (Ross et al., Reference Ross, Campbell, Parent and Adams2009; Margold et al., Reference Margold, Stokes and Clark2015a, Reference Margold, Stokes, Clark and Kleman2015b). Regional orientations of subglacial lineations and fracture patterns in the thrust masses and rafts record spatiotemporal switching in the relative dominance of competing ice streams in the Lac la Biche area, previously reported by Andriashek and Fenton (Reference Andriashek and Fenton1989) and modified here based upon newly recognised landform patterns. Specifically, an early NW-SE flow of the Lac la Biche Ice Stream was replaced by the N-S flow of the Seibert Ice Stream as its margin migrated westwards. Later narrowing of the Seibert Ice Stream allowed the re-establishment of a vigorous but similarly narrow southeasterly flowing Lac la Biche Ice Stream, as defined by the limit of its most recent streamlining directly south of Beaver Lake. Between the most recent, highly streamlined parts of these ice stream trunks, immediately south and east of Lac la Biche and around Beaver Lake, a variety of glacitectonically displaced rafts lie only relatively short distances from their source depressions and appear variably fragmented downflow (Fig. 9b and d). In contrast, the highly streamlined trunks of the Lac la Biche and Seibert Ice Streams contain more intensely smoothed source depressions, thrust masses, and linear block trains or rubble stripes (Evans et al., Reference Evans, Atkinson and Phillips2020; cf. aligned rubble of Atkinson et al., Reference Atkinson, Utting and Pawley2018), some of which have drumlinoid plan forms and hence are termed “rubble drumlinoids” (Fig. 9a and c). In combination, the landforms in the two areas of highly and less streamlined ice stream footprints can be used to demonstrate the spectrum of ice-marginal to potentially subglacial raft detachment, substrate moulding, reworking, and fragmentation of earlier detached rafts, and their role as downflow dispersing erodents to create MSGLs.
(color online) Annotated LiDAR digital elevation model of the glacial landforms in the area around Lac la Biche and Beaver Lake. Inset boxes show: (a) streamlined inner zone of the Lac la Biche Ice Stream trunk; (b) western boundary zone of the Seibert Ice Stream; (c) streamlined rubble of the inner zone of the Lac la Biche Ice Stream trunk; (d) the Beaver Lake en échelon hill-hole complex (EHHC).

Early-stage raft-detachment patterns are evident in the complex outline of Beaver Lake, which is a product of a series of arcuate, en échelon, flow-transverse, and largely flat-topped ridges (Fig. 9d). Although curvilinear in plan form, the cliffs of the ridges are composed of rectilinear segments, with each ridge giving the appearance that they all fit together like a jigsaw puzzle; that is, the land surface has been fractured by extension and transported southwards over a shallow décollement zone. The surfaces of the ridges exhibit faint N-S orientated flutings and are mantled by geometric ridge networks, with both landform types being visible but not directly traceable from one ridge to another and onto the land surfaces surrounding the lake. Hence, these features are interpreted as an EHHC, developed after ice streaming had created flutings and geometric ridge networks. These subglacial landforms are diagnostic of surging activity and are recognised on palaeo–ice stream beds across the region (cf. Sharp, Reference Sharp1985a, Reference Sharp1985b; Evans and Rea, Reference Evans and Rea1999, Reference Evans, Rea and Evans2003; Evans et al., Reference Evans, Lemmen and Rea1999, Reference Evans, Clark and Rea2008, Reference Evans, Storrar and Rea2016, Reference Evans, Atkinson and Phillips2020; Ó Cofaigh et al., Reference Cofaigh, Evans and Smith2010). The subsequent fracturing of this subglacial surface to form an EHHC most likely represents the freeze-on along the narrowing outer western boundary of the Seibert ice stream after a phase of surging.
Directly east of Lac la Biche and Beaver Lake, the western boundary of the Seibert Ice Stream can be further subdivided based on the intensity of streamlining; highly elongate subglacial bedforms in the east are separated by an abrupt boundary from thrust masses and rubble terrain and rubble stripes in the west (Fig. 9b). The types of thrust mass in this area include arcuate, flat-topped ridges with a source scarp in the north (an EHHC), numerous examples of further-travelled and more highly fragmented rafts and their source scarps (e.g., immediately east of Beaver Lake), hill-hole pairs forming the sub-basins of southern Beaver Lake and south Elinor Lake, and closely spaced rubble stripes to the south of Beaver and Elinor Lakes. Importantly, these rubble stripes resemble pre-existing thrust masses that have become overridden and fragmented subglacially as they were displaced variable distances southwards as a result of continued ice advance from the NW/NNW (see Fig. 9b). The linearity of the margins of the rubble stripes likely relates to the original morphology of the thrust masses and their straight-sided source hollows (see Fig. 7). It is possible that the flow-parallel arrangement of the rubble stripes is indicative of the subglacial dispersal of the blocks.
In some cases, the narrow thrust masses have been fragmented along their displacement track to form aligned chains of transverse ridges reminiscent of the “ladder” morphology identified for some ribbed moraine by Dunlop and Clark (Reference Dunlop and Clark2006). Importantly, these ladder morphologies and rubble stripes change abruptly on their eastern margin into highly streamlined forms (flutings, spindle drumlins, stoss-and-lee drumlins), thereby demarcating two zones on the Seibert Ice Stream footprint comprising: (1) a relatively narrow but vigorous flow zone represented by the highly streamlined forms to the east; and 2) a boundary zone to the west, in which less subglacially streamlined features such as EHHCs, fragmented rafts, hill-hole pairs, ladder morphologies, and rubble stripes record freeze-on and displacement of rafts over a relatively shallow décollement due to late-stage ice stream narrowing and shutdown.
The relatively highly streamlined inner zone of the Lac la Biche Ice Stream trunk (Fig. 9a) displays a number of thrust mass source depressions, identifiable by: 1) their rectilinear (fracture-controlled) boundaries; and 2) rectangular, parallel sub-basins defined by flutings that likely originated as paraxial ridges. In some cases (e.g., Burnt Lake), the streamlined and fluted thrust masses occur immediately down-ice flow of the depressions, thereby constituting hill-hole pairs. However, more common are highly fragmented thrust masses (e.g., Missawawi and Kinosiu Lakes), manifest either as single, partially streamlined blocks (small cupola hills) and stoss-and-lee drumlins/flutings located at various distances from their source depressions or as flutings with hummocky long profiles, hereby termed “Type 1 hogsback flutings”; the latter appear to be the product of streamlined rubble stripes. Features also widespread in this inner zone of intensive ice stream streamlining are blocks or thrust masses that appear to have been: (1) ploughed through deformable subglacial material to create a prow and extended limbs or paraxial ridges; and (2) lodged, such that deformable subglacial material has been advected downflow to form two extended limbs, akin to the horned crag-and-tails of Jansson and Kleman (Reference Jansson and Kleman1999). A quarry within the thrust mass of a horned crag-and-tail near the Lac la Biche townsite reveals a stratigraphy composed of stacked glacitectonites (Fig. 10). Here, an attenuated, 40-m-long, highly fissile mudstone raft with small-scale tectonic laminae and slickensides occurs within a sand and gravel glacitectonite, the uppermost contact of which grades abruptly into a massive, matrix-supported diamicton representative of till production by cannibalisation (cf. Evans et al., Reference Evans, Phillips, Hiemstra and Auton2006; Evans, Reference Evans2018).
(color online) Details of a quarry exposure in a horned crag-and-tail near the Lac la Biche townsite.
Whitefish Lake-Goodfish Lake area
The three lake basins containing Whitefish, Goodfish, and Garner Lakes are defined by prominent rectilinear outlines, the largest and most continuous of which is a NNW-SSE trending scarp that stretches more than 30 km (Fig. 11). They are located in an ice stream confluence zone (Andriashek and Fenton, Reference Andriashek and Fenton1989) on the southern edge of the Lac la Biche fluting field (fast-flow trunk zone of Ice Stream 2/2A; Ó Cofaigh et al., Reference Cofaigh, Evans and Smith2010; Norris et al., Reference Norris, Evans and Cofaigh2018). The scarp and its fronting basins constitute a series of depressions that appear to be the source of the glacitectonically displaced masses located between 7.5 and 9 km to the southeast. The rectilinear shapes of the main and subsidiary depressions are likely controlled by bedrock fracture sets (joints) orientated NW-SE (ice flow parallel) and NE-SW (ice flow transverse; Ozoray, Reference Ozoray1972; Misra et al., Reference Misra, Slaney, Graham and Harris1991; Pana and Waters, Reference Pana and Waters2016). The displaced masses, although occupying a broadly linear assemblage, lie at various distances from their source depressions, and many individual mounds appear to relate to subsidiary basins in the major lakes; this effectively creates assemblages of closely spaced, often narrow hill-hole-pairs, collectively representing an EHHC. Some of the narrowest rafts have been fragmented along their displacement tracks to form ladder morphologies (Fig. 11). These features can be seen to merge into linear block trains that are variably streamlined to form Type 1 hogsback flutings and rubble stripes (cf. Evans et al., Reference Evans, Atkinson and Phillips2020).
(color online) Annotated LiDAR digital elevation model of the glacitectonic landforms in the Whitefish Lake-Goodfish Lake area, on the southern edge of the Lac la Biche fluting field. EHHC–en échelon hill-hole complex.

The overall thrust mass displacement and streamlining direction, as indicated by the various structural lineations, smoothed thrust blocks, rubble stripes, and flutings, is towards the southeast. However, the size and coherence of rafts changes rapidly within a ≤9.5-km-wide fragmentation zone comprising densely spaced, locally crenulate, and parallel ridges and hollows aligned approximately NE-SW (Fig. 11). The geometry of the ridges and intervening hollows is consistent with the fragmentation of the rafts as a result of ice flow-parallel extension occurring during transport, likely along pre-existing, ice flow-transverse joints. These relationships indicate that individual slablike rafts were detached and transported by sliding upon a subhorizontal décollement, with the relative intensity of fragmentation increasing towards the east, consistent with the increasing transport distance from the source hollows. At the far northern and eastern edge of this zone of fragmented rafts, superimposed lineaments (e.g., rubble stripes) appear to be aligned with Lac la Biche Ice Stream megaflutings (Andriashek and Fenton, Reference Andriashek and Fenton1989; Fig. 11). This indicates that the south-southeasterly flow of the Lac la Biche Ice Stream postdates the southeastern flow signature recorded in the EHHC and that intensive thrust mass fragmentation was at least partially related to the lateral drag of the Lac la Biche Ice Stream as its flow direction turned from southeasterly to south-southeasterly, effectively creating a “pull-apart” zone in the fractured substrate (Fig. 11; cf. Andriashek and Fenton, Reference Andriashek and Fenton1989). This is well illustrated by EHHC (locally developed into large-scale ladder morphology) in the area of Mann Lakes, where thrust masses have been displaced S-SE, parallel to another prominent NNW-SSE aligned scarp (see section on Ashmont-St. Paul area).
A large composite thrust moraine to the west of Whitefish Lake occurs immediately south of a complex area of bedrock hollows and fragmented rafts, located close to the southern margin of the Lac la Biche Ice Stream (Fig. 11). Its surface morphology indicates a complex internal structure, with a series of sinuous ridges representing the crests of folds and/or individual thrust-bound slices within an imbricate thrust stack. The ridge traces are crenulated by a set of open to moderately tight, NW-SE trending folds (Fig. 11). This moraine likely originated from the shallow depressions/hollows immediately to the north, and its smoothed morphology suggests that it has been subsequently overridden by ice. These characteristics indicate that the moraine is a cupola hill, constructed by ice push from the northwest/north-northwest, compatible with the orientation of the subglacial bedforms of the Lac la Biche Ice Stream to the north and east (Fig. 11). Furthermore, this cupola hill is located southwest of the Lac la Biche Ice Stream, on the northern side of an area of fragmented rafts centred upon Whitefish and Goodfish Lakes. This area was likely overlain by static or very slow-moving ice, which allowed the preservation of earlier landforms associated with raft detachment, transport, and fragmentation. The cupola hill therefore formed subglacially at a compressive margin between the Lac la Biche Ice Stream to the north and east and static ice to the south. This is unusual, in that cupola hills are typically considered to form proglacially, due to the need for space to accommodate the growing imbricate thrust stack. Consequently, the Whitefish Lake cupola hill is unlikely to have been constructed beneath thick ice. Rather, increased flow rates associated with the widening of the ice stream will have thinned the ice mass, with southerly directed thrusting effecting both the overlying ice as well as the underlying sediments and bedrock (see cross section in Fig. 11). It is possible that static ice to the south and west of the ice stream was frozen to its bed and therefore acted as an aquitard. This prohibited the pressurised subglacial meltwater, typically equated with fast ice flow, from moving beneath the ice stream into the area underlying the immobile ice. The resulting increase in subglacial water pressure on the up-ice side of the static ice mass is thought to have promoted the detachment of the thrust slices, which were transported southwards and subsequently stacked into the evolving cupola hill. Corroboration of the large-scale glacitectonic displacement of bedrock in this area is provided by Andriashek and Fenton (Reference Andriashek and Fenton1989), who reported the superimposition of more than 80 m of Belly River Formation sandstone over Empress Group sediments near Whitefish Lake. Pressurisation of the groundwater system in this area is evidenced by the widespread occurrence of prairie doughnuts and eskers immediately southwest of the composite thrust moraine (cf. Evans et al., Reference Evans, Atkinson and Phillips2020; see Fig. 11).
Ashmont-St. Paul area
Southeast of Whitefish–Goodfish Lakes is an extensive area of intensely fragmented EHHC, including numerous straight-sided, elongate, and curvilinear lakes such as Lower Mann and Upper Mann Lakes and the area west of Vincent Lake (Fig. 12; cf. Andriashek and Fenton, Reference Andriashek and Fenton1989). The western limit of these lakes is marked by a NNW-SSE escarpment, which likely marks a major fracture set or fault within the underlying bedrock (Ozoray, Reference Ozoray1972; Misra et al., Reference Misra, Slaney, Graham and Harris1991; Pana and Waters, Reference Pana and Waters2016). A series of similarly trending, highly elongate linear ridges and intervening hollows occurs in a ≤3.6-km-wide zone that parallels megaflutings along the trunk of the adjacent Lac la Biche Ice Stream (Fig. 12). This highly lineated zone forms the abrupt easterly edge to the fragmented EHHC and occupies a position relative to the ice stream that is typically associated with the development of lateral shear margin moraines (Dyke and Morris, Reference Dyke and Morris1988; Stokes and Clark, Reference Stokes and Clark2002). In the Ashmont-St. Paul area, this ice stream marginal zone comprises a complex assemblage of individual landform components, such as ladder-type morphologies or narrow zones of ribbed moraine, elongate rafts with transverse surface ridges (hereafter termed “ridged spindles”), and their more attenuated forms, here referred to as “Type 2 hogsback flutings.” We classify this style and pattern of raft evolution here as “incipient ice stream shear margin moraine,” thereby providing an explanation for the accumulation of linear subglacial debris mounds at the suture zones of ice stream beds (cf. Dyke and Morris, Reference Dyke and Morris1988; Stokes and Clark, Reference Stokes and Clark2002). This linear pattern of ice stream marginal landforms crosscuts the fragmented EHHC, indicating that in this area, the Lac la Biche Ice Stream postdated and migrated westwards over the footprint of an earlier WNW-ESE ice flow that was responsible for the detachment, transport, and fragmentation of the bedrock rafts from the elongate basins now occupied by Lower and Upper Mann Lakes.
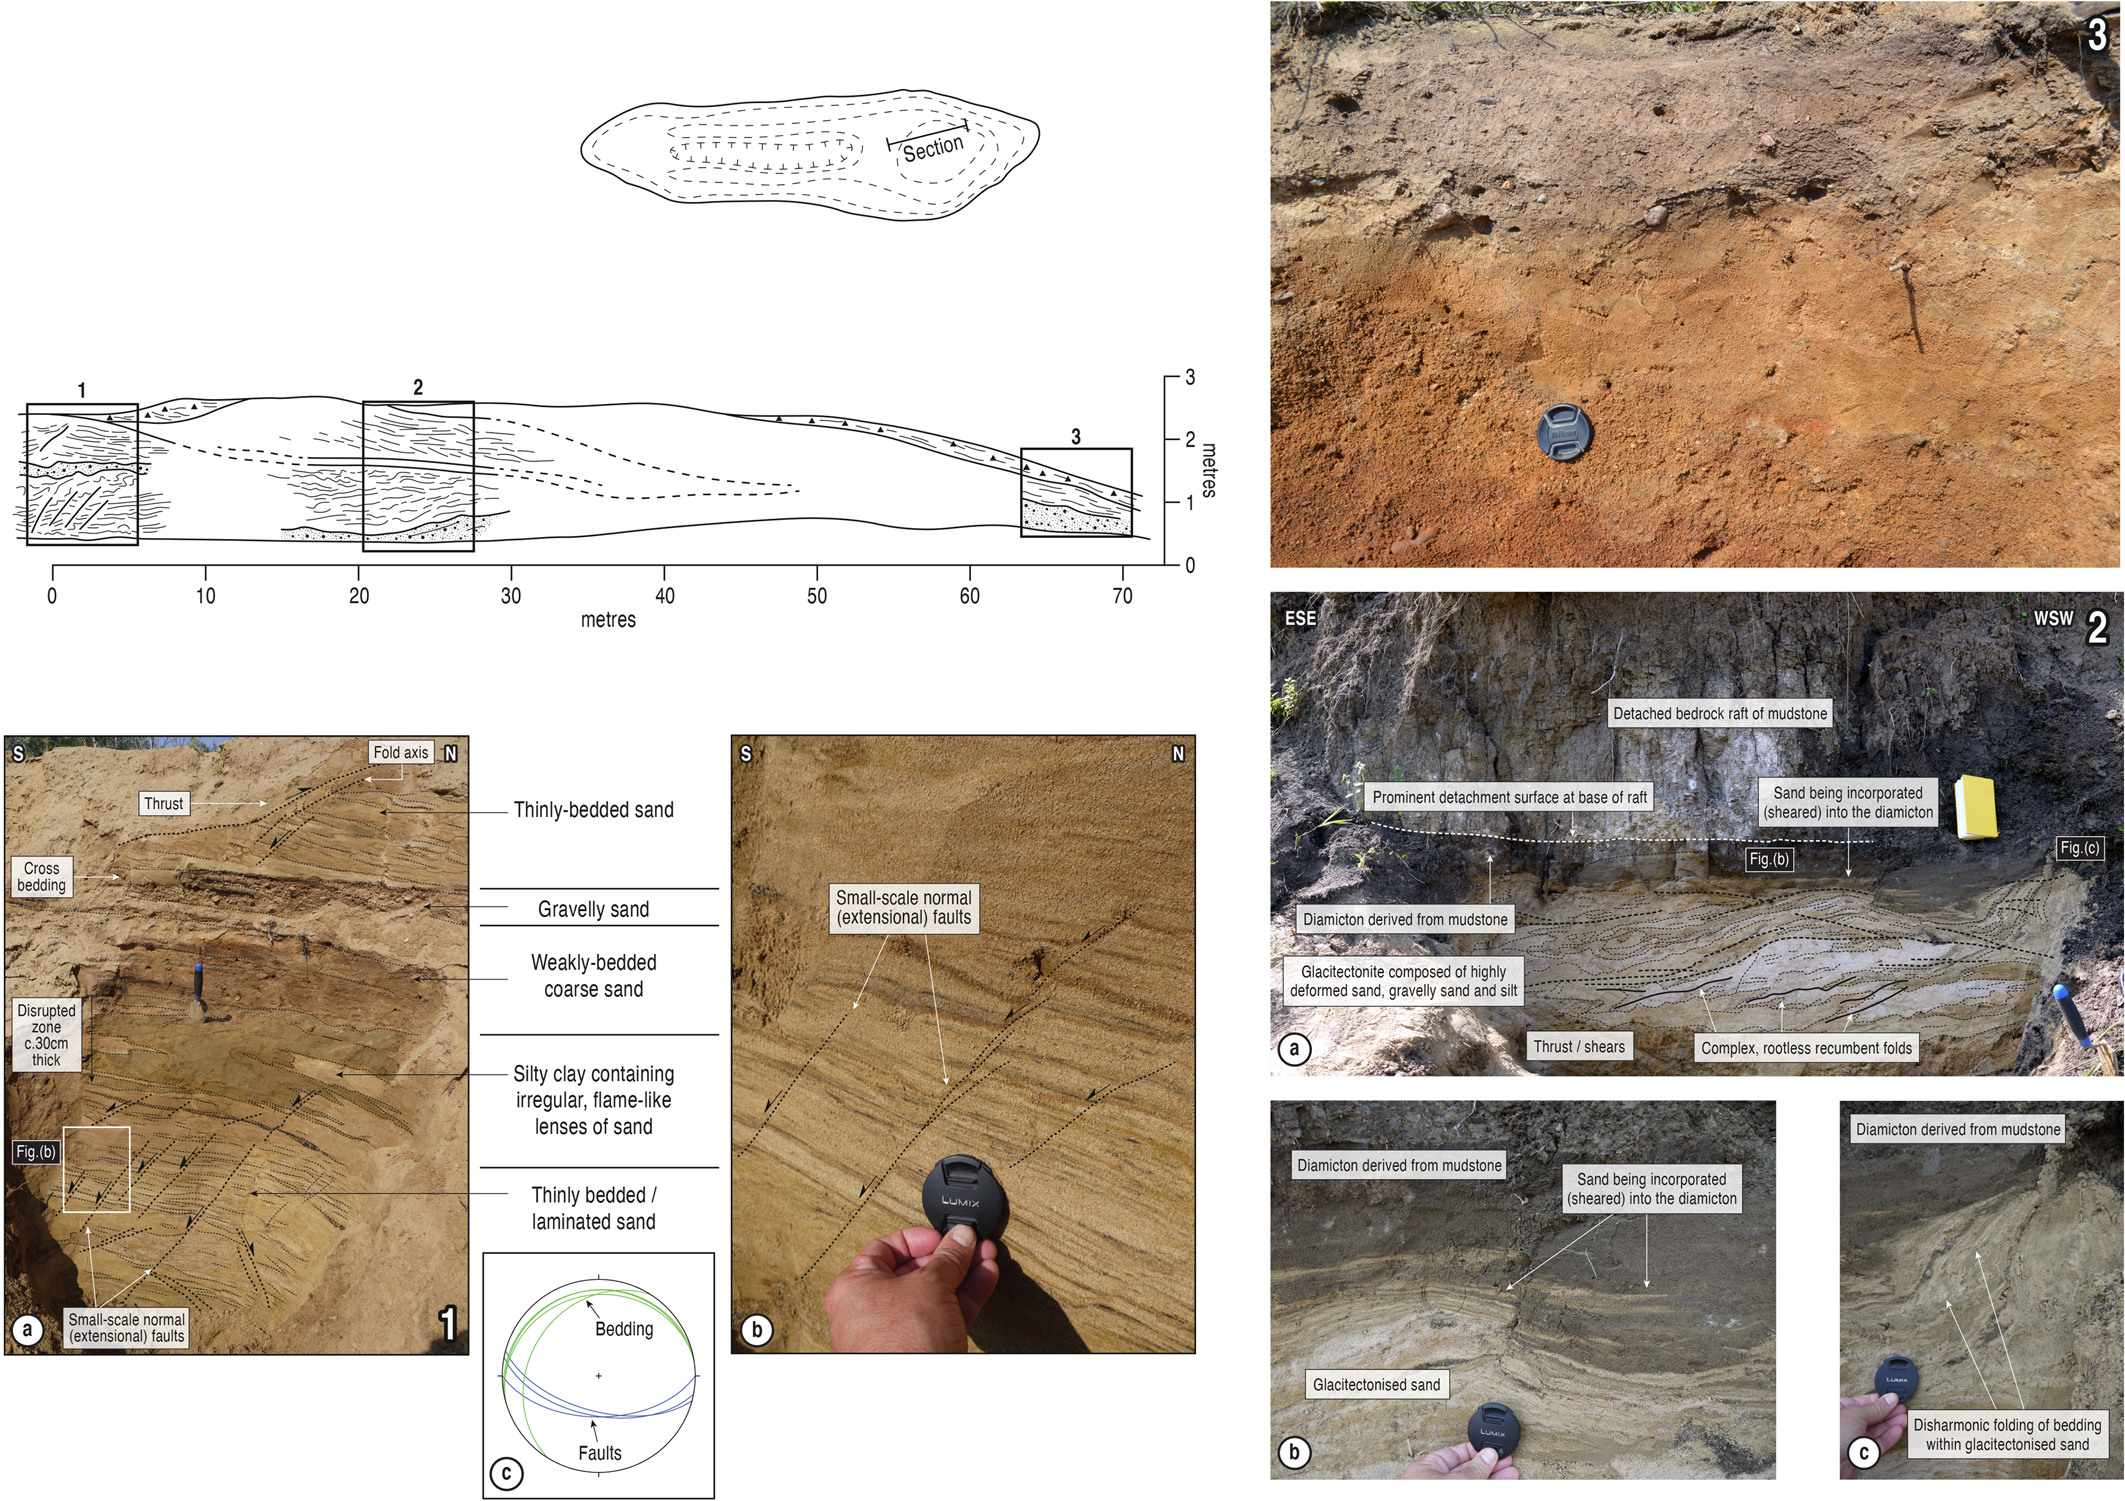
Landforms in the Ashmont-St. Paul area, at the junction of the onset zone of the westerly tributary to the Lac la Biche Ice Stream: (a) annotated LiDAR digital elevation model and major glacial geomorphology of the area, with locations of enlarged areas outlined. Black lines represent the crests of major glacitectonic thrust masses; green lines depict major flutings and associated streamlined glacial bedforms; brown outlines demarcate major landform assemblages (Lottie Lake-Saddle Lake composite thrust terrain in the west and overridden and partially cannibalised megafluting in the east); and red lines demarcate discrete streamlined zones on the palaeo–ice stream beds defined by landform styles. Circled cross marks the location of section depicted in b. Detailed areas include the strike-slip raft complexes (SSRCs; incipient shear margin moraine) at western edge of the Lac la Biche palaeo–ice stream (A), hairpin-shaped landforms or murdlins amongst streamlined landforms (B), megablocks/rafts grading into linear rubble stripes (C), a downflow-tapering rubble band located east of Saddle Lake (D), and a fragmented and streamlined raft and groove (hill-groove pair) derived from a source quarry in an overridden megascale glacial lineations (MSGL) (E). (b) Section through raft in the tapering rubble band located immediately east of Lottie Lake, with upper panels showing sedimentologic and structural details and lower panel showing the nature of the rafts and streamlining on an enlargement of the LiDAR imagery. EHHC, en échelon hill-hole complex. (For interpretation of the references to color in this figure legend, the reader is referred to the web version of this article.)

The landforms in the areas to the northwest, south, and southeast of Ashmont are dominated by WNW-ESE aligned megaflutings (Fig. 12a), defining the northern part of a much larger subglacial assemblage of an ice stream onset zone that joins the Lac la Biche trunk to form Ice Stream 2/2A of Ó Cofaigh et al. (Reference Cofaigh, Evans and Smith2010) and Norris et al. (Reference Norris, Evans and Cofaigh2018). This flow set can, however, be traced into the area of fragmented EHHC centred upon the Upper and Lower Mann Lakes area, even though the smaller-scale flutings appear to have been locally subtly rotated on the surfaces of the fragmented rafts. This indicates that the Upper and Lower Mann Lakes area also forms part of the ice stream onset zone. At the centre of the onset zone, in the area south of Saddle Lake, is a large glacitectonic composite ridge (Fig. 12a). To the north and west of Saddle Lake, comparable landforms are increasingly fragmented, with individual ridges becoming more hummocky and crenulate in plan form. To the north of Lottie Lake, the ridges turn abruptly from their N-S alignment to verge with the WNW-ESE flutings south of Ashmont, where the ridges become increasingly fragmented, forming individual blocks/rafts that were evidently dragged ESE by ice stream flow to form linear rubble stripes (Fig. 12a, panel C, and 12b). This relationship, noted initially by Andriashek and Fenton (Reference Andriashek and Fenton1989), provides another example of the pull apart of glacitectonically detached blocks during transport. Similar fragmentation and downflow modification of thrust masses, detached rafts, and large plucked bedrock blocks into linear and/or downflow tapering rubble stripes are apparent throughout the onset zone, such that raft density and size can be used to differentiate ice flow parallel zones in the subglacial footprint (Fig. 12a; cf. Andriashek and Fenton, Reference Andriashek and Fenton1989). A particularly good example of a downflow tapering rubble stripe lies east of Saddle Lake and likely originated as a thrust mass that was displaced from the source depression now occupied by the lake (Fig. 12a, panel D, and 12b). In all examples of linear rubble stripes, trailing paraxial ridges are often well developed in association with megablocks/rafts, with smaller blocks often being almost completely buried in their associated prow and paraxial ridges to form hairpin-shaped landforms akin to the murdlins of Stalker (Reference Stalker1973; Figs. 1 and 12a, panel B). Raft detachment and down-ice transport and variable fragmentation also occur where pre-existing subglacial bedforms have been cannibalised, an excellent example occurring in the southern part of the onset zone. Here, three parallel-aligned and offset MSGLs recording earlier ice flow towards the SSW have been locally modified by the removal of rafts, as defined by straight-sided source quarries. A fragmented and streamlined raft (1.3-km-long and 0.5-km-wide rubble drumlinoid) derived from one of these quarries is visible 5.5 km downflow and is clearly associated with a 1.5-km-long proximal furrow indicative of its ploughing through the substrate (Fig. 12a, panel E), constituting a hill-groove pair. Linear rubble stripes, downflow tapering rubble bands (drumlinoids), ploughed rafts with paraxial ridges, and megaflutings have also been superimposed on this MSGL complex (Fig. 12a).
The rafted bedrock origins of the blocks identified throughout the onset zone are verified by roadside excavations, best illustrated by an exposure through a megablock in the tapering rubble band located immediately east of Lottie Lake (Fig. 12). Here, a vertically stacked sequence of displaced blocks of sandstone bedrock and diamicton (till), in places separated by thin thrust slices of mudstone, records displacement from the west. Diamicton with a clear vertical fissility wraps around the front of the uppermost sandstone raft to form a surface carapace. This sequence and its structural architecture indicate that the sandstone rafts have been ploughed through till, and hence the exposure represents a cross-section through a ploughing raft. As this area lies over ≤130 m of Quaternary sediment (Andriashek and Fenton, Reference Andriashek and Fenton1989), the fragmented rafts here must be relatively far-travelled erratics.
Goodridge
A ploughed raft (270 m wide and ≥20 m high) with prow and trailing paraxial ridges either side of a linear depression or groove occurs near Goodridge, south of the Beaver River (Figs. 2 and 13a). The groove represents the plough mark left behind by the displaced raft, and hence we term this association a “hill-groove pair,” similar to a PRGA. It lies amongst streamlined thrust masses and N-S orientated flutings within the footprint of the northern tributary of the onset zone of Ice Stream 2/2A of Ó Cofaigh et al. (Reference Cofaigh, Evans and Smith2010) and Norris et al. (Reference Norris, Evans and Cofaigh2018) (cf. Andriashek and Fenton, Reference Andriashek and Fenton1989). Two exposures reveal the highly deformed nature of the materials in one of the paraxial ridges and in the parent thrust mass (Fig. 13), comprising a sandy diamicton containing small lenses (intraclasts) of sand, as well as larger lenticular blocks of glacitectonised mudstone and sandstone (Type III and IV mélanges; cf. Cowan, Reference Cowan1985; Evans, Reference Evans2018). Structures include truncated recumbent folds, up-ice dipping low-angle thrusts and brittle detachments, ductile shears defining subhorizontal Y-type and down-ice dipping R-type Riedel shears, lenticular asymmetrical intraclasts, and asymmetrical extensional crenulation cleavage and SC shear fabrics (Fig. 13b), consistent with brittle-ductile shearing during the formation of this glacitectonic mélange. These mélanges are stacked within sequences comprising bedrock glacitectonite and sandy diamictic glacitectonite overlain by a more homogenous upper zone of clast-poor, sandy diamicton (Fig. 13b). The geometry of the thrusts/shears and other kinematic indicators within the highly deformed lower part of the sequence record an easterly directed sense of shear (see Fig. 13b) consistent with the lateral displacement of material from beneath the raft as it ploughed through a pre-existing glacitectonite substrate. Similar brittle-ductile shear-related structures in a quarry section farther to the north (Fig. 13b) record a more southerly directed sense of shear associated with the construction of the thrust mass, which was later dissected by the ploughing of the raft (Fig. 13a). This section also reveals that the mélange contains a number of semicoherent sandstone blocks. Together, these sediment–landform associations clearly demonstrate the linkage between the ploughing of a longitudinal groove by a gradually fragmenting sandstone raft, the base of which was displacing material laterally to form the paraxial ridges while concomitantly being brecciated and then homogenized into a sandy diamicton (cf. Atkinson et al., Reference Atkinson, Utting and Pawley2018). As the local Quaternary deposits are relatively thick in this area, the raft must represent a relatively far-travelled erratic that was locally constructing paraxial ridges in heterogeneous tills and glacitectonites that themselves were being contemporaneously generated.
(color online) Hill-groove pair near Goodridge: (a) annotated LiDAR digital elevation model of the glacial landforms in the area; (b) ground overview (i) of landform looking north, with exposures in the parent thrust mass (ii and iii) and in one of the paraxial ridges (iv).

Drayton Valley
Numerous exposures through Quaternary glacial deposits and associated bedrock rafts occur in a small tributary of the North Saskatchewan River at Drayton Valley (study area 2; Fig. 2). The site is in a pronounced glacitectonic landscape (Fenton et al., Reference Fenton, Trudell, Pawlowicz, Jones, Moran and Nikols1986; Tsui et al., Reference Tsui, Cruden and Thomson1989) within the footprint of the southerly flowing HPIS (Evans et al., Reference Evans, Clark and Rea2008, Reference Evans, Young and Cofaigh2014; Ó Cofaigh et al., Reference Cofaigh, Evans and Smith2010; Atkinson et al., Reference Atkinson, Utting and Pawley2014; Utting et al., Reference Utting, Atkinson, Pawley and Livingstone2016). Five main cliff sections contain important information on the processes occurring during the transport, disruption, and accretion of rafts (Figs. 14–18).
(color online) Sedimentologic and stratigraphic details of section 1 at Drayton Valley, including clast macrofabric data. Dmm–massive, matrix-supported diamicton; Dml–laminated, matrix-supported diamicton; Dmf–fissile, matrix-supported diamicton; MLA–mean lineation azimuth.

(color online) Sedimentologic and stratigraphic details of section 2 at Drayton Valley, including clast macrofabric and structural data. MLA–mean lineation azimuth.

(color online) Sedimentologic and stratigraphic details of section 3 at Drayton Valley, showing details of fragmented rafts of Paskapoo Sandstone and Empress Group sands and enclosing diamictons, together with clast macrofabric data and their locations.

(color online) Sedimentologic and stratigraphic details of section 4 at Drayton Valley, including clast macrofabric and structural data.

(color online) Sedimentologic and stratigraphic details of section 5 at Drayton Valley, including clast macrofabric and structural data.

Section 1 (Fig. 14) is regarded by Evans (Reference Evans2018) as an example of the vertical development from bedrock raft, to glacitectonite, to subglacial till. A raft of middle to late Palaeocene Paskapoo Formation mudstone and sandstone (Hamblin, Reference Hamblin2004; Lyster and Andriashek, Reference Lyster and Andriashek2012) here displays internal shear zone development in the form of a mélange within the upper layers of the mudstone. This is overprinted by a Dms-derived glacitectonite that has been deformed and attenuated laterally over the raft. The Dms is a coarsening-upward sequence comprising interbedded sand/silt/clay laminae, diamictons, and minor matrix-supported gravelly lenses and displays only localised soft-sediment deformation, thrusting, and dislocated recumbent folds. It appears to have originated as a subaqueous infill of a depression into which laminated sands, silts, and clays and gravity mass-flow diamictons were deposited, potentially in the low points between thrust masses before they were glacially overrun. Above this, vertical homogenisation is reflected in the zone of pseudo-laminated to fissile diamicton (Dml/Dmf) that passes upwards into Dmm with sand-filled convexo-planar lenses, correlative to the uppermost sliding/deforming bed mosaic tills in the Drayton Valley area. Clast macrofabrics from the subtill diamictons and glacitectonite shear zone (F1–F7; Fig. 14) display a W-E or WNW-ESE alignment, compatible with the WNW-ESE stress directions reflected in the early phases of glacitectonic disturbance at Drayton Valley.
In section 2 (Fig. 15), the original lithostratigraphic relationship between the pale-yellow sandstone of the Paskapoo Formation and the unconformably overlying quartzite-rich gravel of the Plio-Pleistocene Empress Group (Whitaker and Christiansen, Reference Whitaker and Christiansen1972) is preserved. Primary bedding and cross bedding within the sandstone indicate that the bedrock is the right way up. Additionally, the planar, erosive contact at the base of the Empress deposits is undeformed, indicating that the poorly cemented sandstone and unlithified quartzite-rich gravels within the raft were detached, transported, and accreted as a coherent slablike block with negligible internal disruption. The upper boundary of the raft with the overlying diamicton is marked by a narrow zone of thrusting containing highly attenuated lenses of sand and sandstone. This brittle-ductile shear zone can be traced laterally towards the east, where it forms the upper bounding surface of a second raft of Paskapoo Formation, within which the bedding is deformed by a large-scale, recumbent to gently inclined fold, the upper limb being truncated by the brittle-ductile shear zone. Bedding within the hinge of this fold has been offset by a number of low-angle brittle faults. The base of this second raft is a gently dipping fault that separates the Paskapoo Formation in its hanging wall from the structurally underlying stratified/laminated diamicton. The layering within this diamicton is defined by thin stringers of sand and is locally truncated at the thrust that forms the base of the raft. Locally this thrust is marked by a thin (≤10-cm-thick) lens of highly fragmented mudstone glacitectonite.
In section 3 (Fig. 16), the rafts are lenticular to irregular in form and internally deformed by tight to isoclinal, recumbent to very gently inclined, mesoscale disharmonic folds. These rootless folds possess highly attenuated limbs with a marked thickening of the deformed bedrock and sediments around the hinges of these complex, highly ductile structures. Although deformed, the sequence preserved within the largest raft is similar to that observed elsewhere and comprises mudstone glacitectonite (sensu Evans, Reference Evans2018; Figs. 15, 16a and b, and 18) at the base, separated from the overlying tectonised sandstone by a narrow shear zone or thrust, which is in turn overlain by quartzite-rich sandy gravel. The southwestern end of this raft is highly attenuated and thins rapidly to form a highly elongate “tail” that extends for several meters, where it is coplanar with the lamination within the host diamicton. The latter is defined by thin stringers of sand and is locally observed wrapping around the rafts. Deformation within the rafts has resulted in the variable overprinting/transposition of the primary bedding within the sandstone. The sandstone also locally contains highly irregular patches or augens of diamicton with flame-like stringers and ribbons. The boundary between the Paskapoo Formation and Empress Group within the larger raft has been strongly modified, with a similar complex, highly irregular to flame-like boundary occurring between the quartzite-rich sandy gravel and the host diamicton. These relationships indicate that, with increasing deformation, the bedrock within the raft had begun to lose its integrity and was being incorporated into the host diamicton-rich glacitectonite. This conclusion is supported by the fact that the sandstone within these highly deformed rafts is poorly indurated. The combination of the highly ductile, disharmonic nature of the folding, coupled with the complex, flame-like nature of the lithological boundaries, suggests that the raft and host sediments became water saturated during glacitectonism, which reduced cohesive strength and facilitated their breakup.
Section 4 (Fig. 17) displays a strongly modified part of the boundary between the Paskapoo Formation and the Empress Group, where highly irregular bodies of massive to weakly bedded sandstone extend upwards into the quartzite-rich gravels. Smaller (≤1-m-long) lenticular to irregular blocks of sandstone, possibly representing eroded intraclasts, occur near the base of the Empress gravels. The highly complex form of this boundary is clearly secondary in nature and suggests that the poorly lithified sandstone has been mobilised and injected upwards into the gravels. In a more deformed raft, the original stratigraphic relationship between the Paskapoo Formation and the Empress Group has been removed as a result of glacitectonism. The upper boundary of this lenticular raft (ca. 2.5 m thick and thinning abruptly towards the southeast) is a sharp, faulted contact separating the sandstone within its footwall from the structurally overlying clay-rich diamicton. The base of the raft is a complex, gently NW-dipping brittle-ductile shear zone (0.5–1.0 m thick) composed of attenuated and thrust-repeated lenses of tectonised sandstone, diamicton, and quartzite-rich gravel.
Section 5 (Fig. 18) displays thrust repetition of the Paskapoo Formation, Empress Group, and host glacigenic sediments. It is uncertain whether this raft is composed of a single thrust-repeated, W/NW-dipping slab of Paskapoo Formation and Empress Group or several, individual thrust-stacked blocks that preserve the original lithostratigraphic relationships, albeit strongly modified by deformation. Although they are repeated by thrusting, the sedimentary structures within the sandstone suggest that the bedrock blocks are the right way up. The structurally lowest, westerly dipping thrust/shear zone observed towards the eastern end of the section separates the lowest unit of sandstone from a unit of mudstone glacitectonite. The highly fissile mudstone has been broken into angular, tabular fragments (≤5–10 cm long) within a dark grey, clay-rich matrix derived from disaggregated mudstone. The moderately to gently NW-dipping thrust forming the upper boundary of the thrust stack clearly truncates bedding within the sandstone as well as the modified lithostratigraphic boundary between the displaced raft of Paskapoo Formation and Empress Group. The overlying diamicton contains lenses of sand and gravel that are wrapped by a variably developed stratification/lamination defined by thin sand stringers. The diamicton is in turn overlain by a mudstone glacitectonite, lithologically similar to that at the base of the thrust sequence. These fissile mudstones represent the overbank/lacustrine deposits within the Paskapoo Formation and, where present, will have constituted weak horizons within the bedrock that could be exploited as décollement surfaces during raft detachment, a conclusion supported by the close association between the mudstone glacitectonites and the large-scale thrusts that bound the rafts.
The diamictons that host the variably deformed rafts in sections 1–5 range from heterogeneous, pseudo-stratified, or pseudo-laminated/banded (Dms, Dml) to homogeneous, matrix-supported, and massive with zones of distinct fissility (Dmm/Dmf). The homogeneous diamictons also contain lenses of stratified sediments. The characteristics of the heterogeneous diamictons vary considerably due to the range of material that has been incorporated into them, including intraclasts, boudins, stringers. and wisps of sand, gravel, and mudstone, often appearing as densely spaced glacitectonic foliation that pinches and swells across the section and becomes more attenuated where it wraps around rafts (Figs. 14 and 16). This glacitectonic foliation resulted from the mixing and ingestion of different parent materials (bedrock, sand, gravel) within an actively deforming mélange.
The characteristics of the more matrix-dominated, locally fissile diamictons (Dmm) vary only in colour, likely reflecting a variable influence of their matrix constituents, with grey diamictons originating from local mudstones and dark brown diamictons from the Paskapoo Formation sandstone. This variation is best illustrated by section 3 (Fig. 16), where five lithofacies can be identified:
1. LF 1 is a Dmm/Dml with attenuated intraclasts (boudins and stringers) of both mudstone and sand. This is separated from overlying LF 2 by a lens of interbedded and upward-coarsening sand and matrix-supported gravel with discontinuous diamicton beds. These lenses possess a planar top and convex base, resulting in a distinctive channel-like (convexo-planar) cross section;
2. LF 2 is a Dmm containing large, internally heavily deformed sand and gravel intraclasts (rafts) as well as lenses similar to those at the junction with LF 1;
3. LF 3 is a Dmm/Dml that grades upwards into a Dms composed of discontinuous and contorted beds that merge laterally into the attenuated limb of a large composite raft of Paskapoo Formation and Empress Group;
4. LF 4 lies above the raft and like LF 3 comprises a sequence of Dmm/Dml grading upwards to Dms capped by more-fragmented rafts of Paskapoo Formation and Empress Group materials. This raft pinches out towards the southwestern end of the section, where it forms a thin, highly attenuated tail separating LF 4 and LF 5; and
5. LF 5 is a Dml/Dmm in which pseudo-lamination is developed only in a thin zone directly above the raft tail and grades rapidly upwards to a fissile structure before becoming massive.
The sedimentary characteristics of these lithofacies are typical of subglacial traction tills and glacitectonites, with the channel-like form of the convexo-planar lenses of bedded sediment considered diagnostic of subglacial canal infills formed within accreting deforming layers (Eyles et al., Reference Eyles, Sladen and Gilroy1982; Clark and Walder, Reference Clark and Walder1994; Evans et al., Reference Evans, Owen and Roberts1995, Reference Evans, Phillips, Hiemstra and Auton2006; Evans, Reference Evans2018). Stress directions are evident in clast macrofabrics, with a clear WNW-ESE a-axis alignment in LF 1 (F1) being replaced by a NW-SE alignment in LF 3 (F2). This alignment is also apparent in the Dml and overlying fissile Dmm of LF 5 (F3 and F4), which changes to a southerly dip in the top of LF 5 (F5). These fabric alignments are compatible with the surface flutings in the area (cf. Atkinson et al., Reference Atkinson, Utting and Pawley2014) but importantly, clasts dip in the down-ice flow direction in the capping till (LF 5), contrary to the normal alignment of passive strain markers. As the till has been plastered over a significant bedrock raft assemblage (LFs 3 and 4), these macrofabrics likely reflect a perturbation in the stress regime due to the presence of this raft (obstacle) within the deforming bed. This is illustrated also by macrofabrics in the diamictons that cap multiple rafts in section 4 (Fig. 17). The southerly-directed stress of the last ice flow imprint at Drayton Valley is recorded also in the emplacement of a mudstone glacitectonite raft over a diamicton in section 5 (Fig. 18), in which clasts were subject to alignment by the imposed stress of the overriding raft.
Southeasterly ice flow is recorded also in clast macrofabrics from diamictons at the base and top of a sandstone raft in section 2 (Fig. 15). This is reflected in the fabric from the capping diamicton, which characterises a basal shear zone comprising thrust interdigitated Empress Group, truncated by multiple convexo-planar lenses of bedded sediments. Such characteristics are all typical of a subglacial till produced by alternating sliding-bed and deformation processes (Evans et al., Reference Evans, Phillips, Hiemstra and Auton2006; Piotrowski et al., Reference Piotrowski, Larsen, Menzies and Wysota2006; Evans, Reference Evans2018).
In summary, the Drayton Valley sections reveal a progression from: (1) internally relatively undeformed, composite rafts comprising Paskapoo Formation overlain by Empress Group gravels and sands; to (2) structurally complex rafts of bedrock and quartzite-rich gravels repeated by large-scale thrusting and folding; to c) intensely deformed and disrupted rafts. The complexity of the Quaternary sequence exposed within these sections qualifies it as a glacitectonic mélange (sensu Cowan, Reference Cowan1985; cf. Evans, Reference Evans2018). The geometry and sense of displacement of the thrusts, as well as the asymmetry of the folds and asymmetrical shape of the displaced blocks within this mélange, record a relatively consistent E/SE-directed sense of shear, compatible with the regional pattern recorded by the streamlined landforms in the area.
Warburg
A cluster of depositional crag-and-tail or stoss-and-lee megaflutings are clearly visible within the fluted and drumlinised terrain around Warburg, south of Strawberry Creek (Fig. 19a). That the crag or stoss-ends are bedrock rafts is evident in their morphology, which predominantly features straight-sided and largely flat-topped mounds associated with either relatively short, downflow paraxial ridges or single flat-topped flutings, as well as the exposure of rafted Paskapoo Formation sandstone within the quarried crags of the megaflutings (Fig. 19a, S1 and S2 sections). The megaflutings dissipate westwards (downflow), where they widen and flatten, presumably as a result of the reduced influence of the stoss rafts with distance (cf. Boulton, Reference Boulton1976; Rose, Reference Rose1989; Benn, Reference Benn1994; Evans et al., Reference Evans, Nelson and Webb2010, Reference Evans, Roberts, Hiemstra, Nye, Wright and Steer2018; Eyles et al., Reference Eyles, Boyce and Putkinen2015). Very short flutings or downflow paraxial ridges likely reflect very late stage emplacement of the rafts, explaining also their relatively modest streamlining (cf. Evans and Rea, Reference Evans, Rea and Evans2003; see Evans [2018] for modern, minor fluting analogs). Together with several broad hummocky arcs of streamlined mounds (likely thrust masses), they form the outermost 20 km of the subglacial bedform imprint of a deglacial fast-flow lobe that moved west-southwest from the Edmonton area towards the trunk zone of the High Plains Ice Stream near Drayton Valley (Atkinson et al., Reference Atkinson, Utting and Pawley2014).
(color online) Depositional crag-and-tail or stoss-and-lee megaflutings near Warburg: (a) annotated LiDAR digital elevation model of the glacial landforms in the area showing sections at S and N. (b) Top panel shows road cut through a less streamlined raft at location “S,” including clast macrofabric from the capping till. Bottom panels show photograph and sketch of quarry exposure in the margin of a megafluting located at “N,” including clast macrofabric from the sandy glacitectonite. Dmm–massive, matrix-supported diamicton. MLA–mean lineation azimuth.

Road cuts through two of the less streamlined rafts located to the south-southeast of Warburg reveal significant bedrock outcrops comprising subhorizontal to very gently dipping, well-bedded Paskapoo Formation sandstone and minor mudstone strata. The largest of the exposures (location S2; Fig. 19a) displays at least 3 m of bedded Paskapoo Formation that is characterised by variably coherent and incoherent beds of sandstone and mudstone. The more coherent sandstone beds represent more indurated/highly cemented layers, within which subvertical fractures represent pre-existing joints that create a blocky appearance (Fig. 19b, upper). A thin (≤1 m) unit of heavily brecciated mudstone separates the upper sandstone beds from a capping diamicton, which is massive and clay matrix supported but also contains numerous stringers and wisps of sand and is fissile, likely the product of attenuation and pulverization of sandstone intraclasts (Fig. 19b, upper). These characteristics are indicative of a subglacial traction-till origin (sensu Evans et al., Reference Evans, Phillips, Hiemstra and Auton2006; Evans, Reference Evans2018), verified by a northeasterly to east-northeasterly dipping clast macrofabric, indicative of imposed stress from that direction and compatible with the alignment of the flutings.
A quarry exposure along the margin of a megafluting located north of Warburg (location N; Fig. 19a) provides a representative stratigraphy of the processes operating in the lee side of a raft. This comprises a lower heterogeneous, sandy diamicton, containing lenses and stringers of sand and attenuated sandy intraclasts (Type III/IV mélange), separated by a thin shear zone from an overlying grey/brown, clast-poor and massive, matrix-supported diamicton with pseudo-laminated, attenuated clay stringers (Fig. 19b, lower). The shear zone at this location comprises a 0.20-m-thick fissile unit of mixed sand and silt/clay pseudo-laminae and sandy diamicton (Type IV mélange) that passes laterally to wrap around a lenticular raft of Paskapoo Formation, itself separated into two parts by a shallow thrust. A thinner raft occurs also at the base of the sequence and is separated from the overlying raft by a thrust-stacked sequence of gravel lenses and heterogeneous diamicton. The numerous thrusts, overturned folds, and fissile structures throughout the sequence, in addition to a clast macrofabric from the lower diamicton, indicate that the deposits are glacitectonites capped by till, all emplaced by ice flow from the northeast. A northeasterly dipping fabric on the flank of an ENE-WSW aligned megafluting is not unusual for deformation-generated bedforms of this type, being reminiscent of herringbone fabrics documented in minor flutings (e.g., Rose, Reference Rose1989, Reference Rose1992; Benn, Reference Benn1994; Evans et al., Reference Evans, Nelson and Webb2010). The attenuated sandstone rafts likely represent fragments of the stoss raft, transported downflow and gradually disaggregated to form bedrock glacitectonite.
Wandering River
Evidence of the initial emplacement of ploughed rafts, indicative of lodgement in subglacial deforming materials before lee-side streamlining, is well illustrated by a cluster of rafts and lee-side prows in the Wandering River area (Fig. 20). These features lie on the outer edge of the southward-orientated CAIS footprint but are associated with more subtle, superimposed WNW-ESE aligned flutings that record a late-stage/deglacial ice flow pattern. This association is manifest in the orientation of the sediment prows at the front of the megablocks (0.15–0.52 km2), which clearly show the direction in which they were pushed and crumpled based upon the multiple, arcuate ridge crests. A relatively short transport distance and lack of intensive ice overriding is evidenced by both the presence of the prows and the lack of surface smoothing of the rafts. The shallow, straight-sided depressions located immediately up-ice of the rafts are significantly (2.0–3.3 times) longer than the flow-parallel (i.e., compressed) block width and, as such, may potentially represent the source of both the bedrock raft and sediments forming the prow. The weak, ridge-like summits of the blocks could be an indication of either compression (i.e., thrusting and/or tight folding) within the raft or the expression of bedding exposed by the back rotation/tilting of the raft as it was accreted onto the up-ice side of the developing frontal prow. Consequently, these landforms constitute clones of hill-hole pairs, in that they comprise a relatively coherent raft and less coherent sediment prow lying downflow of its source depression.
(color online) Annotated LiDAR digital elevation model of the ploughed megablocks (rafts) near Wandering River.

GLACITECTONIC RAFT PROCESS-FORM CONTINUUM
The case studies presented here allow the development of a conceptual process-form continuum for glacitectonic rafts, from which implications for the development of subglacially streamlined landforms are postulated. A range of landforms is identified that represents a temporal or developmental hierarchy (Fig. 21).
(color online) Idealised sketches showing: (a) a temporal process–form continuum of glacitectonic raft development and modification into subglacially streamlined landforms (bedforms) based upon ergodic principles; and (b) the relationships between glacitectonic landforms, rafts, and other diagnostic landforms associated with crosscutting and oscillating ice stream activity. MSGL–megascale glacial lineation. CSR–crevasse squeeze ridge.
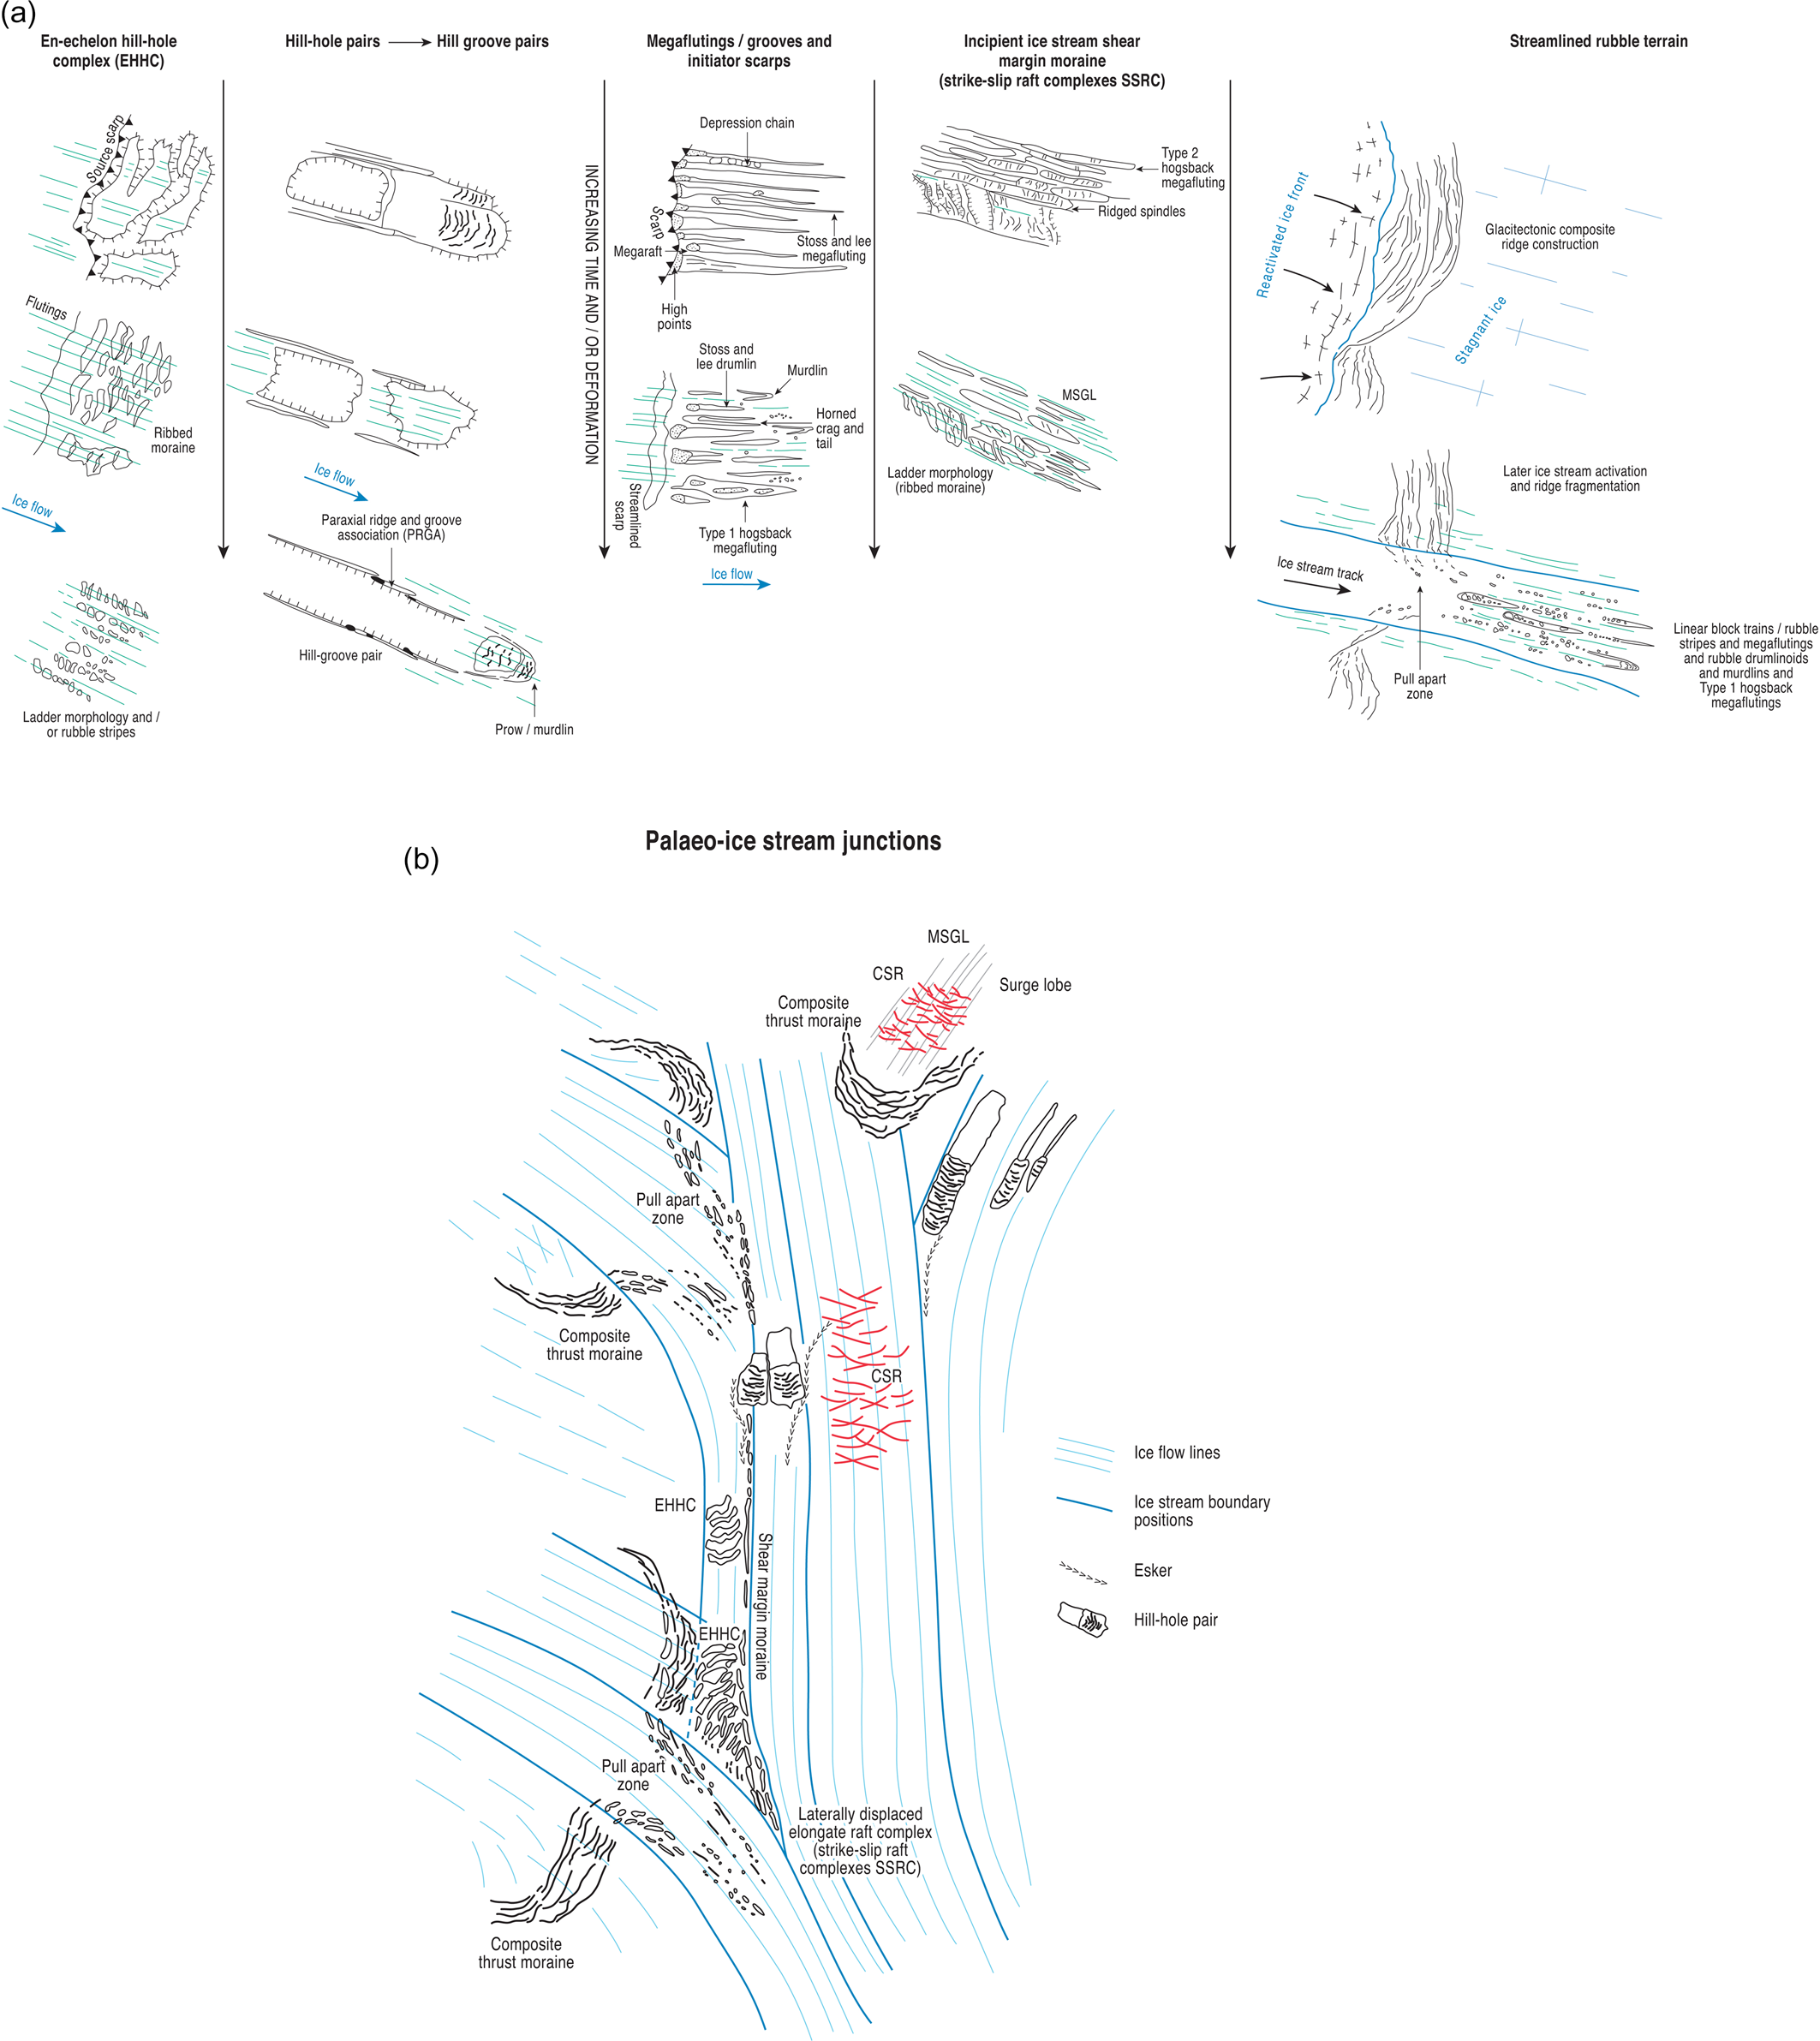
The earliest stage is the production of incipient rafts, which appear in a range of settings representative of the dislocation of bedrock strata and/or Quaternary sediments, ubiquitous on the prairies and high plains (Stalker, Reference Stalker1973, Reference Stalker1975, Reference Stalker1976; Moran et al., Reference Moran, Clayton, Hooke, Fenton and Andriashek1980; Stalker and Barendregt, Reference Stalker and Barendregt1988; Aber et al., Reference Aber, Croot and Fenton1989; Evans et al., Reference Evans, Clark and Rea2008, Reference Evans, Hiemstra, Boston, Leighton, Ó Cofaigh and Rea2012). They predominantly comprise tabular blocks that are displaced laterally and can be traced to their source depressions, where they can be linked to one another by the close fit of their straight bounding edges, which demarcate transcurrent (wrench/strike-slip) faults and tension scarps, potentially in some cases developed at pre-existing bedrock fractures. This style of bedrock dislocation and transport was described by Stalker (Reference Stalker1976), who reported huge (≤10-m-thick and ≤10 km2 in area) plate-like rafts. We identify such features as en échelon hill-hole complexes (EHHCs), hill-hole pairs, laterally displaced elongate raft complexes (here called strike-slip raft complexes, SSRCs), and pull-apart zones. Additionally, the close association in some settings between the initiation zones of megaflutings/grooves and bedrock escarpments or the margins of preglacial valleys strongly suggests that they were initiator scarps from which blocks were effectively plucked (detached). A common association between preglacial and subglacial valley margins and glacitectonic bedrock disturbance is widely acknowledged in the region (e.g., Tsui et al., Reference Tsui, Cruden and Thomson1989; Evans et al., Reference Evans, Hiemstra, Boston, Leighton, Ó Cofaigh and Rea2012; Andriashek and Atkinson, Reference Andriashek and Atkinson2007; Atkinson et al., Reference Atkinson, Andriashek and Slattery2013), where the applied stress is compressive, but we propose here that raft liberation can also be extensional and involve the reworking of pre-existing slope failures (e.g., Campbell and Evans Reference Campbell and Evans1990; Evans et al., Reference Evans, Hiemstra, Boston, Leighton, Ó Cofaigh and Rea2012; Fig. 22). Collapse of the valley walls was likely enhanced during glaciation, in part due to a steepening of the porewater pressure gradient between the bedrock and the lower-pressure valleys, reducing the shear strength of the valley walls and promoting their preferential erosion by overriding ice (Moran et al., Reference Moran, Clayton, Hooke, Fenton and Andriashek1980).
(color online) Conceptual models of the development of rafts in association with preglacial valley margins, which acted as initiator scarps from which blocks were removed.

With increasing time and/or subglacial deformation, the various raft types are modified such that they are progressively fragmented, smoothed, and then streamlined into landforms resembling those that are traditionally regarded as more typical of subglacial bedforms (Fig. 21a). Gradual fragmentation of EHHCs results in the development of multiple, closely spaced, and ice flow-transverse ridges, thereby resembling ribbed moraine, and eventually ladder-type morphologies and/or rubble stripes. The superimposition of fast-flow zones (ice streams) over compressional thrust masses, such as composite ridges, may lead to the fragmentation of the ridge crests and their plan form rotation in a downflow direction, effectively representing pull-apart zones. The liberated blocks are then subject to downflow modification into linear block trains or rubble stripes, stoss-and-lee type megaflutings, horned crag-and-tails, rubble drumlinoids, and murdlins; this landform assemblage constitutes an immature palaeo–ice stream footprint, indicative of the last stages of ice stream activity during ice sheet recession.
Hill-hole pairs may evolve ultimately into hill-groove pairs, comprising isolated plough marks or shallow grooves flanked by paraxial ridges and with the ploughing block/raft either in place and fronted by a prow or buried within the prow. The absence of raft and prow leaves a PRGA, which indicates that the raft was subject to disaggregation downflow, leaving fragments within the inset sequences of paraxial ridges. The raft and prow constitute an assemblage akin to a ploughing clast in till sedimentology (Eyles et al., Reference Eyles, Boyce and Putkinen2015; Evans et al., Reference Evans, Roberts, Hiemstra, Nye, Wright and Steer2018), and at landform scale, the prow resembles a murdlin (Stalker, Reference Stalker1973; Fig. 1). This hypothesis for murdlin production is especially appropriate when murdlins lie within streamlined assemblages of rafts and can be tested, as it predicts that most murdlins should contain some vestiges of the raft used to construct them.
The lateral migration and/or growth of ice stream margins involves the ingestion of disaggregated thrust masses into the deforming layer of the ice stream bed. This is apparent in the development of SSRCs, which are elongate raft complexes that have been displaced variable distances downflow along multiple transcurrent faults; this process involves the separation of thrust masses into slices along multiple transcurrent faults and the development of extensional failures and pull apart to form elongate tabular rafts with transverse surface ridges (ridged spindles). This creates a ladder-type morphology or narrow zones of ribbed moraine similar to those identified by Dunlop and Clark (Reference Dunlop and Clark2006) as well as incipient MSGLs. The occurrence of SSRCs at the margins of palaeo–ice stream beds that were active immediately before the onset of regional deglaciation indicates that they potentially represent the initial formation of ice stream shear margin moraines (sensu Dyke and Morris, Reference Dyke and Morris1988; Stokes and Clark, Reference Stokes and Clark2002). A sharp but gradational change from ladder- and ridged spindle–type morphologies to Type 2 hogsback flutings and MSGLs records the increasing modification or ingestion of the thrust masses by the migrating ice stream margin.
After being excavated, bedrock rafts are found in various relationships with the megaflutings/grooves that occur downflow (Figs. 21a and 23). These relationships, together with the downflow change in megafluting/groove morphology, indicate that the rafts have an important role in megafluting/groove production. First, their dislodgement and transport results in substrate ploughing to form U-shaped grooves, the sedimentologic impact of which is well illustrated by the deformation structures in the Athabasca megaflutings. Depression chains on the megagroove floors are reminiscent of the numerous fracture hollows observable at much smaller scales in bedrock grooves and striations, related to the jerky motion of the raft moving over its bed (Iverson, Reference Iverson1990, Reference Iverson and Menzies1995; Rea, Reference Rea1996); this could be related to the stick-slip motion of basal ice flow (cf. Fischer and Clarke, Reference Fischer and Clarke1997; Boulton and Dobbie, Reference Boulton and Dobbie1998; Fischer et al., Reference Fischer, Clarke and Blatter1999), with the raft acting as the erodent and/or the periodic locking up of the shear zone/thrust forming the décollement surface at the base of the raft. Second, their later lodgement leads initially to the construction of a murdlin or a crag-and-tail and ultimately to a stoss-and-lee type fluting or drumlin, whereby subglacially deforming materials accumulate in the low-pressure cavity on the lee side of the raft, as described at smaller scales with lodged boulders on recently deglaciated forelands (Boulton, Reference Boulton1976; Rose, Reference Rose1989; Benn, Reference Benn1994; Evans et al., Reference Evans, Nelson and Webb2010, Reference Evans, Roberts, Hiemstra, Nye, Wright and Steer2018; Eyles et al., Reference Eyles, Boyce and Putkinen2015; Evans, Reference Evans2018). Finally, their gradual fragmentation results in Type 1 hogsback flutings and, ultimately, to downflow fluting/groove relief reduction and dissipation.
(color online) Conceptual model explaining the genetic association between bedrock rafts and various subglacial landforms, including megaflutings/grooves, paraxial ridge and groove associations (PRGAs), hill-groove pairs, prows, and rubble stripes (flutings).

DISCUSSION
The conceptual case presented here has wider implications for the evolution of landform–sediment assemblages of former ice sheet beds in soft substrates. Clearly, the effects of glacial erosion on the Cretaceous bedrock underlying the SW Laurentide Ice Sheet have given rise to the ubiquity of glacitectonic landforms and particularly rafts in Alberta. The creation of compressive glacitectonic landforms (moraines), which are easily developed in this bedrock, give rise to the fragmentation of the substrate and the development of localised antecedent conditions necessary for the construction of subglacial bedforms, questioning the universal applicability of bedform genetic models such as till instability (Dunlop et al., Reference Dunlop, Clark and Hindmarsh2008; Stokes et al., Reference Stokes, Fowler, Clark, Hindmarsh and Spagnolo2013; Fowler and Chapwanya, Reference Fowler and Chapwanya2014; Barchyn et al., Reference Barchyn, Dowling, Stokes and Hugenholtz2016) and traction rib generation (Sergienko and Hindmarsh, Reference Sergienko and Hindmarsh2013; Stokes et al., Reference Stokes, Margold and Creyts2016). Additionally, the predominantly subhorizontal bedrock strata, when combined with the effects of ice sheet loading on increasing porewater pressure, particularly along sandstone–mudstone interfaces, likely make it susceptible to the development of extensive décollement zones and the production of areally large but thin rafts (Stalker, Reference Stalker1975, Reference Stalker1976).
Assemblages of such rafts, identified now with greater clarity using LiDAR imagery, strongly resemble the “jigsaw puzzle” fragments used by Hattestrand and Kleman (Reference Hättestrand and Kleman1999) to propose a genesis for ribbed terrain that involves the fracturing and lateral shifting of frozen till sheets in the cold/warm-based boundary zones beneath ice sheets. We support this notion of the fragmentation of thin rafts moving over a shallow décollement zone, but one that is related to failure in subhorizontal bedrock strata more readily than, but in addition to, till alone. Ladder-type morphologies, also recognised within the ribbed terrain continuum by Dunlop and Clark (Reference Dunlop and Clark2006), appear to have been created in the same way in EHHCs and SSRCs. We therefore propose that ribbed terrain construction is initiated in soft bedrock terrains by jigsaw puzzle–style fragmentation of rafts, which become further fragmented and smoothed and/or streamlined downflow. These antecedent conditions for subglacial bedform production could be initiated by ice–substrate coupling due to spreading frozen patches (Tulaczyk et al., Reference Tulaczyk, Kamb and Engelhardt2000b; Bougamont et al., Reference Bougamont, Tulaczyk and Joughin2003a, Reference Bougamont, Tulaczyk and Joughin2003b) and the laterally variable porewater pressure regimes associated with that freeze-on (cf. Bluemle and Clayton, Reference Bluemle and Clayton1984; Bluemle, Reference Bluemle and Aber1993; Evans et al., Reference Evans, Atkinson and Phillips2020). The corollary of this proposal is that well-preserved incipient rafts are representative of areas of the ice sheet bed that were subject to late-stage freeze-on during ice stream shutdown. However, an important characteristic of the Cretaceous bedrock in Alberta that also must be considered is the occurrence of shallow gas hydrates. The interaction of glacial ice and shallow gas in the Western Canada Sedimentary Basin has been described by Grasby et al. (Reference Grasby, Osadetz, Betcher and Render2000), Grasby and Chen (Reference Grasby and Chen2005), Grasby (Reference Grasby2013), and Chen et al. (Reference Chen, Shuai, Osadetz, Hamblin and Grasby2015) as the meltwater displacement of brines and the concomitant triggering of methanogenesis. Subsequent degassing has been used to explain pockmarks and mounds on submarine beds of former ice sheets (Crémière et al., Reference Crémière, Lepland, Chand, Sahy, Condon, Noble, Martma, Thorsnes, Sauer and Brunstad2016; Mazzini et al., Reference Mazzini, Svensen, Forsberg, Linge, Lauritzen, Haflidason, Hammer and Planke2017; Nixon et al., Reference Nixon, Chand, Thorsnes and Bjarnadóttir2019) and doughnut-shaped ring forms (blowouts) around glacitectonic features in Alberta (Evans et al., Reference Evans, Atkinson and Phillips2020). Moreover, glacitectonic rafts and hill-hole pairs on the bed of the former Barents Sea Ice Sheet are argued by Winsborrow et al. (Reference Winsborrow, Andreassen, Hubbard, Plaze-Faverola, Gudlaugsson and Patton2016) to be sticky spots related to porewater piracy and sediment stiffening in response to subglacial gas-hydrate accumulation.
Once in motion, it appears that rafts were capable of grooving the substrate. At the largest scales, this may involve the construction of hill-groove pairs and PRGAs, such as those observed in the Jenkins Lake-Grosmont area (Fig. 8). Here, the production of narrow ridged rafts defined by multiple parallel faults relates to a fast-flowing tributary of the northern CAIS; their excellent preservation indicates late-stage formation, likely during patchy freeze-on of the ice stream bed. At smaller scales, escarpments and palaeovalley walls (initiator scarps) clearly seed megaflutings/grooves, which dissipate in relief downflow as rafts become fragmented. The proposed erosional origin for the Athabasca giant flutings suggests that they must be included in existing inventories of megagrooves (Newton et al., Reference Newton, Evans, Roberts and Stokes2018) in both bedrock and soft-sediment substrates, and moreover their initiation by ploughing rafts might be relevant to megagroove production in both settings. In the production of the Alberta megagrooves, the raft ploughs through the ice stream bed (sediment and/or bedrock) and acts in the same way as an erodent (cf. Eyles et al., Reference Eyles, Putkinen, Sookhan and Arbelaez-Moreno2016). Lodgement of the raft at any stage after its displacement, followed by continued bed deformation, is then manifest as horned crag-and-tails and stoss-and-lee megaflutings/drumlins. Late-stage lodgement is clearly manifest in rafts with bulldozed prows (cf. Eyles et al., Reference Eyles, Boyce and Putkinen2015; Evans et al., Reference Evans, Roberts, Hiemstra, Nye, Wright and Steer2018), especially where raft surfaces still display unmodified structural ridges. We propose that the enigmatic forms called murdlins (Stalker, Reference Stalker1973) are a manifestation of the raft bulldozing process and lie on a process–form continuum between ploughed blocks and Type 1 hogsback flutings, which can then develop into horned crag-and-tails or stoss-and-lee megaflutings.
Fragmented and lodged rafts can also be streamlined within the subglacial deforming layer to form linear block trains or rubble stripes, Type 1 hogsback flutings, and rubble drumlinoids. This range of features constitutes what has previously been classified in Alberta as “rubble terrain” and “aligned rubble” (Fenton et al., Reference Fenton, Langenberg and Pawlowicz1993; Atkinson et al., Reference Atkinson, Utting and Pawley2018; Evans et al., Reference Evans, Atkinson and Phillips2020) and has been recognised also in submarine settings (Ruther et al., Reference Ruther, Andreassen and Spagnolo2013, Reference Ruther, Andreassen, Spagnolo, Dowdeswell, Canals, Jakobsson, Todd, Dowdeswell and Hogan2016). Verification of raft fragmentation and emplacement within subglacial deforming-layer tills and glacitectonites is provided by the occurrence of bedrock rafts in stratigraphic successions associated with ice stream marginal sedimentation (Evans et al., Reference Evans, Clark and Rea2008, Reference Evans, Hiemstra, Boston, Leighton, Ó Cofaigh and Rea2012; Fig. 21) as well as in the cores of landforms within streamlined rubble terrain, as demonstrated by the Drayton Valley, Lac la Biche crag-and-tail, Goodridge, Warburg, and Lottie Lake case studies (Figs. 10, 12–14, and 19).
Raft liberation, ploughing, and fragmentation and disintegration are critical to the development of subglacial deforming layers and the tills and glacitectonites of soft-bedded ice sheets and ice streams (Evans, Reference Evans2018). Till production and replenishment or continuity in areas of soft bedrock strata require an erosional mechanism that incorporates large volumes of parent material quickly, especially to produce complex sequences of thick till. The in situ bedrock rafts described here are associated sedimentologically with complex glacitectonites, derived partially from the disintegration of the rafts in combination with the cannibalisation of pre-existing Quaternary deposits. Such stratigraphic relationships support the notion that the rafts were ploughed through the substrate, both mixing it and producing landforms such as prows and paraxial ridges. Lodging of rafts and their moulding as part of the subglacial deforming layer are indicated by the various streamlined landforms and rubble terrain but also sedimentologically by the occurrence of overlying carapaces of subglacial traction till. The stratigraphic exposures at Drayton Valley, Lac la Biche, Goodridge, Warburg, and Lottie Lake thereby represent the early stages of subglacial till development through the process of constructional deformation, whereby the disturbance of subtill materials by raft ploughing has liberated soft clasts, creating tectonic/depositional slices (cf. Boulton et al., Reference Boulton, Dobbie and Zatsepin2001) or mélanges. The incorporation, mixing, and attenuation of these cannibalised materials and increasingly fragmented raft ploughs provided the ingredients for homogenisation into deforming layer tills (e.g., Hicock and Dreimanis, Reference Hicock and Dreimanis1992a, Reference Hicock, Dreimanis, Clark and Lea1992b; Benn and Evans, Reference Benn and Evans1996, Reference Benn and Evans1998, Reference Benn and Evans2010; Evans, Reference Evans2018; Fig. 24). Ubiquitous soft-sediment deformation and fluidization structures indicate that high porewater pressures, induced within the substrate by ploughing rafts (cf. Bluemle and Clayton, Reference Bluemle and Clayton1984; Bluemle, Reference Bluemle and Aber1993; Evans et al., Reference Evans, Atkinson and Phillips2020), are also critical to this homogenisation process.
(color online) Idealised sketch showing the typical core of a rubble mound (i.e., a murdlin) in which a bedrock raft has ploughed up a prow and then been overrun and capped by subglacial deforming-layer deposits comprising a vertical continuum of glacitectonite and subglacial traction till. This sequence represents the sedimentologic implications of megablock production in ice stream footprints.

This genesis of landform–sediment associations has implications for models of palaeo–ice stream operation in the Laurentide Ice Sheet. A morphological evolution of glacitectonic landforms and rafts takes place with increasing time and/or subglacial deformation; that is, rafts are modified such that they are gradually fragmented, smoothed, and then streamlined into subglacial bedforms. In a broadly ergodic approach to geomorphology (more specifically a “relaxation time” model sensu Brunsden and Thornes, Reference Brunsden and Thornes1979; cf. Paine, Reference Paine1985) we have demonstrated that particular stages in raft evolution are captured when the overlying ice stream shuts down (Fig. 21b). The appearance of minimally modified EHHCs records early-stage ribbed terrain production where the ice stream had frozen to the substrate but retained sufficient momentum to fracture and laterally displace it along a relatively shallow subhorizontal décollement, forming a jigsaw puzzle topography before ice stream shutdown (e.g., Figs. 7 and 9d). Basal freeze-on during ice stream shutdown has been previously proposed (Tulaczyk et al., Reference Tulaczyk, Kamb and Engelhardt2000a, Reference Tulaczyk, Kamb and Engelhardt2000b; Bougamont et al., Reference Bougamont, Tulaczyk and Joughin2003a, Reference Bougamont, Tulaczyk and Joughin2003b; Christoffersen and Tulaczyk, Reference Christoffersen and Tulaczyk2003a, Reference Christoffersen and Tulaczyk2003b; Christoffersen et al., Reference Christoffersen, Tulaczyk, Carsey and Behar2006, Reference Christoffersen, Tulaczyk and Behar2010) but could also be related to the maintenance of cold ice conditions during rapid ice stream margin migration (Schoof, Reference Schoof2012). Although such studies have not proposed large-scale bedrock freeze-on and raft detachment, Stokes et al. (Reference Stokes, Clark, Lian and Tulaczyk2006, Reference Stokes, Lian, Tulaczyk and Clark2008) have related ribbed terrain construction to such a shutdown/freeze-on process. An alternative, but not unrelated, process–form regime that could have been entirely, or at least partially, responsible for such landforms relates to the operation of meltwater pathways common along ice stream marginal shear zones (Schoof, Reference Schoof2004; Meyer et al., Reference Meyer, Yehya, Minchew and Rice2018; Meyer and Minchew, Reference Meyer and Minchew2018). Strain heating along shear zones increases the rate of meltwater production, which is able to drain effectively to the bed due to the concentration of crevasses in these zones. Extensive esker and tunnel channel networks along the marginal zones of the CAIS and Lac la Biche Ice Stream (Atkinson et al., Reference Atkinson, Utting and Pawley2014, Reference Atkinson, Utting and Pawley2018) document the occurrence of concentrated subglacial meltwater drainage pathways. The increased availability of subglacial water along the margins of these palaeo–ice streams may have promoted localised hydrofracturing of existing planes of weakness in the bed. This may have been a significant process during the more advanced stages of Laurentide Ice Sheet recession, for example, during the Bølling-Allerød warm phase, an interval during which palaeo–ice stream surging is widely reported (cf. Evans et al. Reference Evans, Lemmen and Rea1999, Reference Evans, Clark and Rea2008, Reference Evans, Storrar and Rea2016, Reference Evans, Atkinson and Phillips2020; Ó Cofaigh et al., Reference Cofaigh, Evans and Smith2010).
The laterally zoned assemblages of the widening margins of palaeo–ice stream footprints display the early (SSRCs) and more advanced (ridged spindles and hogsback megaflutings) stages of subglacial bedforms associated with the development and migration of an ice stream shear margin. These assemblages facilitate a better understanding of some of the problems of lateral shear margin moraine production (cf. Dyke and Morris, Reference Dyke and Morris1988; Dyke et al., Reference Dyke, Morris, Green and England1992; Stokes and Clark, Reference Stokes and Clark2002). Normally, such moraines are described as discontinuous chains of segments up to 70 km long, up to 500 m wide, and tens of metres high and composed of drumlinized till, with individual segments often offset rather than running continuously end-on-end. Numerical modelling by Hindmarsh and Stokes (Reference Hindmarsh and Stokes2008) suggested that such moraines are the product of net sediment accumulation in the transition zone between fast-sliding ice and the cold-based ice beyond the ice stream footprint. Our observations, particularly at the margin of the Lac la Biche Ice Stream, indicate that all the characteristics of ice stream shear margin moraines can be created by the fragmentation of the frozen bed zone by the opening of extensional structures transverse to ice flow to form ladder-type morphologies and localised compression to form ridged spindles (Figs. 9b, 12, and 21). This reflects the marginal expansion or ice stream widening into previously frozen bed zones (Kleman and Glasser, Reference Kleman and Glasser2007) and the gradual streamlining of ridged spindles into hogsback megaflutings, which give way to MSGLs towards the centreline of the ice stream bed.
This migration of ice stream margins is associated with wider-scale overprinting of subglacial landforms and dynamic ice stream behaviour in the SW Laurentide Ice Sheet (Evans et al., Reference Evans, Clark and Rea2008, Reference Evans, Young and Cofaigh2014, Reference Evans, Atkinson and Phillips2020; Ross et al., Reference Ross, Campbell, Parent and Adams2009; Ó Cofaigh et al., Reference Cofaigh, Evans and Smith2010). The spatial and temporal evolution of rafts, particularly their preservation as incipient rafts/ploughs, provides a clear indication of late-stage ice stream migration and flow switching. This is consistent with spreading frozen bed conditions and concomitant variations in the lateral porewater pressure gradient associated with ice stream shutdown, although the role of gas hydrates is also potentially influential (cf. Moran et al., Reference Moran, Clayton, Hooke, Fenton and Andriashek1980; Bluemle and Clayton, Reference Bluemle and Clayton1984; Tulaczyk et al., Reference Tulaczyk, Kamb and Engelhardt2000b; Bougamont et al., Reference Bougamont, Tulaczyk and Joughin2003a, Reference Bougamont, Tulaczyk and Joughin2003b; Grasby, Reference Grasby2013; Chen et al., Reference Chen, Shuai, Osadetz, Hamblin and Grasby2015; Winsborrow et al., Reference Winsborrow, Andreassen, Hubbard, Plaze-Faverola, Gudlaugsson and Patton2016; Evans et al., Reference Evans, Atkinson and Phillips2020). The reactivation of deforming bed conditions (ice stream switch-on/migration) after raft detachment is manifest in the ploughing and gradual moulding into the continuum of subglacial bedforms highlighted earlier. The ice stream migration process is captured in the examples of superimposition of fast-flow zones over compressional thrust masses (Figs. 11, 12, and 21) to form immature palaeo–ice stream footprints or streamlined rubble terrain. Importantly, the construction of large composite thrust moraines is unlikely to take place beneath thick ice. Hence, their appearance as partially streamlined features within complex ice sheet bedform assemblages strongly suggests they were constructed during relatively late phases of ice sheet thinning and freeze-on and/or the migration or piracy of meltwater between ice streams (Anandakrishnan and Alley, Reference Anandakrishnan and Alley1997). This entailed the advance of lobate ice fronts that were reactivated within downwasting ice masses immediately before the switch on of fast-flow corridors (Fig. 21b). Ice stream migration and flow switching are also well illustrated in zones of ice stream convergence, best exemplified at the junction of the ice stream onset zone that joins the Lac la Biche trunk east of Ashmont (Fig. 12a). Here, the NW-SE flowing Lac la Biche Ice Stream margin migrated westwards over the earlier WNW-ESE footprint of the onset zone, the northernmost extent of which had shut down and frozen onto its bed to form an EHHC; the vigorous NW-SE flow was then responsible for the further pull apart and rotation, followed by parallel fault fragmentation, of the ridges within the EHHC.
CONCLUSIONS
A range of subglacial landforms on the soft bed of the SW Laurentide Ice Sheet have been identified that represent a temporal or developmental hierarchy in the production and modification of glacitectonic rafts. Incipient rafts include en échelon hill-hole complexes (EHHCs), hill-hole pairs, strike-slip raft complexes (SSRCs), and pull-apart zones developed in composite thrust moraines. Jigsaw puzzle–style fragmentation of the rafts lends credence to previous hypotheses that transverse subglacial landforms are initiated in soft bedrock terrains by ice sheet freeze-on and displacement of the substrate along shallow décollement zones. Gradual fragmentation of EHHCs results in the development of smoothed ice flow-transverse ridges resembling ribbed moraine, and eventually ladder-type morphologies and/or rubble stripes. Hill-hole pairs evolve into hill-groove pairs, and these may display raft and prow associations and PRGAs, the development of which can explain the characteristics of the enigmatic murdlin landform. PRGAs, especially where they display raft fragments within the inset sequences of paraxial ridges, demonstrate that ploughing rafts disaggregate downflow. The dislodgement and transport of numerous rafts from initiator scarps result in their operation as erodents that perform substrate ploughing to form U-shaped grooves or giant flutings. Fluting/groove dissipation occurs as a result of raft fragmentation and lodgement, which in turn lead to the construction of murdlins, crag-and-tails, stoss-and-lee type flutings and drumlins, and Type 1 hogsback flutings.
During their evolution, rafts are subject to downflow modification into linear block trains or rubble stripes, stoss-and-lee type megaflutings, horned crag-and-tails, rubble drumlinoids, and murdlins. This landform assemblage constitutes an immature palaeo–ice stream footprint, one that eventually develops due to sustained fast ice flow into a mature footprint comprising MSGLs and ribbed terrain, in places adorned with geometric ridge networks (crevasse squeeze ridges). The lateral migration of ice stream margins involves the ingestion of disaggregated thrust masses, such that SSRCs form and become increasingly developed into ridged spindles, ladder-type morphologies, and narrow zones of ribbed terrain and Type 2 hogsback flutings in an assemblage that represents incipient ice stream shear margin moraine. Ice stream margin migration, particularly narrowing, as well as shutdown gives rise to freeze-on and hence glacitectonic displacement along shallow décollement zones, explaining the occurrence of subglacial bedforms on raft surfaces. Similarly, the stagnant ice bodies created by ice stream shutdown and thinning may be disrupted by the construction of composite thrust moraines in front of surging ice lobes, which in turn can locally cannibalise the thrust moraines beneath reactivated ice stream corridors.
The production and continuity of subglacial deforming layers (tills and glacitectonites) in the SW Laurentide Ice Sheet is conditioned by raft liberation, ploughing, and fragmentation and disintegration. The characteristic sedimentary record of such landscapes is one that displays variously disaggregated and ploughed bedrock rafts that are partially mixed with glacigenic deposits to form a glacitectonite–traction till continuum that is related to substrate cannibalisation and homogenization or constructional deformation.
Acknowledgments
DJAE thanks the Department of Geography, Durham University, for providing funds to undertake fieldwork in Alberta. A number of figures were drafted by Chris Orton of Durham University. ERP publishes with the permission of the director of the British Geological Survey. We are grateful for the comments by Laurence Andriashek (Alberta Geological Survey) as part of an internal review of this article. Thanks to Lewis Owen and Jason Dortch for their constructive comments.


 Open access