


INTRODUCTION
The densely anthropized Po Plain of northern Italy is characterized by seismically active buried compressional structures related to the Alps and Apennines fold-and-thrust belts (Fig. 1a; Bigi et al., Reference Bigi, Cosentino, Parotto, Sartori and Scandone1990; Livio et al., Reference Livio, Berlusconi, Michetti, Sileo, Zerboni, Trombino and Cremaschi2009, Reference Liu, Hirt, Schüler, Uebe, Zhu, Liu and Zhang2019; Michetti et al., Reference Michetti, Giardina, Livio, Mueller, Serva, Sileo and Vittori2012). Recent seismic events (since 1985; ISIDe Working Group, 2007) along the southern fringe of the Alps between Lake Iseo and Lake Garda have relatively low seismic releases and shallow crustal depths (10 ± 7 km). These are distinctively clustered, co-occurring with anticlines that rise with respect to the surrounding plain and form several isolated morphologies, including the Monte Netto and Castenedolo hillocks near the city of Brescia (Desio, Reference Desio1965; Fig. 1b). In the same area, the destructive December 25, 1222, Brescia earthquake (Intensity = IX on MCS [Mercalli-Cancani-Sieberg] scale; Guidoboni and Comastri, Reference Guidoboni and Comastri2005) also has been reported and possibly associated with these structures (Livio et al., Reference Livio, Berlusconi, Michetti, Sileo, Zerboni, Trombino and Cremaschi2009), thus confirming that this region of the northern Po Plain is characterized by potentially high seismic hazard (e.g., Faccioli, Reference Faccioli2013; Vanini et al., Reference Vanini, Corigliano, Faccioli, Figini, Luzi, Pacor and Paolucci2018).
(a) Structural map of the Po Plain of northern Italy with location of the Monte Netto hillock, as well as of key drill cores from the literature: Ghedi RL1, Pianengo RL2, Cilavegna RL3, Agrate RL4, Trezzo RL5, Cremignane RL6, Palosco RL7 (Scardia et al., Reference Scardia, Muttoni and Sciunnach2006, Reference Scardia, De Franco, Muttoni, Rogledi, Caielli, Carcano, Sciunnach and Piccin2012). Also indicated are the locations of Pleistocene magnetostratigraphic sections from the literature discussed in the text: Arda (Monesi et al., Reference Monesi, Muttoni, Scardia, Felletti, Bona, Sala, Tremolada, Francou and Raineri2016) and Enza (Gunderson et al., Reference Gunderson, Pazzaglia, Picotti, Anastasio, Kodama, Rittenour and Frankel2014). (b) Shaded relief model of the Monte Netto and nearby Castenedolo hillocks with traces of main buried thrusts (after Livio et al., Reference Livio, Berlusconi, Michetti, Sileo, Zerboni, Trombino and Cremaschi2009), including the Capriano del Colle Backthrust. (c) Geological sketch map of the Monte Netto area. (d) GoogleEarth™ 3D image of the Monte Netto hillock with location of the sampling areas.
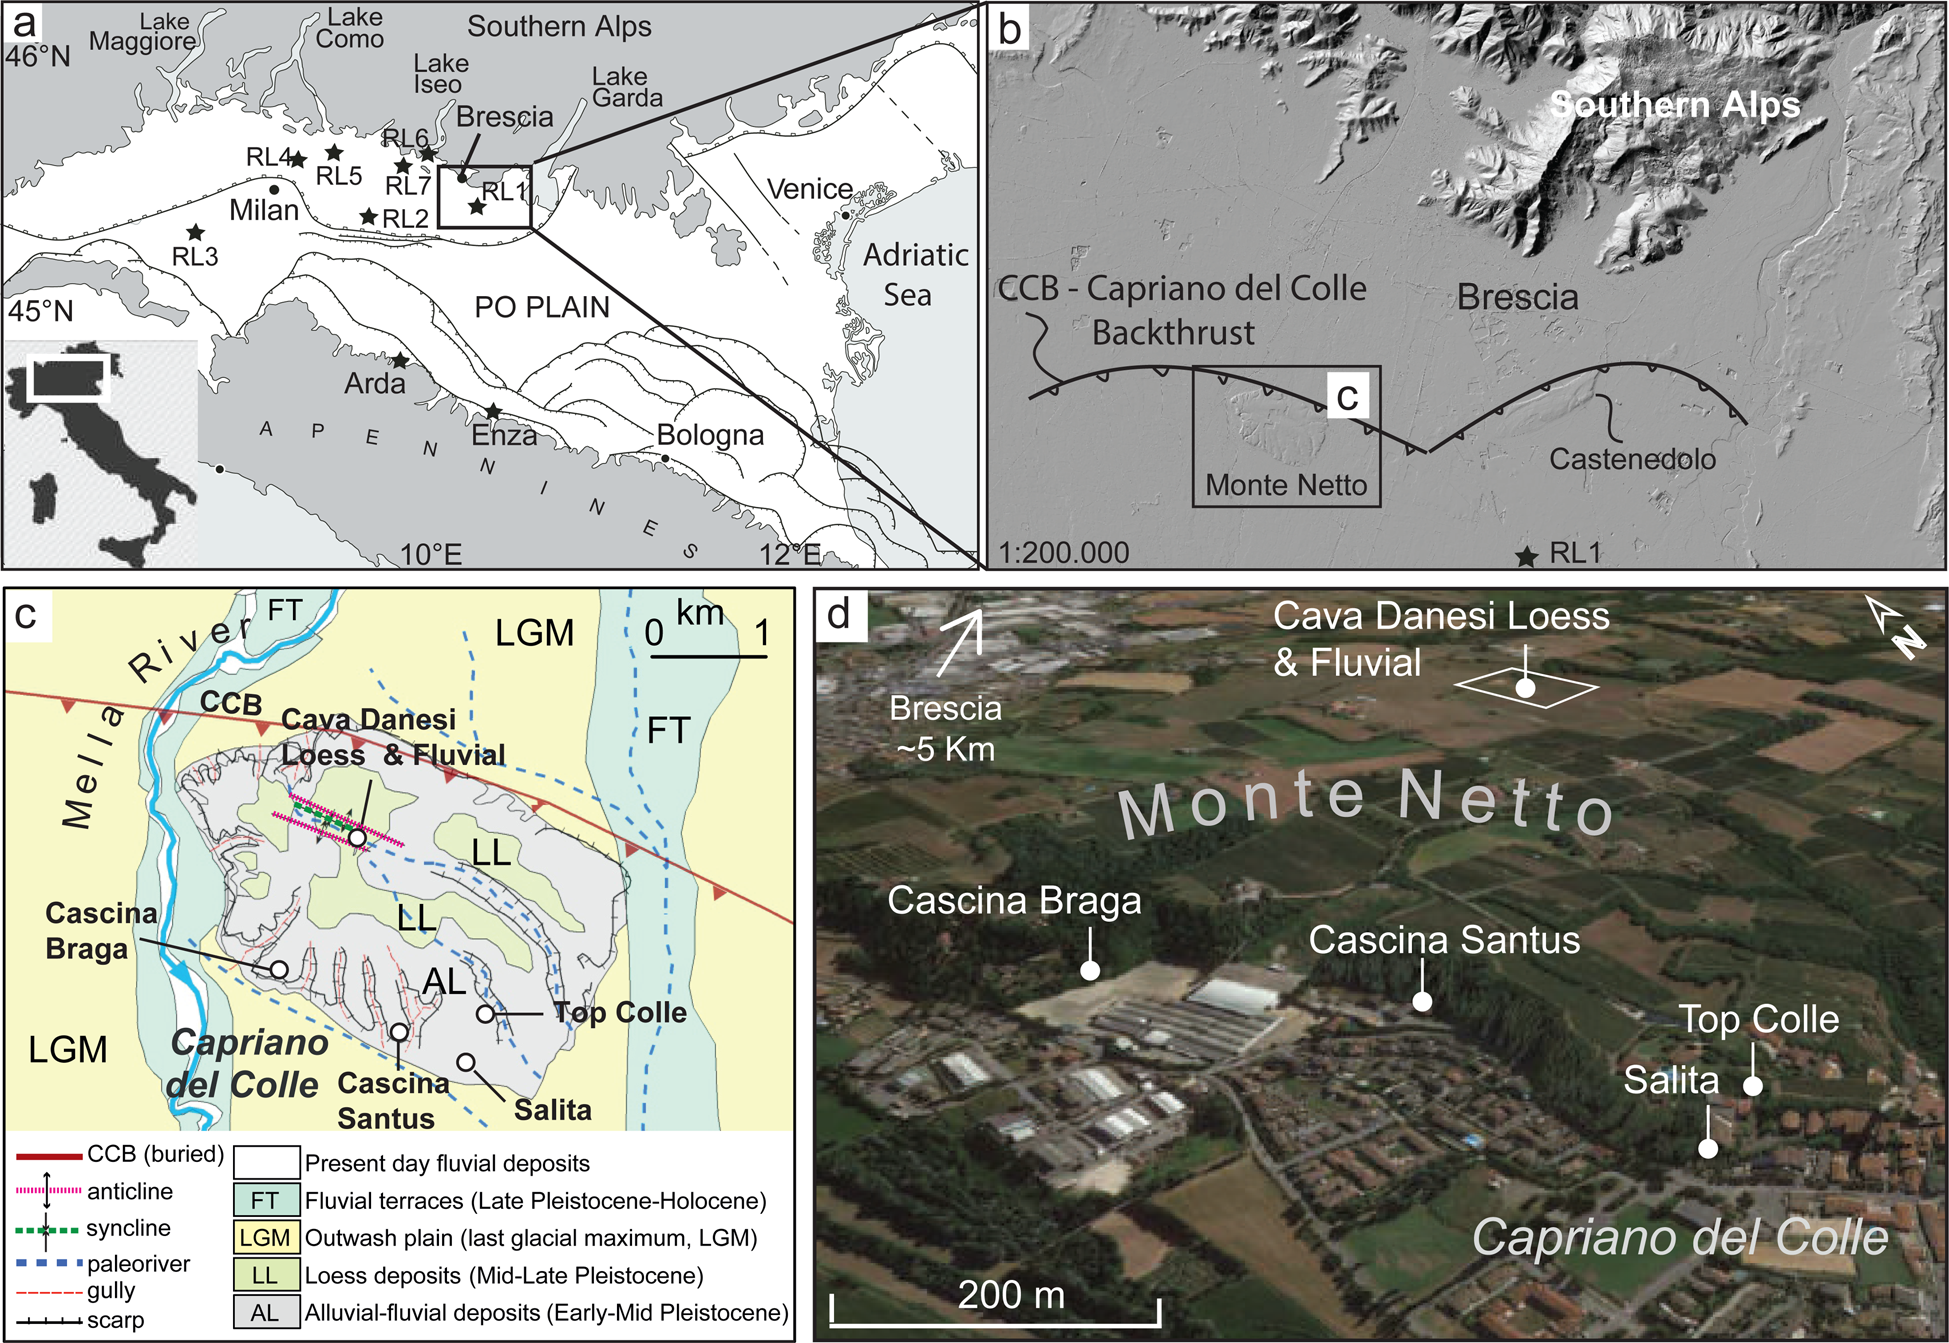
Here we focus on the Monte Netto tectonic hillock (Fig. 1b) that exposes a complex stratigraphy including, from the top, a sequence of Upper Pleistocene loess and paleosols (LL in Fig. 1c; general stratigraphy in Fig. 2), passing downward to a sequence of fluvial/alluvial sediments (AL in Fig. 1c; Fig. 2) (Zerboni et al., Reference Zerboni, Trombino, Frigerio, Livio, Berlusconi, Michetti, Rodnight and Spötl2015). The Monte Netto hillock is located on top of a major buried reverse fault (Capriano del Colle Backthrust; Fig. 1b, c). The loess-paleosol sequence at the top of the hillock is affected by shallow (and exposed) folding and faulting (Livio et al., Reference Livio, Berlusconi, Michetti, Sileo, Zerboni, Trombino and Cremaschi2009, Reference Livio, Berlusconi, Zerboni, Trombino, Sileo, Michetti, Rodnight and Spötl2014, Reference Livio, Kettermann, Reicherter and Urai2019, Reference Livio, Ferrario, Frigerio, Zerboni and Michetti2020) (Fig. 2; see also further below). We combine magnetostratigraphy, paleomagnetic secular variation (PSV), and available optically stimulated luminescence (OSL) dating to develop an age model of deposition of the overall Monte Netto sequence for comparison with coeval magnetostratigraphically calibrated drill cores from the literature taken in the surrounding Po Plain that are not related to neotectonic deformation (see also below). Specifically, our aims are to (1) date the Monte Netto stratigraphic sequence using magnetic polarity reversal boundaries (e.g., the Brunhes-Matuyama boundary and the top of the Jaramillo; (2) improve the age modeling in the Late Pleistocene portion of the Brunhes Chron by using a combination of PSV analysis and OSL data; (3) use magnetic polarity reversal boundaries to correlate the Monte Netto sequence to coeval sequences from the surrounding and largely undeformed plain; (4) estimate the elevations of such correlative polarity reversal boundaries in order to gauge rates of rock uplift of the Monte Netto structure relative to the surrounding plain; (5) use paleomagnetic data to verify the occurrence of tectonic rotations; and (6) generate a comprehensive time-calibrated depositional-deformational model of the investigated area, which pertains to a seismically active sector of the densely anthropized Po Plain (Livio et al., Reference Livio, Berlusconi, Michetti, Sileo, Zerboni, Trombino and Cremaschi2009) that is under active monitoring for seismic hazard (Vanini et al., Reference Vanini, Corigliano, Faccioli, Figini, Luzi, Pacor and Paolucci2018).
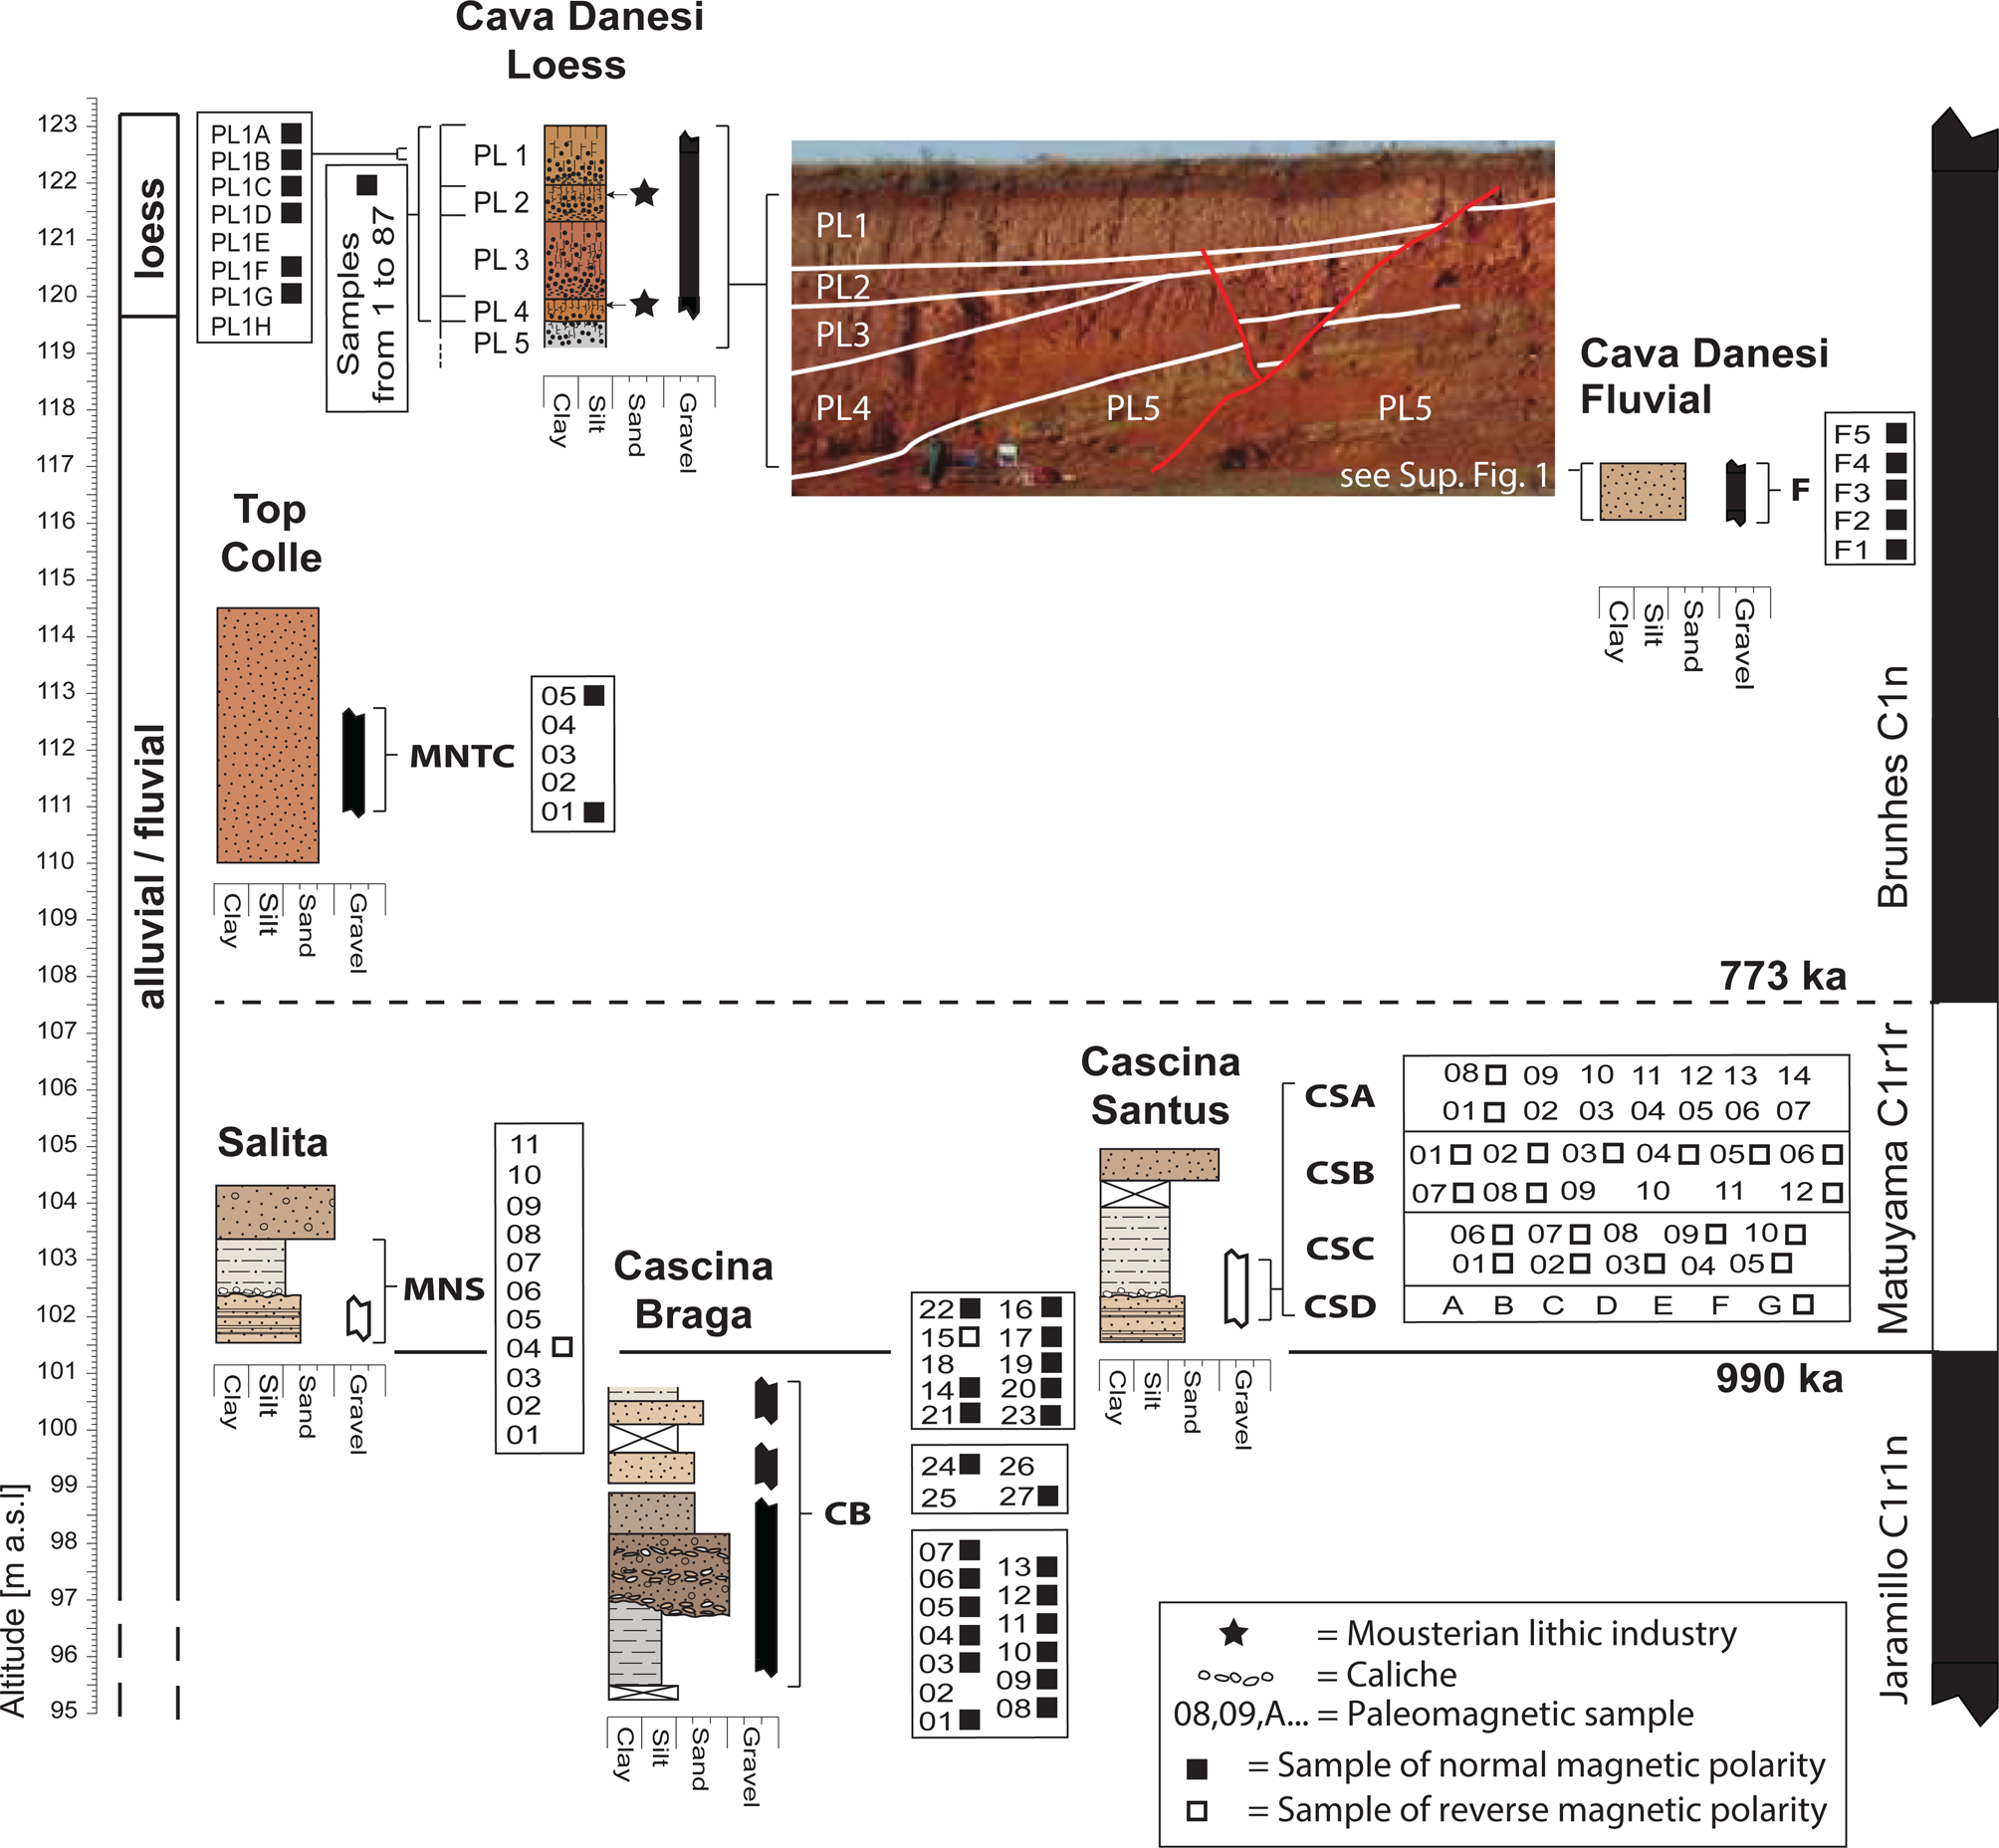
Stratigraphic scheme of the Monte Netto hillock based on the six lithological logs studied for magnetostratigraphy placed with respect to meters above sea level. From top (youngest) to bottom (oldest), the sampled sections are: Cava Danesi Loess, Cava Danesi Fluvial, Top Colle, Salita, Cascina Santus, and Cascina Braga. Also shown is a picture of the Cava Danesi outcrop area with location of sampled sections (Cava Danesi Loess, Cava Danesi Fluvial) relative to the normal fault system dissecting the sequence (Livio et al., Reference Livio, Berlusconi, Michetti, Sileo, Zerboni, Trombino and Cremaschi2009). Samples for paleomagnetism are listed next to the logs, and those that gave reliable results were used to establish a magnetic polarity stratigraphy (black squares for normal polarity and white squares for reverse polarity) for correlation to the Channell et al. (Reference Channell, Singer and Jicha2020) geomagnetic polarity time scale of the Pleistocene.
GEOLOGY AND STRATIGRAPHY
The regional Pleistocene stratigraphy of the Po Plain was investigated in recent years through a series of drill cores (cores RL1 to RL7 in Fig. 1a; Muttoni et al., Reference Muttoni, Carcano, Garzanti, Ghielmi, Piccin, Pini, Rogledi and Sciunnach2003; Scardia et al., Reference Scardia, Muttoni and Sciunnach2006, Reference Scardia, De Franco, Muttoni, Rogledi, Caielli, Carcano, Sciunnach and Piccin2012; for additional cores not on map, see Scardia et al., Reference Scardia, De Franco, Muttoni, Rogledi, Caielli, Carcano, Sciunnach and Piccin2012) and outcropping sections (e.g., Enza section, Gunderson et al., Reference Gunderson, Pazzaglia, Picotti, Anastasio, Kodama, Rittenour and Frankel2014; Arda section, Monesi et al., Reference Monesi, Muttoni, Scardia, Felletti, Bona, Sala, Tremolada, Francou and Raineri2016; Fig. 1a) that were age-calibrated using magnetostratigraphy through the recognition of the Brunhes-Matuyama boundary, the Jaramillo subchron, and sometimes the Olduvai subchron. Studies on cores RL1–RL7 revealed that in the late Early Pleistocene, the northern Po Plain was characterized by continental sedimentation in low-energy meandering fluvial systems alternating with occasional marine transgressions during sea level high-stands. Since ca. 870 ka, still in the late Early Pleistocene and for the ensuing Middle Pleistocene, sedimentation shifted to high-energy, coarse-grained sands and gravels attributed to alluvial fans and braided river systems that rapidly prograded transversally from the Southern Alps and the Apennines onto the Po Plain as the result of the onset of major Pleistocene glaciations corresponding to marine isotope stage (MIS) 22 at ca. 870 ka (Muttoni et al., Reference Muttoni, Carcano, Garzanti, Ghielmi, Piccin, Pini, Rogledi and Sciunnach2003; Scardia et al., Reference Scardia, Muttoni and Sciunnach2006).
These studies provide a regional magnetochronologic framework for the Pleistocene evolution of the Po Plain that represents a valuable starting point for the present study, which is aimed at determining the stratigraphic and neotectonic deformation history of the seismogenic Monte Netto structure. The Monte Netto hillock is located at the northern margin of the Po Plain foredeep, along an array of E-W trending thin-skinned blind thrusts belonging to the western sector of the buried Southern Alps (e.g., Livio et al., Reference Livio, Berlusconi, Michetti, Sileo, Zerboni, Trombino and Cremaschi2009; Maesano et al., Reference Maesano, D'Ambrogi, Burrato and Toscani2015). In particular, Monte Netto is located on top of a N-verging buried reverse fault (Capriano del Colle Backthrust, after Livio et al., Reference Livio, Berlusconi, Michetti, Sileo, Zerboni, Trombino and Cremaschi2009, Reference Livio, Berlusconi, Zerboni, Trombino, Sileo, Michetti, Rodnight and Spötl2014; Fig. 1b, c). Analysis of industrial seismic reflection data highlighted the presence of growth strata in the study area that dated from the Pliocene to the Middle Pleistocene and allowed constraining slip rates of the backthrust as decreasing from 2.5 mm/yr to 0.43 mm/yr since the Pliocene (Livio et al., Reference Livio, Berlusconi, Michetti, Sileo, Zerboni, Trombino and Cremaschi2009). The Capriano del Colle Backthrust is also structurally associated with shallower faulting and folding (Livio et al., Reference Livio, Berlusconi, Zerboni, Trombino, Sileo, Michetti, Rodnight and Spötl2014). At the top of the Monte Netto hillock, fault-related folding of Middle Pleistocene fluvial/alluvial deposits and Upper Pleistocene loess and paleosols are evident from field observations (Figs. 1c, S1; see also below). Incised fluvioglacial sediments attributed to the last glacial maximum characterize the surrounding plain (Fig. 1c).
At Monte Netto, we studied six stratigraphically superposed sections, from top to bottom: Cava Danesi Loess, Cava Danesi Fluvial, Top Colle, Salita, Cascina Santus, and Cascina Braga (Figs. 1d, 2). The Cava Danesi Loess section is located on the eastern wall of an isolated mound at the top of the Monte Netto hillock, to the south of the aforementioned fault-related folding system, where loess strata appear sub-horizontal (Fig. S1). It consists of silty clays interpreted as loess interlayered with paleosols that formed under Mediterranean climate conditions (Lehmkuhl et al., Reference Lehmkuhl, Nett, Pötter, Schulte, Sprafke, Jary and Antoine2021). The Cava Danesi Loess is arranged in four units from PL1 (top) to PL4 (bottom), each containing pedogenetic Mn-Fe nodules or concretions in the lower part, which is underlain by unit PL5 of fluvial/fluvioglacial origin (Figs. 2, 3a) (Zerboni et al., Reference Zerboni, Trombino, Frigerio, Livio, Berlusconi, Michetti, Rodnight and Spötl2015). A level in PL2 yielded Mousterian Neanderthal lithics, whereas a level in PL4 yielded older lithics (Fig. 3a; Delpiano et al., Reference Delpiano, Peresani, Bertola, Cremaschi and Zerboni2019). As previously stated, the Cava Danesi Loess section is located immediately to the south of a shallow fault-propagation fold (Fig. S1; Livio et al., Reference Livio, Berlusconi, Michetti, Sileo, Zerboni, Trombino and Cremaschi2009, Reference Livio, Kettermann, Reicherter and Urai2019, Reference Livio, Ferrario, Frigerio, Zerboni and Michetti2020). Kinematic restoration of the outcropping anticline (Livio et al., Reference Livio, Berlusconi, Zerboni, Trombino, Sileo, Michetti, Rodnight and Spötl2014, Reference Livio, Ferrario, Frigerio, Zerboni and Michetti2020) reveals that this structure is a break-through fault-propagation fold, dipping ~24° to the north, that grew while slowing down its propagation-to-slip ratio and finally intersected the topographic surface in the Late Pleistocene, possibly during the last glacial maximum (Livio et al., Reference Livio, Ferrario, Frigerio, Zerboni and Michetti2020). The analyzed units display a typical stratigraphic architecture of growth strata across a growing anticline. Close to the exposed fault line (i.e., a few meters to the north of the Cava Danesi Loess section; Fig. S1), units PL5 and PL4 appear to have been affected by synsedimentary folding followed by subsequent faulting, while units PL3 and PL2 overlap the anticline with a significant decrease in thickness. Finally, unit PL1 levels-out the anticline, only being displaced by bending-moment normal faults, on the crest of the anticline (see also Livio et al., Reference Livio, Berlusconi, Zerboni, Trombino, Sileo, Michetti, Rodnight and Spötl2014, Reference Livio, Ferrario, Frigerio, Zerboni and Michetti2020). These normal faults ruptured during repeated surface-faulting earthquakes, the last one occurring during the Holocene (Livio et al., Reference Livio, Berlusconi, Zerboni, Trombino, Sileo, Michetti, Rodnight and Spötl2014). More to the south, where the sampled Cava Danesi Loess section is located, units PL1–PL5 flatten-out and lie sub-horizontally (Fig. S1). The nearby Cava Danesi Fluvial section is composed of fluvial/alluvial silts of unit PL5 and crops out below the loess-paleosol sequence, well exposed to the north of the anticline in the backlimb of the growing fault-related fold (Figs. S1, 2).
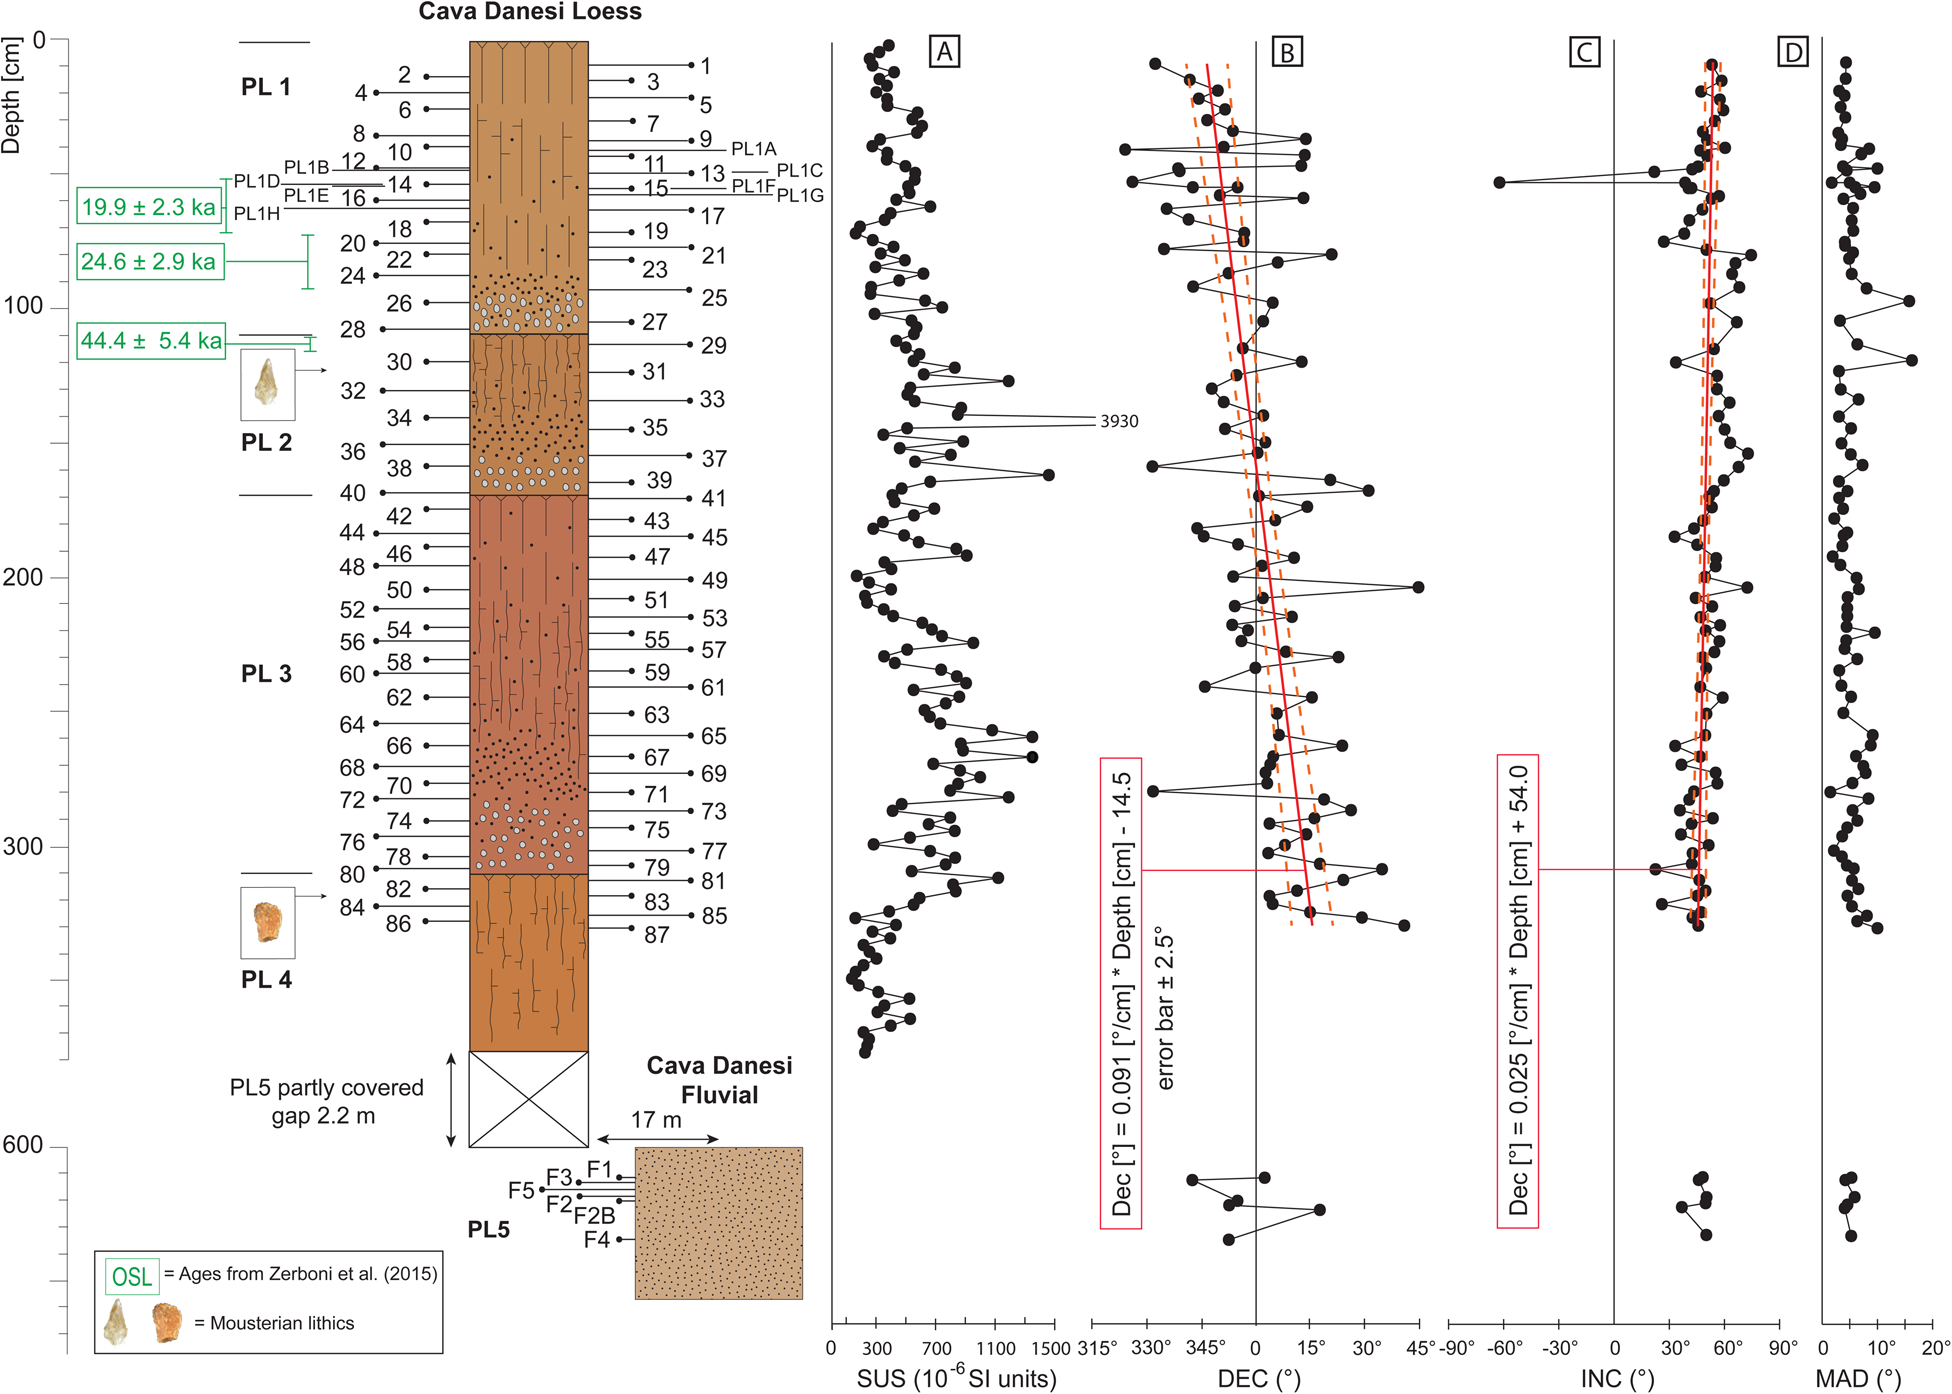
(a) Stratigraphic log of the Cava Danesi Loess section with position of samples collected for magnetostratigraphy and of samples that yielded OSL ages (Zerboni et al., Reference Zerboni, Trombino, Frigerio, Livio, Berlusconi, Michetti, Rodnight and Spötl2015). Also reported is the Cava Danesi Fluvial section. Paleomagnetic properties are as follows: (b) initial magnetic susceptibility, (c, d) values of declination and inclination of the characteristic remanent magnetization (ChRM) component, and (e) maximum angular deviation (MAD) of the ChRM. The Cava Danesi Loess section is characterized by a trend in declination values (c) due to tectonic deformation (see text for discussion). The red lines in (c) and (d) represent the linear best fits with 95% error bounds.
Stratigraphically below the Cava Danesi Loess and Fluvial sections, and clear of the aforedescribed fault-propagation fold, we sampled the Top Colle section, which consists of yellowish-brown, polygenic, medium-grained fluvial/alluvial sands, and farther downward, the Salita section, comprised of sands and polygenic gravels in a sandy matrix, underlain by grayish-brownish silty sands with Ca-carbonate concretions, and laminated yellowish-brown sandy silts (Fig. 2). We also sampled the Cascina Santus section, which is a lateral equivalent of the Salita section showing similar sedimentary and lithological characteristics, while the lowermost sampled section is Cascina Braga, consisting of medium- fine-grained sands, either well cemented or unconsolidated, passing downward to polygenic coarse gravels, coarse sands, and grayish- or yellowish-brown silty clay (Fig. 2).
PALEOMAGNETISM
Materials and Methods
We collected 186 oriented core-samples along the 6 stratigraphic sections described above (Fig. 2). Samples were retrieved with a hand-corer or a water-cooled electric drill and were oriented with a magnetic compass. Cores of typically ~7–8 cm in length were split in two standard-sized ~10 cc cylinders. The stratigraphically uppermost Cava Danesi Loess section (Figs. 2, 3) was sampled at high resolution (one core sample every 3–5 cm) to investigate the occurrence of short excursions and paleosecular variations of Earth's magnetic field. The underlying sections (Cava Danesi Fluvial, Top Colle, Salita, Cascina Santus, and Cascina Braga; Fig. 2) were sampled every 10–20 cm to identify the main magnetic polarity reversals of Earth's magnetic field (e.g., Brunhes-Matuyama boundary, top Jaramillo).
The initial magnetic susceptibility (k) was measured every centimeter along the Cava Danesi Loess section with a Bartington MS2-K field sensor as well as on the paleomagnetic samples with a Bartington MS2-B sensor. Samples were subjected to thermal demagnetization from room temperature up to ~700°C in steps of 25–50°C with an ASC thermal demagnetizier. The natural remanent magnetization (NRM) was measured after each temperature step with a 2 G Enterprises DC-SQUID cryogenic magnetometer located in a magnetically shielded room. The magnetic component directions were determined through least-square analysis (Kirschvink, Reference Kirschvink1980). Thirteen samples were subjected to hysteresis experiments and backfield acquisition curves of isothermal remanent magnetization (IRM) using a vibrating sample magnetometer Microsense EZ7. Hysteresis loops of magnetization [Am2/kg] versus applied field [T] have been used to determine values of coercivity [Bc], saturation magnetization [Js], and saturation remanence [Jr] after correction for paramagnetic contributions. The parameter coercivity of remanence [Br] was obtained from IRM backfield acquisition curves performed on the same samples. On four of these samples, low-resolution first-order reversal curves (FORCs; Roberts et al., Reference Roberts, Pike and Verosub2000, Reference Roberts, Heslop, Zhao and Pike2014) were also obtained and interpreted using FORCinel (Harrison and Feinberg, Reference Harrison and Feinberg2008). Finally, four samples were subjected to thermal demagnetization of a three-component IRM (Lowrie, Reference Lowrie1990) in fields of 0.12 T, 0.4 T, and 1.5 T using a pulse magnetizer AC IM-10-30. The paleomagnetic analyses were performed at the LASA Paleomagnetics Laboratory.
Rock-magnetic properties
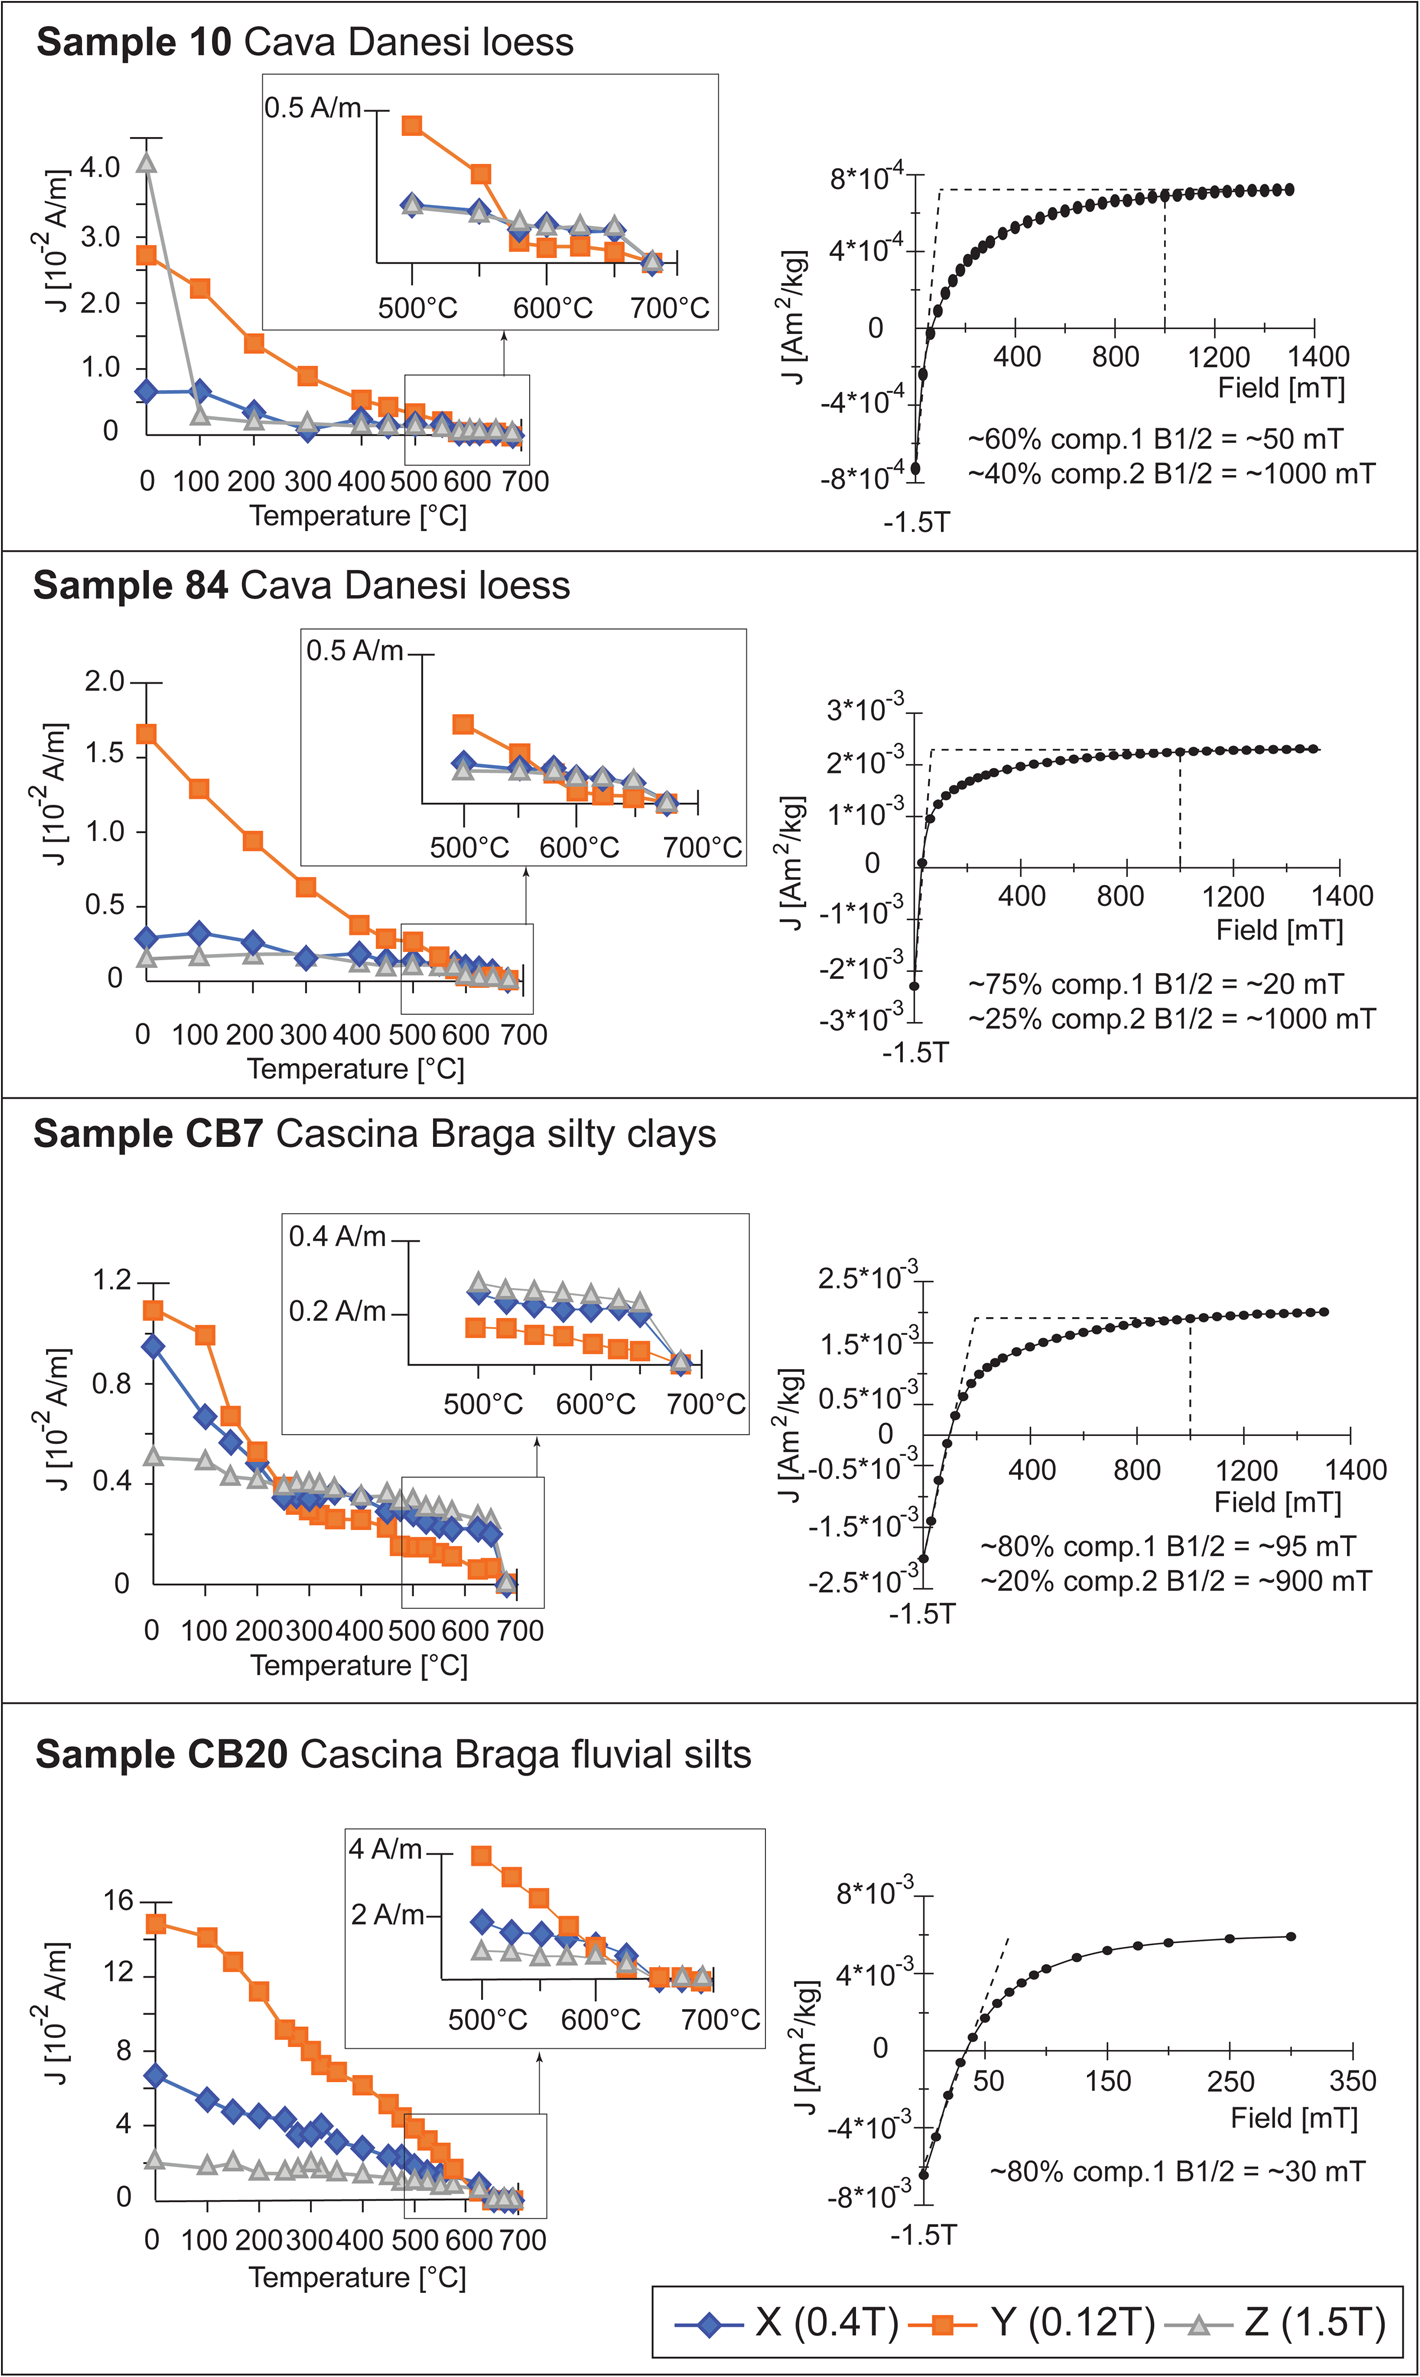
The low frequency initial magnetic susceptibility of the Cava Danesi Loess section varies between ~150 and ~1500×10-6 SI units with generally higher values in the Mn-Fe-enriched lower parts of units PL1–PL4 (Fig. 3b). The mean susceptibility of the underlying fluvial/alluvial silts varies between ~3×10⁻⁶ SI at the Cava Danesi Fluvial section (unit PL5) and ~900×10-6 SI at the Cascina Braga section. Rock-magnetic experiments reveal the occurrence of variable mixtures of magnetite and hematite in the Cava Danesi Loess section and a dominant hematite signal associated with magnetite/maghemite in the fluvial/alluvial silts of the underlying sections. Thermal demagnetization of three component IRM of samples 10 and 84 from the Cava Danesi Loess section (Fig. 4; stratigraphic position of samples in Fig. 3a) shows a signal carried by the 0.12 T curves with a maximum unblocking temperature of ~575°C interpreted as due to the presence of magnetite. The 1.5 T and 0.4 T curves are instead characterized by maximum unblocking temperatures up to ~680°C, signaling the presence of hematite. The 1.5 T curve of sample 10 also shows a drastic drop at ~100°C, which is interpreted as goethite. Backfield IRM acquisition experiments on samples 10 and 84 confirm the occurrence of two magnetic phases with contrasting coercivities compatible with magnetite and hematite (Fig. 4, right panels) and characterized by median destructive fields (B1/2) of 10–50 mT and ~1000 mT calculated according to the Gaussian analysis of Kruiver et al. (Reference Kruiver, Dekkers and Heslop2001). Hysteresis loops of samples 10 and 84 are wasp-waisted with values of Jr/Js of ~0.10–0.14 and of Br/Bc of ~4.5–6.8 that are plotted on a modified Day diagram (Dunlop, Reference Dunlop2002) (Fig. 5). Similar hysteresis ratio values characterize samples 1, 2, 6, and 15 from the Cava Danesi Loess section. Low-resolution FORC diagrams of samples 10 and 84 (Fig. 5) show asymmetric peaks centered at Bu ≈ 0 and extending to Bc ≈ 0.02 T coexisting with higher coercivity tails, which suggests a mixture of single domain (SD) magnetite and high coercivity hematite/goethite. Divergence from the central ridge could reflect superparamagnetic contributions. A second cluster of samples from the Cava Danesi Loess section displays lower Jr/Js values on the Day diagram (Fig. 5, samples 23, 33, 49, 65, 87). Sample 23 has a wasp-waisted hysteresis with a FORC slightly more divergent along the vertical Bu axis and with a less developed high coercivity tail along the central ridge, interpreted as signaling the dominance of coarser grained magnetite.
Thermal decay of a three component IRM acquired in fields of 1.5 T, 0.4 T, and 0.12 T, and isothermal remanent magnetization (IRM) backfield acquisition curves, of representative samples from the Cava Danesi Loess section (10 and 84) and Cascina Braga fluvial sediments (CB7 and CB20). Unblocking temperatures and IRM coercivities are consistent with the occurrence of variable mixtures of essentially magnetite and hematite, as testified also by the wasp-waisted shapes of the hysteresis loops obtained on the same samples (Fig. 5).
Hysteresis loops, corrected for paramagnetic components, and FORC diagrams of selected samples from the Cava Danesi Loess section (10, 23, and 84) and the Cascina Braga fluvial sediments (CB7 and CB20). The central-right panel represents a modified Day plot (Dunlop, Reference Dunlop2002) of Jr/Js versus Br/Bc for 12 samples from the Cava Danesi Loess sequence (black dots) and the Cascina Braga fluvial sediments (black diamonds). The theoretical curves of Dunlop (Reference Dunlop2002) for single domain-10 nm superparamagnetic (SD-SP) magnetite mixtures, single domain-multidomain (SD2-MD2) magnetite mixtures, and multidomain (MD) magnetite are also reported for reference together with the magnetite-hematite (mh) mixing curve of Liu et al. (Reference Liu, Hirt, Schüler, Uebe, Zhu, Liu and Zhang2019) (in blue). See text for discussion.
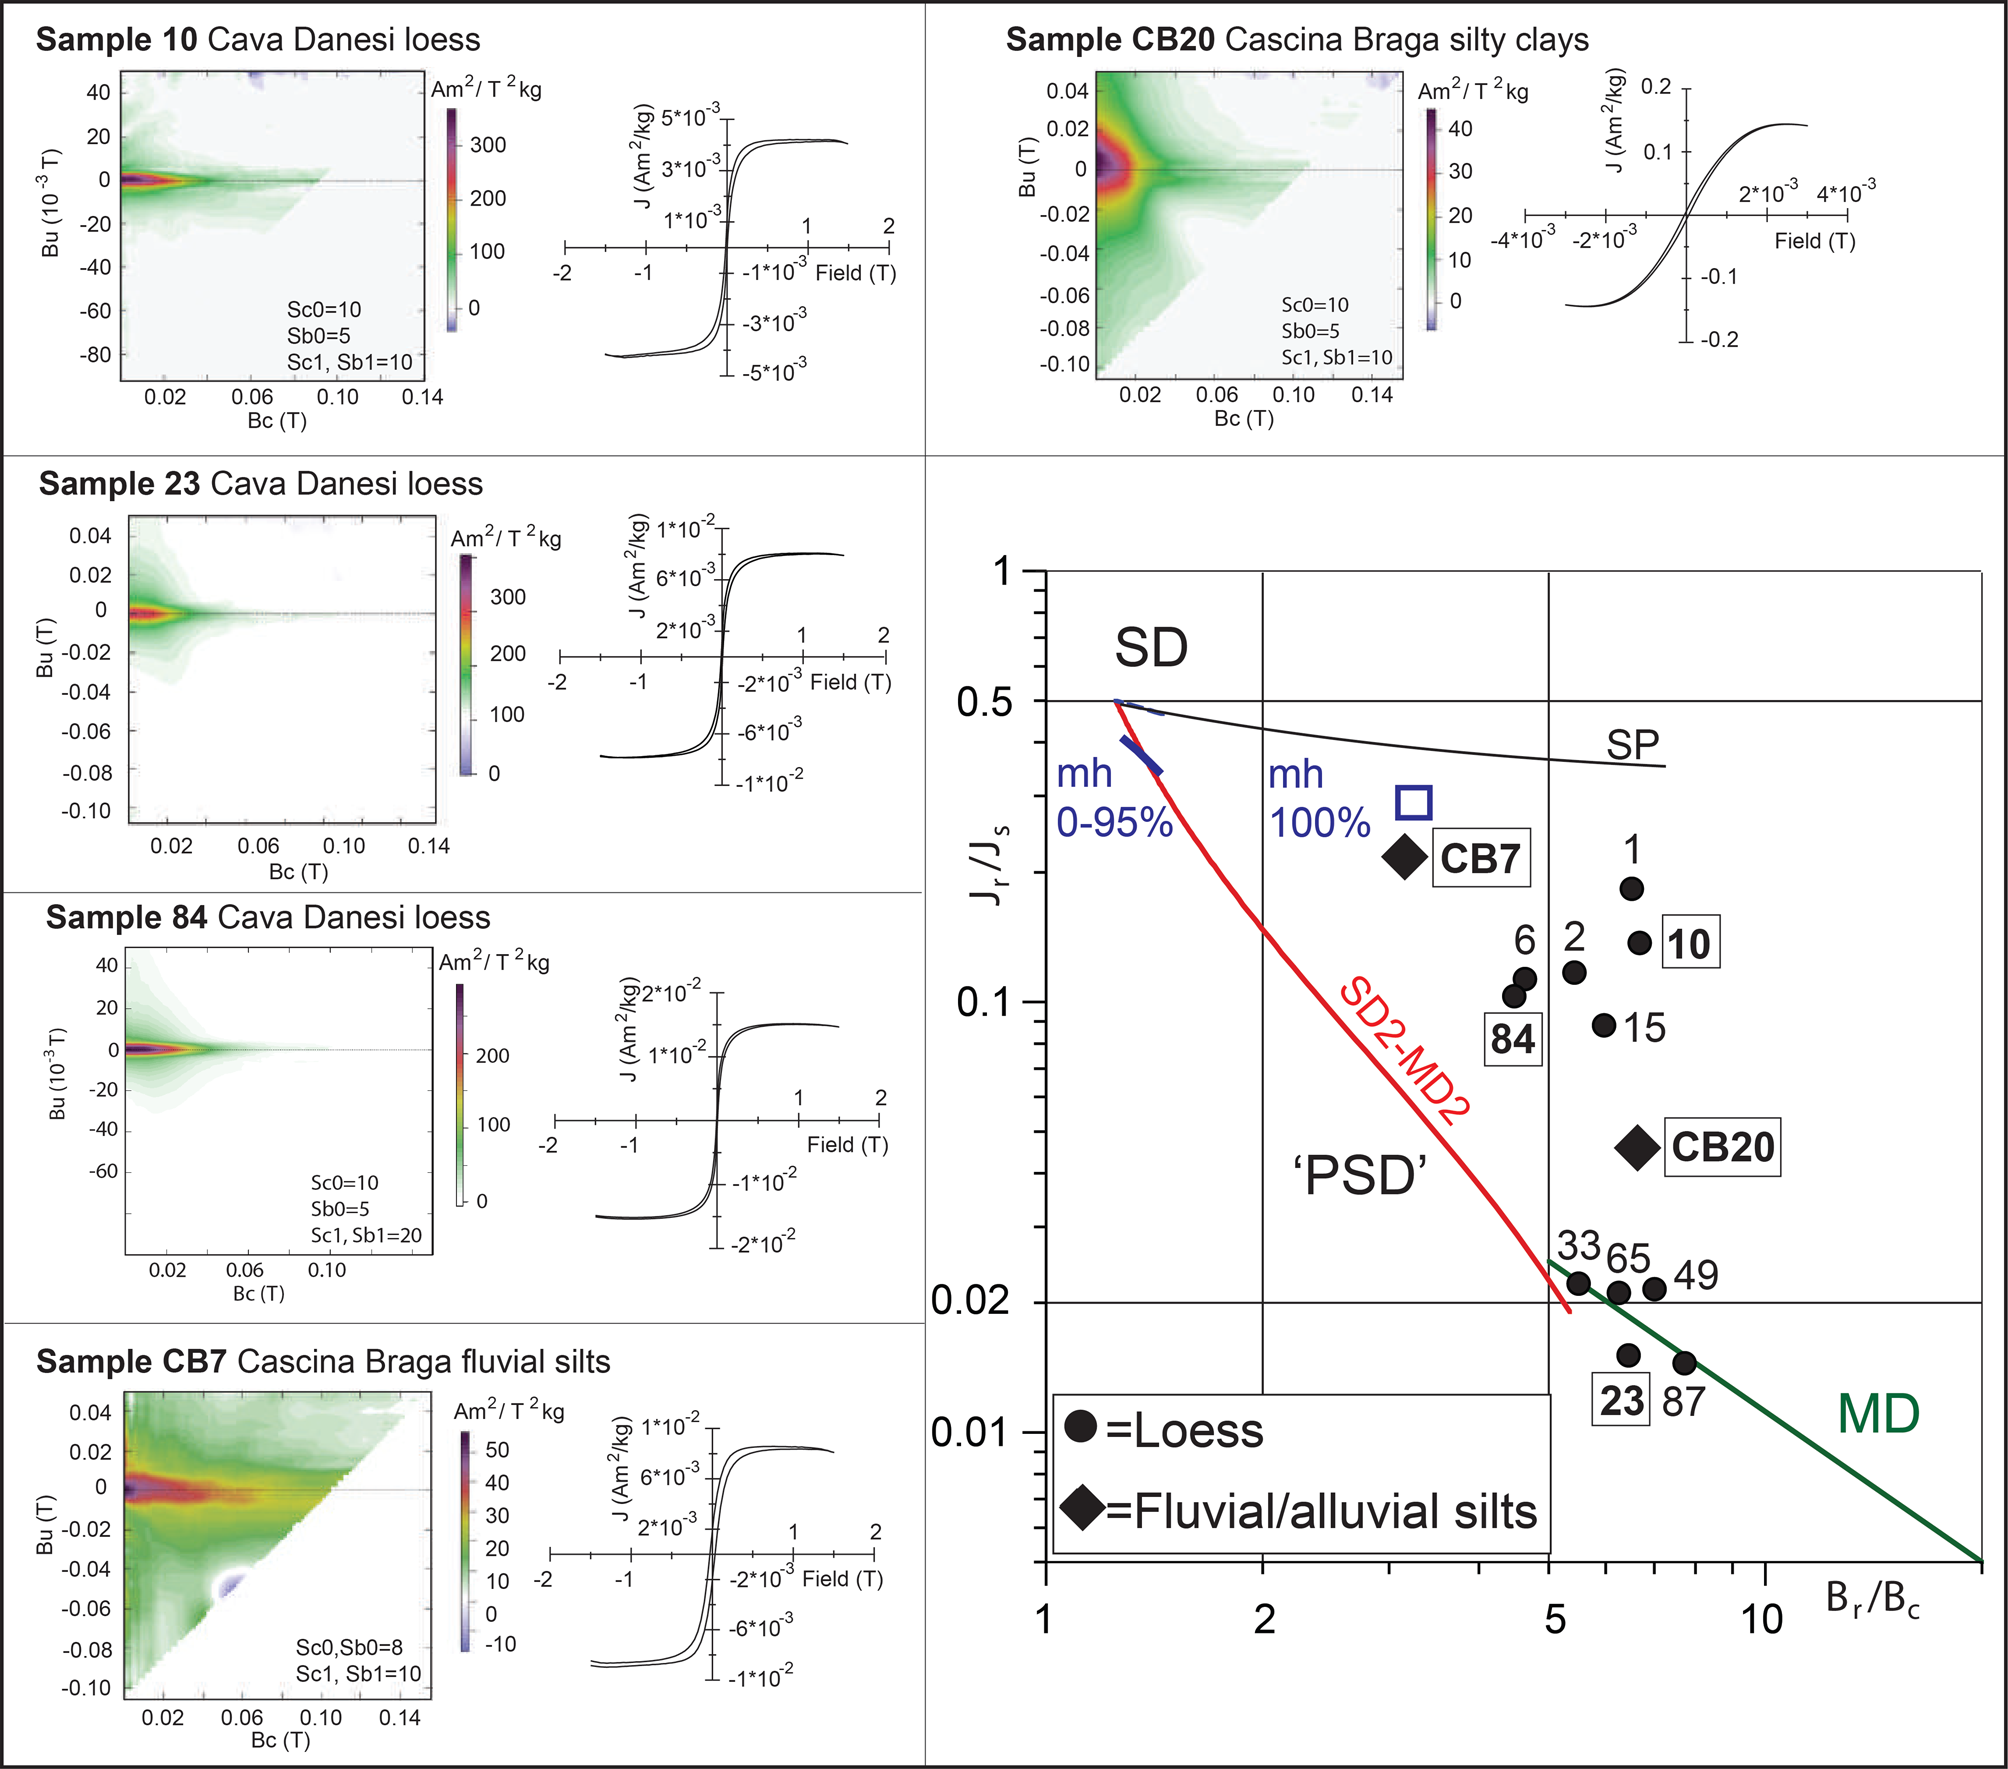
Samples CB7 and CB20 from fluvial silts of the Cascina Braga section show a dominant hematite signal in which the 1.5 T and 0.4 T curves are characterized by maximum unblocking temperatures >600°C (Fig. 4). There are also inflections in the 0.12 T and 0.4 T curves between ~250°C and ~450°C tentatively interpreted as due to maghemite (CB7) and magnetite (CB20). This interpretation is confirmed by the backfield IRM acquisition curves that show an initial low coercivity component (magnetite/maghemite) followed by a higher coercivity component (hematite) (Fig. 4). Hysteresis loops of these samples are less wasp-waisted in shape. Sample CB7 displays Jr/Js and Br/Bc values close to values expected for pure hematite (mh 100% on the Day plot of Fig. 5; data from Liu et al., Reference Liu, Hirt, Schüler, Uebe, Zhu, Liu and Zhang2019) and a low-resolution FORC with an asymmetric central ridge elongated towards high coercivities that could be compatible with dominant hematite, coexisting with pronounced vertical divergence along the Bu axis that could be due to superparamagnetic contributions. Instead, sample CB20 shows lower Jr/Js and higher Br/Bc values, and a FORC central asymmetric swell restricted to low coercivities, more compatible with coarse-grained magnetite/maghemite, in substantial agreement with the IRM experiments.
Magnetostratigraphy
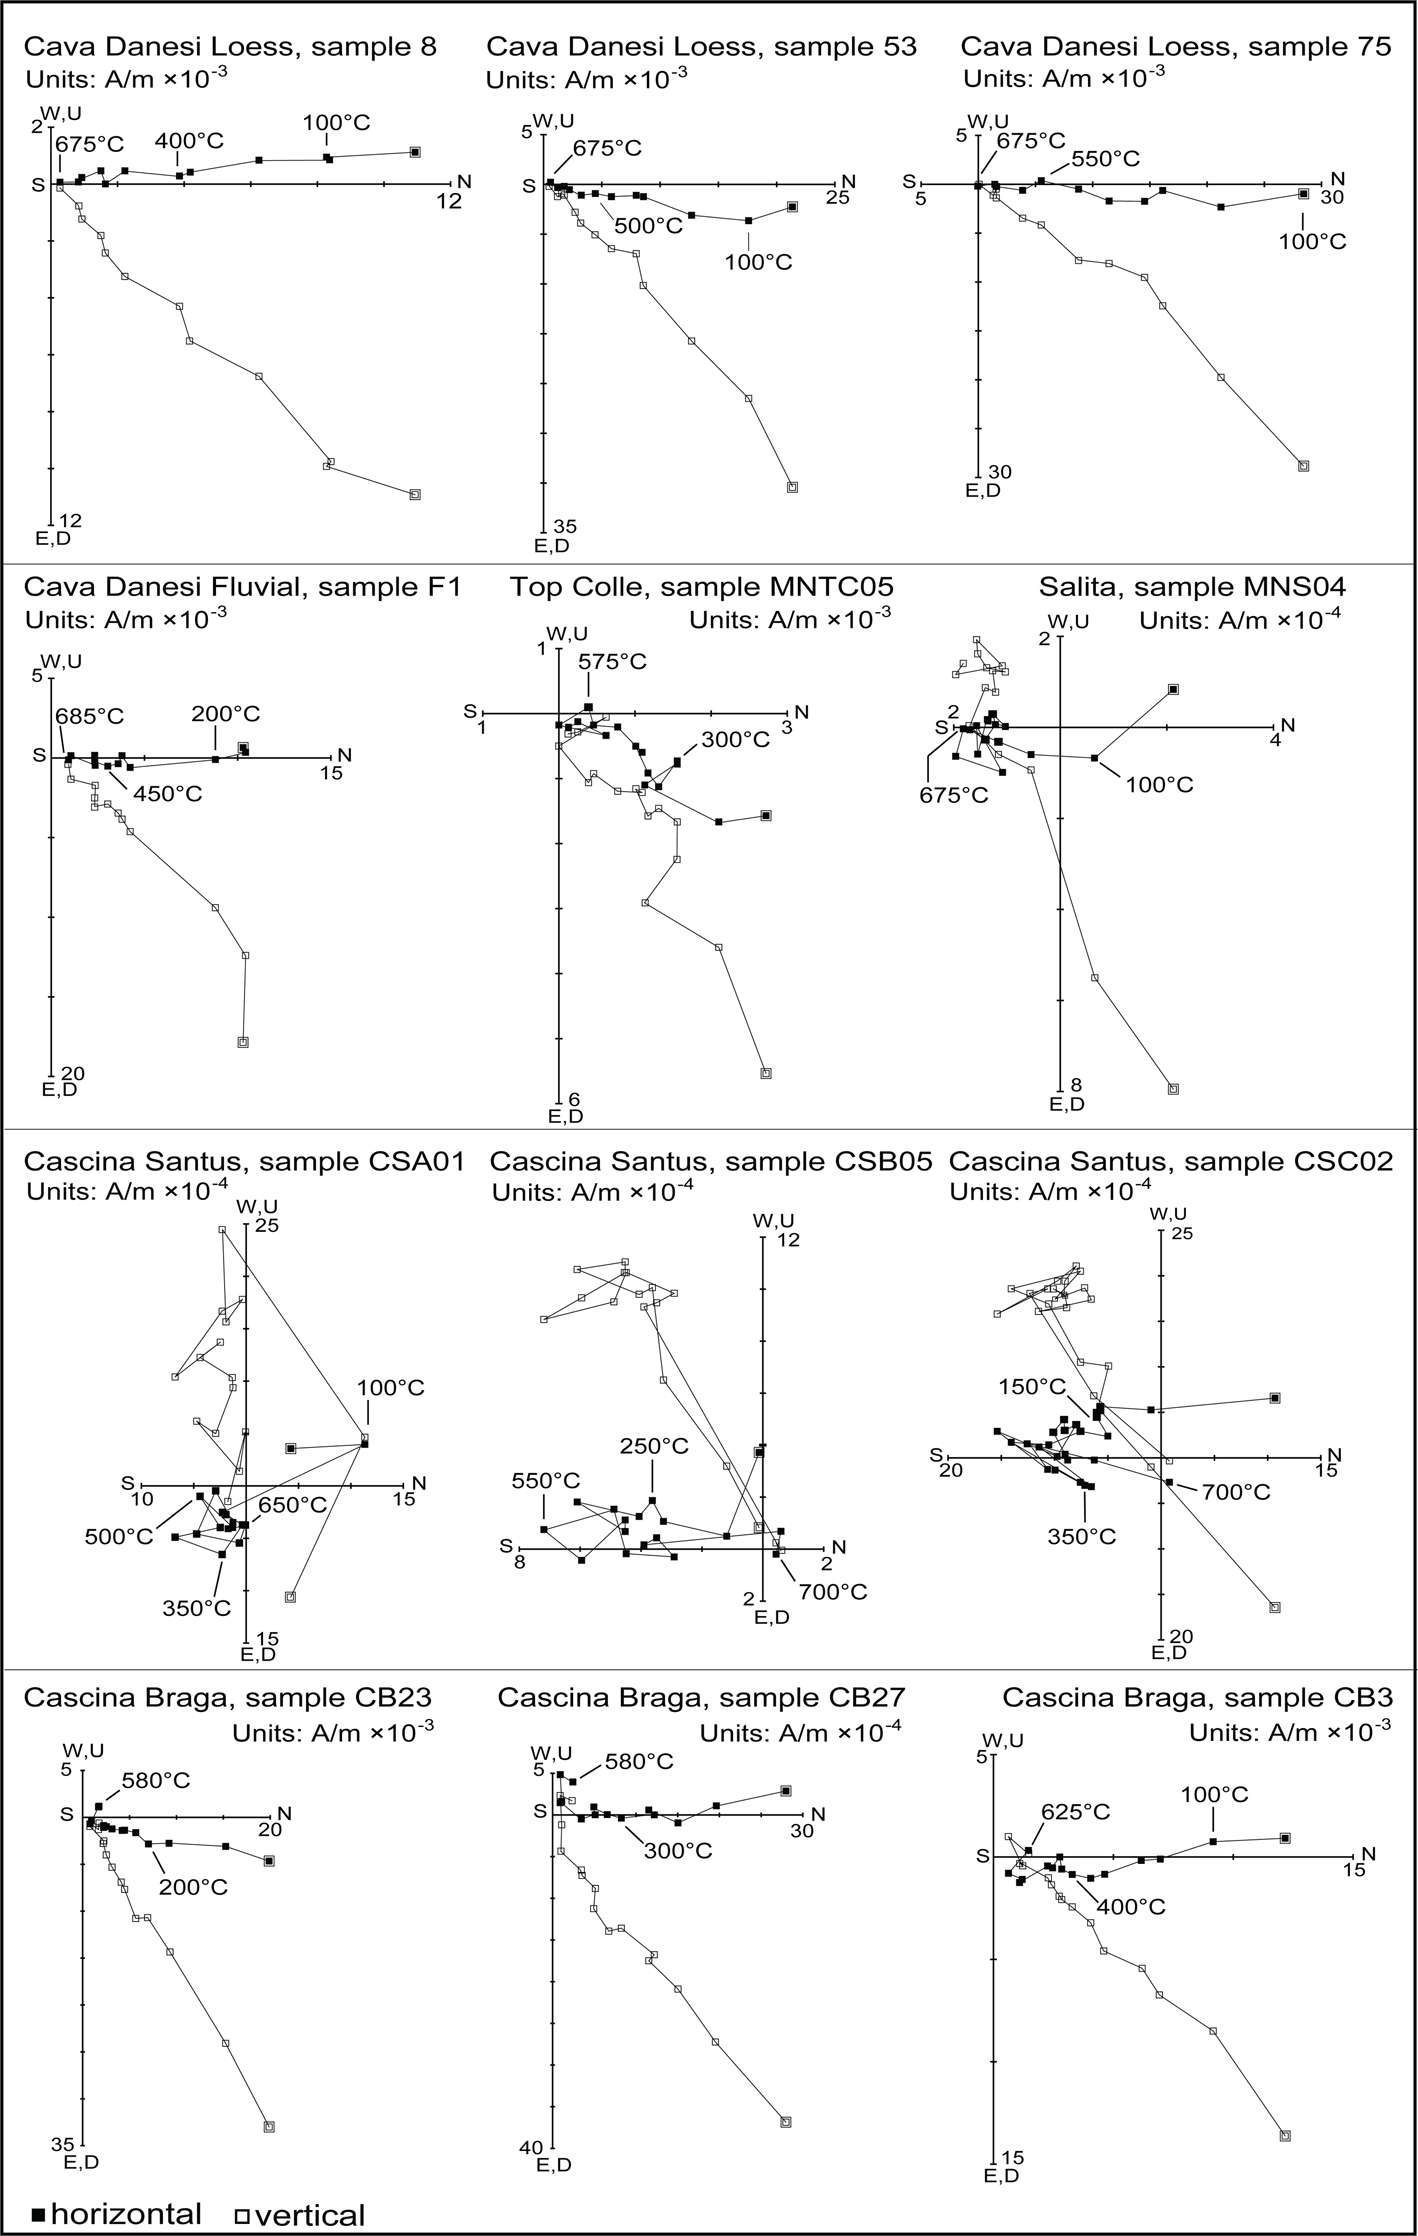
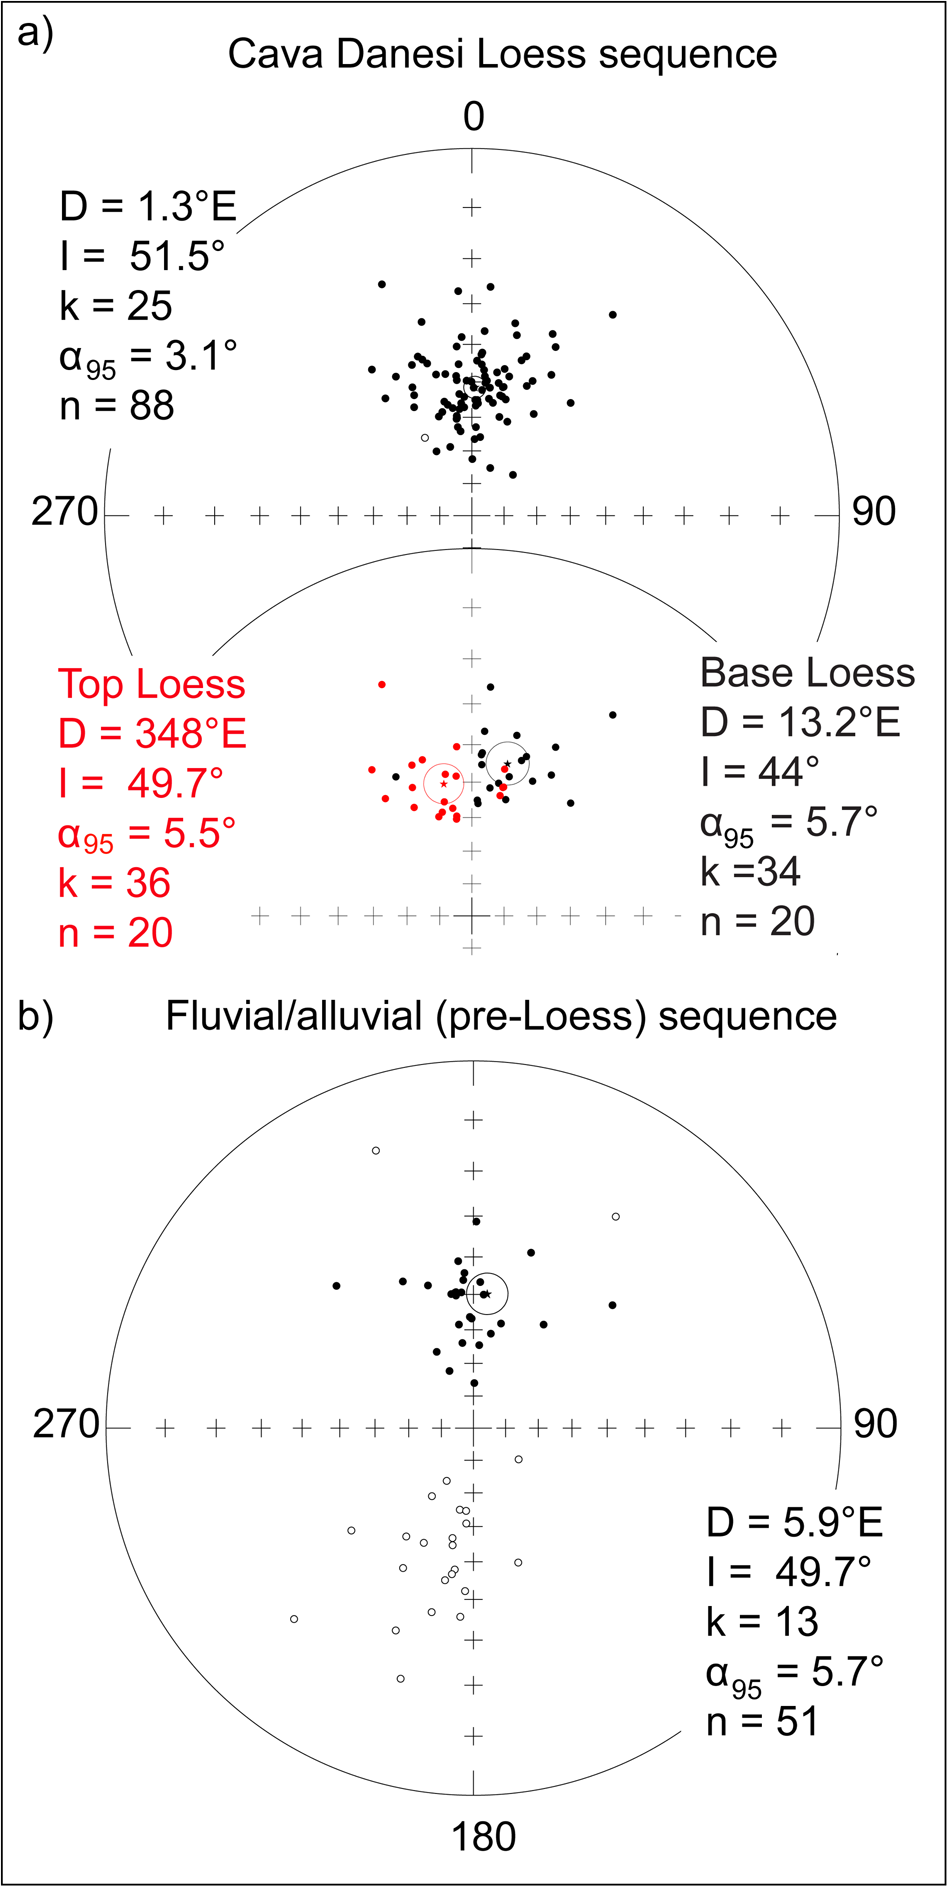
Thermal demagnetization analyses of the natural remanent magnetization show the presence of a viscous overprint component A of normal polarity, oriented northerly and down, which has been removed between room temperature and a maximum of ~250°C. The characteristic remanent magnetization (ChRM) component, interpreted as the primary magnetic signal, was detected in 139 samples up to ~580–675°C (Fig. 6; demagnetization data in Tab. S1), suggesting that both magnetite and hematite contribute to the ChRM, in agreement with the rock-magnetic experiments. The ChRM component directions are oriented with northerly declinations and downward inclinations, representing normal magnetic polarity, or southerly declinations and upward inclinations representing reverse polarity (Fig. 6). In general, ChRM component directions are well resolved in samples from the Cava Danesi Loess section, where they trend linearly to the origin of the demagnetization axes (8, 53, and 75; Fig. 6), whereas in the other fluvial-dominated sections they tend to be more scattered, sometimes forming clusters before final unblocking at high temperatures (e.g., F1 from Cava Danesi Fluvial; MNTC05 from Top Colle; MNS04 from Salita; CSA01, CSB05, CSC02 from Cascina Santus; and CB23, CB27 and CB3 from Cascina Braga; Fig. 6). Standard Fisher statistics yielded an overall mean ChRM component direction for the Cava Danesi Loess section at Dec = 1.3°E, Inc = 51.5° (k = 25, α95 = 3.1°, n = 88) (Fig. 7a, upper stereonet) and for the fluvial (pre-loess) sequence (Cava Danesi Fluvial, Top Colle, Salita, Cascina Santus, and Cascina Braga) at Dec = 5.9°E, Inc = 49.7° (k = 13, α95 = 5.7°, n = 51) (Fig. 7b). No tectonic correction was applied because bedding attitudes in all sampled sections appear close to horizontal.
Vector end-point demagnetization diagrams of representative samples from Monte Netto indicating characteristic remanent magnetization (ChRM) component directions of normal polarity, with northernly declinations and positive (downward) inclinations, or reverse polarity, with southernly declinations and negative (upward) inclinations. Closed symbols are projections onto the horizontal plane and open symbols are projections onto the vertical plane in geographic coordinates. No tilt correction has been applied because bedding is sub-horizontal. Demagnetization steps are expressed in °C.
Equal-area projections of the characteristic remanent magnetization (ChRM) component directions for (a) all samples from the Cava Danesi Loess sequence as well as a selection of 20 ChRM directions for the base and top of the same loess sequence showing differential tectonic rotations; and (b) samples from the underlying fluvial/alluvial (pre-loess) sequence from sections Cava Danesi Fluvial, Top Colle, Salita, Cascina Santus, and Cascina Braga. Closed symbols are projections onto the lower hemisphere while open symbols are projections onto the upper hemisphere. The stars represent the Fisher mean directions and associated cones of 95% confidence.
The normal polarity ChRM record of the Cava Danesi Loess section shows high-frequency variability in declination and inclination (Fig. 3c, d) that is relatively well defined, with maximum angular deviation (MAD) errors generally <10° (Fig. 3e). Notably, the declination values oscillate along a long-term trend of 0.091°/cm with easterly declinations in the lower part of the section, northerly declinations in the mid part, and westerly declinations in the upper part (red line with 95% error envelope in Fig. 3c). The inclination values show instead a more modest long-term increase trend of 0.025°/cm moving up-section (Fig. 3d). We interpret these trends as mainly due to tectonic deformation (declination trend) and compaction (inclination trend).
The ChRM component directions have been used to calculate virtual geomagnetic pole (VGP) latitudes (Tab. S2). These results have been used to determine the position in the overall Monte Netto sequence of the Brunhes-Matuyama boundary and the top of the Jaramillo (Fig. 2). These data were used in conjunction with OSL dates and PSV analysis for sedimentation age modeling and assessments of rates of tectonic uplift and deformation of the Monte Netto structure.
AGE MODEL OF DEPOSITION
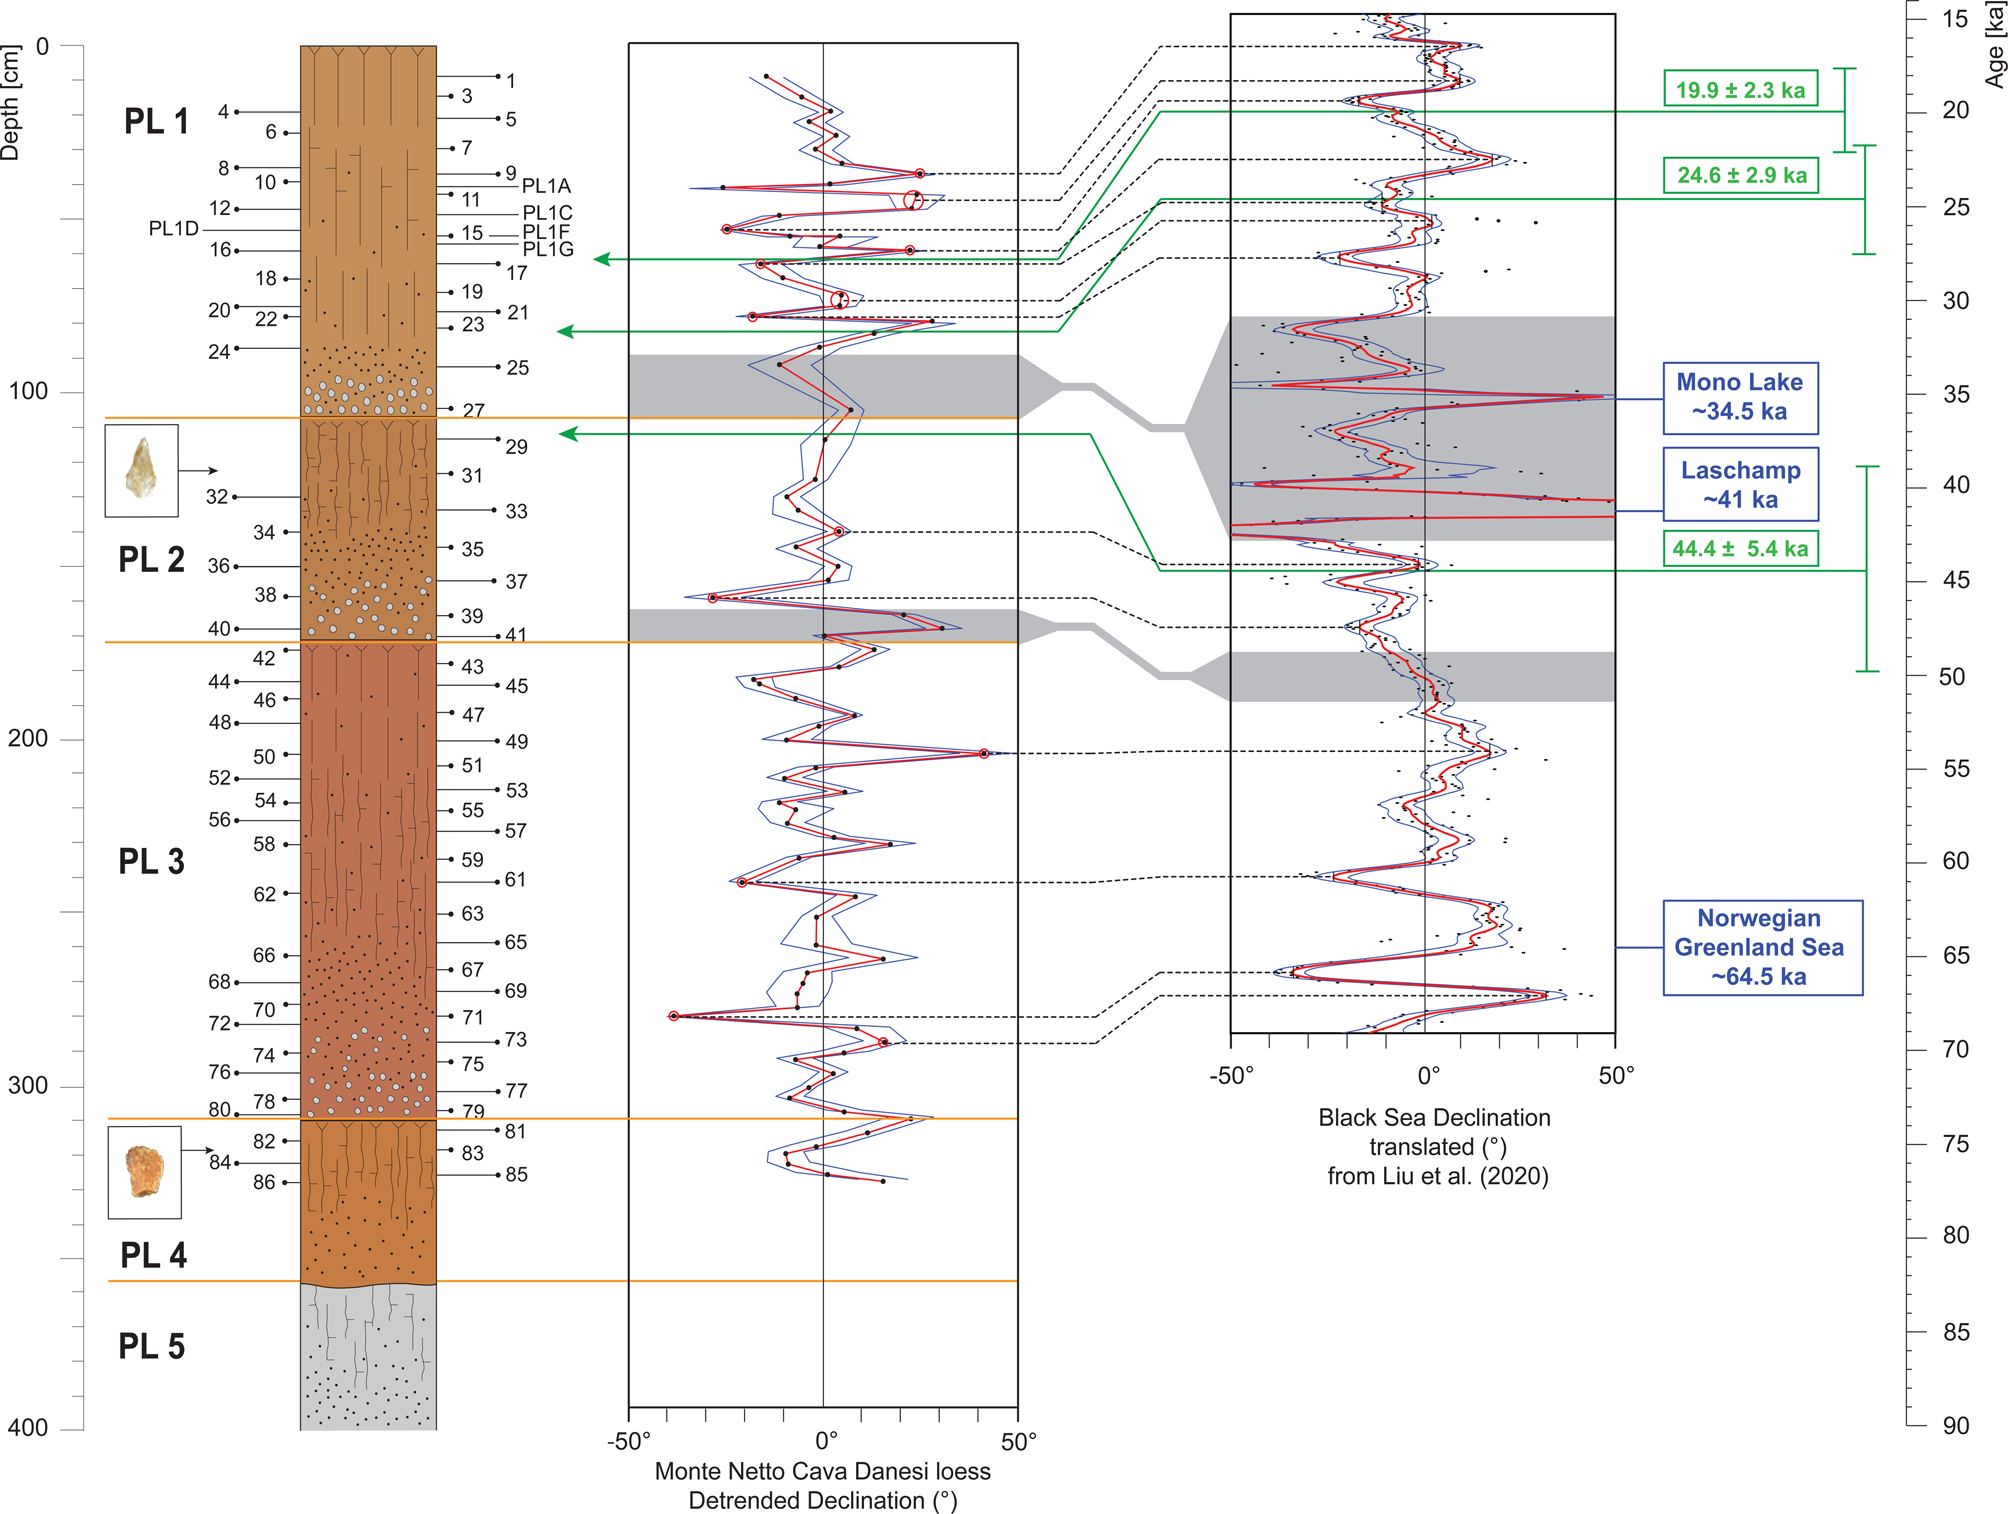
The Cava Danesi Loess section at the top of the Monte Netto stratigraphy is of homogeneous normal polarity (Figs. 2, 3). The OSL dates, ranging from 19.9 ± 2.3 ka in PL1 to 44.4 ± 5.4 ka in PL2 (Fig. 3a; Zerboni et al., Reference Zerboni, Trombino, Frigerio, Livio, Berlusconi, Michetti, Rodnight and Spötl2015), indicate a late Brunhes age for the sequence. No short polarity excursions, such as the Laschamp (41 ka) or the Blake (115 ka), have been found. To improve the chronological constrains based on the available OSL ages, which have rather large uncertainties, we interpret the high-frequency variability in ChRM declination observed in the Cava Danesi Loess section as PSV and use this record for correlation to a dated PSV record close to our study area (Liu et al., Reference Liu, Nowaczyk, Panovska, Korte and Arz2020; see below). PSV is best resolved in high sediment accumulation rate records, such as marine sediments, with sedimentation rates greater than ~20 cm/ka, even though records with lower sedimentation rates are commonly adopted for so-called smoothed PSV estimates (e.g., Panovska et al., Reference Panovska, Korte, Liu and Nowaczyk2021). In the Cava Danesi Loess section, OSL dates in unit PL1 at 19.9 ± 2.3 ka and 24.6 ± 2.9 ka separated by 20 cm of section (Fig. 3a) suggest accumulation rates that could fall in the suitable range for at least smoothed PSV determination.
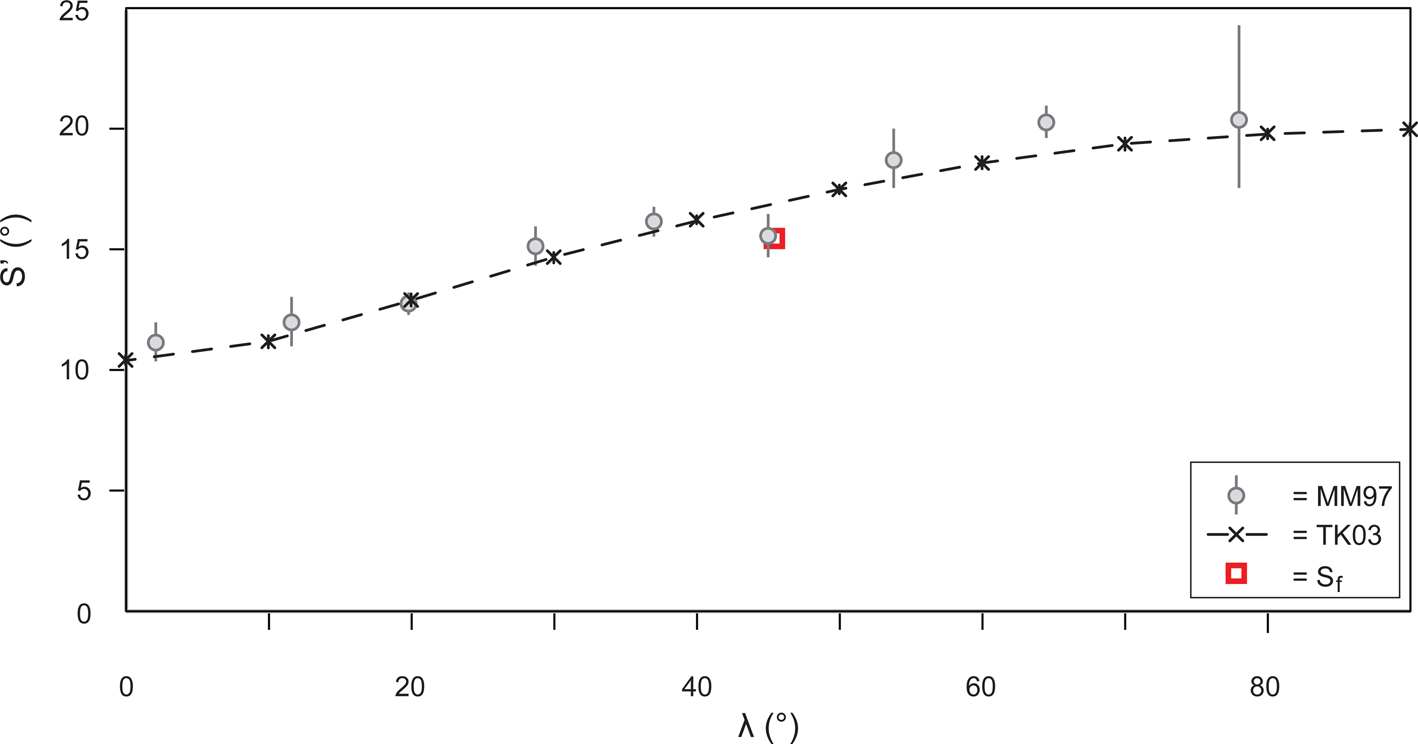
For PSV analysis, the long-term declination trend of 0.091°/cm (interpreted as due to tectonic deformation; see below) has been subtracted by linear detrending (Fig. S2a). The inclinations also have been corrected for the observed minor long-term trend of 0.025°/cm (Fig. S2b). This inclination trend could be interpreted as due to compaction, with lower levels characterized by slightly shallower mean ChRM inclinations than inclinations in upper levels. The detrended ChRM declination/inclination record subsequently has been tested for additional (residual) sedimentary inclination flattening using the Elongation/Inclination (E/I) method of Tauxe and Kent (Reference Tauxe, Kent, Channell, Kent, Lowrie and Meert2004). A flattening factor f = 0.86 was obtained (Fig. S3) and applied to further correct the (detrended) ChRM inclination record (Fig. S2c). To verify that the corrected (detrended and unflattened) declination-inclination record from the Cava Danesi Loess section indeed reflects PSV, the value of VGP scatter S′ (Tauxe and Kent, Reference Tauxe, Kent, Channell, Kent, Lowrie and Meert2004), representing the angular standard deviation of the scatter of the VGPs with latitude, was calculated. The obtained value of S′ = 15.46 was subsequently corrected for within-site scatter, obtaining a value of Sf = 15.44 (McElhinny and McFadden, Reference McElhinny and McFadden1997), which was compared with the values of the GAD field model TK03 of Tauxe and Kent (Reference Tauxe, Kent, Channell, Kent, Lowrie and Meert2004) and the global PSV record MM97 of McElhinny and McFadden (Reference McElhinny and McFadden1997) at the Monte Netto latitude, finding excellent agreement, especially with MM97 (Fig. 8, Tab. S3).
Curve of the VGP scatter value S′ (°) as a function of latitude λ (°) for the statistical GAD model TK03 (Tauxe and Kent, Reference Tauxe, Kent, Channell, Kent, Lowrie and Meert2004) and the global MM97 record (McElhinny and McFadden, Reference McElhinny and McFadden1997). The red square represents the VGP scatter value corrected for the within-site scatter (Sf = 15.44) calculated for the Cava Danesi Loess section.
For age modeling, the detrended declination record of the Cava Danesi Loess sequence with ± MAD error envelope was correlated to the high-resolution PSV record of Liu et al. (Reference Liu, Nowaczyk, Panovska, Korte and Arz2020) from a stack of 16 sediment cores recovered from the Black Sea and dated between 14.5–68.9 ka using radiocarbon dating and correlations to the Pleistocene global climate record (Fig. 9). PSV records from locations closer to the study area (e.g., in the in the Adriatic Sea) have not been taken into consideration because they are confined to the Holocene (Vigliotti, Reference Vigliotti2006). We opted to use directional data for correlation and age modeling instead of relative paleointensity derived from rock magnetic data because of the complex and variable mineralogical content of the studied sediments. The Black Sea record, which is of much higher resolution than the Monte Netto record, was smoothed using a LOESS (locally weighted running line smoother) function with smoothing factor of 0.02 (Fig. 9). The two curves then were compared and correlated considering the main declination peaks (values of ≥20° east or west of north) bracketed between OSL ages, while also considering the occurrence of reductions in sedimentation rate and/or unconformities between individual loess units (interglacial/interstadial gaps in sedimentation and/or phases of pedogenesis). Seventeen age-depth values obtained from the Cava Danesi Loess-Black Sea PSV peak-to-peak correlation (input values in Tab. S4) were used for the construction of a deterministic age-depth model of deposition (Lougheed and Obrochta, Reference Lougheed and Obrochta2019). The OSL dates were used as a benchmark to drive the PSV correlation but did not enter the final age model because of their large uncertainties, which may encompass sedimentary gaps between loess units. The occurrence of such gaps explains for example the absence in the Cava Danesi Loess section of the Laschamp polarity excursion (ca. 41 ka), which is expected to occur, considering the overall age span of the correlated records, but it has not been recorded most probably because it falls in the interval of reduced deposition/unconformity at the PL1-PL2 boundary (Fig. 9).
Correlation of the ChRM declination record of the Cava Danesi Loess section to the dated declination record from the Black Sea of Liu et al. (Reference Liu, Nowaczyk, Panovska, Korte and Arz2020). The ChRM declination record of Cava Danesi (red line) is associated with ± MAD error bounds (blue lines). The Black Sea ChRM declinations have been recalculated via Virtual Geomagnetic Poles (VGP) latitudes and longitudes to Monte Netto coordinates, and smoothed with a LOESS function (using the software PAST; Hammer et al., Reference Hammer, Harper and Ryan2001) with a smoothing factor of 0.02 (red lines representing mean smoothed values and blue lines representing ± α95 confidence envelope). The major peaks (values of ≥20° east or west of north) have been correlated (black dashed lines) using the available OSL ages from the Cava Danesi Loess sequence (green boxes and lines) as general guidelines. Geomagnetic excursions recorded in the Black Sea record (Norwegian-Greenland Sea, Laschamp, and Mono Lake) are reported in blue. The correlation highlighted the absence in the Cava Danesi Loess section of the Mono Lake (ca. 34.5 ka) and Laschamp (ca. 41 ka) polarity excursions due to very low sedimentation rates or pedogenetic hiata in the basal parts of units PL1 and PL2, respectively (green boxes).
The final age-depth model (Fig. 10) was run with 105 iterations using xfactor = 0.2 (Lougheed and Obrochta, Reference Lougheed and Obrochta2019), evaluated according to the density of ages along the sequence. These parameters were chosen after several simulations as representing the best approximation of the geological-depositional history of the sequence, including the occurrence of unconformities (gaps) between loess units (Fig. 9). This deterministic age-depth model yielded interpolated ages (with 95% uncertainty) of the stratigraphic levels constituting the Cava Danesi Loess sequence, including estimates of the duration of the gaps or intervals of reduced sedimentation between individual loess units (Fig. 10; output values in Tab. S4). According to our age model, loess units PL1–PL3 were deposited between 16.4–67.0 ka at variable sediment accumulation rates. For completeness, we extrapolated the age model linearly up to the top of PL1, obtaining an age of 11 ka, and down to the base of PL3, obtaining an age of 72 ka (red dashed line in Fig. 10). Ages of units PL4 and PL5 have not been modeled because of lack of tie-points. For actual sedimentation rates assessment, we subdivided the age model into seven linear segments, estimating an average accumulation rate for each segment (Fig. 10). According to this analysis, the resulting accumulation rates varied between a maximum of 30.6 ± 1.7 cm/ka in PL2 and a minimum of 1.7 ± 0.007 cm/ka in PL1 (see Fig. 10). Some of these values are low for optimal PSV determination, but relatively adequate for smoothed PSV estimates (see Panovska et al., Reference Panovska, Korte, Liu and Nowaczyk2021). Finally, according to this model, the Mousterian archaeological level in unit PL2 has an age of 43.4 ± 0.4 ka, while the age of the underlying archaeological level in PL4 is >72 ka (Fig. 10).
Age model of deposition of the Cava Danesi Loess section computed using software Undatable (Lougheed and Obrochta, Reference Lougheed and Obrochta2019) with input and output age-depth data reported in Table S4. Units PL1–PL3 deposited between 11–72 ka (see text for discussion).

Fluvial sediments below the Cava Danesi Loess sequence have been dated using main magnetic polarity reversals. The Brunhes (C1n) normal polarity record observed at the Cava Danesi Loess and nearby Cava Danesi Fluvial sections extends downward into the Top Colle section (Fig. 2). The underlying sections (Salita and Cascina Santus) show a well-expressed reverse polarity record attributed to the Matuyama Chron (C1n.1r), while the lowermost section (Cascina Braga) shows consistent normal polarity, which is interpreted as a partial record of the Jaramillo subchron (C1r.1n) (Fig. 2). The Brunhes-Matuyama boundary falls in a stratigraphic gap of ~5 m due to lack of exposed sediments. Assuming an age of 773 ka for the Brunhes-Matuyama boundary and of 990 ka for the top of the Jaramillo (Channell et al., Reference Channell, Singer and Jicha2020), the long-term sedimentation rate of the fluvial (pre-loess) sequence is estimated at ~2.8 ± 2 cm/ka, assuming no major sedimentary hiata between individual lithological units and taking into account the stratigraphic gap across the Brunhes-Matuyama boundary. We stress that alternative ages of 780 ka or 781 ka for the Brunhes-Matuyama boundary (see discussion in Channell et al., Reference Channell, Singer and Jicha2020) would have the effect of increasing average sedimentation rates by ~3%.
TECTONIC IMPLICATIONS
Long-term uplift of the Monte Netto structure
The long-term deformation history of the Monte Netto structure due to activity of the Capriano del Colle Backthrust can be investigated comparing the elevations of levels that registered the Brunhes-Matuyama boundary and the top of the Jaramillo in sections from the study area and in two drill cores from the surrounding Po Plain (RL2 Pianengo and RL1 Ghedi; Muttoni et al., Reference Muttoni, Carcano, Garzanti, Ghielmi, Piccin, Pini, Rogledi and Sciunnach2003; Scardia et al., Reference Scardia, Muttoni and Sciunnach2006) that are not associated with tectonic deformation (Fig. 11; for locations of cores, see Fig. 1a). Vertical displacement of the Brunhes-Matuyama boundary between Monte Netto and RL1 is 68.5 ± 4.8 m, and between Monte Netto and RL2 is 78 ± 10.3 m. Similarly, the displacement of the top Jaramillo at Monte Netto is 130.9 ± 2.6 m relative to RL1 and 129.4 ± 2.1 m relative to RL2 (Fig. 11). Neglecting the relatively minor differences, which could be due to local and undetected variations in sediment accumulation rates, such displacements indicate an average rate of vertical tectonic uplift of the Monte Netto hillock relative to the surrounding plain of 11.3 ± 1.5 cm/ka since the Brunhes-Matuyama boundary (773 ka; terminus post quem). This long-term tectonic uplift is related to activity of the buried Capriano del Colle Backthrust, which has been observed in seismic profiles at a depth of 2–3 km (Livio et al., Reference Livio, Berlusconi, Michetti, Sileo, Zerboni, Trombino and Cremaschi2009) under the Monte Netto uplifted stratigraphic sequence (CCB in Fig. 11, depth not to scale; see also Livio et al., Reference Livio, Berlusconi, Michetti, Sileo, Zerboni, Trombino and Cremaschi2009, fig. 4).
Magnetostratigraphic correlations between Monte Netto and nearby drill cores RL2 Pianengo and RL1 Ghedi (Muttoni et al., Reference Muttoni, Carcano, Garzanti, Ghielmi, Piccin, Pini, Rogledi and Sciunnach2003; Scardia et al., Reference Scardia, Muttoni and Sciunnach2006) plotted in a common topographic-altimetric reference frame. The Monte Netto structure appears to have undergone a tectonic uplift relative to RL1 and RL2 of 11.3 ± 1.5 cm/ka since 773 ka (terminus post quem) due to the activity of the buried Capriano del Colle Backthrust (CCB), located at a depth of 2–3 km (not to scale in figure) under the uplifted Monte Netto stratigraphy. In addition, core RL1 was previously shown to be characterized by a regional isostatic uplift of ~8 cm/ka relative to sea level, which is similar to other cores from the Po Plain (Scardia et al., Reference Scardia, Muttoni and Sciunnach2006, Reference Scardia, De Franco, Muttoni, Rogledi, Caielli, Carcano, Sciunnach and Piccin2012). The total uplift rate of the Monte Netto structure relative to sea level is therefore of ~19.3 cm/ka.
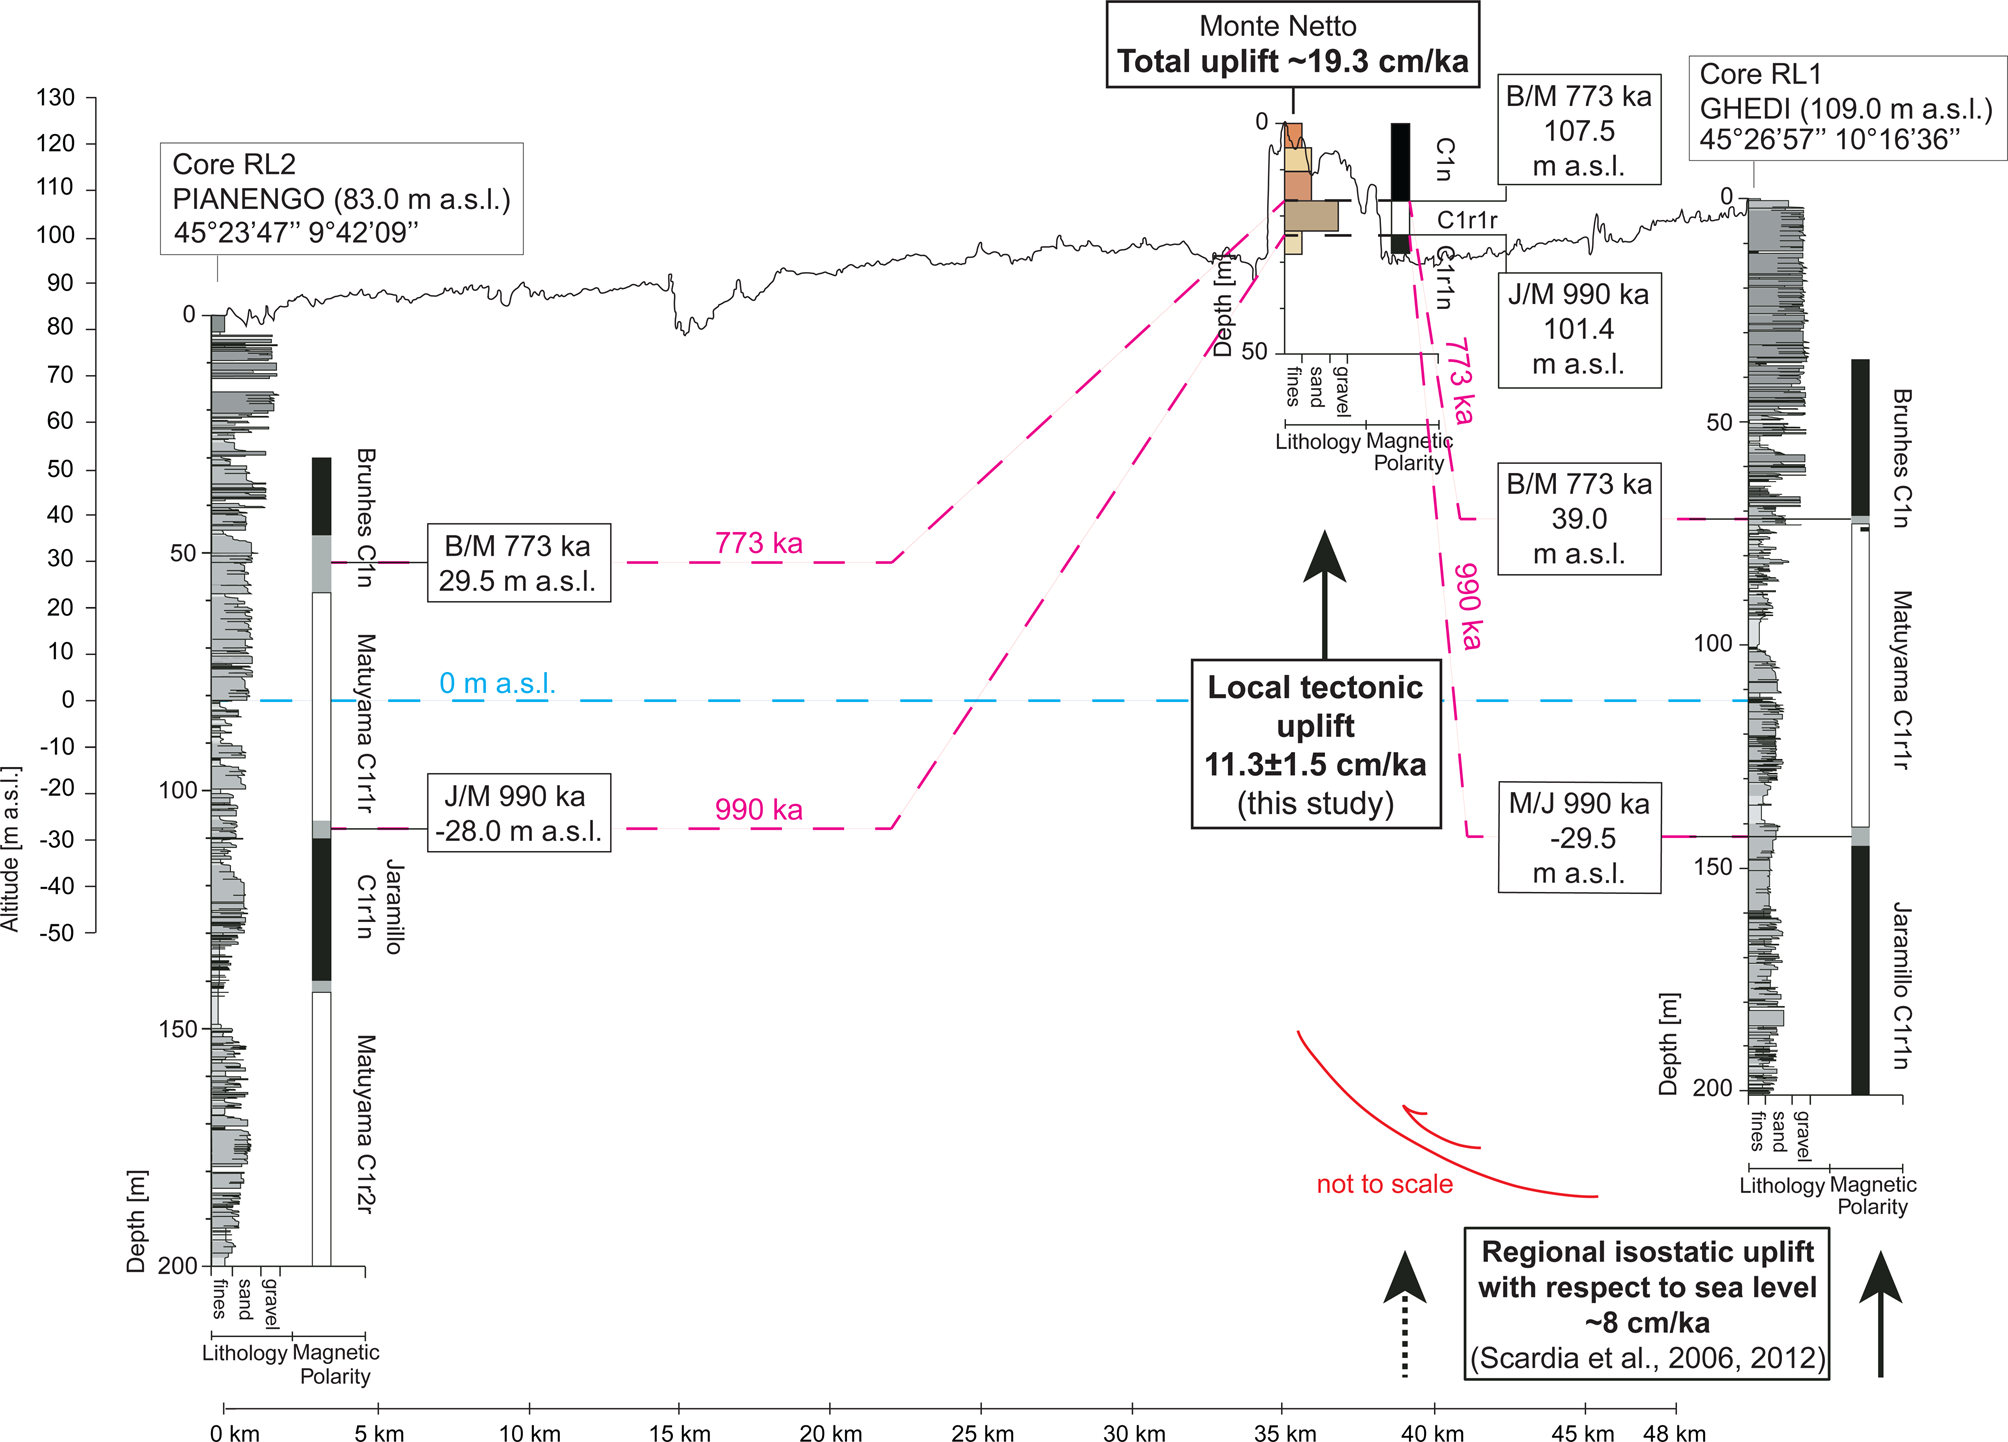
This rate of local tectonic uplift is superposed on a rate of regional uplift of the northern Po Plain relative to sea-level as observed in several Pleistocene drill cores (RL1–RL7, Fig. 1a). Scardia et al. (Reference Scardia, Muttoni and Sciunnach2006, Reference Scardia, De Franco, Muttoni, Rogledi, Caielli, Carcano, Sciunnach and Piccin2012) used magnetochronology from these cores to assess the age of transitional marine (beach, shoreface) facies marking sea level, which were found to punctuate the stratigraphic record repeatedly between 1240 ka (MIS 37) and 850 ka (MIS 21). After applying a simple Airy isostatic correction to account for sediment loading, Scardia et al. (Reference Scardia, Muttoni and Sciunnach2006, Reference Scardia, De Franco, Muttoni, Rogledi, Caielli, Carcano, Sciunnach and Piccin2012) found that in all analyzed cores (except for core RL2 Pianengo, see below), these transitional facies presently lie ~70–120 m above maximum Pleistocene sea levels of corresponding ages, implying a generalized phase of uplift of the northern Po Plain relative to sea level that occurred since deposition of the youngest displaced transitional deposits of late Early Pleistocene age (Scardia et al., Reference Scardia, Muttoni and Sciunnach2006, Reference Scardia, De Franco, Muttoni, Rogledi, Caielli, Carcano, Sciunnach and Piccin2012). In core RL1 Ghedi, this uplift relative to sea level was estimated at ~8 cm/ka since ca. 870 ka, while core RL2 Pianengo required no uplift correction to restore the transitional facies on the reference sea level curve, possibly because of a preceding phase of local subsidence that resulted in a final null net difference (Scardia et al., Reference Scardia, Muttoni and Sciunnach2006, Reference Scardia, De Franco, Muttoni, Rogledi, Caielli, Carcano, Sciunnach and Piccin2012, for additional information). In any case, assuming coherence between Monte Netto and core RL1 Ghedi, the total uplift rate of Monte Netto relative to sea level since the late Early Pleistocene (sum of local tectonic uplift plus regional isostatic uplift) is ~19.3 cm/ka (Fig. 11), which is in substantial agreement with previous assessments (Livio et al., Reference Livio, Berlusconi, Michetti, Sileo, Zerboni, Trombino and Cremaschi2009).
Rotational deformation of the loess sequence
A close inspection of the ChRM component directions reveals that the Cava Danesi Loess section was affected by a recent phase of complex rotational deformation that presumably was related to surface faulting and folding. Recall that the undetrended (i.e., as measured) ChRM declination record of the Cava Danesi Loess section oscillates around a long-term trend that is displaced relative to the true north direction (Fig. 3c, red line), with ChRM directions pointing on average 13.2°E (=13.2° east of north) at the base of the sequence and 348°E at the top. A statistically significant difference of ~25 ± 11° is revealed by Fisher statistics applied to 20 ChRM directions from the lowermost 60 cm of the loess sequence relative to 20 directions from the uppermost 60 cm of the same sequence (Fig. 7a, lower stereonet). Considering that both these 60 cm-thick subsections should cover ~10 ka of sedimentation according to the age model shown in Figure 10, the observed difference in mean declination cannot be explained as due to PSV alone, thus leaving tectonic rotation as the only plausible contributing factor to explain the observed declination trend. Instead, the Cava Danesi Fluvial section, stratigraphically below the loess, is characterized by six north-pointing ChRM declinations (Fig. 3c, d). No statistically significant rotation was observed in the other pre-loess fluvial sections (Top Colle, Salita, Cascina Santus, Cascina Braga; Fig. 7b). Recall also that the Cava Danesi Loess section is located immediately to the south of a fault-propagation fold (Figs. 12A, S1) (Livio et al., Reference Livio, Berlusconi, Zerboni, Trombino, Sileo, Michetti, Rodnight and Spötl2014, Reference Livio, Ferrario, Frigerio, Zerboni and Michetti2020), where some deformation is expected during fold growth. Conversely, the (non-rotated) Cava Danesi Fluvial section is located in the backlimb of the same fault system, where simple translation is expected (Fig. S1).
We applied the age model described above to transform the undetrended ChRM declination values of the Cava Danesi Loess section (Fig. 3c) from depth (cm) to time (ka) coordinates, and we attempted to explain this dated record using a simple two-stage rotational deformation model. According to our model, the loess sequence experienced an initial long-term phase of syn-depositional vertical-axis clockwise (cw) tectonic rotation at rates of 0.43 ± 2.5°/ka (error bound on rotation rate derived from error bound on declination trend in Fig. 3c) from ca. 72 ka (age of the oldest ChRM directions) up to ≤11 ka (age of the youngest ChRM directions). Consequently, the oldest ChRM directions should have been affected by maximum eastward displacements and the youngest directions should be non-rotated (Fig. 12b). We cannot assess precisely when this rotation ended in the 11–0 ka interval (Fig. 12b). This rotational phase appears progressive (syn-depositional), at least within the observed time scale, and is mainly due to a diverse tendency of the fault to propagate upwards, as also attested in Livio et al. (Reference Livio, Ferrario, Frigerio, Zerboni and Michetti2020). According to observations on two profiles of the same fault-propagation fold exposed along the eastern and western walls of the Monte Netto mound (Fig. 12a), the fault tip propagation was more inhibited in the east, resulting in a more pronounced folding and tilting of the front-limb sector that, as a consequence, generated the observed progressive clockwise rotation of the Cava Danesi Loess section.
Tectonic model to explain the rotated ChRM declination record of the Cava Danesi Loess section. (a) Aerial view of the outcrop area and geological profiles along wall exposures showing the loess and fluvial/alluvial sediments affected by faulting, as described in detail in Livio et al. (Reference Livio, Berlusconi, Zerboni, Trombino, Sileo, Michetti, Rodnight and Spötl2014, Reference Livio, Ferrario, Frigerio, Zerboni and Michetti2020). (b) Modeling of Phase 1 of the deformation history of the Cava Danesi Loess section. The ChRM declination record from Figure 3c is transformed from depth to time according to the age model shown in Figure 10 and translated in order to attain 0° mean declination at either t = 11 ka (end of observed record; yellow line) or t = 0 (red line). This implies 0.43 ± 2.5°/ka of syndepositional clockwise rotation of the sequence ending anytime between 11 ka and modern times (gray area with question mark). The block diagram in (b) shows the fault kinematics considered responsible for the observed rotation. (c) Modeling of Phase 2 of the deformation history of the Cava Danesi Loess section. Sometime after 11 ka, the ChRM declination record experienced a rigid-body counterclockwise (ccw) rotation of 15–19° to attain the present-day geometry (green line, same as in Fig. 2c). Also depicted is a block diagram showing the fault kinematics during Phase 2. See text for discussion.
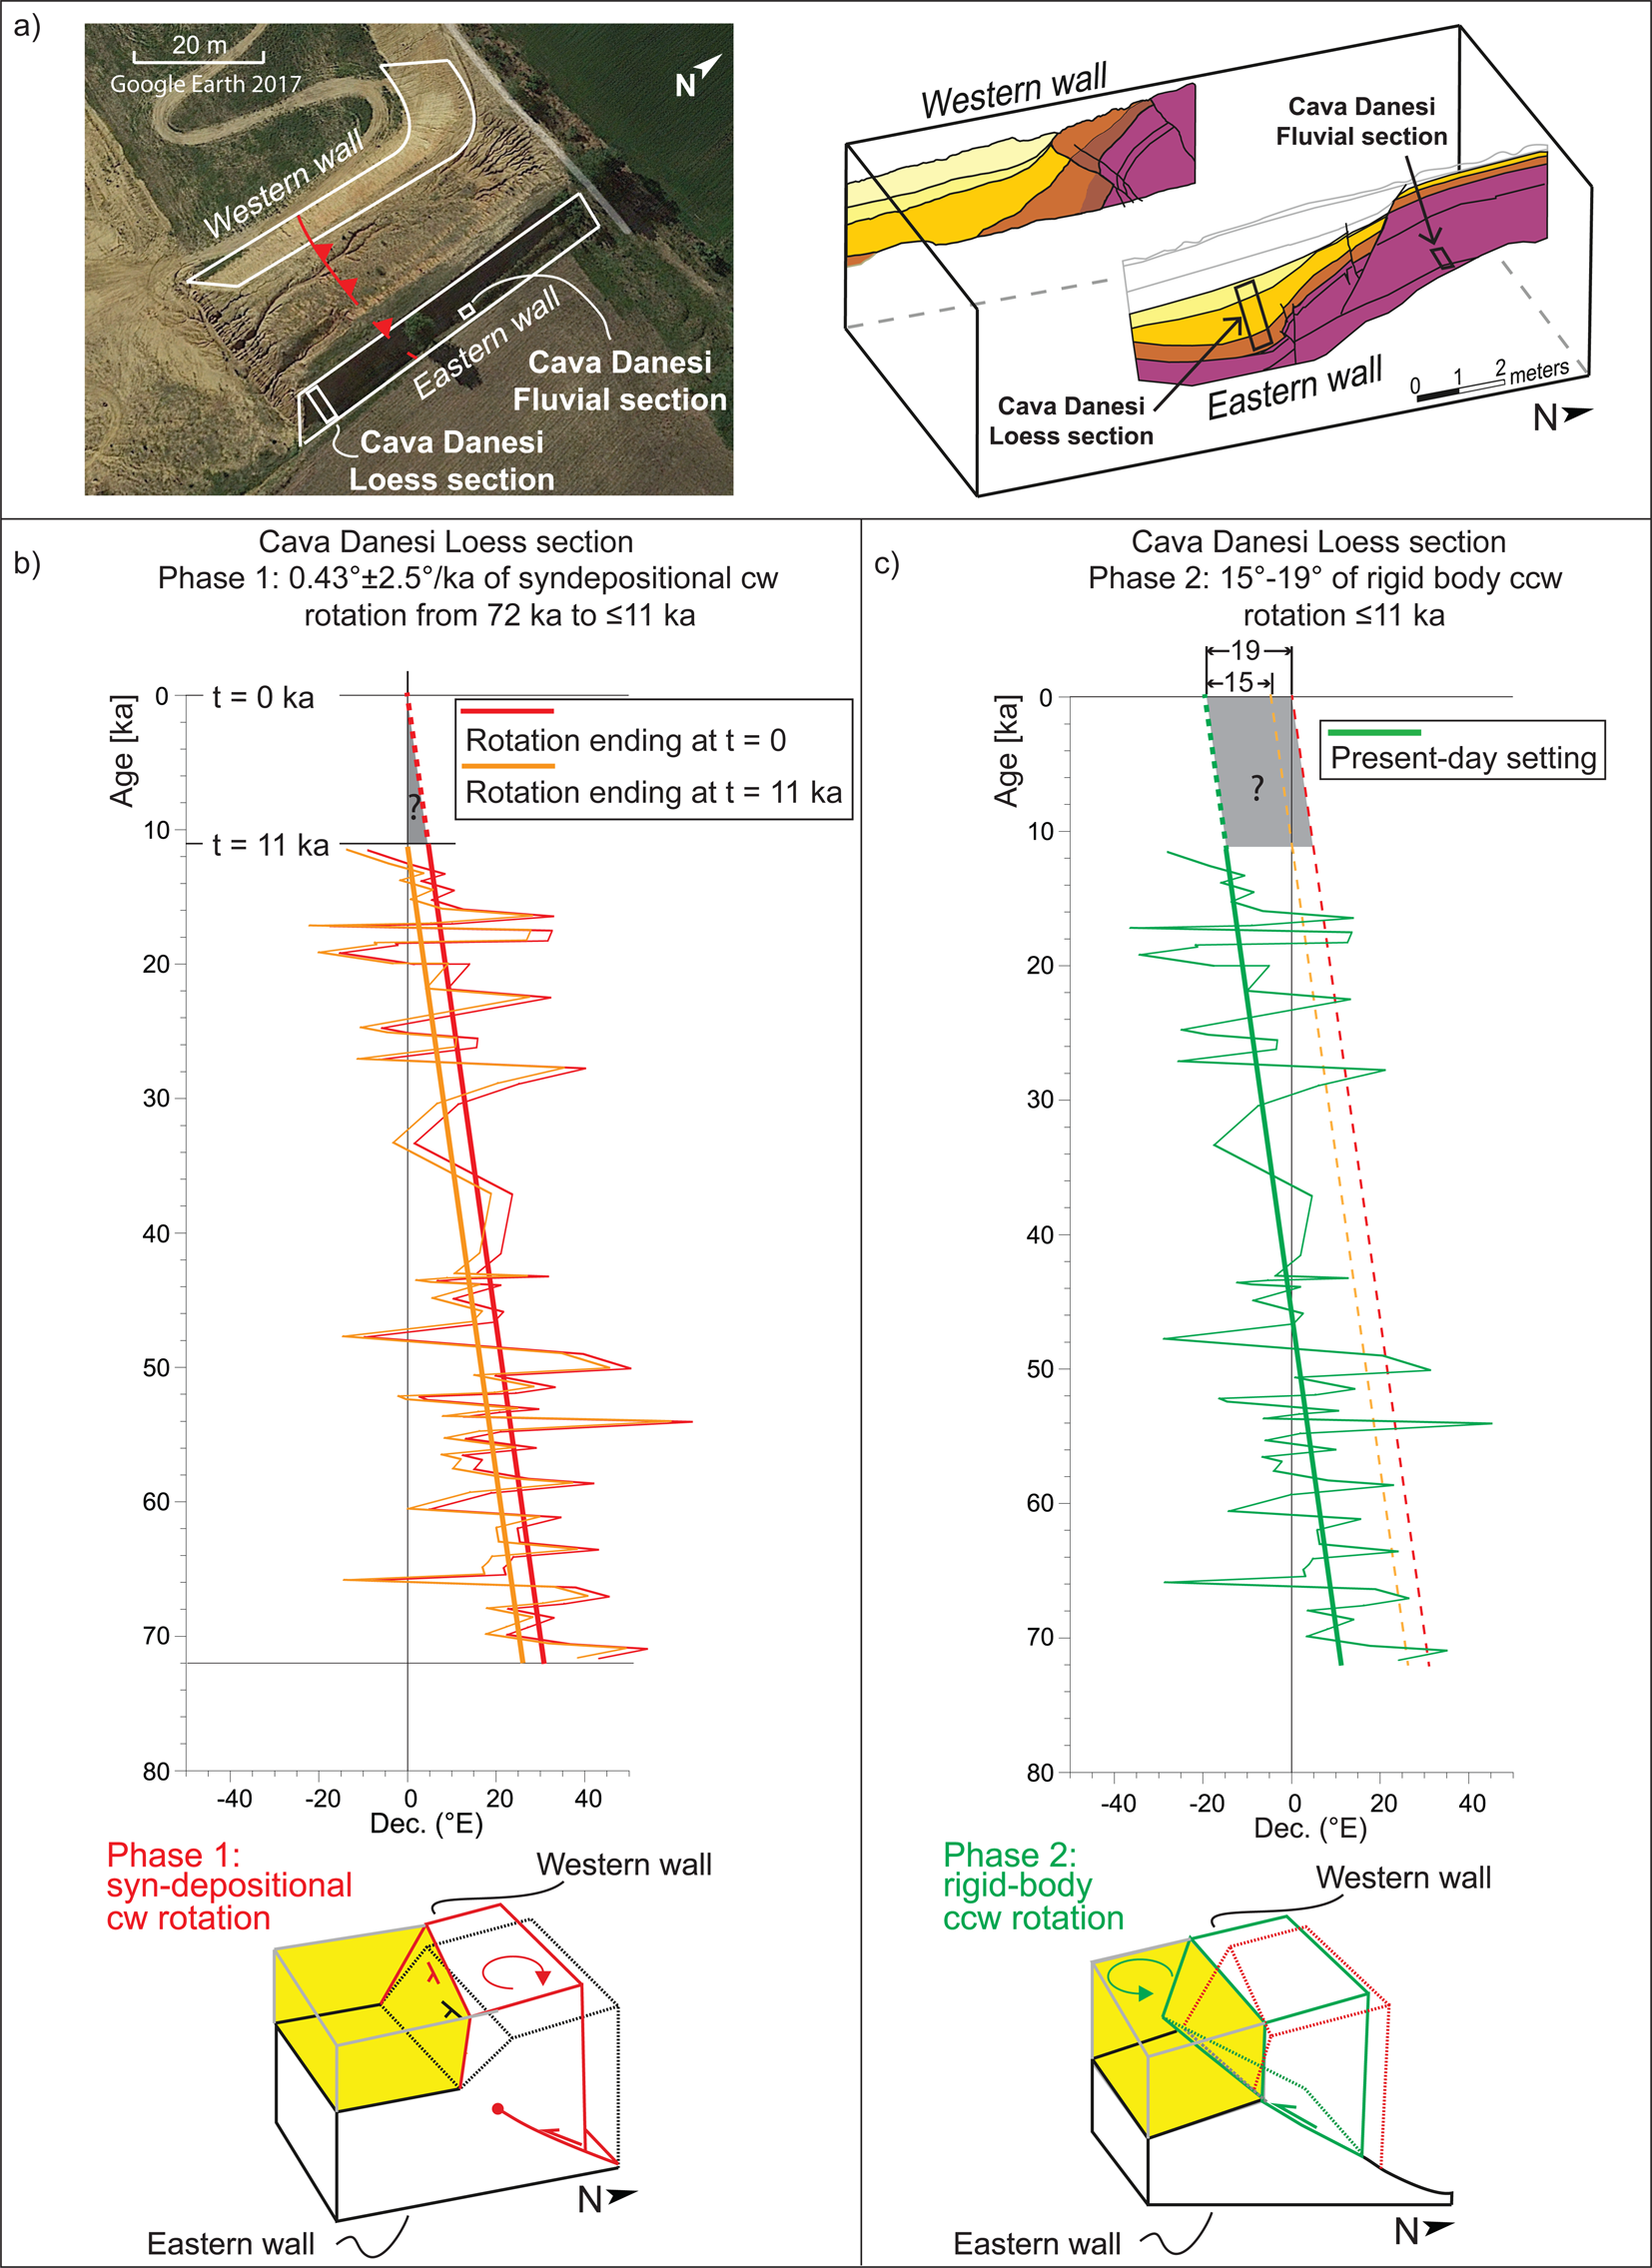
Subsequently, we have recorded a second phase of deformation resulting in a single pulse of rigid-body rotation of the entire Cava Danesi Loess section around a vertical axis to yield the actual configuration (Fig. 12c). This latter deformation phase could be associated with the surface emergence of the fault, to the west, while in the eastern sector fault tip propagation was still inhibited (Fig. 12c). The lack of distributed deformation from emergence of the fault onwards resulted in a more pronounced front advancement to the west, and, in turn, an anticlockwise cumulative rotation of 15–19° (Fig. 12c). According to the available record, this phase of rotation occurred after 11 ka. It is noteworthy that a similar age for the fault emergence was supposed by Livio et al. (Reference Livio, Ferrario, Frigerio, Zerboni and Michetti2020) based on the age constraints available at that time.
Alternative mechanisms to explain the Cava Danesi Loess declination record involving deeper deformation and rotation (e.g., due to the deep Capriano del Colle Backthrust) are excluded, so far, by considering that the Cava Danesi Fluvial section, as well as the other fluvial sections from the Monte Netto stratigraphy (Top Colle, Salita, Cascina Braga, Cascina Santus), located outside the expected deformation zone of the shallow fault-propagation fold, appear non-rotated.
CONCLUSIONS
We used magnetostratigraphy in conjunction with PSV analysis to interpret quantitatively the Pleistocene tectono-stratigraphic evolution of the Monte Netto hillock—a seismically active structure in the anthropized and vulnerable Po Plain of northern Italy. Our analysis allowed us to reach six main conclusions: (1) The Monte Netto stratigraphy contains a record of the Brunhes-Matuyama boundary and the top of the Jaramillo that can be correlated to coeval records previously recognized in drill cores from the surrounding undeformed plain. (2) According to these correlations, the Monte Netto structure has been uplifting relative to the neighboring undeformed plain at a mean rate of 11.3 ± 1.5 cm/ka since the late Early Pleistocene. This local component of tectonic uplift is linked to the long-term activity of the Capriano del Colle Backthrust, located 2–3 km below the uplifted Monte Netto stratigraphy (Fig. 11). (3) Taking into account a previously recognized component of regional isostatic uplift of the northern Po Plain relative to sea level, we established that the Monte Netto structure has been uplifting relative to sea level at a mean rate of ~19.3 cm/ka since the late Early Pleistocene. (4) The loess sequence at the top of the Monte Netto structure contains a smoothed PSV record that is useful for modeling the sedimentation rate when correlated to the dated PSV record of Liu et al. (Reference Liu, Nowaczyk, Panovska, Korte and Arz2020) from the Black Sea. The loess was deposited from 11 ka to at least 72 ka. Notably, our PSV-based chronology of loess deposition is applicable in principle to other loess sequences from the Eurasian loess basin. (5) The Monte Netto PSV record also revealed that the loess sequence is affected by a complex history of recent rotational deformations. This is comprised of a first phase of clockwise rotation at a mean rate of 0.43°/ka between ca. 72 ka and ≤11 ka, and a subsequent phase of 15–19° counter-clockwise after 11 ka. Both rotational phases were linked to the activity of surface faulting, and modeled taking into account fault geometries and kinematics. (6) These data, in conjunction with the historical record of shallow crustal earthquakes (ISIDe Working Group, 2007), suggest that Monte Netto and similar tectonic structures from the Po Plain should be monitored for hazard prevention (Vanini et al., Reference Vanini, Corigliano, Faccioli, Figini, Luzi, Pacor and Paolucci2018).
Acknowledgments
We thank the Associate Editor, Jaime Urrutia Fucugauchi, and reviewers Augusto Rapalini and Manuel Calvo for very insightful comments that helped improve this manuscript. We also thank the municipality of Capriano del Colle and the Fornaci Laterizi Danesi S.p.A. for support and permission to access the site.
Financial Support
This research has been funded by Project CARG Geological Map of Italy, sheet Brescia 1: 50,000 (PI Gianluca Norini, CNR-IGAG). Additional financial support came from project CTE_NAZPR19AZERB_01 entrusted to AZ. Part of this study is supported by the Italian Ministry of Education, University and Research (MIUR), through the project ‘Dipartimenti di Eccellenza 2018–2022’ (DECC18_020_DIP) awarded to the Dipartimento di Scienze della Terra ‘A. Desio’ of the University of Milano.
Supplementary Material
The Supplementary Material for this article can be found at https://doi.org/10.1017/qua.2022.67


 Open access