


1. Introduction
1.1. Background
Rapid urbanisation continues to intensify demand for efficient, low-emission transport within cities (International Energy Agency, 2024). As part of broader sustainability and decarbonisation strategies, micromobility solutions such as electric scooters have become a common transport mode for short commuting trips and for integration with public transport (Reference Ferguson and SanguinettiFerguson & Sanguinetti, 2021; Reference Oeschger, Caulfield and CarrollOeschger et al., 2023). However, the rapid adoption of this mode of transportation has highlighted challenges in implementing and enforcing regulations that promote the safety of micromobility users while minimising the negative impacts on micromobility ridership (Reference Bozzi and AguileraBozzi & Aguilera, 2021; Reference Lo, Mintrom, Robinson and ThomasLo et al., 2020). In response to the influx in e-scooters, some cities have banned free-floating electric-scooter companies from operating in certain areas, aiming to reduce the occurrence of incidents relating to the incorrect parking of these devices (Reference Roig-Costa, Miralles-Guasch and MarquetRoig-Costa et al., 2024). Many e-scooter related injuries occur due to inadequate use of protective equipment including helmets and elbow/wrist guards, with speed being another variable of interest in relation to injury (Reference Singh, Jami, Geller, Granger, Geaney and AiyerSingh et al., 2022). Regulations that to limiting the performance of e-scooters have created the need for dynamometers to evaluate the performance of micromobility devices (Reference Muthaiah, Zagorski, Kress, Bartholomew, Helber, Andreatta and HeydingerMuthaiah et al., 2025). Design innovations such as “self-balancing” e-scooters have been developed to enhanced device stability and thus increase user safety when using these devices (Reference Gulino, Papini, Zonfrillo, Unger, Miklis and VangiGulino et al., 2025).
Despite these regulatory and safety challenges, electric scooters offer many benefits including reduced congestion, potential reductions in greenhouse gas emissions and minimal infrastructure requirements compared with private vehicles (Reference Ferguson and SanguinettiFerguson & Sanguinetti, 2021; Reference Mitropoulos, Stavropoulou, Tzouras, Karolemeas and KepaptsoglouMitropoulos et al., 2023). Micromobility has been described as a low-carbon, sustainable, and transformational mode of transportation in urban areas (Reference Abduljabbar, Liyanage and DiaAbduljabbar et al., 2021). As such, in Canada and the USA, from 2019 to 2022 there have been between 35 and 88 million e-scooter trips completed each year (National Association of City Transportation Officials, 2024). The huge number of trips completed by micromobility devices highlights an opportunity for improvements to the sustainability of micromobility devices improving their performance.
Tractive effort theory outlines that the tractive force (
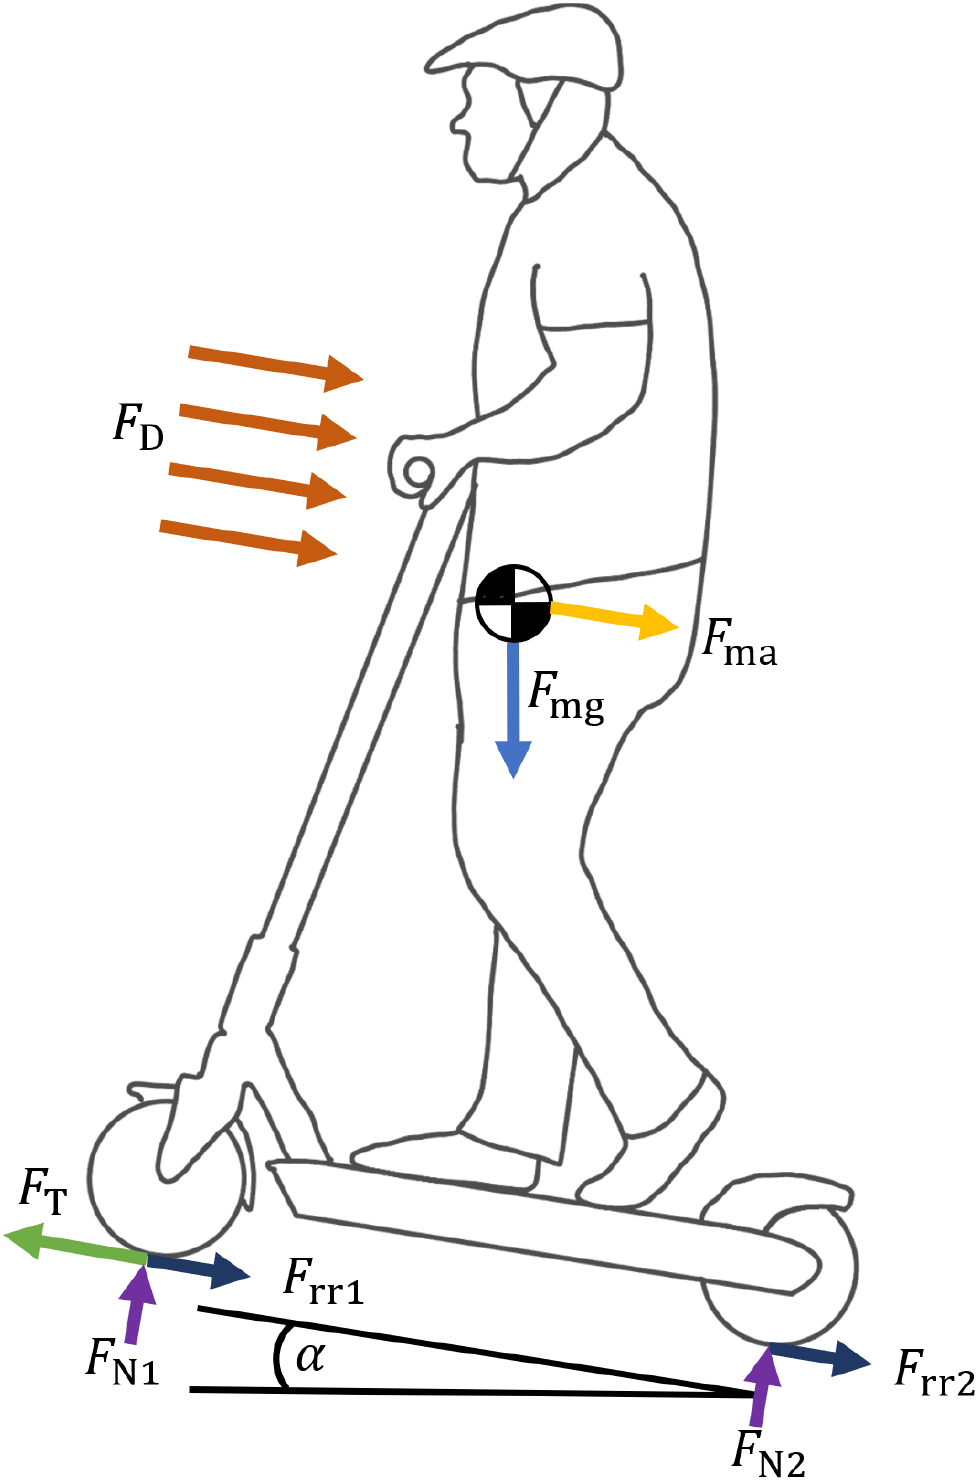
 ) of an e-scooter on an incline, as shown in Figure 1, can be determined using Equation 1.

Visualisation of forces on e-sooter and rider travelling up an incline

Figure 1 Long description
A diagram of the forces acting on an electric scooter and its rider traveling up an incline. The diagram shows a person riding an electric scooter up a slope. Various forces are labeled and indicated with arrows. The drag force (F_D) acts against the direction of motion. The gravitational force (F_mg) acts downward. The acceleration force (F_ma) acts horizontally in the direction of motion. The traction force (F_T) acts horizontally at the front wheel, and the rolling resistance forces (F_rr1 and F_rr2) act horizontally at the points of contact of the front and rear wheels with the ground. The normal forces (F_N1 and F_N2) act vertically upward at the points of contact of the front and rear wheels with the ground.
Equation 1 states that the tractive force is equal to the resistive forces of aerodynamic drag (
 ), the rolling resistance of each tyre (
 and
and
 , inertia (
 , and the incline force (
 . For completeness, the general relationship between the coefficient of rolling resistance (
 ), normal force (
 ) and rolling resistance force are outlined in Equation 2 (Reference LaClairLaClair, 2006).

At lower speeds when aerodynamic drag is reduced, energy losses from the rolling resistance of tyres are an important parameter to minimise to improve the overall efficiency of the vehicle. This is particularly important for vehicles that have limited battery capacity. Previous work has used coast down tests and a rolling resistance trailer to benchmark the performance of a range of pneumatic and non-pneumatic e-scooter tyres (Reference Stilwell, Gooch, Goodwin and ZarifehStilwell et al., 2023; Reference Stilwell, Gooch and LafitteStilwell et al., 2024). The results of these studies showed that the coefficient of rolling resistance for these tyres on painted concrete varied from 0.007 to 0.26 at a velocity of 6 km h⁻¹. The results also showed that specifications of the tyres, including dimensions and construction methods are not necessarily a good predictor of tyre performance in terms of rolling resistance.
In recent years, there have been several developments in non-pneumatic tyres (NPTs), which can offer significant advantages over traditional pneumatic tyres including puncture resistance, improved durability, reduced maintenance and environmental advantages achieved through improved rolling resistance and recyclability (Reference Deng, Wang, Shen, Gong and XiaoDeng et al., 2023; Reference Sardinha, Fátima Vaz, Ramos and ReisSardinha et al., 2023). Improvements to the capabilities of additive manufacturing have enabled many NPTs to be 3D printed using a range of materials and lattice structures including hexagonal honeycomb, gyroid and triply periodic minimal surface (TPMS) structures (Reference Sardinha, Pinto, Alves, Ramos, Reis and VazSardinha et al., 2025; Reference Shaikh, Saxena, Griffis, Shahed and ManogharanShaikh et al., 2024; Reference Tomé, Sardinha, Vaz and ReisTomé et al., 2025; Reference Wang, Yang, Lin, Gao, Liu, Lu and WangWang et al., 2020). Currently, no research has been completed to investigate the performance of 3D printed e-scooter tyres.
The objective of this study is to develop and evaluate novel non‑pneumatic e‑scooter tyres using a material‑extrusion (MEX) additive manufacturing process, commonly referred to as fused deposition modelling (FDM). This study will focus on the performance of e‑scooter tyres in terms of rolling resistance. Comparison will be made to existing e‑scooter tyres to provide useful insights into how MEX‑based 3D printing can be used to develop novel tyres for a range of applications including micromobility devices.
2. Methodology
2.1. Design process for 3D printed tyres
Figure 2 outlines an overview of the iterative process that was followed to develop novel 3D printed e-scooter tyres. Subsequent steps were only completed if the preceding step was achieved successfully. Computer Aided Designs (CAD) were made using nTopology (2025) software.
Design process used in tyre development

2.2. Vertical stiffness testing
The vertical stiffness of each tyre included in this study were evaluated using cyclic compression testing on the Instron ElectroPuls E3000 machine. Cyclic testing was completed using a 540 N load (an estimated maximum static tyre load) applied at a rate of 1 Hz. A minimum load of 20 N was used to ensure contact was maintained between the trye and the crosshead. The minimum and maximum loads were chosen to capture the full stiffness profile, from a near-zero load to slightly above the maximum load applied using the rolling resistance trailer (Section 2.3). Figure 3 shows the testing setup that was used for the vertical stiffness testing. To determine the vertical stiffness of each tyre, the results were processed using Python 3.13 to calculate the slope of a linear best‑fit line through the loading cycle.
Instron E300 MTS machine and annotated tyre vertical stiffness testing setup

2.3. Rolling resistance trailer, testing procedure and data processing
This study uses the same rolling resistance trailer and testing procedure as described in an earlier study that investigated the performance of nine publicly available e-scooter tyres (Reference Stilwell, Gooch and LafitteStilwell et al., 2024). Key details are included for clarity. Figure 4 shows an annotated description of the rolling resistance trailer.
Details of rolling resistance trailer components

As seen in Figure 4, the rolling resistance trailer is towed behind a Segway Ninebot F Series F40 Kick Scooter equipped with a remote desktop transmitter to enable the data from the calibrated 200 kg load cell (YZC-516C) to be recorded. Force data is recorded at 20Hz using a LabView software. Each tyre was tested using the required axle, rim and mass combination. In total, there are three axles that can be used to accommodate bearings with inner diameters of 10 mm, 11 mm, and 12 mm. A variety of added masses were used to ensure that the desired normal force was achieved for each test.
Consistent with the assumptions of previous studies that have investigated the rolling resistance of wheelchairs (Reference Bascou, Sauret, Lavaste and PilletBascou et al., 2017; Reference Vinet, Bernard, Ducomps, Selchow, Le Gallais and MicallefVinet et al., 1998), the testing methodology used in this study also assumes that the inertial and aerodynamic drag forces acting on the wheel and tyre are small and can be neglected during testing. Similarly, the resistance force from the wheel bearings is also considered to be negligible. These assumptions are appropriate provided that testing is completed at low speed. For this reason, testing was completed at a velocity of 6 km h⁻¹. Using these assumptions, the recorded towing force was assumed to be equivalent to the total tyre rolling resistance force (
 in Equation 2).
For this study, all tyres were tested on an indoor flat painted concrete surface. This controlled environment ensured that the impact of environmental conditions such as wind were controlled. Before data was recorded, the masses were added to the rolling resistance trailer to achieve the desired normal force (
 ). Total trailer masses of 20 kg, 40 kg, 60 kg, 80 kg and 100 kg were used for this study. These masses corresponded to normal forces (
 ) of 98.1 N, 196.1 N, 294.2 N, 392.3 N, and 490.3 N per tyre. As the load is applied centrally between the wheels, it is assumed to be shared equally by both tyres. Data was recorded over a 50 m distance. Each test was completed four times in each direction to improve the accuracy and repeatability of the results. As the trailer has two wheels, all tests were completed using a pair of the same tyre. The 3D‑printed tyres were tested at all trailer masses, while nine pneumatic and non‑pneumatic scooter tyres were tested only at 100 kg to enable comparison.
All the recorded data was processed using Microsoft Excel to determine the median towing force for the tyre and loading condition of interest. As there was some variation in the data due to the vibrations of the trailer, the median value was used to determine the towing force. Before the detailed analysis of the data was completed, obvious outliers were removed from the dataset. To estimate the coefficient of rolling resistance (
 ), Equation 2 was used with the data recorded using a total trailer mass of 100 kg.
2.4. Tyre design and 3D printing
When developing the designs for the 3D printed tyres, the reference scooter model was the Xiaomi Pro 2 electric scooter, which uses a relatively common 8.5 x 2 inch tyre. All tyre geometries were designed to fit a split rim variant of the Xiaomi wheel, as this configuration allowed for easier installation of future full-scale tyres while reducing the risk of damage during assembly. The tyre curvature profile was modelled to closely match that of the existing Xiaomi scooter tyres to ensure consistency, allowing the design focus to remain on the internal support structure of the tyre. Following the design process outlined in Figure 2, a number of lattice support structures were investigated including hexagonal honeycomb, gyroid and other TPMS structures. All CAD designs were generated using nTopology. For further detail of each of the designs, CAD models of each of the 3D printed tyres are available upon request. The design of the tread pattern of the tyre was not considered for this initial study.
The gyroid lattice, a triply periodic minimal surface (TPMS), was selected as the support structure for the initial prototypes because of its favourable structural characteristics, manufacturability (self-supporting), and the tunability of its geometric parameters. Its near-isotropic mechanical properties and smooth geometry, which minimise stress concentrations, made it a suitable candidate for further investigation. nTopology was used to create the 3D tyre gyroid model of Tyre J due to its capability to transform a solid body into a volumetric lattice structure using the volumetric lattice feature. This feature has a range of lattices to choose from, including the gyroid, and allows for the adjustment of the geometric parameters, such as unit cell size and volume density. Figure 5 outlines one of the design improvements that were made to the initial non-concentric gyroid lattice design.
Example of design changes made to early prototypes of Tyre J

To provide an option that would have the potential for fabrication using a common mass manufacturing method such as injection moulding, a two-dimensional (2D) lattice tyre design was developed. After reviewing existing literature, a hexagonal honeycomb structure was found to be an appropriate structure for bicycle sized NPTs, with good fatigue response and a high strength-to-weight ratio (Reference Sardinha, Pinto, Alves, Ramos, Reis and VazSardinha et al., 2025). Tyres K and L were generated using three concentric unit cells of the honeycomb structure. However, Tyre K was designed to have the honeycomb structure continue to the tread of the tyre. As there were concerns that the local deformation might impact the tyre performance, Tyre L was designed to have a square profile for the support structure, with a rubber outsole to be glued around the circumference of the tyre. This would allow only the rubber outsole to be replaced after the tyre was worn, rather than replacing the whole tyre. Figure 6 shows the CAD design and completed tyres.
3D printing has been recognised as an ideal method for the development and manufacture of NPTs (Reference Sun, Zhong, Qin, Xu, Yang, Zhang and LuSun et al., 2024). FDM printing was selected for tyre fabrication in this study due to its accessibility within the laboratory and its suitability for producing repeatable, controllable geometries for experimental evaluation. A Bambu X1E printer was used to manufacture the tyres as shown in Figure 7. It has a textured build plate for strong first layer adhesion and a closed compartment that maintains the temperature of the printing environment. A stainless steel, 0.4 mm nozzle was used.
All tyres were manufactured using PolyFlex 90A thermoplastic polyurethane (TPU) (
 = 30.0 ± 0.66MPa, 585% elongation). As TPU is hygroscopic, all filament was dried for 6 hours at 60°C using a Sunbeam DT6000 dehydrator to ensure high print quality. During printing, an eSun eBox Lite was used to keep the spool of TPU dry and at a maintained temperature. Printer settings were adjusted during early prototyping to maximise print quality. When printing the final tyres, a brim of 2 mm was used to increase the area in contact with the build plate to further increase the bonding strength. A layer height of 0.15 mm was selected for a balance between surface smoothness and print quality. Slow print speeds of ∼25 mm/s were used to prevent poor layer adhesion and filament jams. A retraction distance and speed of 0.4 mm and 30 mm/s was used. The nozzle temperature was kept at 230°C to ensure smooth flow without overheating. The bed temperature was kept at 35°C to ensure proper adhesion to the build plate without over-softening the TPU. To cool the samples, the part cooling fan, the auxiliary fan, and the chamber fan were set to 100%, 70%, and 70%, respectively.
CAD design and manufactured tyres (from left to right Tyre J, K, and L)

Bambu X1E 3D printer and inside view of completed honeycomb tyre (Tyre L)

2.5. Tyre selection
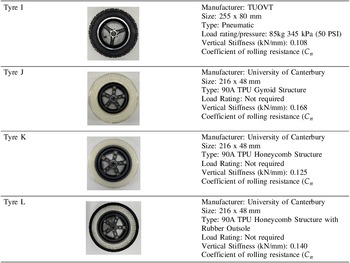
A total of 12 e-scooter tyres were tested in this study. This included both pneumatic and non-pneumatic tyres. Pneumatic tyres were inflated to their rated pressures. Key specifications are provided in Table 1.
3. Results
Following the iterative design process, quarter tyres were printed and tested. Based on benchmark testing of tyres A-H, lattice adjustments were made to achieve a vertical stiffness of 0.1-0.2 kN/mm. This vertical stiffness range was selected to ensure that the 3D‑printed tyres provided a similar feel for the rider to the other 8.5 × 2‑inch tyres included in this study. The full‑tyre results for vertical stiffness and the coefficient of rolling resistance are shown in Table 1 and Table 2, along with tyre specifications from the manufacturer. The coefficient of rolling resistance (
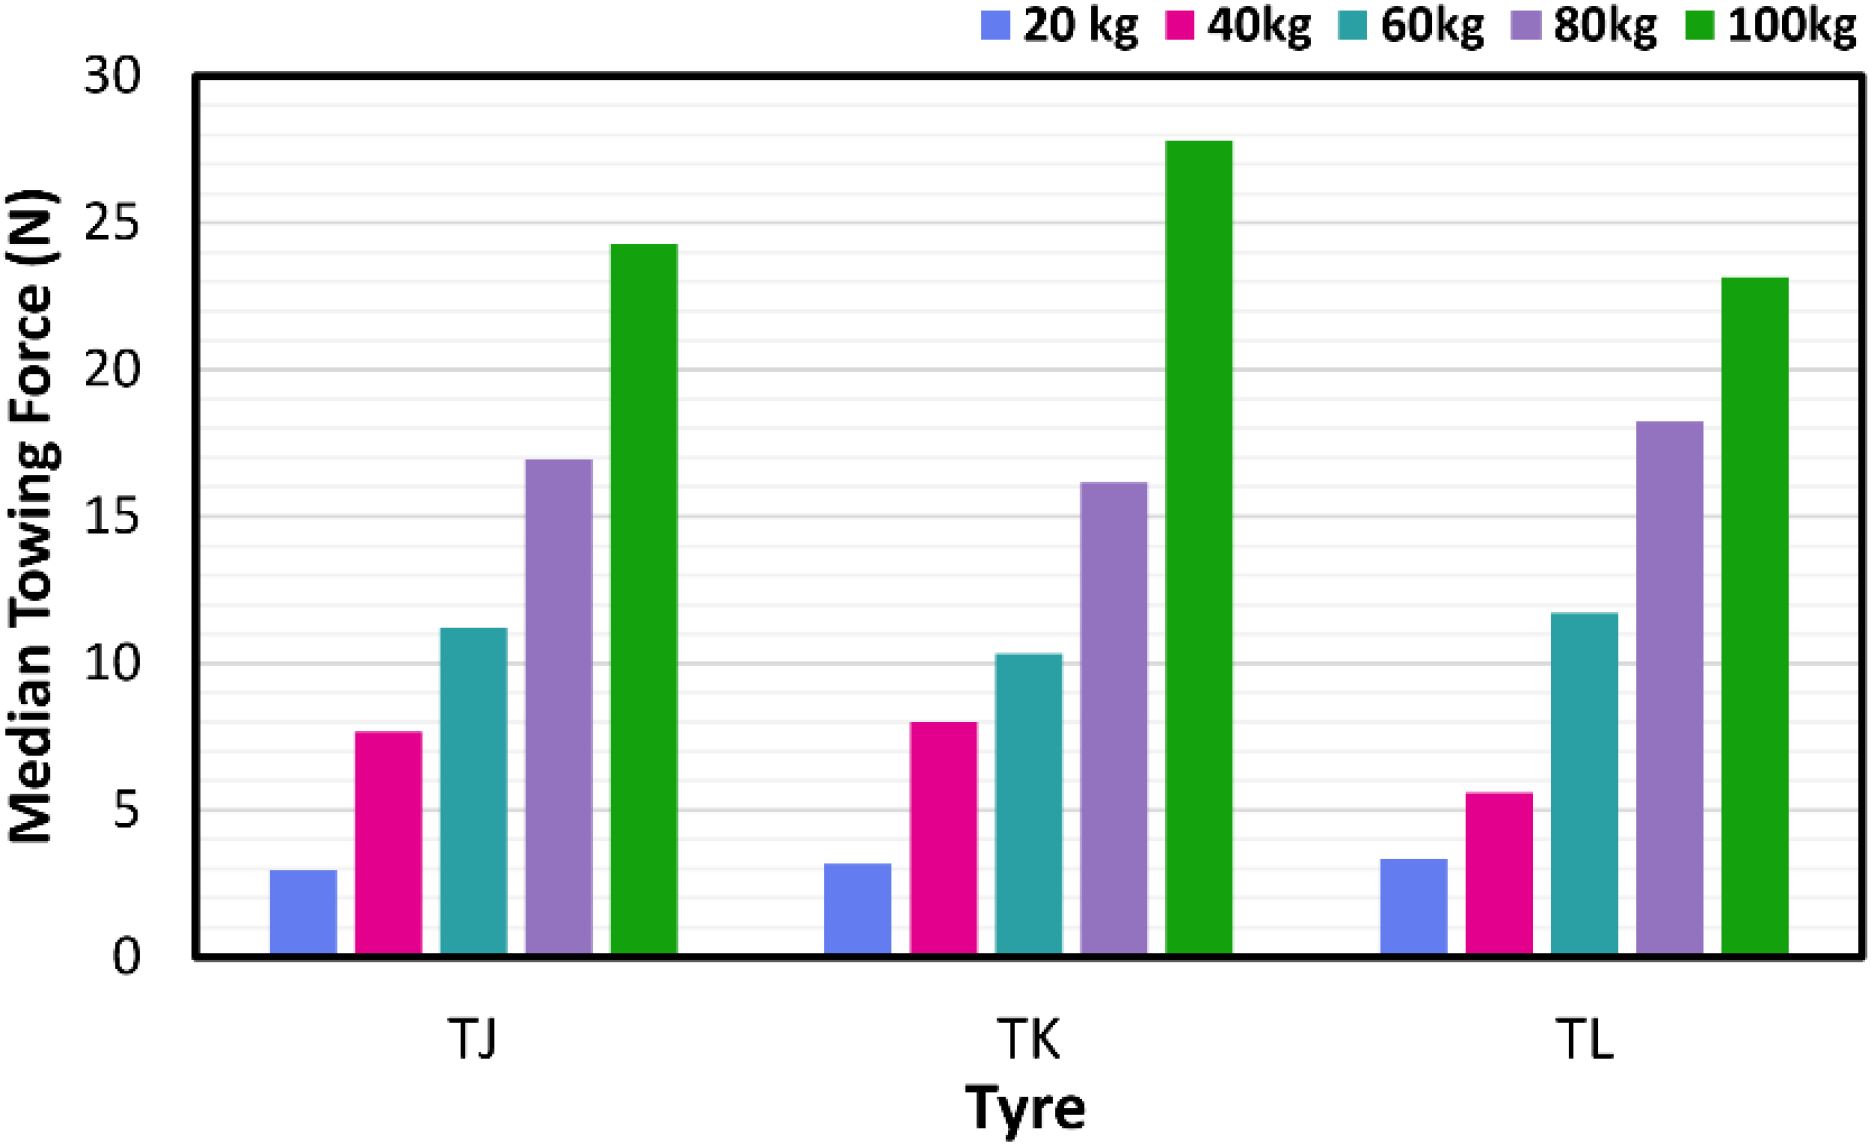
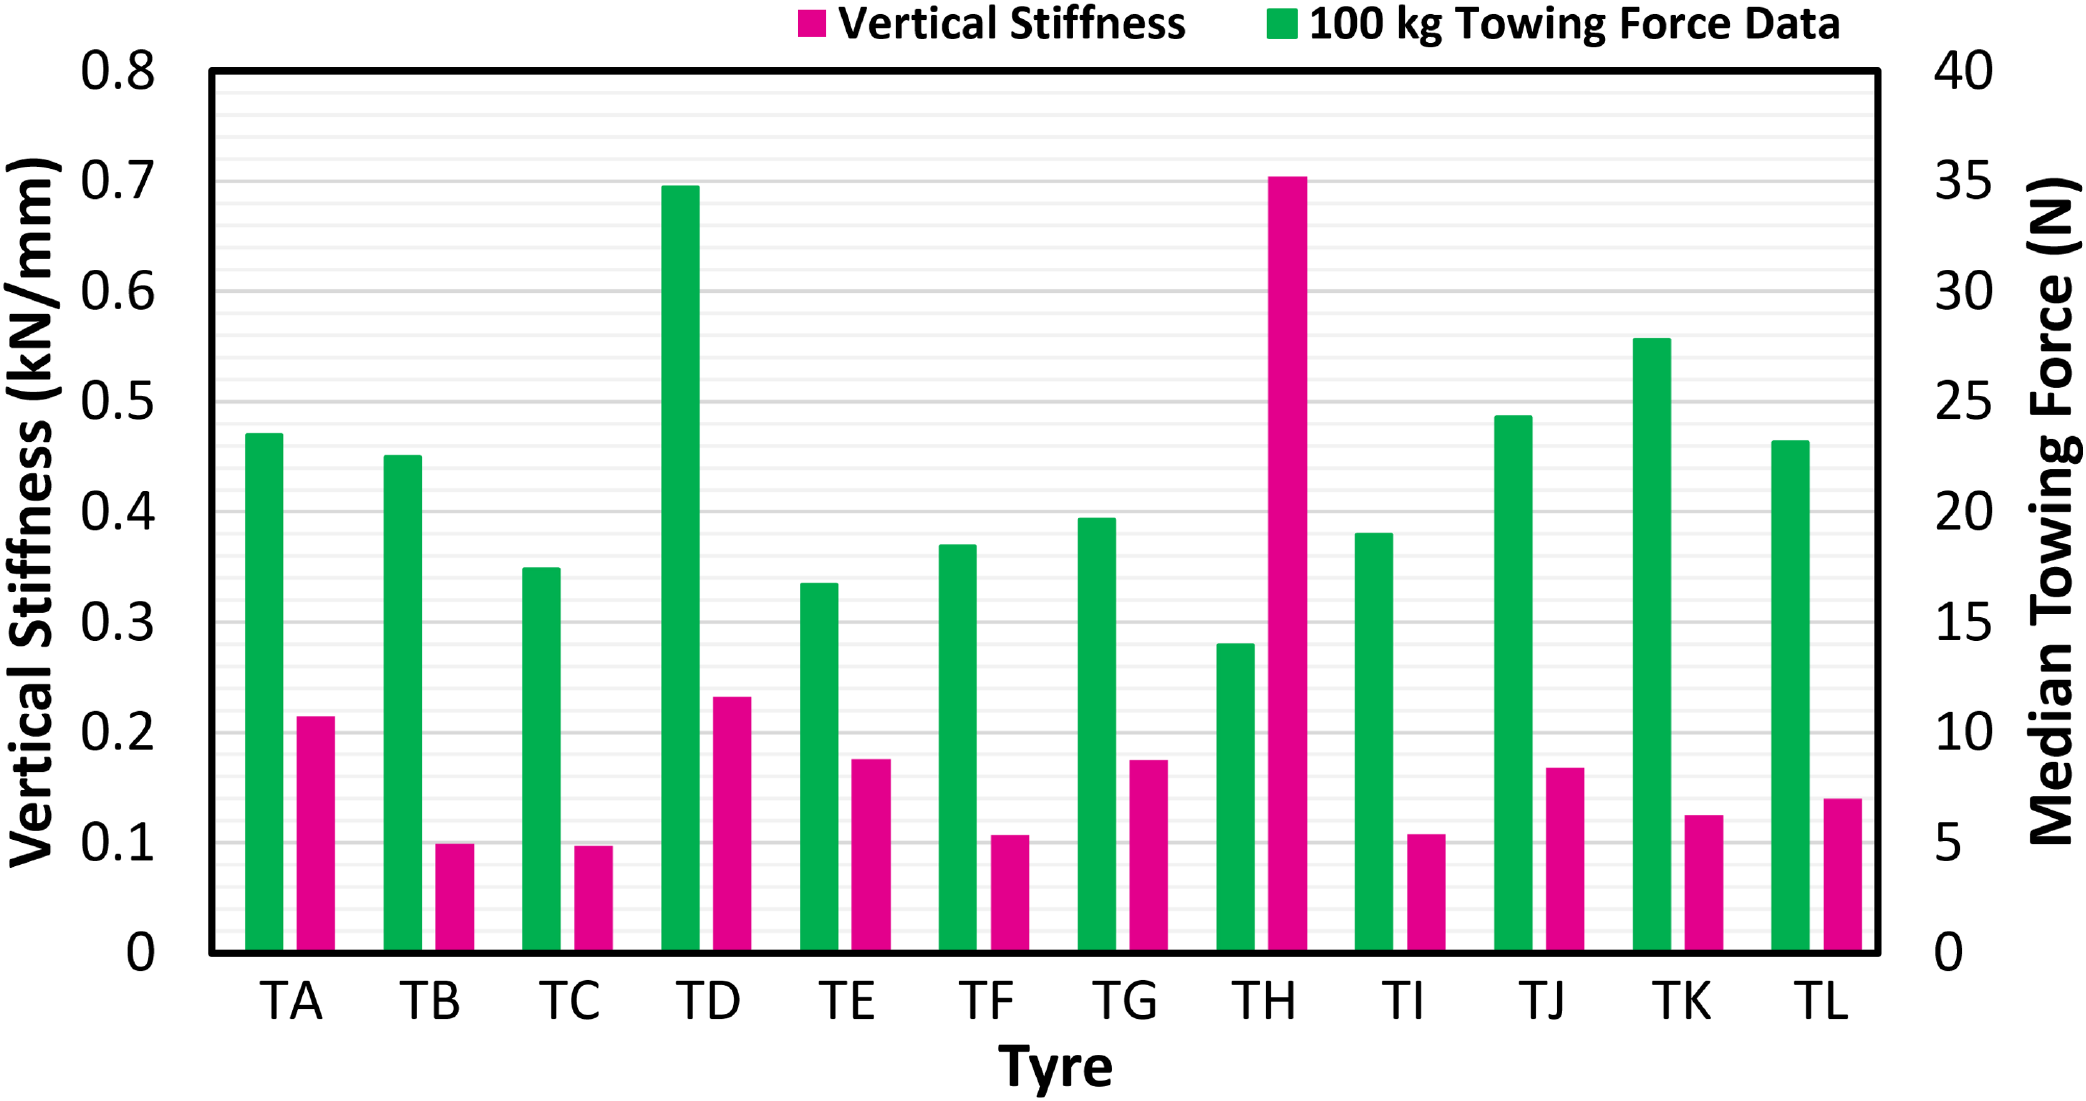
 ) was calculated using the 100 kg towing force data (a typical mass of a scooter and rider). The towing force results are shown in Figures 8 and 9. For clarity, the vertical stiffness values of each tyre have also been included in Figure 9.
Specifications and tyre performance of Tyre A - Tyre G

Table 1 Long description
The table compares specifications of eight different e-scooter tyres. It has three columns: Tyre Name, Photo, and Tyre Specifications. The table includes eight rows, each representing a different tyre. Row 1: Tyre Name: Tyre A, Photo: Image of Tyre A, Tyre Specifications: Manufacturer: MMG, Size: 216 x 51 mm (8.5 x 2 inch), Type: Solid/airless with honeycomb, Load rating: Not required, Vertical Stiffness (kN/mm): 0.215, Coefficient of rolling resistance (C_r). Row 2: Tyre Name: Tyre B, Photo: Image of Tyre B, Tyre Specifications: Manufacturer: WL, Size: 216 x 51 mm (8.5 x 2 inch), Type: Pneumatic, Load rating/pressure: 75 kg 340 kPa (50 PSI), Vertical Stiffness (kN/mm): 0.099, Coefficient of rolling resistance (C_r). Row 3: Tyre Name: Tyre C, Photo: Image of Tyre C, Tyre Specifications: Manufacturer: VSETT, Size: 216 x 76 mm (8.5 x 3 inch), Type: Pneumatic, Load rating/pressure: 65 kg 310 kPa (45 PSI), Vertical Stiffness (kN/mm): 0.097, Coefficient of rolling resistance (C_r). Row 4: Tyre Name: Tyre D, Photo: Image of Tyre D, Tyre Specifications: Manufacturer: Yida, Size: 200 x 50 mm, Type: Solid, Load rating: Not required, Vertical Stiffness (kN/mm): 0.232, Coefficient of rolling resistance (C_r). Row 5: Tyre Name: Tyre E, Photo: Image of Tyre E, Tyre Specifications: Manufacturer: Chuancheng, Size: 216 x 51 mm (8.5 x 2 inch), Type: Solid/airless with honeycomb, Load rating: Not required, Vertical Stiffness (kN/mm): 0.176, Coefficient of rolling resistance (C_r). Row 6: Tyre Name: Tyre F, Photo: Image of Tyre F, Tyre Specifications: Manufacturer: Yuan Xing, Size: 254 x 54 mm (10 x 2.125 inch), Type: Pneumatic, Load rating/pressure: 75 kg 350 kPa (50 PSI), Vertical Stiffness (kN/mm): 0.107, Coefficient of rolling resistance (C_r). Row 7: Tyre Name: Tyre G, Photo: Image of Tyre G, Tyre Specifications: Manufacturer: KTA, Size: 200 x 35 mm, Type: Solid/airless with honeycomb, Load rating: Not required, Vertical Stiffness (kN/mm): 0.175, Coefficient of rolling resistance (C_r). Row 8: Tyre Name: Tyre H, Photo: Image of Tyre H, Tyre Specifications: Manufacturer: For You, Size: 210 x 35 mm, Ply rating: Solid, Load rating: Not required, Vertical Stiffness (kN/mm): 0.704, Coefficient of rolling resistance (C_r).
Specifications and tyre performance of Tyre I - Tyre L

Median towing force of 3D printed tyres at all trailer masses

Vertical stiffness and median towing force of all tyres with a trailer mass of 100 kg

4. Discussion
The focus of this study was to develop and evaluate novel 3D printed non-pneumatic e-scooter tyres, and to compare their performance to existing tyres that are available on the market. The tyre performance data gathered with the rolling resistance trailer in Figures 8 and 9 showcase the comparable performance of the novel 3D printed tyres (Tyre J, K and L). As expected, Figure 8 shows that the towing force of the 3D printed tyres increased with normal force. Both the gyroid tyre (Tyre J) and honeycomb tyres (Tyre K and L) demonstrated rolling resistance values that were closely comparable to, or lower than four of those of the market tyres, two of which were pneumatic and two of which were non-pneumatic, indicating promising potential for 3D printed tyres. Interestingly, Tyre L was the best performing tyre of the 3D printed tyres that were tested, with a
 of 0.024, compared to the
 of 0.025 and 0.028 for Tyre J and Tyre K respectively. This is positive, as was designed with sustainability considerations by having a square support structure and a replaceable rubber outsole. Figure 9 shows that Tyre L slightly outperformed Tyre A, a common solid tyre replacement for Xiaomi scooters. This result highlights the potential for novel 3D printed tyres in the e-scooter tyre market.
The results in Tables 1 and 2 show the vertical stiffness and coefficient of rolling resistance for each tyre under a normal force of 490.3 N. However, stiffness was not directly correlated with rolling resistance. For example, Tyre D had comparable stiffness to many of the other tested tyres, yet required the largest towing force (Figure 9), indicating greater energy dissipation during loading and unloading. The coefficient of rolling resistance values varied from 0.014 for Tyre H to 0.028 for Tyre K, highlighting that tyre choice strongly influences rolling resistance, as described in Figure 1 and Equation 1. Although the stiffest tyre, Tyre G, has the smallest coefficient of rolling resistance, this result includes no consideration of rider comfort. It is interesting to note that the magnitude of the coefficient of rolling resistance reported in this study have increased when compared to previously reported values using a trailer mass of 80 kg (Reference Stilwell, Gooch and LafitteStilwell et al., 2024). This result suggests that the basic equation for the coefficient of rolling resistance may need to be further developed for e-scooter tyres, as the calculated values for the coefficient of rolling resistance in this study compared to previous work are not consistent with the strictly linear relationship outlined in Equation 2. Considerations may be required to account for a non-linear relationship between the applied normal force (
 ) and rolling resistance force (
 ), and to account for factors such as vehicle speed and tyre pressure (where applicable).
Overall, the results from this study provide insights into how the performance of 3D printed tyres compare to existing tyres on the market at a range of applied loads. The use of a Bambu X1E 3D printer was effective in enabling 3D CAD design to be printed and evaluated in situ using the rolling resistance trailer. The quality of the 3D prints will be aided by further improvements to 3D printers. Future work should aim to expand on this work through completing further evaluation of the long-term performance, cost and durability of the 3D printed tyres. Following this, further design developments are required to optimise the design though investigating the impact of different tread patterns on these tyres. The results from the compression testing could also be expanded to better understand the hysteresis profile of each tyre. This information would enable useful insights into the amount of energy that is lost when the tyre is loaded and unloaded. Improvements to this aspect of the 3D printed tyres would enable improvements to the energy efficiency of these tyres.
5. Conclusion
This study has presented tyre performance for a total of 12 e-scooter tyres of varying construction, including three novel 3D printed tyres made from 90A TPU. The results add to existing literature, through providing useful information about the vertical stiffness, coefficient of rolling resistance, and towing force values for a wide range of e-scooter tyres. The findings show that the 3D printed tyres can perform comparably to commercially available options, with Tyre L demonstrating performance similar to, but not clearly superior to, Tyre A, a tyre used on Xiaomi e-scooters. Future work should aim to further develop and evaluate the 3D printed tyres in this study, in terms of both cost and performance.
Acknowledgement
The authors acknowledge the technical assistance of Julian Phillips, Owen Kelly, and Dr Oscar Torres.



 Open access

