

Australia and other countries are devoting considerable resources to the abatement of enteric methane production by livestock. In the predominantly extensive pastoral production systems of Australia, the most practicable strategy may be that of exploiting observed differences in methane production within the ruminant populations(Reference Blaxter and Clapperton1–Reference Pinares-Patino, McEwan and Dodds3) through selective breeding. Lower methane yields (MY; g CH4/kg DM intake (DMI)) may arise due to one or more of the following factors: fermentation of less amounts of organic matter in the rumen; a shift in volatile fatty acid production towards alternative H+-utilising (propionate or reductive acetogenesis) pathways; an increase in the relative yield of microbial cells produced by fermentation(Reference Nolan4), which may potentially be affected by host-derived differences in rumen morphology and function.
Variation in the mean retention time (MRT) of rumen digesta affects the extent of degradation of organic matter in the rumen and the flow of undegraded microbial matter post-ruminally(Reference Okine, Mathison and Hardin5), and MRT has been implicated as a basis for between-animal differences in wool production(Reference Smuts, Meissner and Cronje6). It has also been demonstrated that alterations in retention time can cause marked differences in the efficiency of microbial synthesis in vitro (Reference Meng, Kerley and Ludden7), while more recently, in vivo studies have suggested that up to 40 % of the observed variation in methane production in sheep could be attributed to differences in mean rumen outflow(Reference Pinares-Patino, Uylatt and Lassey8). As such, we hypothesised that MRT may contribute to between-animal differences in methane production among animals fed a constant diet.
To test the hypothesis that differences in MY would be reflected in measurable differences in the rumen environment, MY together with the measures of whole-tract digestibility, the kinetics of rumen particulate and liquid digesta phases and rumen morphological parameters was measured in twenty mature ewes that differed in MY.
Materials and methods
All animal procedures were carried out by adhering to the Australian code of practice for the care and use of animals for scientific purposes, under the University of New England's ACEC approval number UNE 09/144.
Selection of sheep and measurement of methane emissions
Of the 705 ewes originally selected from the SheepGENOMICS flock(Reference White, Allingham and Gorman9) for the estimation of daily methane production (DMP) (J Goopy, unpublished results), DMP was subsequently measured in 160 ewes on three occasions using open-circuit calorimetry with measurements being taken from 1 to 7 months apart (the initial screening period), with all the measurements for any given ewe being taken over 1 week. During the measurement of DMP, the ewes consumed a ration of a 1:1 mix of lucerne and oaten chaff (885 g/kg DM; 167 g crude protein, 8·7 MJ metabolisable energy/kg DM; Manuka Feeds Private Limited) given at 120 % of the maintenance requirements (calculated as per the Standing Committee on Agriculture(10)). The sheep were ranked according to their average MY over the three 22 h chamber measurements, and ten high methane emitters (MY >1 sd above mean) and ten low methane emitters (MY >1 sd less than mean) were selected at the conclusion of the initial screening period for further measurement.
The selected (n 20) ewes were housed in individual pens and were allowed to adapt to ration and feeding levels that were the same as those outlined above for 14 d. During the adaptation period and experimental period, the ewes were fed daily at 08.00 hours with refusals being removed and recorded 1 h before feeding each day. At the conclusion of the adaptation period, DMP was measured over two periods of 22 h each, a total of four measurements (the measurement period) separated by 1 d. The measurements concluded at 08.00 hours each day, with 2 h being allocated for cleaning the chambers, unloading/loading the animals and calibrating the equipment. Thus, measurements were taken for all the ewes over the same 22 h. The measurement technique, including calibration, has been described in detail by Bird et al. (Reference Bird, Hegarty and Woodgate11). Briefly, DMP was calculated as chamber air flow multiplied by CH4 concentration in the chamber adjusted for CH4 concentration of the incoming air and temperature and atmospheric pressure in the chamber. The 22 h value was converted to DMP by multiplying by 24/22. Air flow though each chamber (mean = 98·8 litres/min) was measured using an AL800 dry gas meter (American Metering Company). The concentration of CH4 (parts per million per volume) was measured in the chamber incoming and exhaust air streams using an Innova 1312 Multigas Analyser (California Analytical Instruments) calibrated for CH4, CO2 and water vapour. Air temperature, relative humidity and absolute gas pressure were measured in one chamber using Easysense sensors (part nos. 1113201, 113220, 113264; Serrata Private Limited) and recorded using the Sensing Science Laboratory software (Data Harvest Group). Feed refusals were measured at the conclusion of each 22 h CH4 measurement period; the sheep were returned to their pens and fed. DMP was measured a second time, commencing 48 h after the start of the first measurement period.
The sheep were then dosed with markers for the study of digesta kinetics (below) and then returned to respiration chambers for two further 22 h measurements of DMP at the conclusion of the (6 d) digesta kinetics study. To account for occasions when the sheep did not consume all their feed on the day of measurement or on the preceding day (or both), MY was adjusted for feed intake in a manner similar to the iterative procedure described by Robinson et al (Reference Robinson, Bickell and Toovey12) for the adjustment of MY for variation in feed eaten in the respiration chamber and on the previous day. For these data, the best agreement between the observed and adjusted MY was from a weighting of 40 % of the intake on the previous day and 60 % of the intake in the chamber (R 2 0·75). All MY measures were calculated using the estimates of intake based on this 2 d weighted DMI.
Measurement of digestibility and digesta kinetics
After the first two measurements of DMP, a period of 6 d was used for the measurement of digesta kinetics (described below) and for the total collection of faeces and urine, before DMP was measured again (2 × 22 h), as done in the first measurement period. The rumen morphology of the sheep was then assessed using computer-aided tomography scanning. A schematic of the timing for these measurements is shown in Fig. 1.
Schematic of the programme in which emissions from sheep identified from the initial measurements of daily methane production to be of high and low methane yield (CH4g/d per kg DM intake) were measured repeatedly and measurements of digesta kinetics were obtained and the rumen of each sheep was scanned using computer-aided tomography (CT).
Measurement of digestibility and rumen kinetic parameters
The twenty ewes were held in metabolism crates and given feed as described above. Before placing the ewes in the metabolism crates, each ewe was dosed per os with a slurry containing neutral-detergent fibre prepared from the feed used in the study mordanted with Cr (5 g feed; total dose of Cr 211·8 mg) and with Co-EDTA (45 ml; total dose of Co 1235 mg)(Reference Udén, Colucci and Van Soest13). All faeces voided were collected, initially 8 h after dosing, then at 2 h intervals until 24 h, 4 h intervals until 72 h, then at 8 h intervals until 96 h, and then at 12 h intervals until 140 h after dosing. Total faeces were weighed, and a subsample from each collection point was taken and dried to a constant weight at 80°C and then stored at room temperature in sealed containers. The apparent digestibility of DM was calculated by subtracting the total faecal DM from the total DM of feed consumed over 6 d (DMI), and it is expressed as a percentage of DMI.
Analysis of chromium and cobalt
Faecal samples were subjected to a modified sealed chamber digestion in duplicate to remove organic matter(Reference Anderson and Henderson14). The concentrations of Co and Cr present in the faecal samples were determined using a Varian Vista Radial MPX Inductively Coupled Plasma Optical Emission Spectrometer under standard conditions, by reference to the calibration curve created from working standards.
Derivation of digesta kinetic parameters
A digesta kinetic model, consisting of particulate- and liquid-phase components similar to that described by Aharoni et al. (Reference Aharoni, Brosh and Holzer15) (Fig. 2), was simultaneously fitted using WinSAAM(Reference Stefanovski, Moate and Boston16) (Fig. 3). The model was iterated until the sums of squares for the entire model were minimised. The initial values of the parameters were estimated from the anticipated values for rumen pool size and outflow rate based on the literature and experience. All data points for faecal Cr and Co concentrations were assigned the same weight.
Model used to fit the concentration of the particulate fraction (pools P1, P2, P3, P4 and delay P3) and the liquid (soluble)-phase fraction (pools L1, L2, L3, L4 and delay L3) in the faeces following the administration of a bolus dose of chromium-mordanted feed containing neutral-detergent fibre and Co-EDTA into the rumen. The model was derived from that of Aharoni et al. (Reference Aharoni, Brosh and Holzer15). The model was simultaneously solved to generate a best fit to the observed concentrations of chromium and cobalt markers in the faeces. An example of the fitted curves is shown in Fig. 3. (A colour version of this figure can be found online at journals.cambridge.org/bjn)
Example output, from fitting a curve to the concentrations of chromium (○) and cobalt (●) to the model shown in Fig. 2. Symbols indicate actual data points and lines indicate the modelled fit.
The following parameters were estimated from the model shown in Fig. 2:
(1) the mass of the particulate fraction in the rumen (g) = P1+P2, where P1 and P2 are the estimated pool sizes (g);
(2) the MRT of the particulate fraction in the rumen (d) = [1/P(2,1)+1/P(3,2)], where P(2,1) and P(3,2) are the estimated rates of transfer (g/d) from pool P1 to pool P2 and pool P2 to pool P3, respectively;
(3) the MRT of the soluble (liquid) fraction in the rumen (d) = (1/L(2,1)+1/L(3,2), where L(2,1) and L(3,2) are the estimated rates of transfer (g/d) from pool L1 to pool L2 and pool L2 to pool L3, respectively.
Estimation of purine excretion
Urinary purine excretion is used as an index of rumen microbial protein production(Reference Chen, Chen and Franklin17). Urine that was excreted daily was collected in buckets placed under the metabolism crates to which 100 ml of 10 % (v/v) HCl were added. Each day at 1000 h, urine volume was recorded, and then the urine was diluted by being made up to a total volume of 3 litres, and then a 150 ml subsample was taken. The samples were stored at − 20°C until analysis, whereupon they were removed from the freezer and thawed at room temperature. Each ewe's (six) daily samples were aggregated for analysis by taking a 1 ml subsample from each day's collection. These samples were then dispensed into a 6 ml disposable test-tube and sonicated for 10 min, and then a 0·1 ml subsample was diluted to 1:20 with MilliQ® water before processing. The concentration of the purine derivative allantoin in the urine samples was measured as described by the International Atomic Energy Agency (IAEA)(Reference Makkar and Chen18) after Young & Conway(Reference Young and Conway19).
Estimation of reticulorumen volume and weight of contents using X-ray computer tomography
The volume and weight of the rumen and reticulum was estimated by X-ray computer tomography (CT) using methods described by Haynes et al. (Reference Haynes, Greenwood and Siddell20, Reference Haynes, Greenwood and McDonagh21). On the day of CT scanning, the ewes were not given their morning feed. The ewes were scanned live and without sedation using a Picker UltraZ 2000 CT scanner (Philips Medical Imaging Australia). The sheep were placed ventrally into a semi-cylindrical cradle, with their front and hind legs tucked underneath their abdomens. The sheep were restrained in the cradle and supported with foam pads. Each sheep was scanned with approximately 44 to 61 (depending on the size of the sheep) serial 5 mm cross-sectional images taken at 15 mm intervals, starting at the 3rd–4th thoracic vertebrae and finishing at the 1st–2nd caudal vertebrae.
To determine the volume and weight of the rumen and reticulum and contents (including both the atrium and ventral sac of the rumen), the CT images were individually edited to remove all other internal organs and digestive tract using the Apple open-source software program Osirix(Reference Rosset, Spadola and Ratib22). The resulting image files were reconstituted using Cavalieri's principle to derive the volume of the entire reticulorumen (volume-rendering algorithm native to Osirix(Reference Rabtib, Rosset and Heuberger23)). The weight of reticulorumen contents was estimated on the basis that the density of the contents was 1, using the computer Autocat(Reference Thompson and Kinghorn24).
Assessment of rumen content morphology
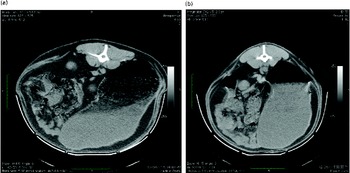
Differences in rumen content morphology observed during CT scanning were assessed for potential associations with differential MY production by panel comparison. A single full-depth image of the rumen contents of each sheep, taken at vertebra L2, was shown to panel participants (n 7). Each participant was asked to score each image on a scale of 1–5 based on the complexity of the rumen contents. A score of 5, typified by Fig. 4(a), indicated a large, diffuse area of foam with many gas pockets sitting on an often smaller liquid portion. A score of 1, typified by Fig. 4(b), displayed no area of foam or material of intermediate density. The images were displayed on an overhead screen for approximately 40 s each, twice, with the first pass provided for familiarisation only, with the participants being asked to rate each image on a scoring sheet. Comparisons between High- and Low-MY groups were made on the basis of the panel scores of the complexity of the rumen contents for each sheep.
Extremes of rumen fill morphology as visualised by computer-aided tomography. The sheep were assessed and scored by a panel each referring to the following examples : (a) score 5, very complex internal morphology through to (b) score 1, very simple internal morphology. (A colour version of this figure can be found online at journals.cambridge.org/bjn)
Statistical analysis
Differences between live weight, DM intake and MY in the two periods (before and during the measurement period described here) in high methane- and low methane-producing groups were determined using two-way ANOVA (Minitab version 14; Minitab®, Inc. www.minitab.com). Differences between the high methane- and low methane-producing groups for digestion, rumen size and flow-related traits were assessed using one-way ANOVA. Tukey's honestly significant different test was also used, with P< 0·05 being considered to be statistically significant. Results are reported as means and pooled sem values from the indicated number of samples used for each treatment analysis. The relationships between MY and flow of particulates and liquids from the rumen were determined with a simple linear regression analysis using Minitab version 14.
Results
MY remained significantly different between the Low- and High-MY groups (P= 0·001) on retesting after their initial selection. Although there was an interaction between testing period and group (P< 0·01), this most probably reflects a reversion to the mean of measurements. There was no difference in live weight and DMI between the groups across the periods (Table 1) or in apparent digestibility of DM between the groups (Table 2).
Live weight, DM intake (DMI) and methane yield (MY) (g/d per kg DMI) in the High (n 10) and Low (n 10) methane-emitting sheep measured during the initial screening and 1–7 months later (measurement period) (Least-squares means with their pooled standard errors)
a,b,cMean values within a column with unlike superscript letters were significantly different (P< 0·05).
DM digestibility and parameters of the rumen function of ewes selected on the basis of displaying high or low methane yield (MY; g CH4/d per kg DM intake (DMI)) (Mean values with their pooled standard errors)*
* Mean retention time and rumen contents/feed eaten were derived from faecal collection of sheep dosed with feed mordanted with Cr (particle-phase) and Co-EDTA (liquid-phase) markers. The estimates of pool sizes and fluxes between the pools were derived with WinSAAM using a two-pool model simplified from that described by Aharoni et al. (Reference Aharoni, Brosh and Holzer15) and shown in Fig. 2.
The Low-MY group displayed a shorter MRT for both particulate-phase (P= 0·002) and liquid-phase (P< 0·0001) digesta (Table 2). Linear regression indicated that the variation in MRT for the solid and liquid fractions accounted for 59 and 70 % of the variation in MY, respectively (Fig. 5).
Relationship between methane yield (MY; g CH4/kg DM intake (DMI)) and rumen mean retention time (MRT, d) of (a) particulate matter (MY = 8·6 × MRT+11·5, adjusted R 2 0·56) and (b) liquid (solute) phase (MY = 13 × MRT+11, adjusted R 2 0·69). Δ, High-MY group, ▲, Low-MY group. Slopes did not differ between the groups (P>0·05).
Low MY was associated with less amounts of particulate matter (g DM) in the rumen (P= 0·007). Total rumen DM pool size was a smaller fraction of food eaten in the Low-MY sheep compared with the High-MY sheep (P= 0·002). There was no difference in urinary allantoin excretion (an index of rumen microbial protein outflow) between the Low- and High-MY sheep (Table 2).
X-ray CT results indicated that the Low-MY sheep had smaller rumens (P= 0·048) and a trend towards less rumen contents (particulate plus liquid; P= 0·074) when compared with the High-MY sheep. There was no difference in the proportion of DM in the rumen (calculated as rumen particulate contents derived from the marker data/weight of rumen contents derived from CT scan data). The rumen content morphology score tended to differ between the groups (P= 0·10), suggesting that there may be a structural difference in the relationship among the solid, liquid and air phases of the rumen contents between high methane- and low methane-emitting sheep (Table 3).
Physical characteristics of ewes selected on the basis of displaying high or low methane yield (MY; g CH4/d per kg DM intake) (Mean values with their pooled standard errors)
* Rumen content weight, rumen volume and rumen gas space proportion were derived from computer tomography scanning of live sheep after an overnight fast.
† Rumen estimated DM% was derived from the weight of particles (estimated using Cr-mordanted feed and Co-EDTA markers (Table 2) expressed as a percentage of the weight of the rumen contents calculated from CT scan data).
‡ Rumen content complexity score is the mean of subjective assessments of the liquid/foam/air distribution in the rumen assessed from computer-aided tomography scans viewed by an untrained panel using a scale ranging from 1 to 5.
Discussion
DMP and, more recently, MY have been shown to have a low but significant heritability with distinct sire differences and so scope for genetic selection(Reference Pinares-Patino, McEwan and Dodds3, Reference Robinson, Goopy and Hegarty25, Reference Herd, Donoghue and Bird26). Due to MY being a complex trait and difficult to measure, discovering the mechanism(s) by which animal genotype affects MY may help in the identification of simpler characteristics that are indicative of MY. Genetic differences in bloat susceptibility among cattle(Reference Carruthers27) and in wool growth among sheep(Reference Smuts, Meissner and Cronje6) have been reported to be associated with differences in digesta retention time. Faster passage through the rumen will typically increase the outflow of microbial protein(Reference Smuts, Meissner and Cronje6, Reference Barnett, Goopy and McFarlane28) as evident in sheep selected for a superior fleece weight(Reference Kahn29), but this was not apparent in the present study where allantoin excretion was used as an indicator for the outflow of microbial protein from the rumen. The present study has shown that sheep phenotypically differing in MY also differ in the MRT of digesta fluid and particles, with Low-MY sheep also having less rumen contents. This is consistent with the findings reported by Barnett et al. (Reference Barnett, Goopy and McFarlane28), who demonstrated that a reduction in whole-tract MRT (induced by injections of triiodothyronine every second day) also reduced MY, identifying the possibility that blood triiodothyronine concentration may be a factor by which animal genotype affects MRT and so a possible indicator of MY.
The fact that the High- and Low-MY sheep did not differ in LW as mature ewes suggests that the overall nutrient supply to these sheep was similar during their lifetime, and the lack of differences in the apparent digestibility of DM suggests that any loss of fermentation capacity in the rumen was compensated for by increased post-ruminal digestion. Differences in digestion in both the foregut and hindgut may also exist between the High- and Low-MY sheep, but the present study is unable to shed light on them.
The significance of the observations on rumen content morphology is not yet obvious. The proportion of rumen (organ) volume as gas and the DM percentage of the rumen were not different between the High- and Low-MY sheep, but there was a tendency for the appearance of the rumen contents to differ between the High- and Low-MY sheep. Clauss et al. (Reference Clauss, Hume and Hummel30) have highlighted distinctive differences in rumen content morphology between moose and cattle, asserting that the latter are more efficient digesters and that this efficiency is linked to the ability to better ‘sort’ particulates. Although somewhat equivocal, the differences observed between the high methane- and low methane-emitting sheep in the present study may be attributable to the variation in the ability of individual sheep to sort and retain particulate matter. Rumen content morphology offers a promising avenue of enquiry, and we are attempting to develop a mathematical model and a sampling protocol to deal with the data in an objective manner. This will be used to further elucidate the observed differences in the appearance of rumen contents.
Enteric methane production is strongly related to DMI(Reference Blaxter and Clapperton1, Reference Kennedy and Charmley31), and intake itself is known to be a moderately heritable trait in grazing sheep(Reference Fogarty, Lee and Ingham32). Consequently, there are limits for extrapolating the results of the present study, where sheep were fed a fixed- and restricted-intake diet, to the free-range grazing situation in commercial sheep production. However, a shorter MRT in the Low-MY sheep could be expected to offer an advantage to sheep consuming low-digestibility pastures, as the shorter MRT observed in the present study could be expected to permit an increase in feed intake. Coupled with the unchanged digestibility of DM, this would result in a greater daily nutrient supply for absorption by Low-MY sheep compared with the High-MY sheep on pasture. While the level and proportions of ruminal and hindgut VFA were not assessed in the present study, other studies have typically found that a faster rate of passage (such as that which occurred in the Low-MY sheep) is associated with an increase in ruminal propionate molar percentage as well as increased efficiency of microbial cell synthesis(Reference Smuts, Meissner and Cronje6, Reference Barnett, Goopy and McFarlane28). It is possible that the total absorbable nutrients in the Low-MY sheep feeding ad libitum may not only be greater, but also contain a higher proportion of propionate in the VFA produced. Our data are also consistent and provide further corroboration for a model proposed by Janssen(Reference Janssen33), which posits a causal relationship between increased rumen outflow and washout and consequent decreased concentration of rumen methanogens and higher partial pressure of intra-ruminal H2, leading to an increased production of propionate. Given that rumen volume, fill and MRT appear to be strongly implicated in differential MY, it will be desirable in the future to determine whether these ruminal differences hold true for ad libitum diets. Investigations of the association between rumen content morphology and differential methane emissions were inconclusive but promising and warrant further investigation. To better establish the significance of the associations between rumen content morphology and MY, it will also be necessary to conduct CT scanning measurements more contemporaneously with methane measurements and also arrange for sequential CT scans over time to better establish the time dependence of variation in rumen content morphology.
With a view to achieving the abatement of enteric emissions from grazing sheep, an important finding of the present study was that the difference in MY between the groups persisted for up to 7 months in sheep that were initially chosen based on their measured divergence in MY. This is in agreement with the findings of a recent study(Reference Pinares-Patino, McEwan and Dodds3), but earlier studies in which small groups of low- and high-MY ruminants were chosen based on phenotype alone (with no knowledge of genotype) showed that the divergence in MY did not always persist over time or diet(Reference Goopy, Hegarty and Dobos2). This transience is consistent with non-genetic factors contributing most of the variation in MY as indicated by the low heritability for MY(Reference Pinares-Patino, McEwan and Dodds3, Reference Robinson, Goopy and Hegarty25) and indicates that changes in these environmental factors may mask the weak underlying influence of genotype. However, the persistence of the difference between the groups of sheep with regard to MY in the present study confirms that a level of genetic control exists over the rumen ecosystem that is adequate for use in selective breeding to deliver reduced MY on a flock or herd basis.
Acknowledgements
The present study was funded by Meat and Livestock Australia, The Co-operative Research Centre for Sheep Industry Innovation, NSW Department of Primary Industries and the Australian government's Climate Change Research Program. Meat and Livestock Australia, The Co-operative Research Centre for Sheep Industry Innovation, NSW Department of Primary Industries and the Australian government's Climate Change Research Program had no role in the design and analysis of the study or in the writing of this article.
J. P. G. was involved in the design, organisation and execution of the experiment and had primary responsibility for data processing, analysis of marker work and writing of the paper; A. D. carried out the experiment and was responsible for the laboratory analysis of samples for marker study and data recording and collation; R. H. and P. E. V. were programme leaders and made substantial contributions to the writing of the paper; F. H. analysed the computer-aided tomography scan data; M. B. was responsible for gut kinetics modelling; V. H. O. was involved in gut kinetics modelling and made substantial contribution to the writing of the paper.
None of the authors has any conflicts of interest to declare.


